Author Contributions
Conceptualization, A.M. and A.R.; methodology, J.S. and D.D.V.; validation, D.D.V. and A.M.; formal analysis, J.S., D.D.V.; investigation, J.S., D.D.V., A.M., C.L. and A.R.; resources, A.M., C.L. and A.R.; writing—original draft preparation, J.S. and C.L.; writing—review and editing, A.M., C.L. and A.R.; supervision, D.D.V., A.M., C.L. and A.R.; revision draft, A.M. All authors have read and agreed to the published version of the manuscript.
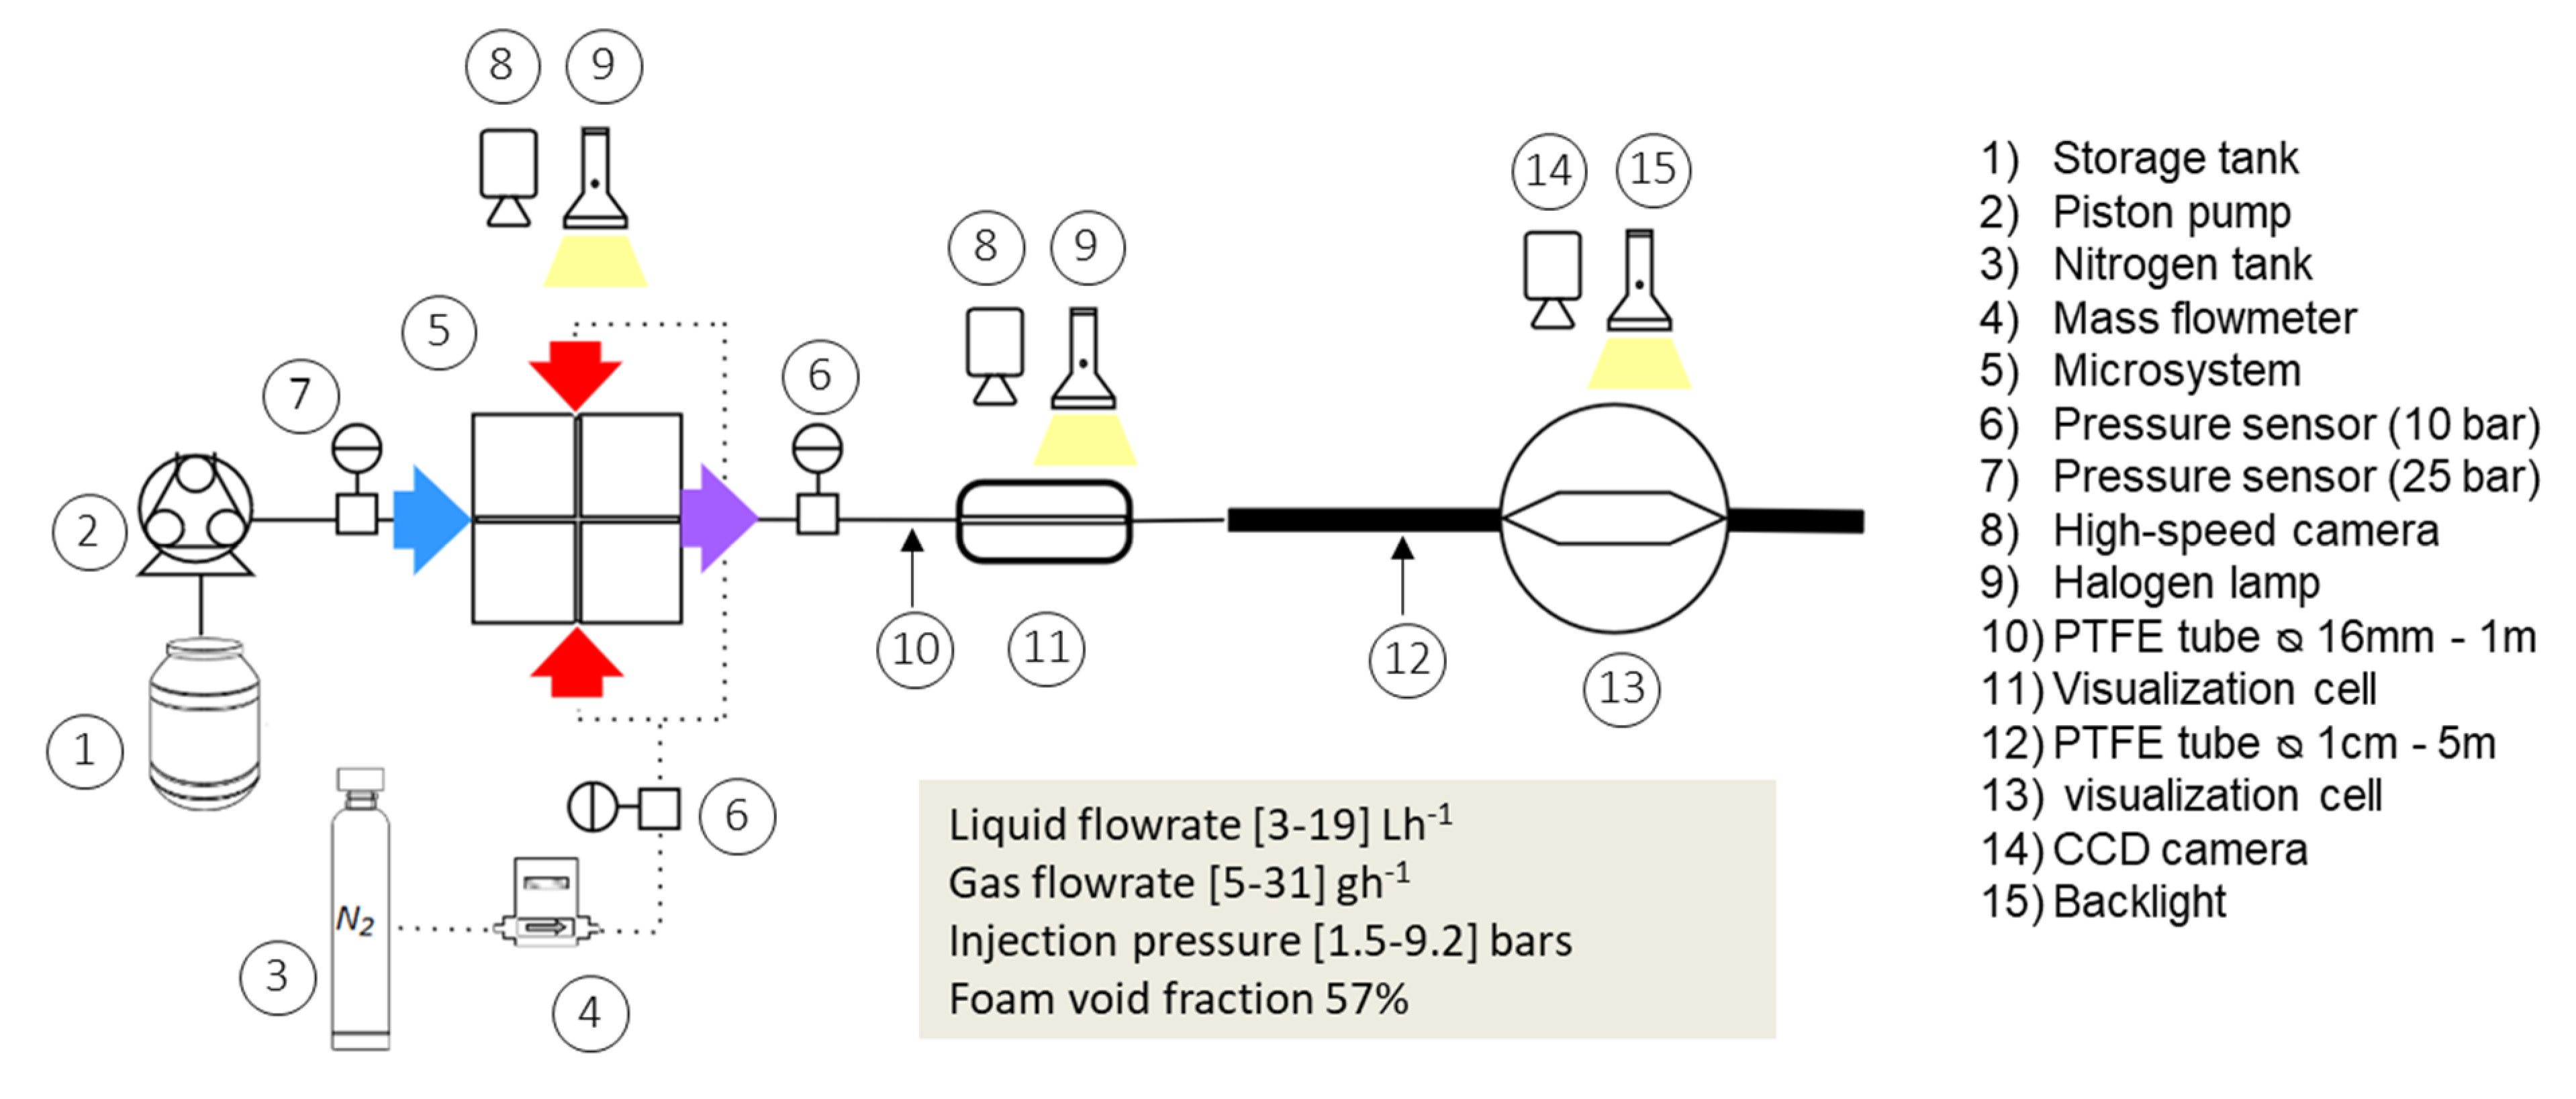
Figure 1.
Schematic representation of the experimental processing line.
Figure 1.
Schematic representation of the experimental processing line.
Figure 2.
Schematic representation of the microfluidic devices. (a) reference device (CX600). (b) device with the same cross-shaped configuration, but with an integrated expansion channel downstream from the mixing channel (CX-E-600). Liquid solution (L), N2 (G), and gas–liquid dispersions which turn into foam along the processing line (F).
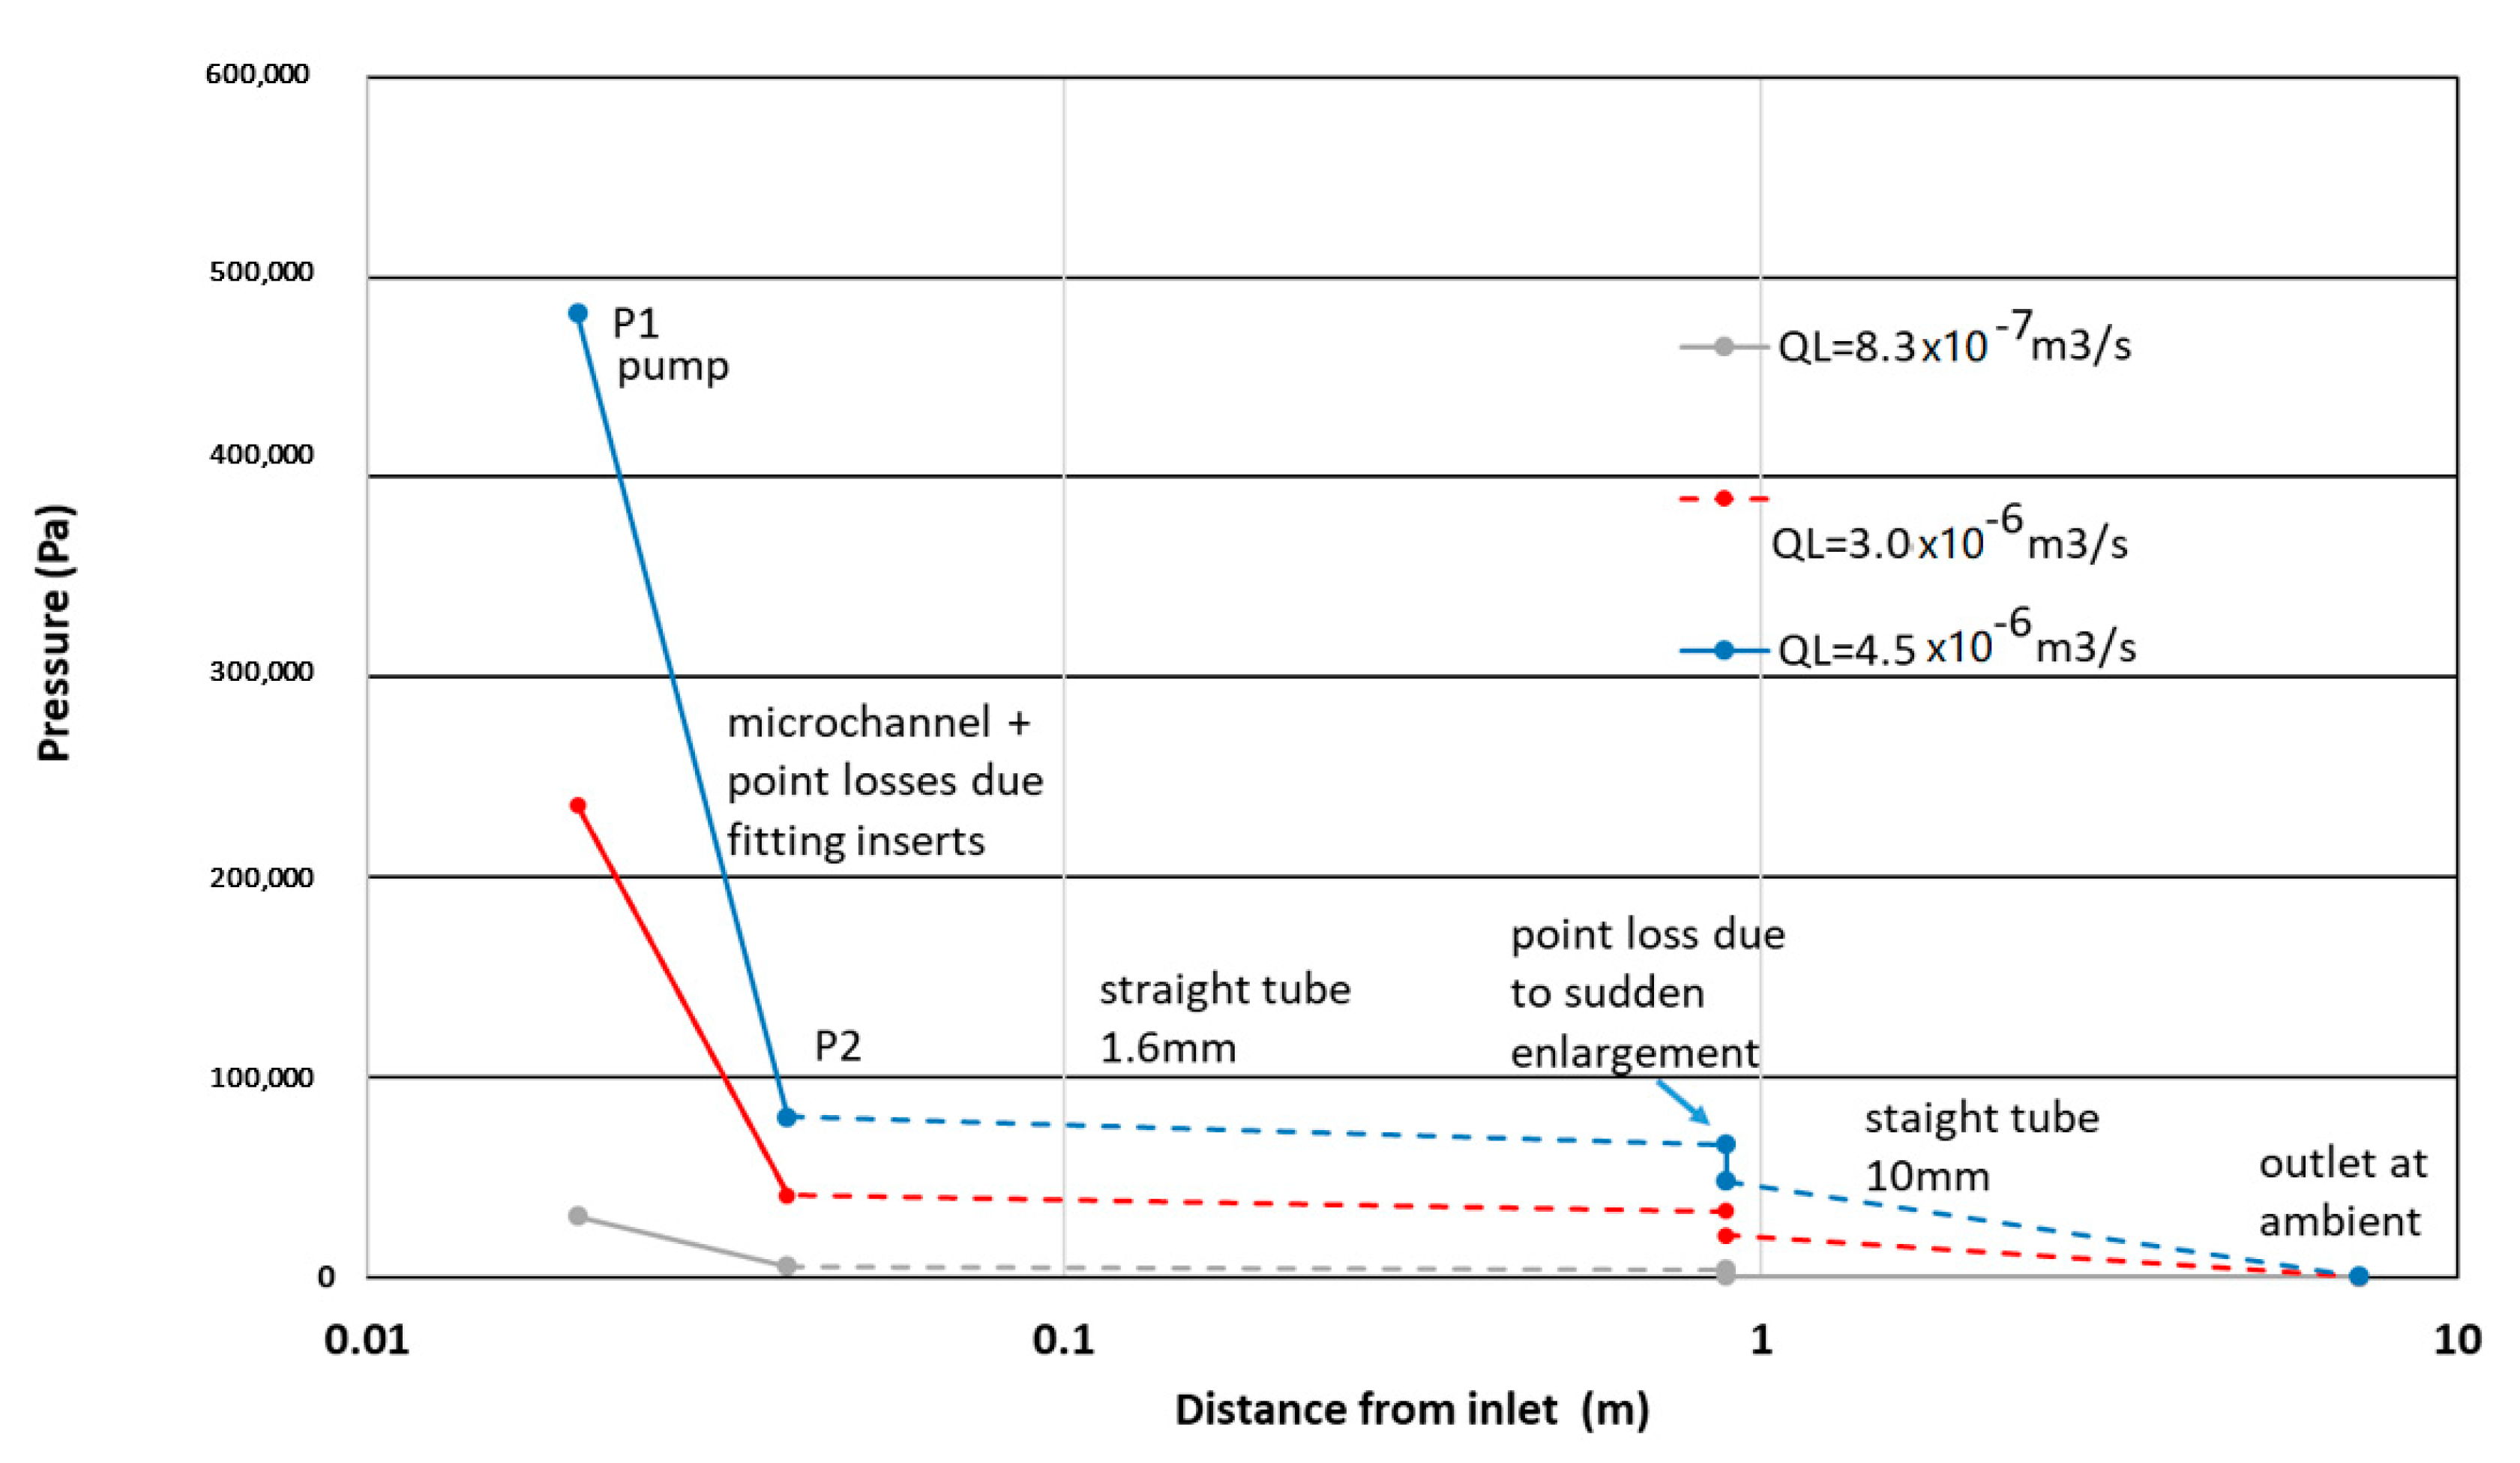
Figure 3.
Example of the profile of the relative pressure along the microchannel hydraulic loop for the WPI3XG04 solution and three different flowrates. The log scale presentation of the axial coordinate aims to show more clearly the important weight of the microchannel in the global pressure drop. The downstream pressure drop is shown as a dotted line, and it concerns the successive tubes of the relaxation line and is roughly evaluated.
Figure 4.
(
a) Visualization at the area of bubble formation (Zone A) in the channel 600 × 600 µm
2 of the device CX600. (
b–
e) Images at different process conditions: (
b) Q
vL = 11 L·h
−1 − Q
mG = 21.6 g·h
−1. (
c) Q
vL = 13.7 L·h
−1 − Q
mG = 26.5 g·h
−1. (
d) Q
vL = 16.4 L·h
−1 − Q
mG = 31 g·h
−1. (
e) Q
vL = 19 L·h
−1 − Q
mG = 36.4 g·h
−1; liquid phase: model solution WPI3XG04, gas phase N
2. Figure reproduced from [
22] with permission from Elsevier.
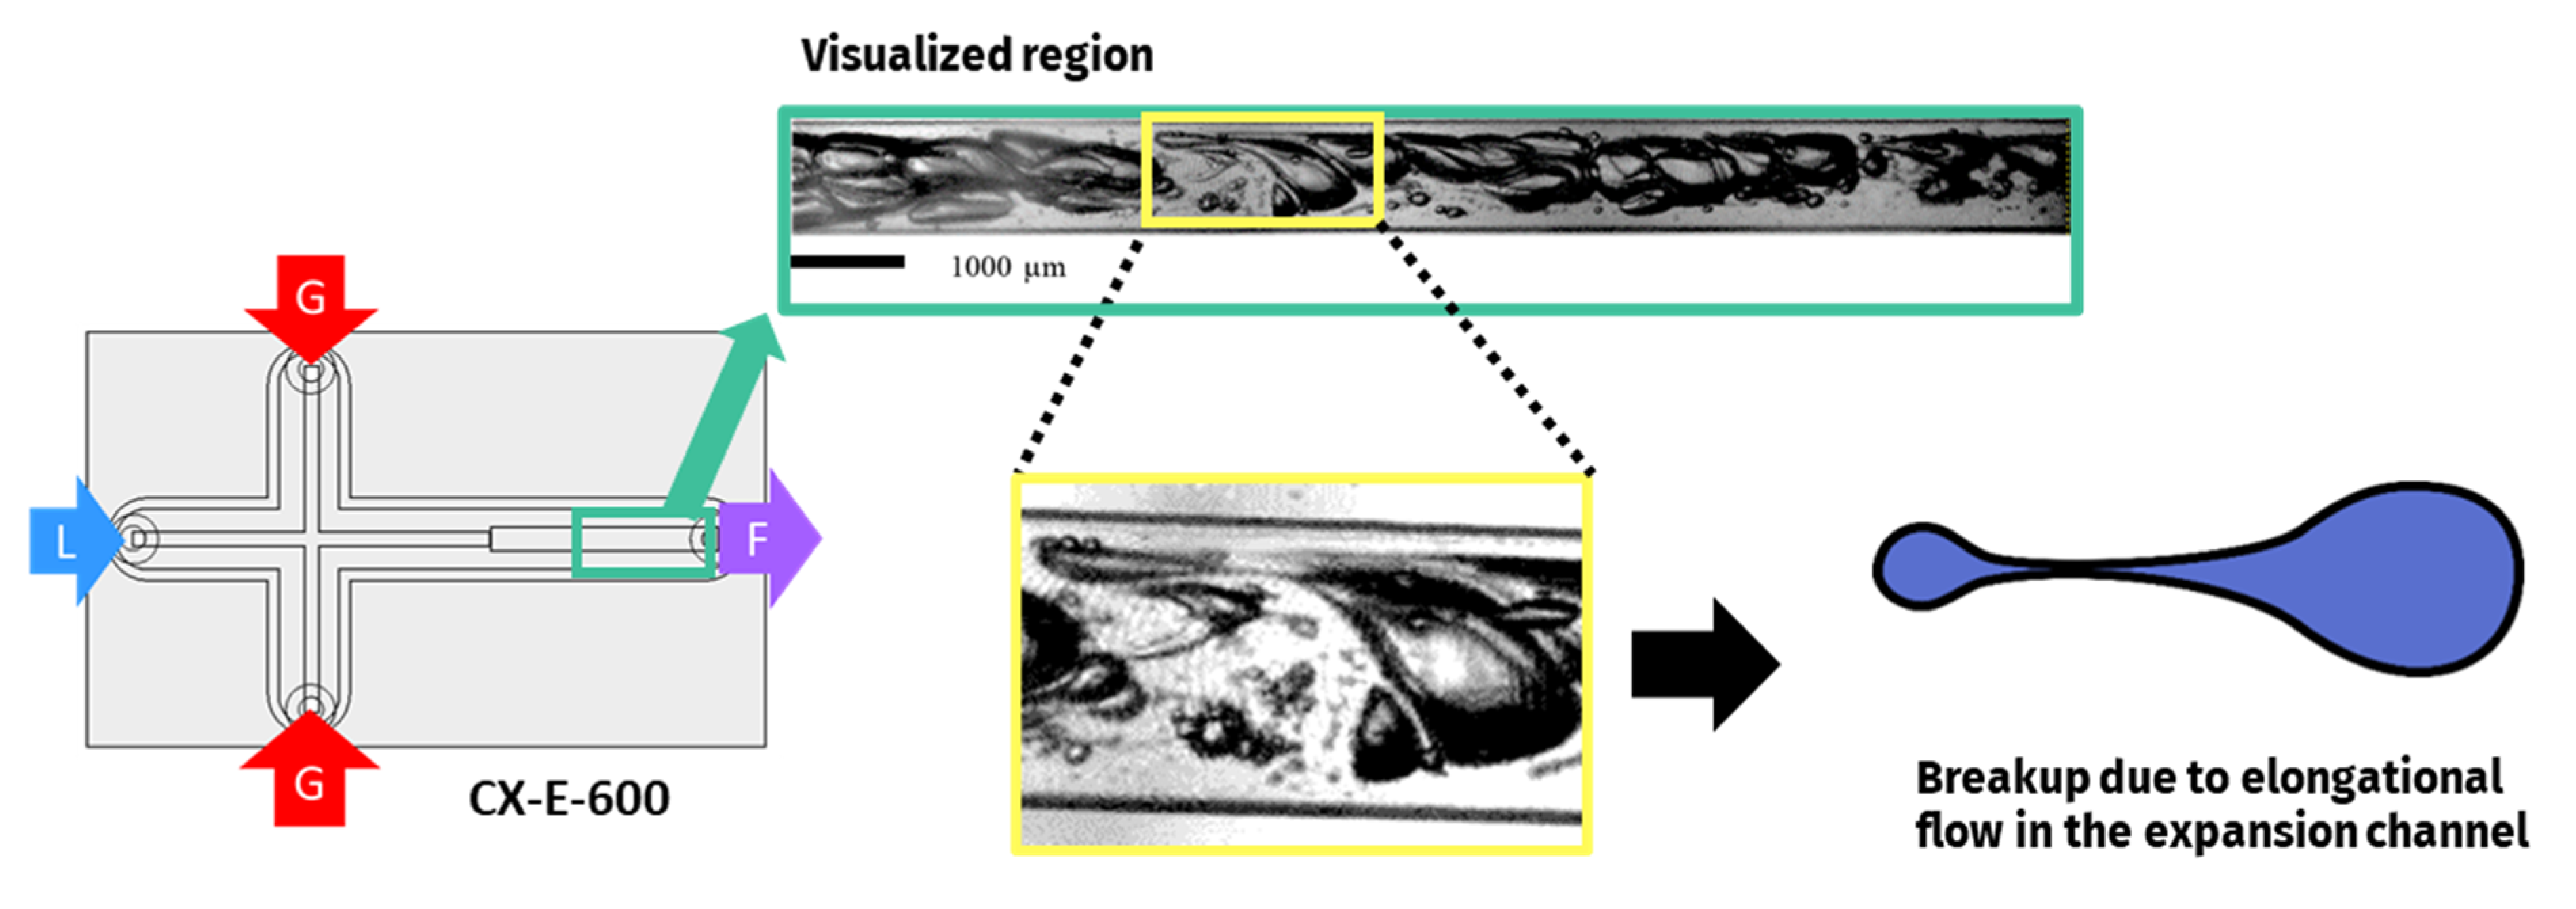
Figure 5.
Tip-streaming bubble breakup mechanism identified in the mixing channel of all devices. Visualizations with the device CX600 at a liquid flowrate of 11 L/h. Liquid phase: model solution WPI3XG04. Gas phase: N2. At the bottom left: enlarged view of a bubble and its schematic representation. In the photos, a filament (circled in green) is shown before and after its break-up into satellite droplets; an interval of 0.18 s had elapsed between the two pictures.
Figure 6.
Bubble binary breakup mechanisms identified for the two-phase flow in the expansion channel. Visualizations from device CX-E-600 at a liquid flowrate of 3 L/h. Liquid phase: model solution WPI3XG04. Gas phase: N2. Adapted from [
22] with permission from Elsevier.
Figure 6.
Bubble binary breakup mechanisms identified for the two-phase flow in the expansion channel. Visualizations from device CX-E-600 at a liquid flowrate of 3 L/h. Liquid phase: model solution WPI3XG04. Gas phase: N2. Adapted from [
22] with permission from Elsevier.
Figure 7.
Cumulative volume distribution of bubbles using the model solution WPI3XG04 and the microsystem CX600 at Q
vL= 11 L·h
−1, Q
mG = 21.6 g·h
−1, P
inj = 3.83 bar. Size distribution of bubbles inside the microfluidic device (triangles) and in the end product (squares). The diameters of bubbles inside the microchannels are normalized to the atmospheric pressure (outlet pressure). Adapted from [
22] with permission from Elsevier.
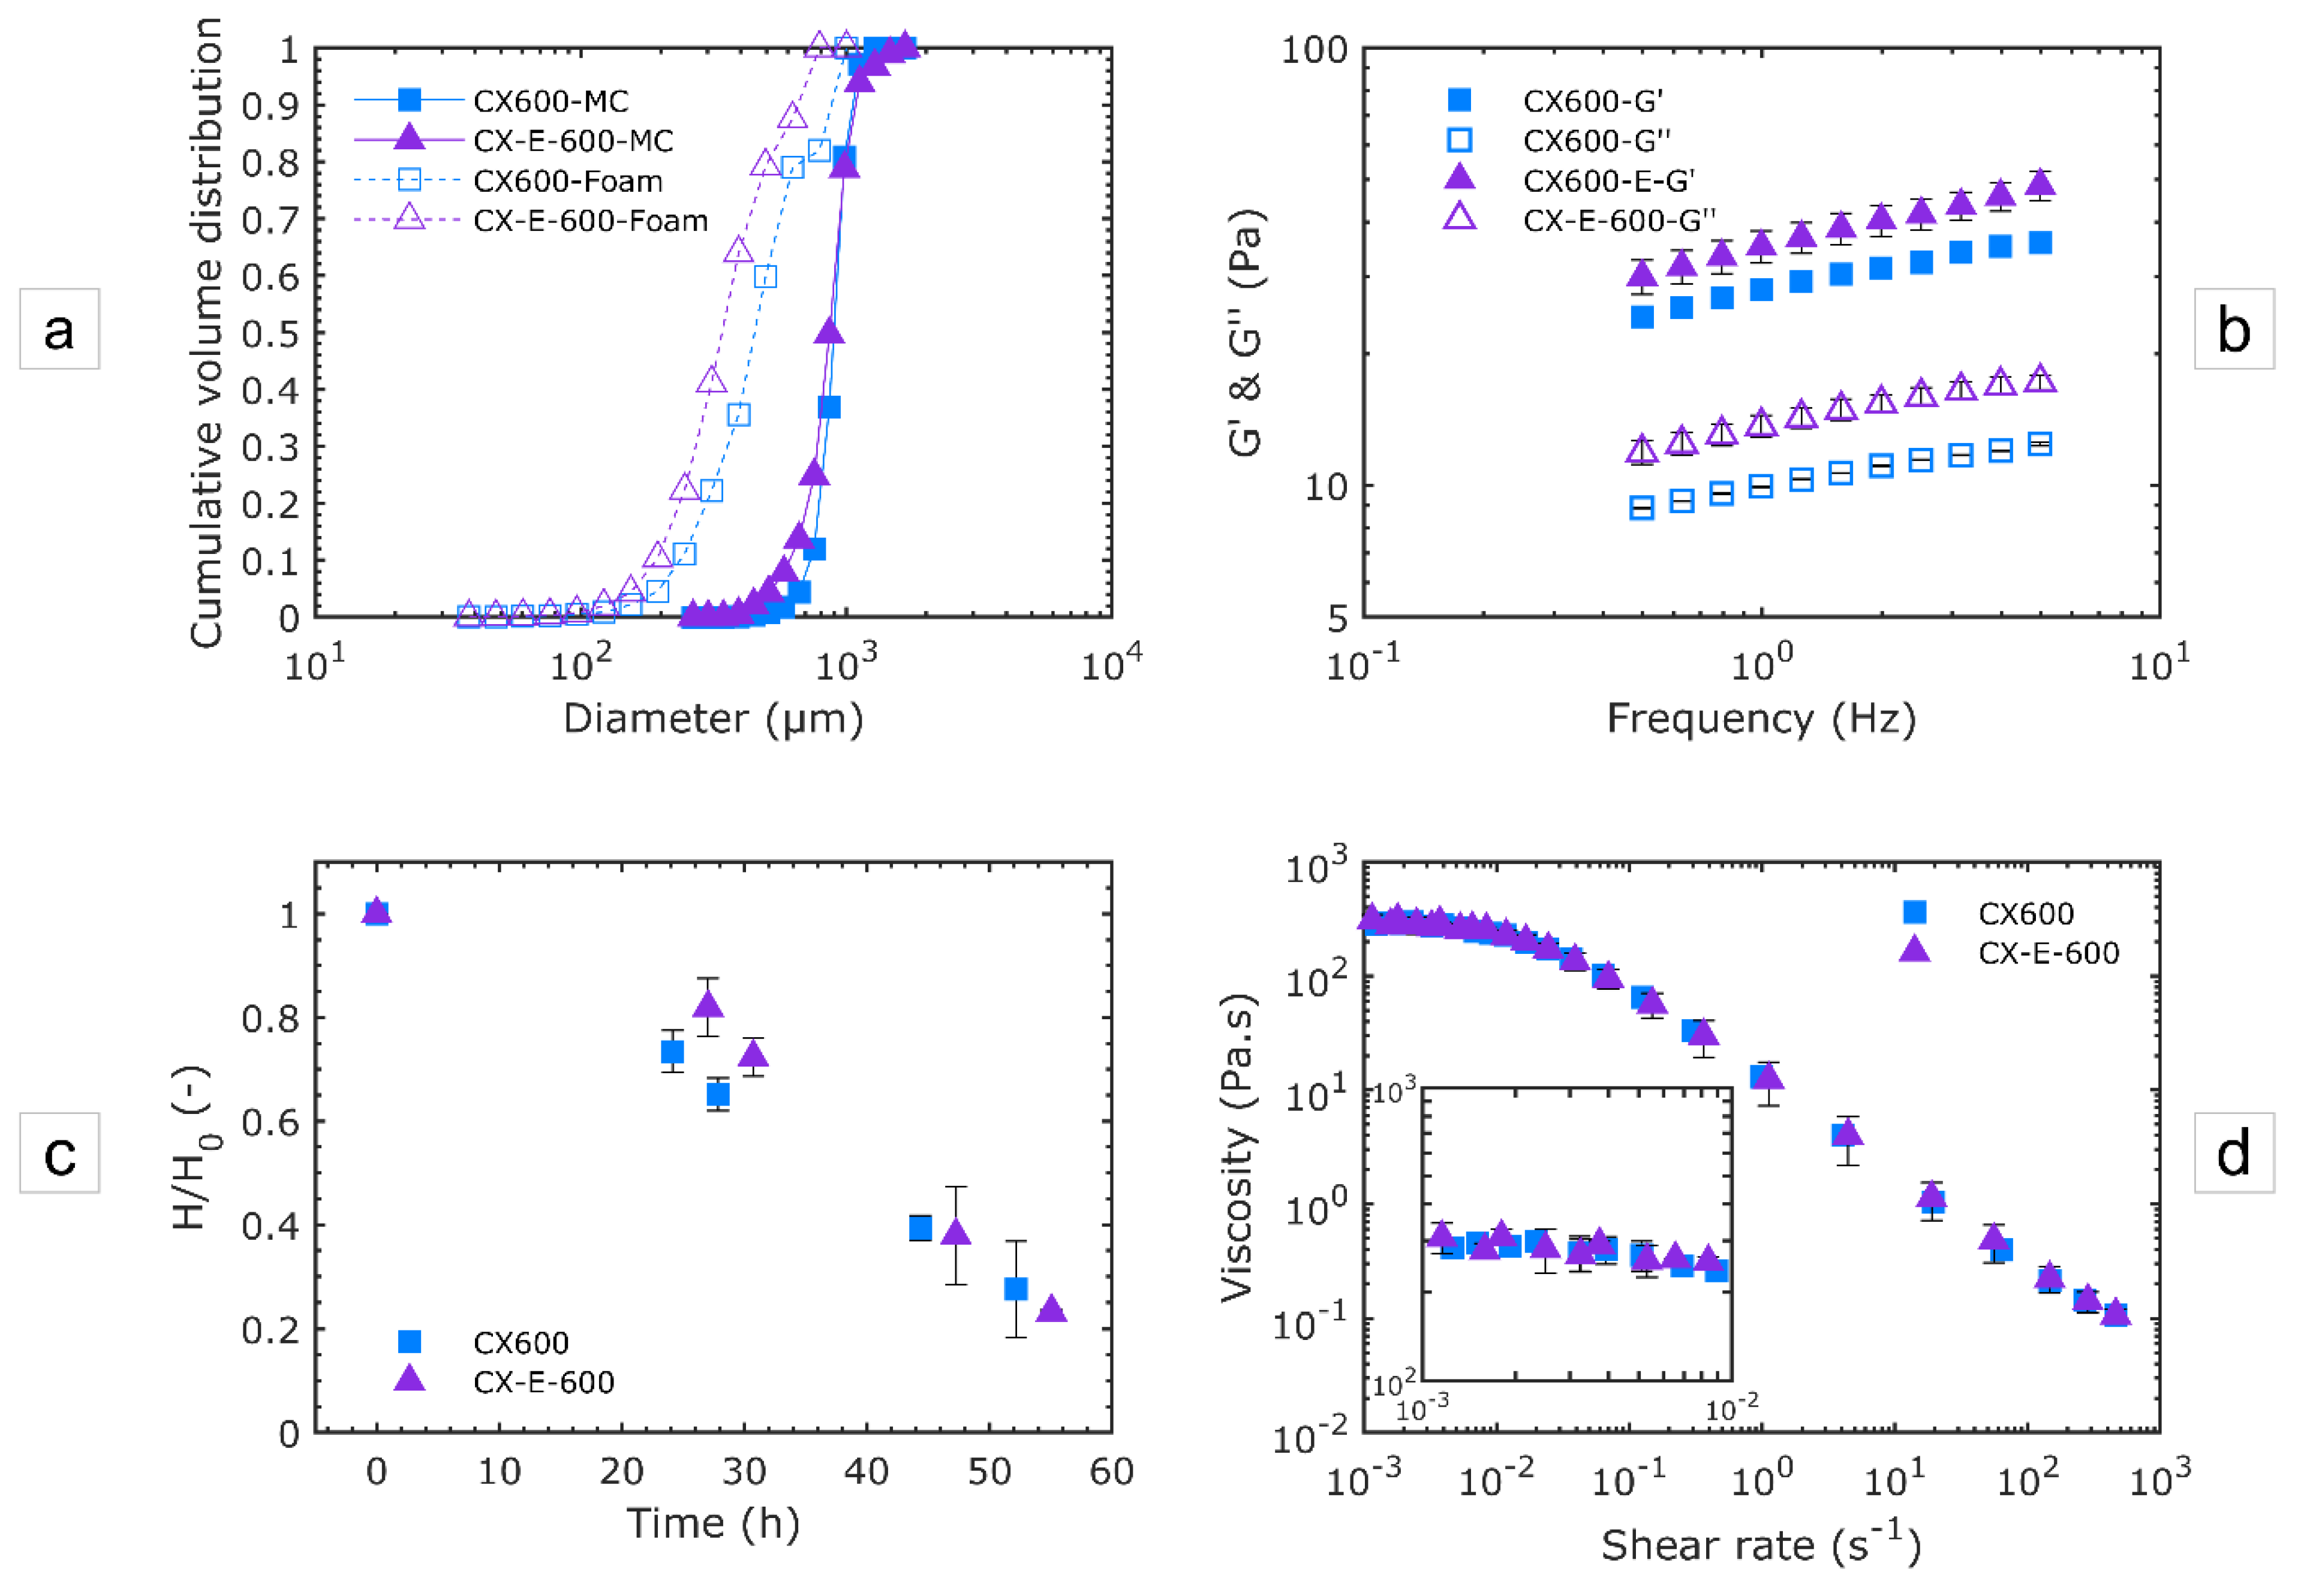
Figure 8.
Effect of the expansion channel (CX-E-600 vs. CX600) on the structural and end-used properties of foams produced with the model solution WPI3XG04 at QvL= 11 L·h−1 and QmG = 21.6 g·h−1. (a) Bubble size distributions in cumulative volume in the mixing channel (MC) and in the end product (foam). The diameters of bubbles inside the microchannels are normalized to the atmospheric pressure. (b) Mechanical moduli of foams at 20 °C. (c) Stability of foams. (d) Viscosity characterization of foams at 20 °C.
Figure 9.
Effect of the liquid flowrate on the structural and usage properties of foams produced with the device CX-E-600 and the model solution WPI3XG04 at various conditions: QvL = 11 L·h−1 − QmG = 21.6 g·h−1, QvL = 13.7 L·h−1 − QmG = 23 g·h−1 and QvL = 16.4 L·h−1 − QmG = 31.0 g·h−1. (a) Bubble size distributions in the foams in cumulative volume. The diameters of bubbles inside the microchannels are normalized to the atmospheric pressure. (b) Mechanical moduli of foams at 20 °C. (c) Stability of foams. (d) Viscosity characterization of foams at 20 °C.
Figure 10.
Effect of xanthan gum concentration on the structural and usage properties of foams produced with the device CX-E-600 and the model solutions WPI3XG04 and WPI3XG02. Circles stand for WPI3XG02 and triangles for WPI3XG04. Empty symbols stand for 11 L·h−1 and full symbols for 16.4 L·h−1. (a) Bubble size distributions in the foam in cumulative volume at two flowrate conditions: QvL = 11 L·h−1 − QmG = 21.6 g·h−1 and QvL = 16.4 L·h−1 − QmG = 31 g·h−1. The diameters of bubbles inside the microchannels are normalized to the atmospheric pressure. (b) Mechanical moduli of foams at 20 °C for QvL = 11 L·h−1 − QmG = 21.6 g·h−1. (c) Stability of foams for QvL = 11 L·h−1 − QmG = 21.6 g·h−1. (d) Viscosity characterization of foams at 20 °C for QvL = 11 L·h−1 − QmG = 21.6 g·h−1.
Figure 11.
Effect of formulation on two-phase flow typology and bubbles sizes. (a) High-speed visualizations of the two-phase flow inside the mixing channel of the device CX600 for solutions WPI3XG04, XG04 and glycerol at QvL = 11 L·h−1 and QmG = 21.6 g·h−1. (b) Bubble size distribution in cumulative volume for bubbles inside the mixing channel of CX600 for solutions WPI3XG04, XG04 and glycerol at QvL= 11 L·h−1 and QmG = 21.6 g·h−1. The diameters of bubbles inside the microchannels are normalized to the atmospheric pressure. (c) High-speed visualizations of the two-phase flow inside the expansion channel of the device CX-E-600 for solutions WPI3XG04, XG04 and glycerol at QvL = 3 L·h−1 and QmG = 5 g·h−1.
Figure 12.
Visualizations of bubbles in the outlet microchannel and visual aspect of foams obtained at the end of the process when using the device CX600 and flowrates QvL = 11 L·h−1 and QmG = 21.6 g·h−1. (a) Solution WPI3XG04. (b) Solution XG04. The crystallizing dishes have an approximative diameter of 8 cm and a height of about 5 cm.
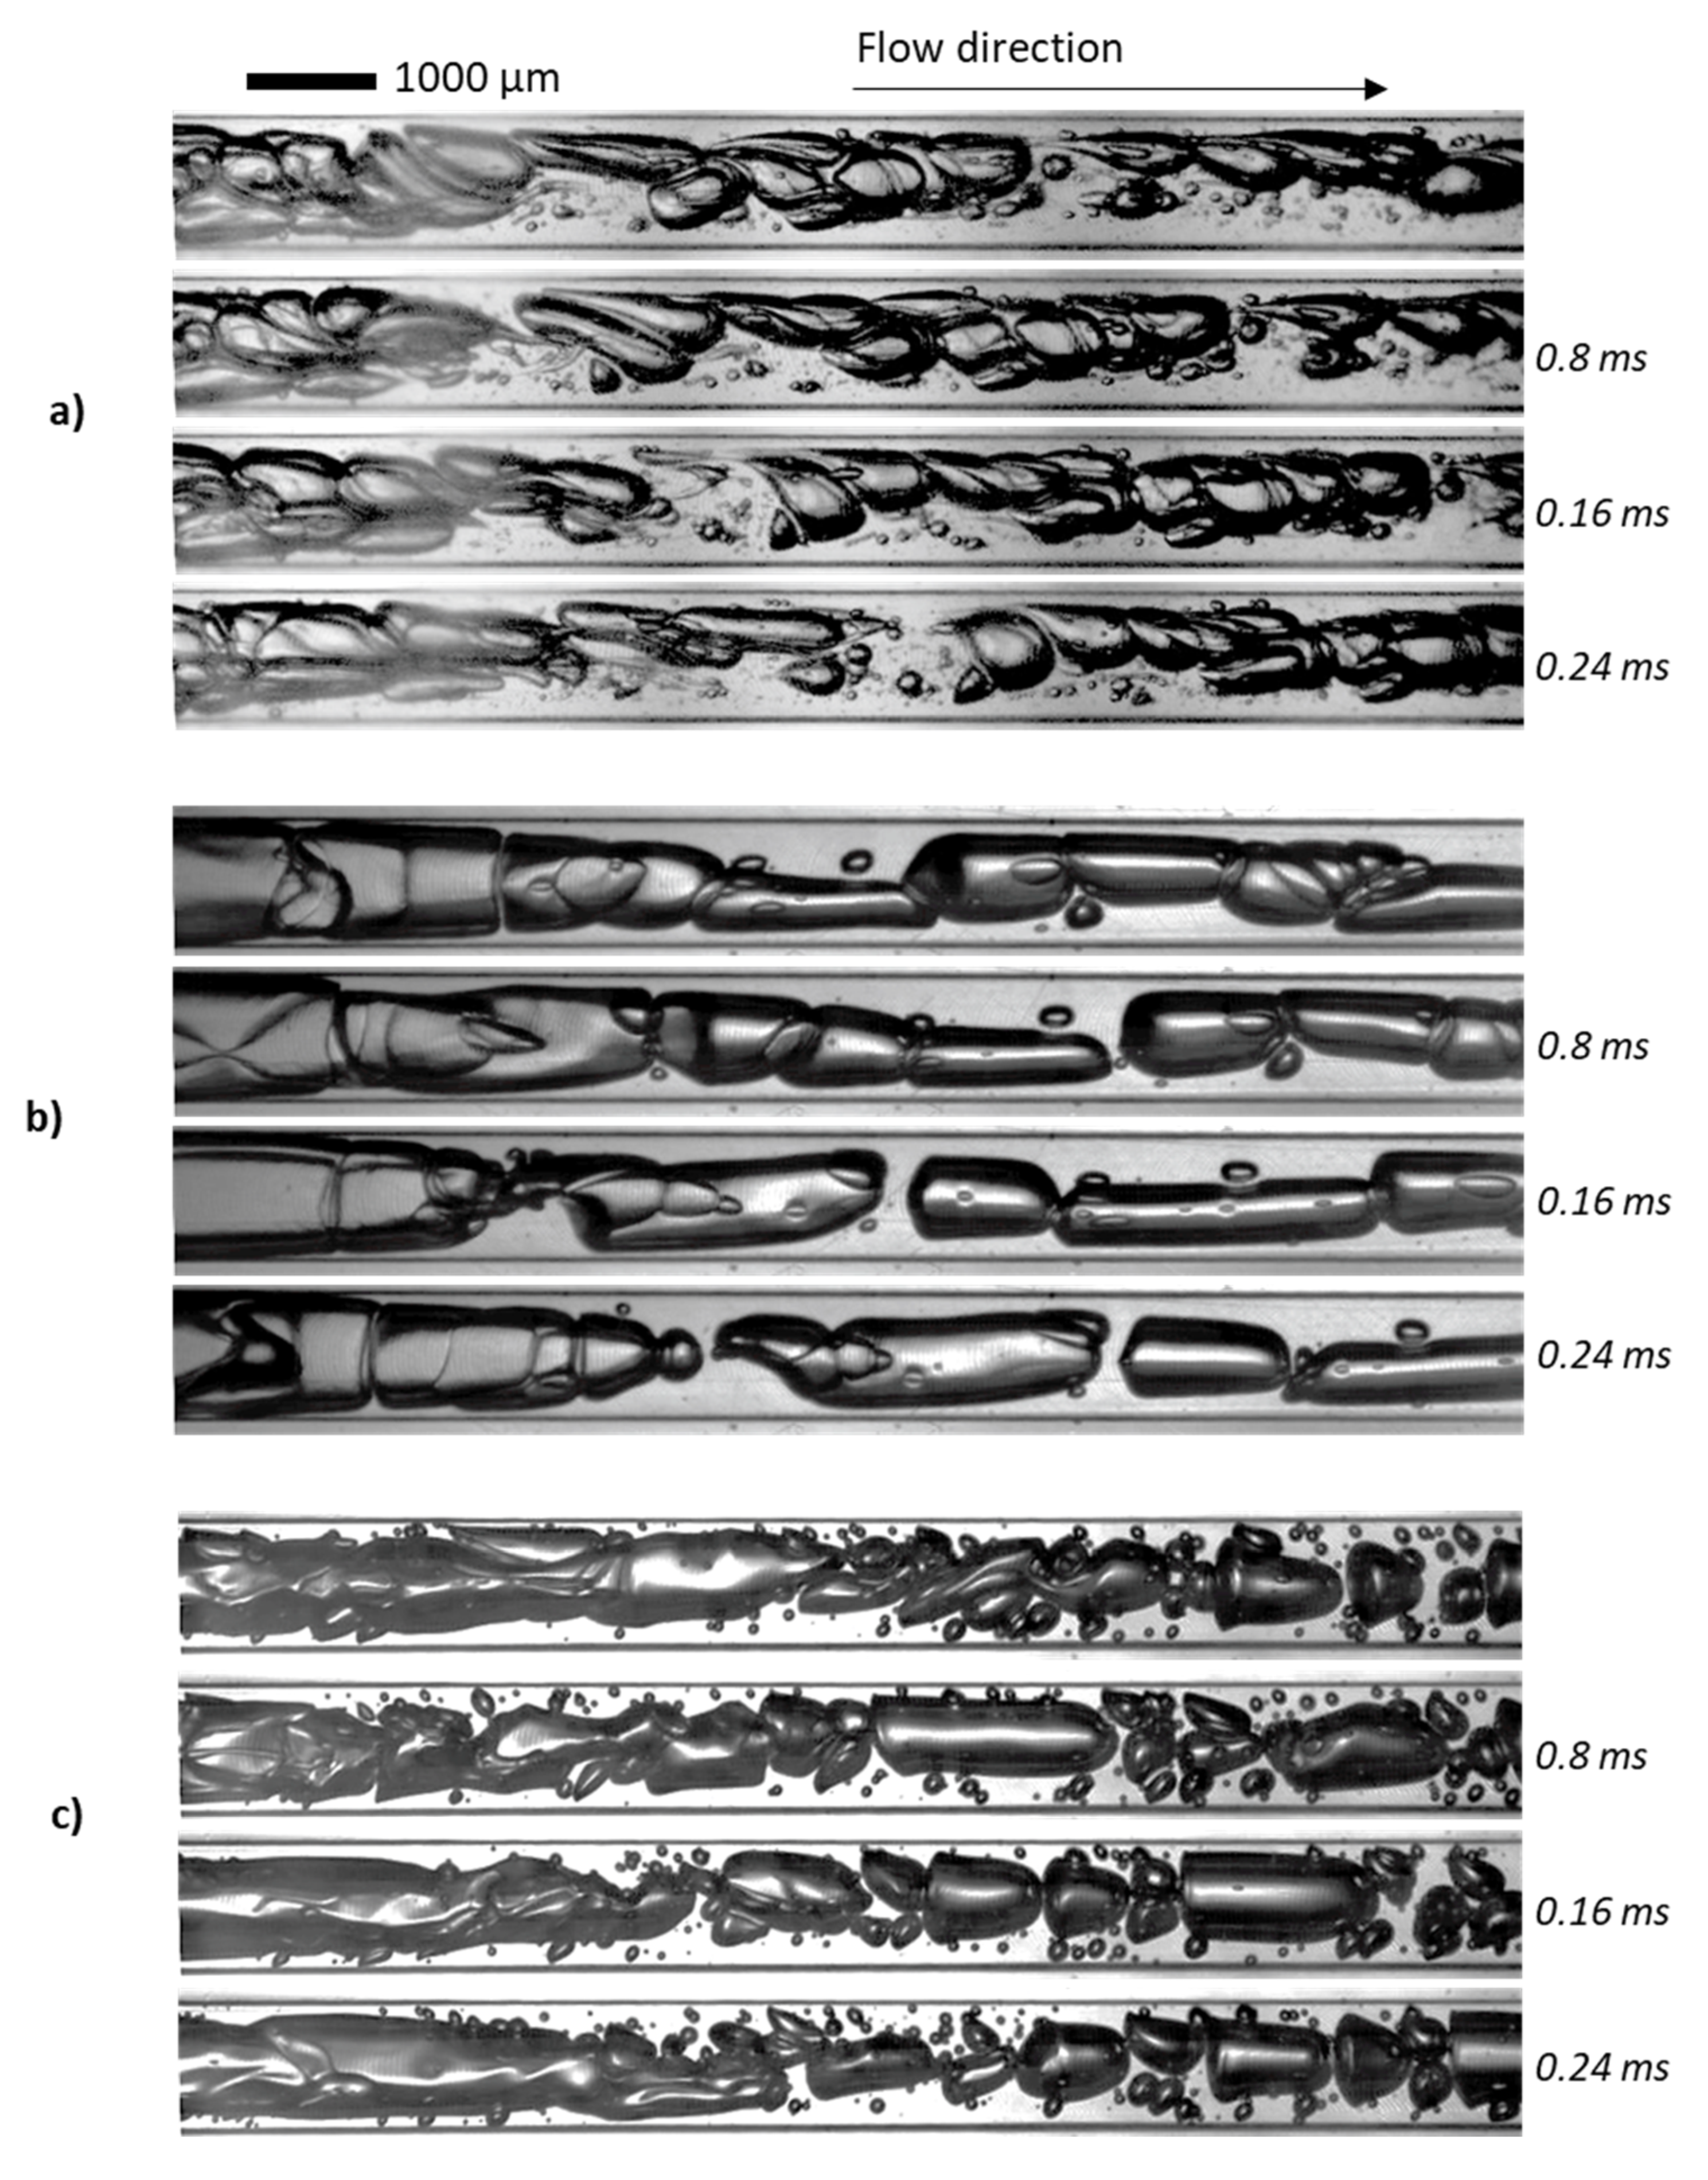
Figure 13.
Series of high-speed images selected at an interval of 0.8 ms for the two-phase flow inside the expansion channel of the device CX-E-600. Flowrates used: QvL = 3 L·h−1 et QmG = 5 g·h−1. (a) WPI3XG04. (b) XG04. (c) Glycerol 50%. Image acquisition frequency of 5000 images per second, resulting in an interframe time of 0.2 ms.
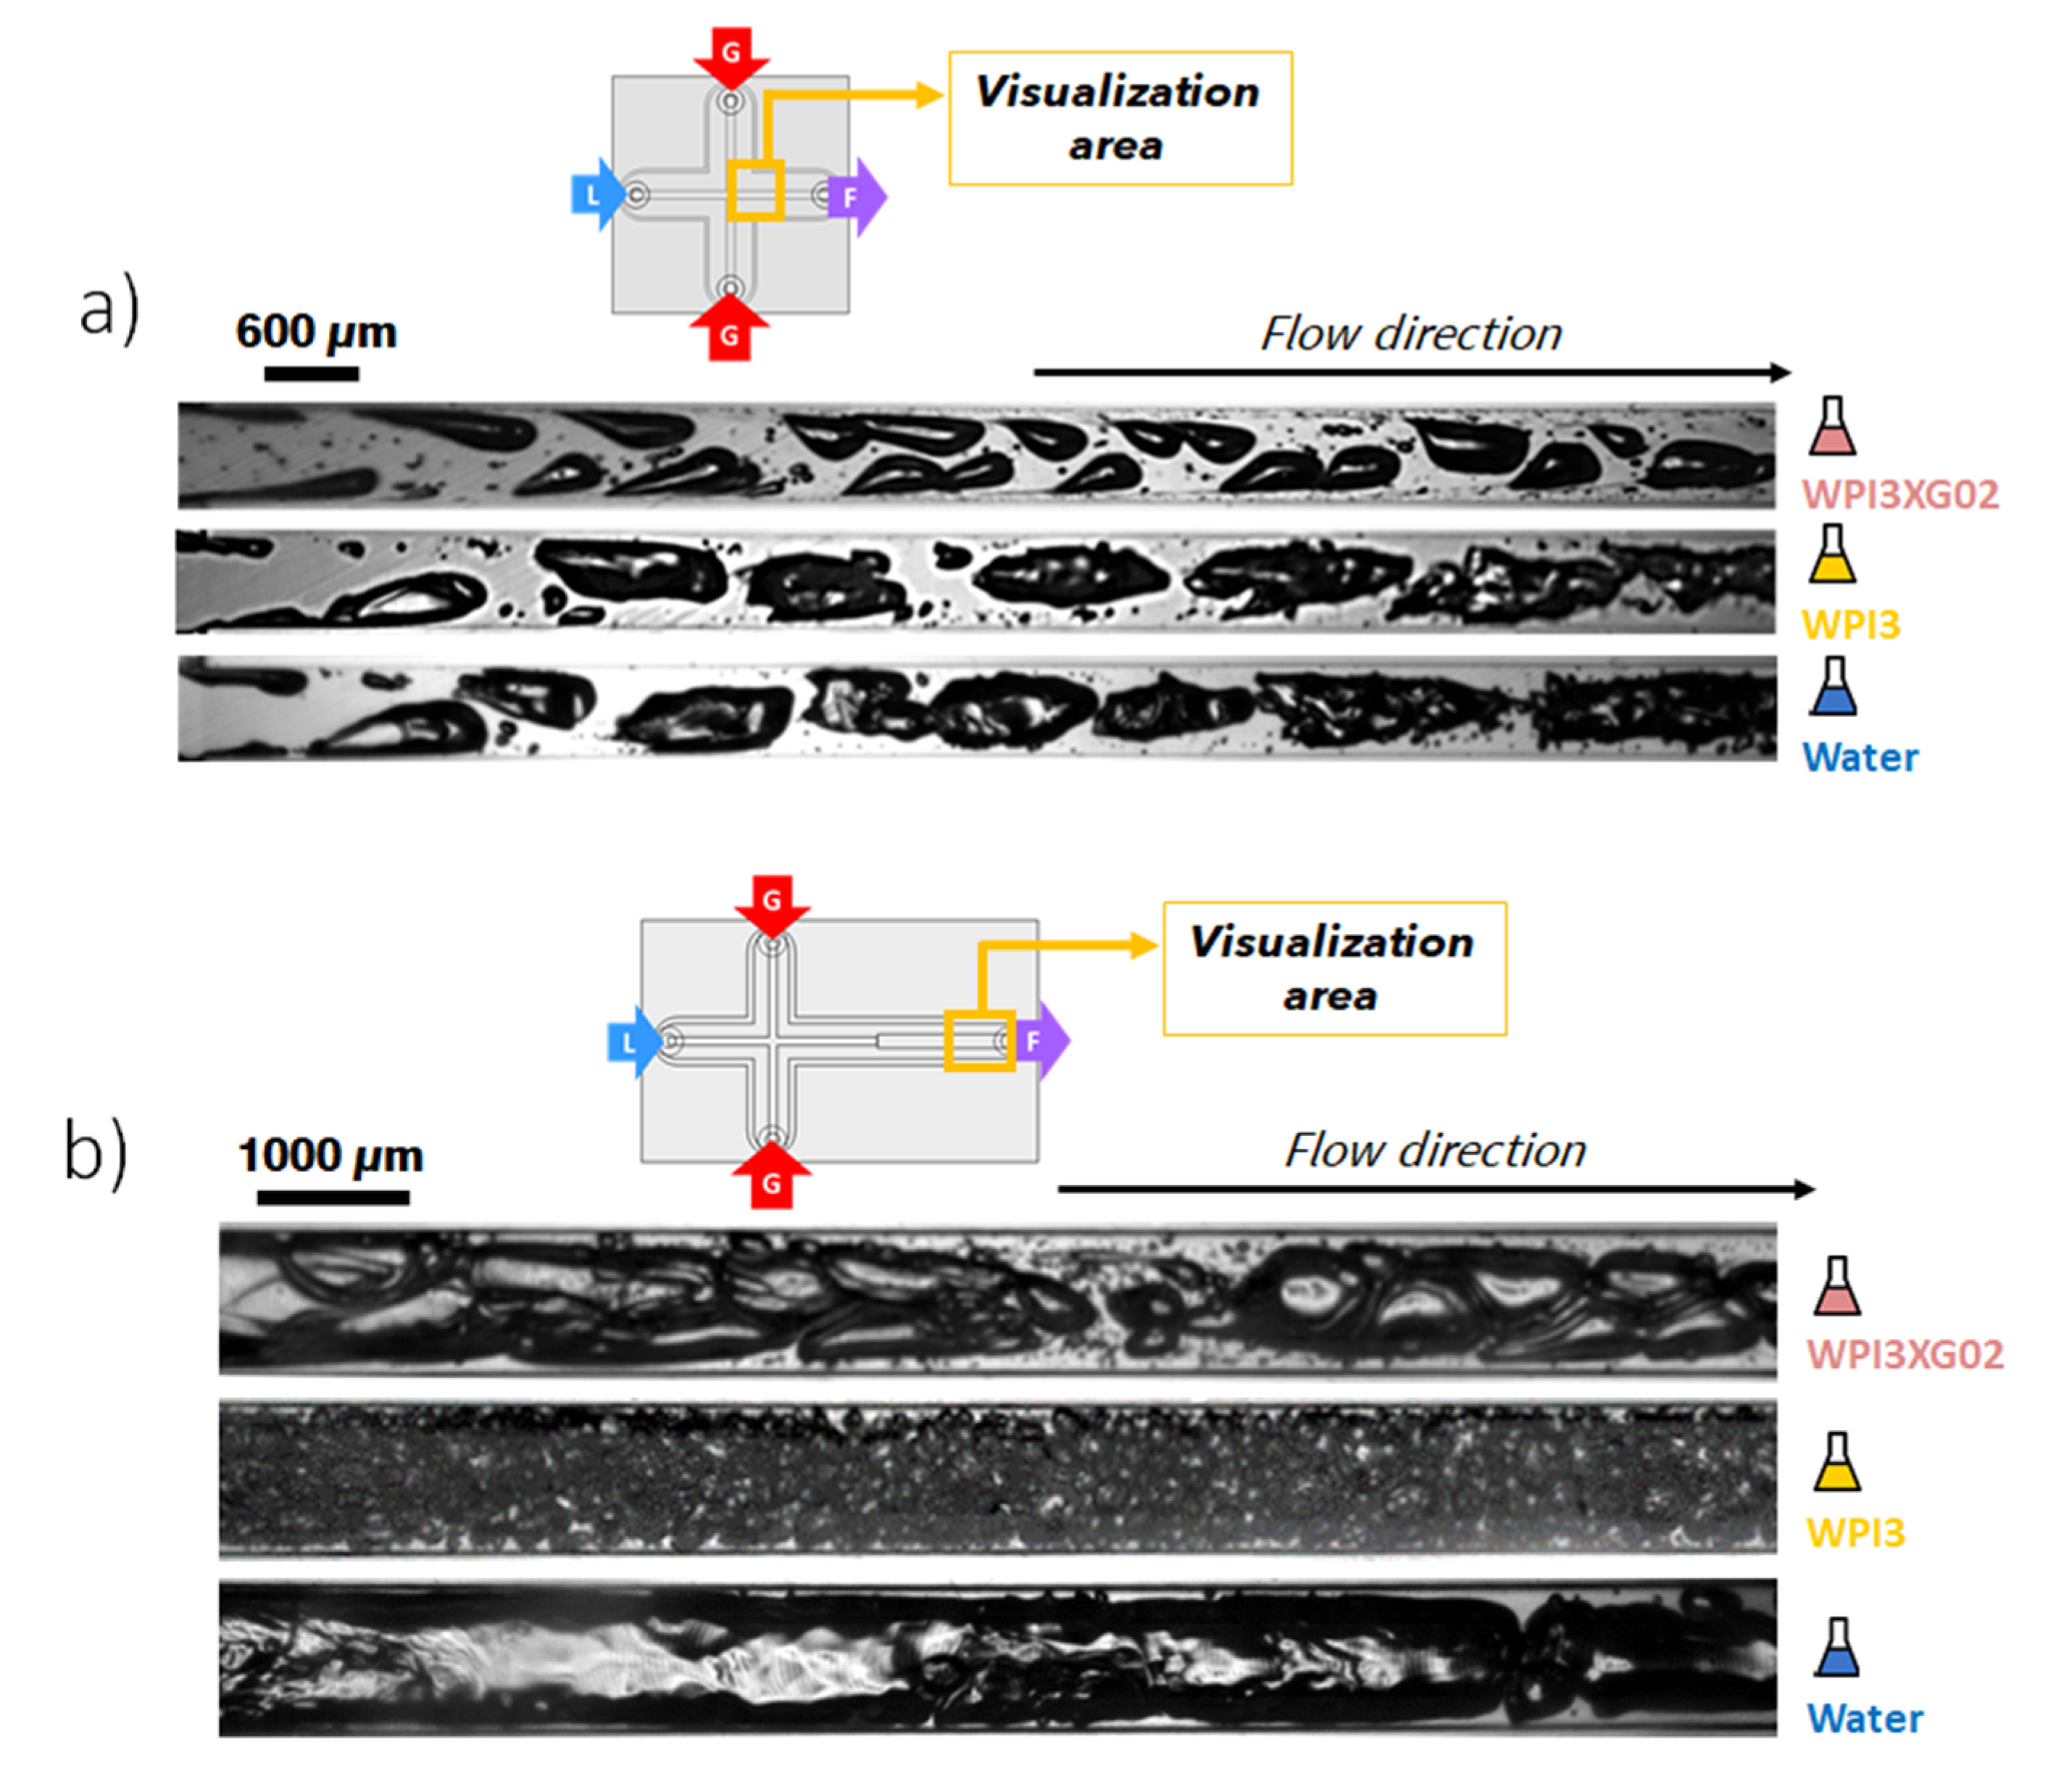
Figure 14.
Effect of the formulation on two-phase flow typology. (a) High-speed visualizations of the two-phase flow inside the mixing channel of the device CX600 for the solutions WPI3XG02, WPI3 and water at QvL = 11 L·h−1 and QmG = 21.6 g·h−1. (b) High-speed visualizations of the two-phase flow inside the expansion channel of the device CX-E-600 for the solutions WPI3XG02, WPI3 and water at QvL = 3 L·h−1 and QmG = 5 g·h−1.
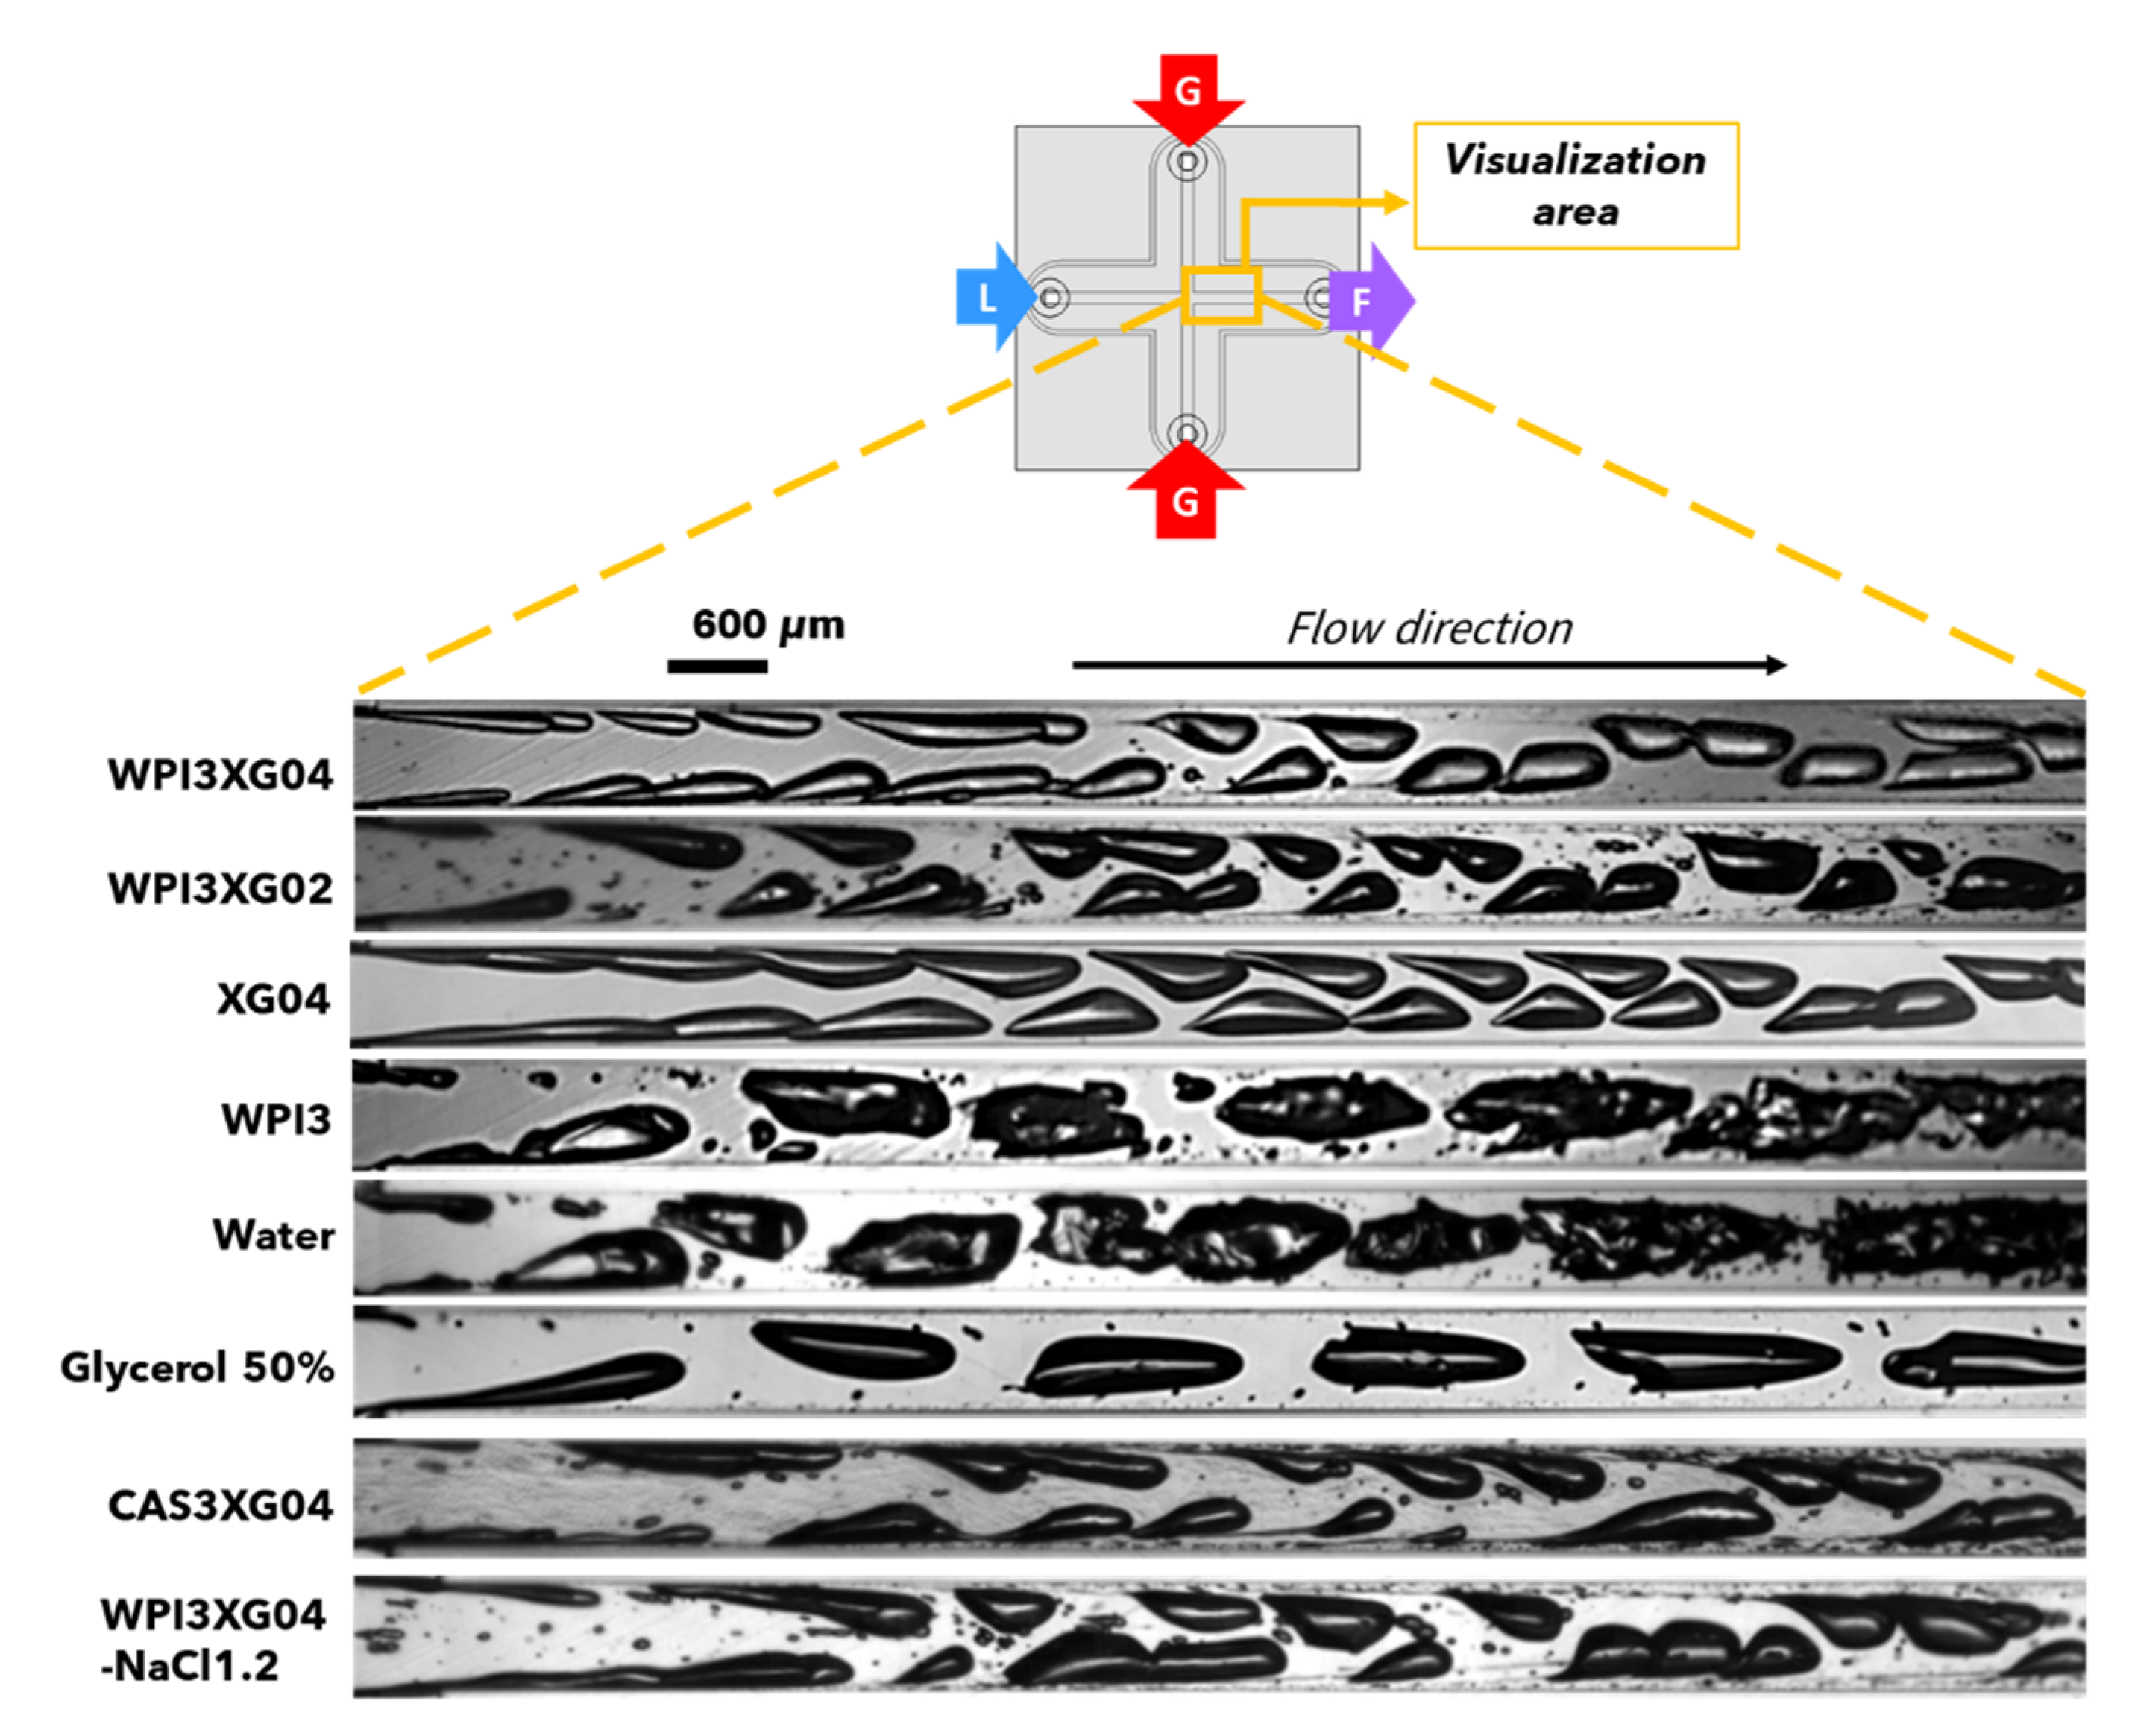
Figure 15.
High-speed visualizations of the train of bubbles in the mixing channel of the device CX600 for several formulations at QvL = 11 L·h−1 − QmG = 21.6 g·h−1. The liquid flowrate for CAS3XG04 was slightly lower (QvL = 10.6 L·h−1 − QmG = 21.6 g·h−1).
Figure 15.
High-speed visualizations of the train of bubbles in the mixing channel of the device CX600 for several formulations at QvL = 11 L·h−1 − QmG = 21.6 g·h−1. The liquid flowrate for CAS3XG04 was slightly lower (QvL = 10.6 L·h−1 − QmG = 21.6 g·h−1).
Figure 16.
Properties of bubbles flowing through several liquid bases inside the mixing channel of the device CX600 at QvL = 11 L·h−1 − QmG = 21.6 g·h−1. (a) Sauter diameter. (b) Circularity. (c) Average bubble speed. (d) Bubbling frequency. The liquid flowrate for CAS3XG04 was slightly lower (conditions for CAS3XG04 were QvL = 10.6 L·h−1 − QmG = 21.6 g·h−1.
Table 1.
Physico-chemical properties of solutions at 20 °C.
Table 1.
Physico-chemical properties of solutions at 20 °C.
| Solution | σ | ρ |
|---|
| - | mN·m−1 | kg·m−3 |
|---|
| WPI3XG02 | 43 | 1010 |
| WPI3XG04 | 46 | 972 |
| XG04 | 72 | 1003 |
| WPI3XG04 + NaCl | 46 | 979 |
| CAS3XG04 | 41 | 968 |
| WPI3 | 40 | 1006 |
| Glycerol 50% | 68 | 1123 |
| Water | 72 | 1000 |
Table 2.
Hydrodynamic parameters of the two-phase flow in the mixing channel of the microfluidic device CX600 for several flow conditions using the model solution WPI3XG04.
Table 2.
Hydrodynamic parameters of the two-phase flow in the mixing channel of the microfluidic device CX600 for several flow conditions using the model solution WPI3XG04.
| Ppump | QvL | UL | QmG | pinj | QvG | UG | α (p) | | µL | CaL | ReL | WeL |
ΔP1 |
|---|
| bar | L·h−1 | m·s−1 | g·h−1 | bar | L·h−1 | m·s−1 | - | s−1 | mPa·s | - | - | - | bar |
|---|
| 2.05 | 3.0 | 2.17 | 5.00 | 1.53 | 1.70 | 1.31 | 0.38 | 2.57 × 10⁴ | 3.38 | 0.16 | 373 | 60 | 0.48 |
| 3.89 | 6.9 | 5.32 | 13.00 | 2.70 | 3.02 | 2.33 | 0.30 | 6.30 × 10⁴ | 2.69 | 0.31 | 1153 | 358 | 1.00 |
| 6.37 | 11.0 | 8.46 | 21.60 | 3.83 | 3.85 | 2.97 | 0.26 | 1.00 × 10⁵ | 2.49 | 0.46 | 1981 | 907 | 1.53 |
| 7.78 | 13.7 | 10.56 | 26.50 | 4.65 | 4.04 | 3.12 | 0.23 | 1.25 × 10⁵ | 2.42 | 0.56 | 2545 | 1413 | 1.97 |
| 9.22 | 16.4 | 12.66 | 31.00 | 5.52 | 4.09 | 3.16 | 0.20 | 1.50 × 10⁵ | 2.37 | 0.65 | 3113 | 2030 | 2.34 |
| 11.81 | 19.1 | 14.75 | 36.40 | 6.45 | 4.21 | 3.25 | 0.18 | 1.75 × 10⁵ | 2.34 | 0.75 | 3684 | 2759 | 2.90 |
Table 3.
Hydrodynamic parameters of the two-phase flow in the expansion channel of the microfluidic device CX-E-600 for several flow conditions using the model solution WPI3XG04.
Table 3.
Hydrodynamic parameters of the two-phase flow in the expansion channel of the microfluidic device CX-E-600 for several flow conditions using the model solution WPI3XG04.
| QvL | UL | QvG | UG | | µL | CaL | ReL | WeL |
|---|
| L·h−1 | m·s−1 | L·h−1 | m·s−1 | s−1 | mPa·s | - | - | - |
|---|
| 3.0 | 0.78 | 12.87 | 0.36 | 5.55 × 10³ | 6.88 | 0.12 | 110 | 13 |
| 6.9 | 1.91 | 19.83 | 0.55 | 1.36 × 10⁴ | 4.32 | 0.18 | 431 | 77 |
| 11.0 | 3.05 | 25.28 | 0.70 | 2.17 × 10⁴ | 3.59 | 0.24 | 825 | 196 |
| 13.7 | 3.80 | 23.21 | 0.64 | 2.70 × 10⁴ | 3.33 | 0.28 | 1109 | 305 |
| 16.4 | 4.56 | 26.15 | 0.73 | 3.24 × 10⁴ | 3.15 | 0.31 | 1405 | 439 |
Table 4.
Hydrodynamic parameters of the two-phase flow in the mixing channel of the microfluidic device CX600 for the XG04, WPI3XG04 and glycerol solutions at QvL = 11 L·h−1 − QmG = 21.6 g·h−1.
Table 4.
Hydrodynamic parameters of the two-phase flow in the mixing channel of the microfluidic device CX600 for the XG04, WPI3XG04 and glycerol solutions at QvL = 11 L·h−1 − QmG = 21.6 g·h−1.
| Solution | QvL | UL | pinj | QvG | UG | | µL | CaL | ReL | WeL |
Δp1 |
|---|
| - | L·h−1 | m·s−1 | bar | L·h−1 | m·s−1 | s−1 | mPa·s | - | - | - | bar |
|---|
| XG04 | 11.0 | 8.46 | 3.53 | 4.16 | 3.21 | 1.00 × 10⁵ | 2.14 | 0.25 | 2379 | 598 | 1.58 |
| WPI3XG04 | 11.0 | 8.46 | 3.83 | 3.85 | 2.97 | 1.00 × 10⁵ | 2.49 | 0.46 | 1981 | 907 | 1.53 |
| Glycerol | 11.0 | 8.46 | 4.60 | 3.37 | 2.60 | 1.00 × 10⁵ | 6.00 | 0.75 | 950 | 709 | 2.25 |
Table 5.
Hydrodynamic parameters of the two-phase flow in the expansion channel of the microfluidic device CX-E-600 for the XG04, WPI3XG04 and glycerol solutions at QvL = 3 L·h−1 − QmG = 5 g·h−1.
Table 5.
Hydrodynamic parameters of the two-phase flow in the expansion channel of the microfluidic device CX-E-600 for the XG04, WPI3XG04 and glycerol solutions at QvL = 3 L·h−1 − QmG = 5 g·h−1.
| Solution | QvL | UL | QvG | UG | | µL | CaL | ReL | WeL |
|---|
| (-) | L·h−1 | m·s−1 | L·h−1 | m·s−1 | s−1 | mPa·s | - | - | - |
|---|
| XG04 | 3.0 | 0.80 | 1.51 | 0.42 | 5.66 × 10³ | 4.94 | 0.05 | 162 | 9 |
| WPI3XG04 | 3.0 | 0.78 | 12.87 | 0.36 | 5.55 × 10³ | 6.88 | 0.12 | 110 | 13 |
| Glycerol | 3.0 | 0.83 | 1.26 | 0.35 | 5.87 × 10³ | 6.00 | 0.07 | 154 | 11 |
Table 6.
Hydrodynamic parameters of the two-phase flow in the mixing channel of the microfluidic device CX600 for the solutions WPI3, WPI3XG02 and water at QvL = 11 L·h−1 − QmG = 21.6 g·h−1.
Table 6.
Hydrodynamic parameters of the two-phase flow in the mixing channel of the microfluidic device CX600 for the solutions WPI3, WPI3XG02 and water at QvL = 11 L·h−1 − QmG = 21.6 g·h−1.
| Solution | QvL | UL | pinj | QvG | UG | | µL | CaL | ReL | WeL |
Δp1 |
|---|
| - | L·h−1 | m·s−1 | Bar | L·h−1 | m·s−1 | s−1 | mPa·s | - | - | - | bar |
|---|
| WPI3 | 11.0 | 8.46 | 3.34 | 4.31 | 3.33 | 1.00 × 10⁵ | 1.44 | 0.30 | 3548 | 1079 | 1.46 |
| WPI3XG02 | 11.0 | 8.46 | 3.08 | 4.61 | 3.56 | 1.00 × 10⁵ | 1.52 | 0.29 | 3214 | 945 | 13.46 |
| Water | 11.0 | 8.46 | 2.49 | 5.35 | 4.13 | 1.00 × 10⁵ | 1.00 | 0.12 | 5076 | 596 | 1.46 |
Table 7.
Hydrodynamic parameters of the two-phase flow in the expansion channel of the microfluidic device CX-E-600 for the solutions WPI3, WPI3XG02 and water at QvL = 3 L·h−1 − QmG = 5 g·h−1.
Table 7.
Hydrodynamic parameters of the two-phase flow in the expansion channel of the microfluidic device CX-E-600 for the solutions WPI3, WPI3XG02 and water at QvL = 3 L·h−1 − QmG = 5 g·h−1.
| Solution | QvL | UL | QvG | UG | | µL | CaL | ReL | WeL |
|---|
| (-) | L·h−1 | m·s−1 | L·h−1 | m·s−1 | s−1 | mPa·s | - | - | - |
|---|
| WPI3 | 3.0 | 0.77 | 1.80 | 0.50 | 5.45 × 10³ | 1.44 | 0.03 | 536 | 15 |
| WPI3XG02 | 3.0 | 0.78 | 1.54 | 0.43 | 5.55 × 10³ | 3.73 | 0.07 | 201 | 13 |
| Water | 3.0 | 0.83 | 2.04 | 0.57 | 5.93 × 10³ | 1.00 | 0.01 | 833 | 10 |
Table 8.
Hydrodynamic parameters of the two-phase flow in the mixing channel of the microfluidic device CX600 for the solutions WPI3XG04-NaCl at QvL = 11 L·h−1 − QmG = 21.6 g·h−1 and CAS3XG04 at QvL = 10.6 L·h−1 − QmG = 21.6 g·h−1.
Table 8.
Hydrodynamic parameters of the two-phase flow in the mixing channel of the microfluidic device CX600 for the solutions WPI3XG04-NaCl at QvL = 11 L·h−1 − QmG = 21.6 g·h−1 and CAS3XG04 at QvL = 10.6 L·h−1 − QmG = 21.6 g·h−1.
| Solution | QvL | UL | pinj | QvG | UG | | µL | CaL | ReL | WeL |
Δp1 |
|---|
| - | L·h−1 | m·s−1 | bar | L·h−1 | ms−1 | s−1 | mPa·s | - | - | - | bar |
|---|
| CAS3XG04 | 10.6 | 8.15 | 4.54 | 3.38 | 2.61 | 9.67 × 10⁴ | 2.55 | 0.51 | 1856 | 939 | 1.89 |
| WPI3XG04-NaCl | 11.0 | 8.46 | 3.84 | 3.85 | 2.97 | 1.36 × 10⁵ | 2.43 | 0.45 | 2048 | 914 | 1.51 |
Table 9.
Qualitative summary of the effect of the formulation on the two-phase flow in the mixing channel of the device CX600. The ratios concern the flow in the mixing channel; they are calculated at QvL = 11 L·h−1 − QmG = 21.6 g·h−1. The liquid flowrate for CAS3XG04 was slightly lower (QvL = 10.6 L·h−1 − QmG = 21.6 g·h−1). The indications “yes” and “no” in the 4th and 5th columns refer to the visual presence or absence of bubble breakup mechanisms discussed in this study: i.e., tip-streaming in the mixing channel and binary breakup in the expansion channel of CX-E-600. The last column indicates if the solution/fluid allowed us to obtain a foam or not.
| Solution/Fluid | f/fwater | WeL/WeLwater | Tip Streaming | Binary Breakup | Foam at the Outlet |
|---|
| WPI3XG04 | 1.43 | 1.52 | yes | yes | yes |
| WPI3XG02 | 1.90 | 1.58 | yes | yes | yes |
| XG04 | 1.14 | 1.00 | no | no | no |
| WPI3 | 1.43 | 1.81 | no | no | Yes but rough and unstable |
| Glycerol | 1.19 | 1.19 | no | no | no |
| Water | 1.00 | 1.00 | no | no | no |
| CAS3XG04 | 1.71 | 1.57 | probable | yes | yes |
| WPI3XG04-NaCl | 1.62 | 1.53 | yes | yes | yes |


