Direct Measurement of Temperature Diffusivity of Nanocellulose-Doped Biodegradable Composite Films

 , , , and
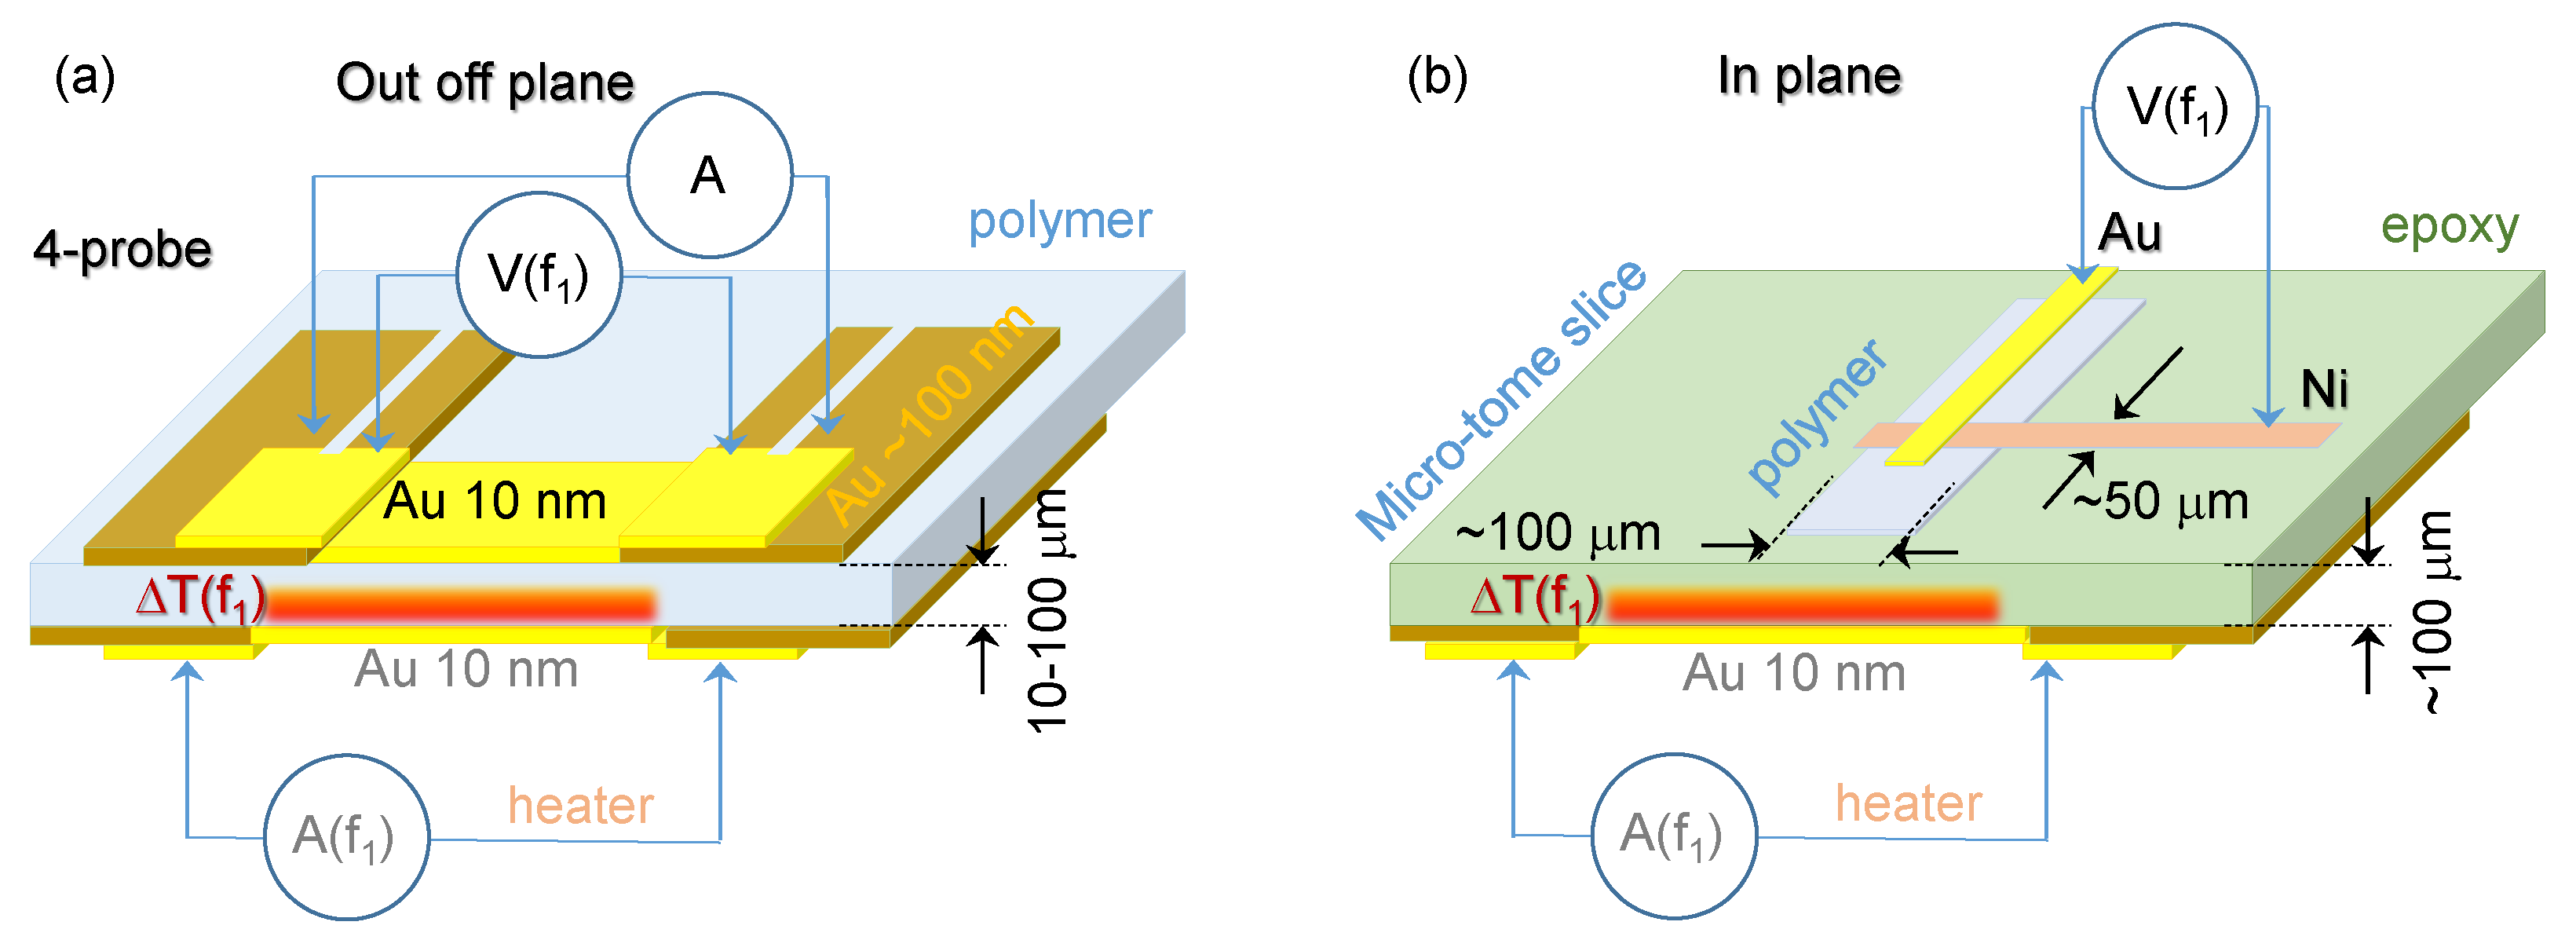
Abstract
:1. Introduction
2. Method: Thermal Wave
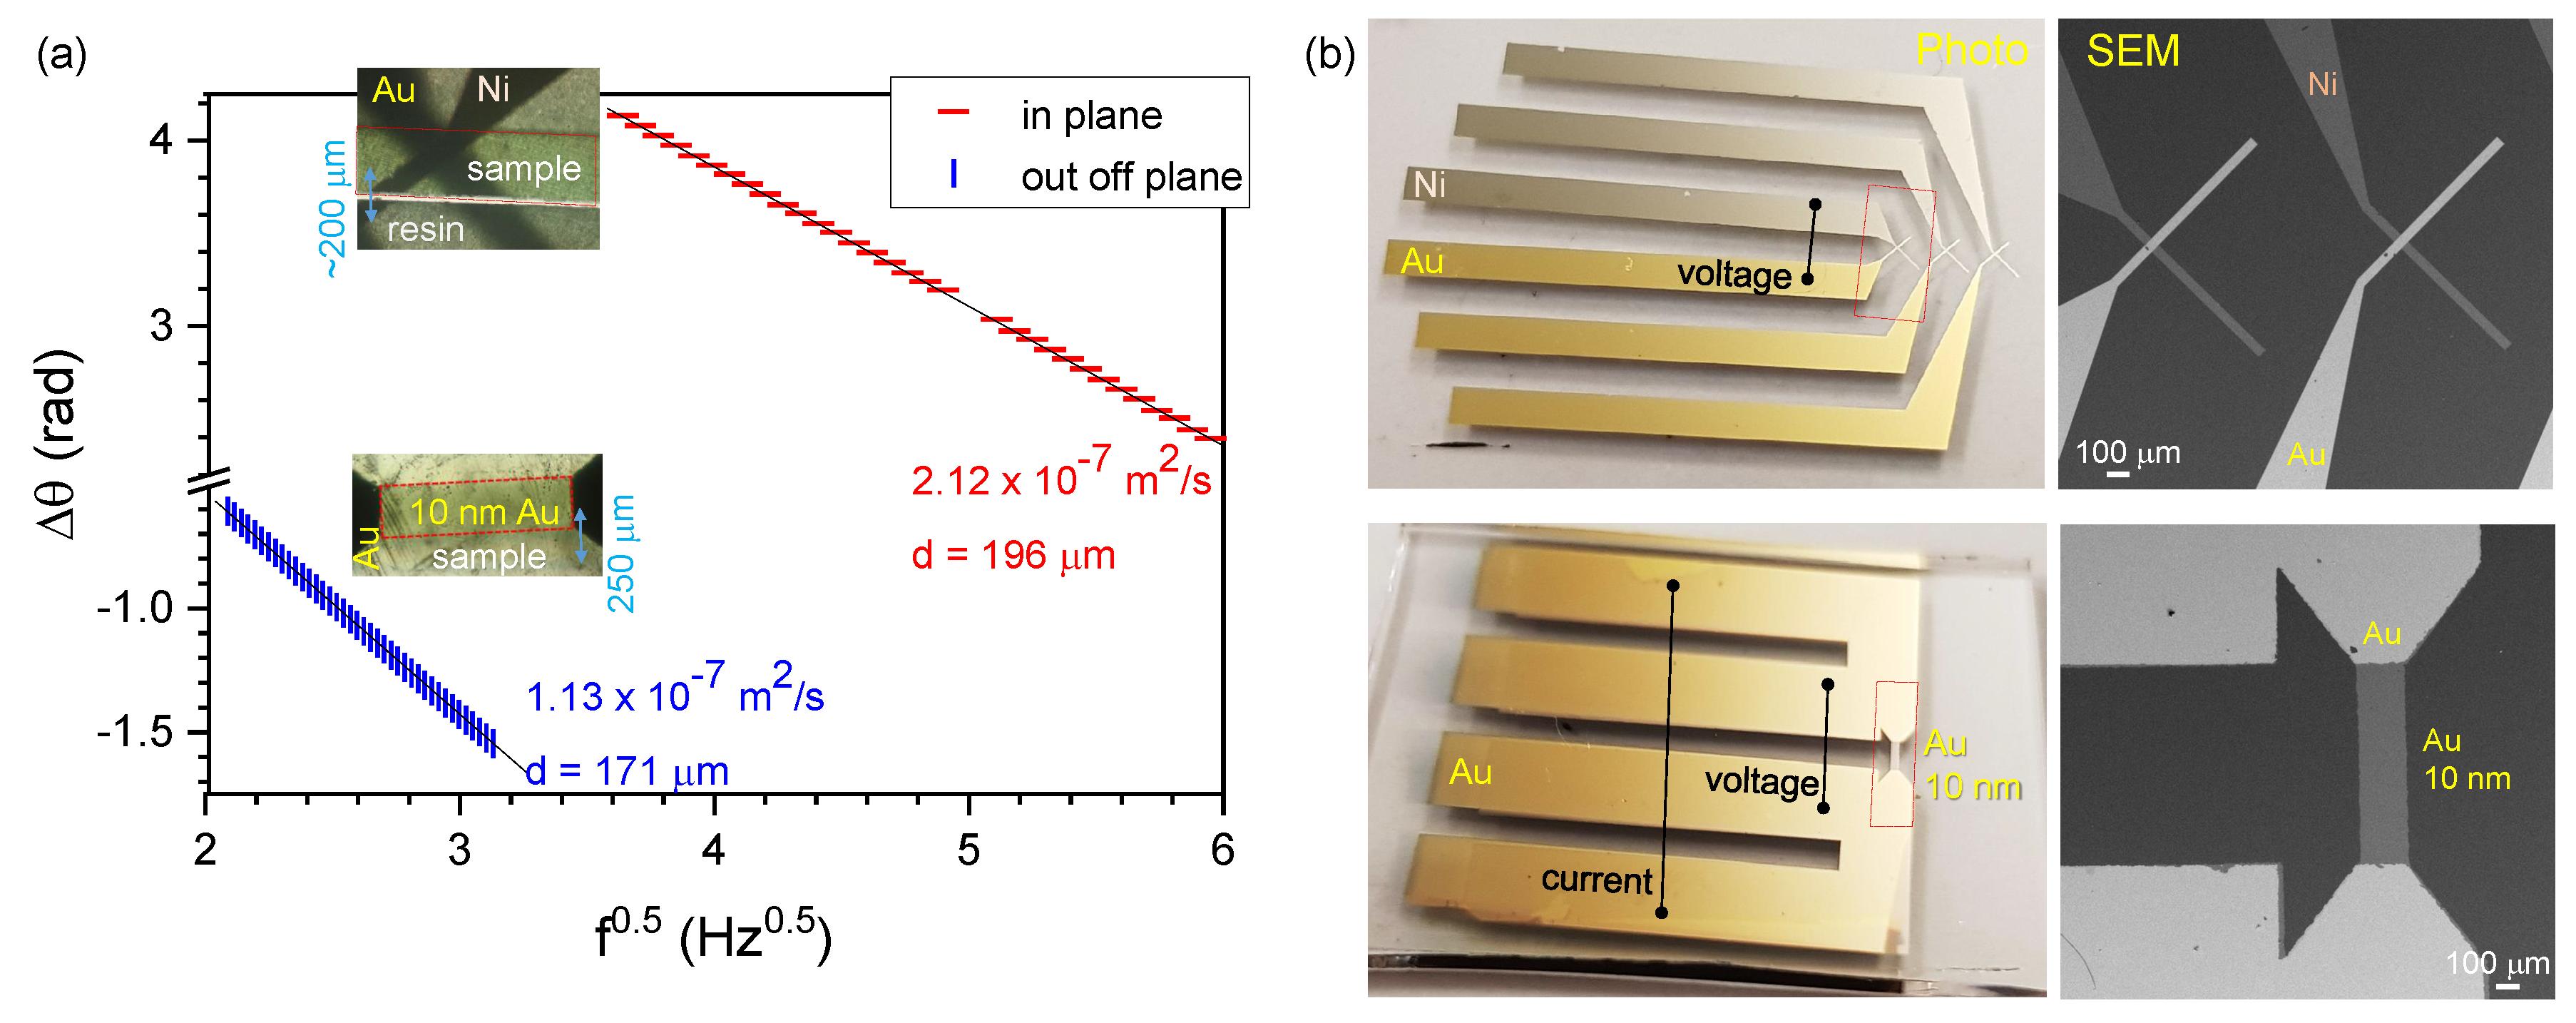
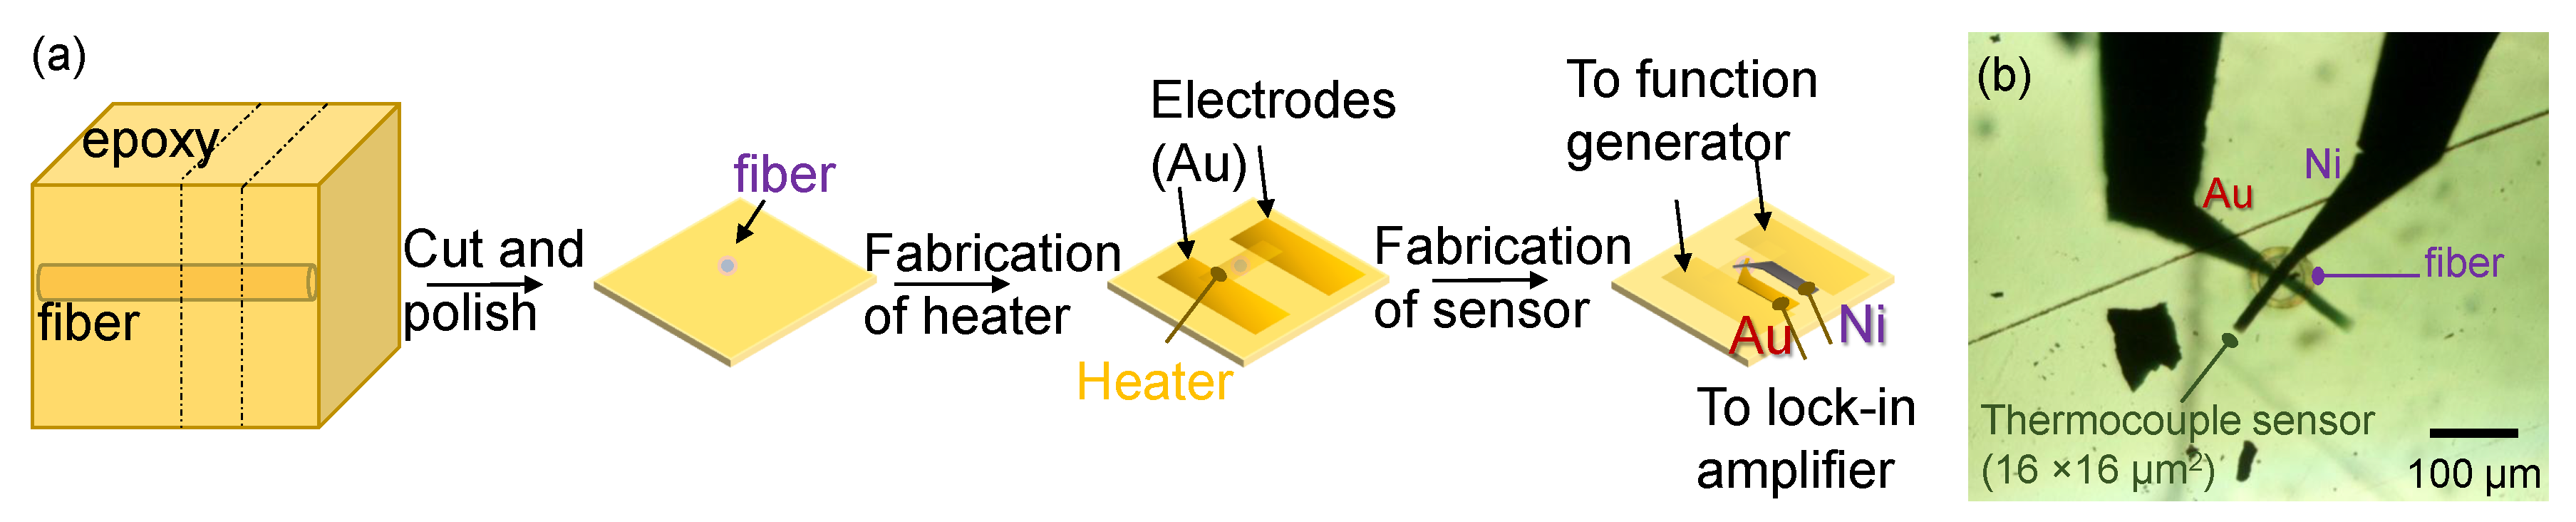
3. Experimental
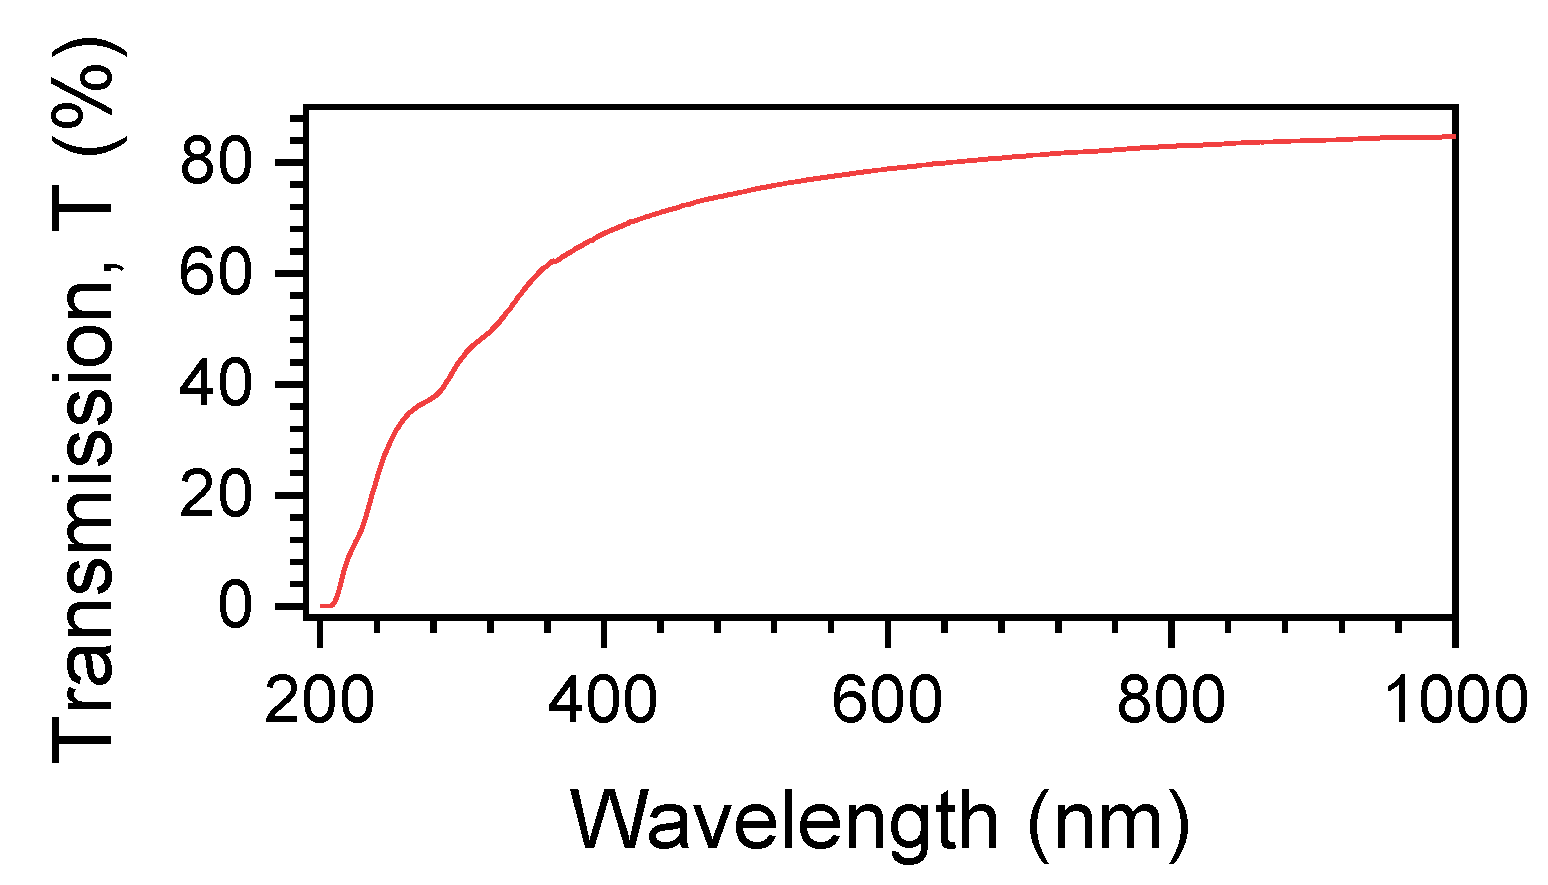
4. Results
5. Discussion
6. Conclusions
Author Contributions
Funding
Acknowledgments
Conflicts of Interest
Appendix A
Appendix A.1. Characterisation of Fibres

Appendix A.2. Crystallinity of Polymers
References
- Ghasemlou, M.; Daver, F.; Ivanova, E.; Brkljaca, R.; Adhikari, B. Assessment of interfacial interactions between starch and non-isocyanate polyurethanes in their hybrids. Carbohydr. Polym. 2020, 246, 116656. [Google Scholar] [CrossRef]
- Miyashiro, D.; Hamano, R.; Umemura, K. A Review of Applications Using Mixed Materials of Cellulose, Nanocellulose and Carbon Nanotubes. Nanomaterials 2020, 10, 186. [Google Scholar] [CrossRef] [Green Version]
- Kose, O.; Tran, A.; Lewis, L.; Hamad, W.; MacLachlan, M. Unwinding a spiral of cellulose nanocrystals for stimuli-responsive stretchable optics. Nature Commun. 2019, 10, 510. [Google Scholar] [CrossRef] [PubMed]
- Potenza, M.; Cataldo, A.; Bovesecchi, G.; Corasaniti, S.; Coppa, P.; Bellucci, S. Graphene nanoplatelets: Thermal diffusivity and thermal conductivity by the flash method. AIP Adv. 2017, 7, 075214. [Google Scholar] [CrossRef] [Green Version]
- Ren, L.; Wang, M.; Lu, S.; Pan, L.; Xiong, Z.; Zhang, Z.; Peng, Q.; Li, Y.; Yu, J. Tailoring Thermal Transport Properties of Graphene Paper by Structural Engineering. Sci. Rep. 2019, 9, 4549. [Google Scholar] [CrossRef]
- Anufriev, R.; Ramiere, A.; Maire, J.; Nomura, M. Heat guiding and focusing using ballistic phonon transport in phononic nanostructures. Nat. Commun. 2017, 8, 15505. [Google Scholar] [CrossRef]
- Xue, Y.; Lofland, S.; Hu, X. Thermal Conductivity of Protein-Based Materials: A Review. Polymers 2019, 11, 456. [Google Scholar] [CrossRef] [Green Version]
- Huang, X.; Liu, G.; Wang, X. New Secrets of Spider Silk: Exceptionally High Thermal Conductivity and Its Abnormal Change under Stretching. Adv. Mater. 2012, 241, 1482–1486. [Google Scholar] [CrossRef]
- Mourran, A.; Zhang, H.; Vinokur, R.; Moller, M. Soft Microrobots Employing Nonequilibrium Actuation via Plasmonic Heating. Adv. Mater. 2017, 29, 1604825. [Google Scholar] [CrossRef]
- Hashimoto, T.; Morikawa, J.; Kurihara, T.; Tsuji, T. Frequency dependent thermal diffusivity of polymers by temperature wave analysis. Thermochim. Acta 1997, 304/305, 151–156. [Google Scholar] [CrossRef]
- Ryu, M.; Morikawa, J. Simultaneous measurements of anisotropic thermal diffusivity and thermal effusivity of liquid crystals using temperature wave analysis method. Jpn. J. Appl. Phys. 2016, 55, 111701. [Google Scholar] [CrossRef]
- Morikawa, J.; Hashimoto, T. Study on thermal diffusivity of poly(ethylene terephthalate) and poly(ethylene naphthalate). Polymer 1997, 38, 5397–5400. [Google Scholar] [CrossRef]
- Morikawa, J.; Orie, A.; Hashimoto, T.; Juodkazis, S. Thermal and optical properties of the femtosecond-laser-structured and stress-induced birefringent regions of sapphire. Opt. Express 2010, 18, 8300–8310. [Google Scholar] [CrossRef] [PubMed]
- Morikawa, J.; Orie, A.; Hashimoto, T.; Juodkazis, S. Thermal diffusivity in femtosecond-laser-structured micro-volumes of polymers. Appl. Phys. A. 2010, 98, 551–556. [Google Scholar] [CrossRef]
- Ghasemlou, M.; Daver, F.; Ivanova, E.P.; Adhikari, B. Use of Synergistic Interactions to Fabricate Transparent and Mechanically Robust Nanohybrid Materials Based on Starch, Non-Isocyanate Polyurethanes and Cellulose Nanocrystals. ACS Appl. Mater. Interfaces 2020. in review. [Google Scholar]
- Orie, A.; Morikawa, J.; Hashimoto, T. Micro-scale thermal diffusivity measurements of banded spherulites of poly-(l-lactic acid) using a thermo-electric micro sensor. Thermochim. Acta 2012, 532, 148–151. [Google Scholar] [CrossRef]
- Balcytis, A.; Ryu, M.; Juodkazis, S.; Morikawa, J. Micro-thermocouple on nanomembrane: Thermometer for nanoscale measurements. Sci. Rep. 2018, 8, 6324. [Google Scholar] [CrossRef] [Green Version]
- Morikawa, J.; Ryu, M.; Seniutinas, G.; Balcytis, A.; Maximova, K.; Wang, X.W.; Zamengo, M.; Ivanova, E.; Juodkazis, S. Thermal and optical properties of cicada wing. Langmuir 2016, 32, 4698–4703. [Google Scholar] [CrossRef]
- Honda, R.; Ryu, M.; Li, J.L.; Mizeikis, V.; Juodkazis, S.; Morikawa, J. Simple multi-wavelength imaging of birefringence:case study of silk. Sci. Rep. 2018, 8, 17652. [Google Scholar] [CrossRef]
- Shimazaki, Y.; Miyazaki, Y.; Takezawa, Y.; Nogi, M.; Abe, K.; Ifuku, S.; Yano, H. Excellent Thermal Conductivity of Transparent Cellulose Nanofiber/Epoxy Resin Nanocomposites. Biomacromolecules 2007, 8, 2976–2978. [Google Scholar] [CrossRef]
- Ryu, M.; Honda, R.; Cernescu, A.; Vailionis, A.; Balcytis, A.; Vongsvivut, J.; Li, J.L.; Linklater, D.P.; Ivanova, E.P.; Mizeikis, V.; et al. Nanoscale optical and structural characterisation of silk. Beilstein J. Nanotechnol. 2019, 10, 922–929. [Google Scholar] [CrossRef] [PubMed] [Green Version]
- Honda, R.; Ryu, M.; Moritake, M.; Balcytis, A.; Mizeikis, V.; Vongsvivut, J.; Tobin, M.J.; Appadoo, D.; Li, J.L.; Ng, S.H.; et al. Infrared Polariscopy Imaging of Linear Polymeric Patterns with a Focal Plane Array. Nanomaterials 2019, 9, 732. [Google Scholar] [CrossRef] [PubMed] [Green Version]
- Ryu, M.; Balčytis, A.; Wang, X.; Vongsvivut, J.; Hikima, Y.; Li, J.; Tobin, M.J.; Juodkazis, S.; Morikawa, J. Orientational Mapping Augmented Sub-Wavelength Hyper-Spectral Imaging of Silk. Sci. Rep. 2017, 7, 7419. [Google Scholar] [CrossRef] [PubMed] [Green Version]
- Morikawa, J.; Ryu, M.; Maximova, K.; Balcytis, A.; Seniutinas, G.; Fan, L.; Mizeikis, V.; Li, J.; Wang, X.; Zamengo, M.; et al. Silk fibroin as a water-soluble bio-resist and its thermal properties. RSC Adv. 2016, 6, 11863–11869. [Google Scholar] [CrossRef] [Green Version]
- Ryu, M.; Honda, R.; Reich, A.; Cernescu, A.; Li, J.L.; Hu, J.; Juodkazis, S.; Morikawa, J. Near-Field IR Orientational Spectroscopy of Silk. Appl. Sci. 2019, 9, 3991. [Google Scholar] [CrossRef] [Green Version]
- Ryu, M.; Kobayashi, H.; Balcytis, A.; Wang, X.; Vongsvivut, J.; Li, J.; Urayama, N.; Mizeikis, V.; Tobin, M.; Juodkazis, S. Nanoscale chemical mapping of laser-solubilized silk. Mater. Res. Express 2017, 4, 115028. [Google Scholar] [CrossRef] [Green Version]
- Patel, S.; Chabinyc, M. Anisotropies and the thermoelectric properties of semiconducting polymers. Appl. Polym. Sci. 2017, 134, 44403. [Google Scholar] [CrossRef]
- Lundgaard, S.; Ng, S.; Nishijima, Y.; Mazilu, M.; Juodkazis, S. Black metals: Optical absorbers. Micromachines 2020, 11, 256. [Google Scholar] [CrossRef] [Green Version]
- Seet, K.K.; Mizeikis, V.; Juodkazis, S.; Misawa, H. Three-Dimensional Horizontal Circular Spirals Photonic Crystals with stop gaps below 1 μm. Appl. Phys. Lett. 2006, 88, 221101. [Google Scholar] [CrossRef]
- Žukauskas, A.; Malinauskas, M.; Kadys, A.; Gervinskas, G.; Seniutinas, G.; Kandasamy, S.; Juodkazis, S. Black silicon: Substrate for laser 3D micro/nano-polymerization. Opt. Express 2013, 21, 6901–6909. [Google Scholar] [CrossRef]
- Kondo, T.; Juodkazis, S.; Mizeikis, V.; Matsuo, S.; Misawa, H. Fabrication of three-dimensional periodic microstructures in photoresist SU-8 by phase-controlled holographic lithography. New J. Phys. 2006, 8, 250. [Google Scholar] [CrossRef]
- Misawa, H.; Juodkazis, S. Photophysics and photochemistry of a laser manipulated microparticle. Progress Polymer Sci. 1999, 24, 665–697. [Google Scholar] [CrossRef]
- Zhou, J.; Fei, X.; Li, C.; Yu, S.; Hu, Z.; Xiang, H.; Sun, B.; Zhu, M. Integrating Nano-Cu2O@ZrP into In Situ Polymerized Polyethylene Terephthalate (PET) Fibers with Enhanced Mechanical Properties and Antibacterial Activities. Polymers 2019, 11, 113. [Google Scholar] [CrossRef] [PubMed] [Green Version]
- Mo, Z.; Zhang, H. The Degree of Crystallinity in Polymers by Wide-Angle X-Ray Diffraction (Waxd). J. Macromol. Sci. C 1995, 35, 555–580. [Google Scholar] [CrossRef]
- Arndt, U.W.; Creagh, D.C.; Deslattes, R.D.; Hubbell, J.H.; Indelicato, P.; Kessler, E.G.; Lindroth, E. International Tables for Crystallography; International Union of Crystallography: Weinheim, Germany, 2006; Chapter 4.2; pp. 191–258. [Google Scholar]


© 2020 by the authors. Licensee MDPI, Basel, Switzerland. This article is an open access article distributed under the terms and conditions of the Creative Commons Attribution (CC BY) license (http://creativecommons.org/licenses/by/4.0/).
Share and Cite
Fujisawa, H.; Ryu, M.; Lundgaard, S.; Linklater, D.P.; Ivanova, E.P.; Nishijima, Y.; Juodkazis, S.; Morikawa, J. Direct Measurement of Temperature Diffusivity of Nanocellulose-Doped Biodegradable Composite Films. Micromachines 2020, 11, 738. https://doi.org/10.3390/mi11080738
Fujisawa H, Ryu M, Lundgaard S, Linklater DP, Ivanova EP, Nishijima Y, Juodkazis S, Morikawa J. Direct Measurement of Temperature Diffusivity of Nanocellulose-Doped Biodegradable Composite Films. Micromachines. 2020; 11(8):738. https://doi.org/10.3390/mi11080738
Chicago/Turabian StyleFujisawa, Hiroki, Meguya Ryu, Stefan Lundgaard, Denver P. Linklater, Elena P. Ivanova, Yoshiaki Nishijima, Saulius Juodkazis, and Junko Morikawa. 2020. "Direct Measurement of Temperature Diffusivity of Nanocellulose-Doped Biodegradable Composite Films" Micromachines 11, no. 8: 738. https://doi.org/10.3390/mi11080738