Size Sorting of Exosomes by Tuning the Thicknesses of the Electric Double Layers on a Micro-Nanofluidic Device

 , ,
, ,
Abstract
:
1. Introduction
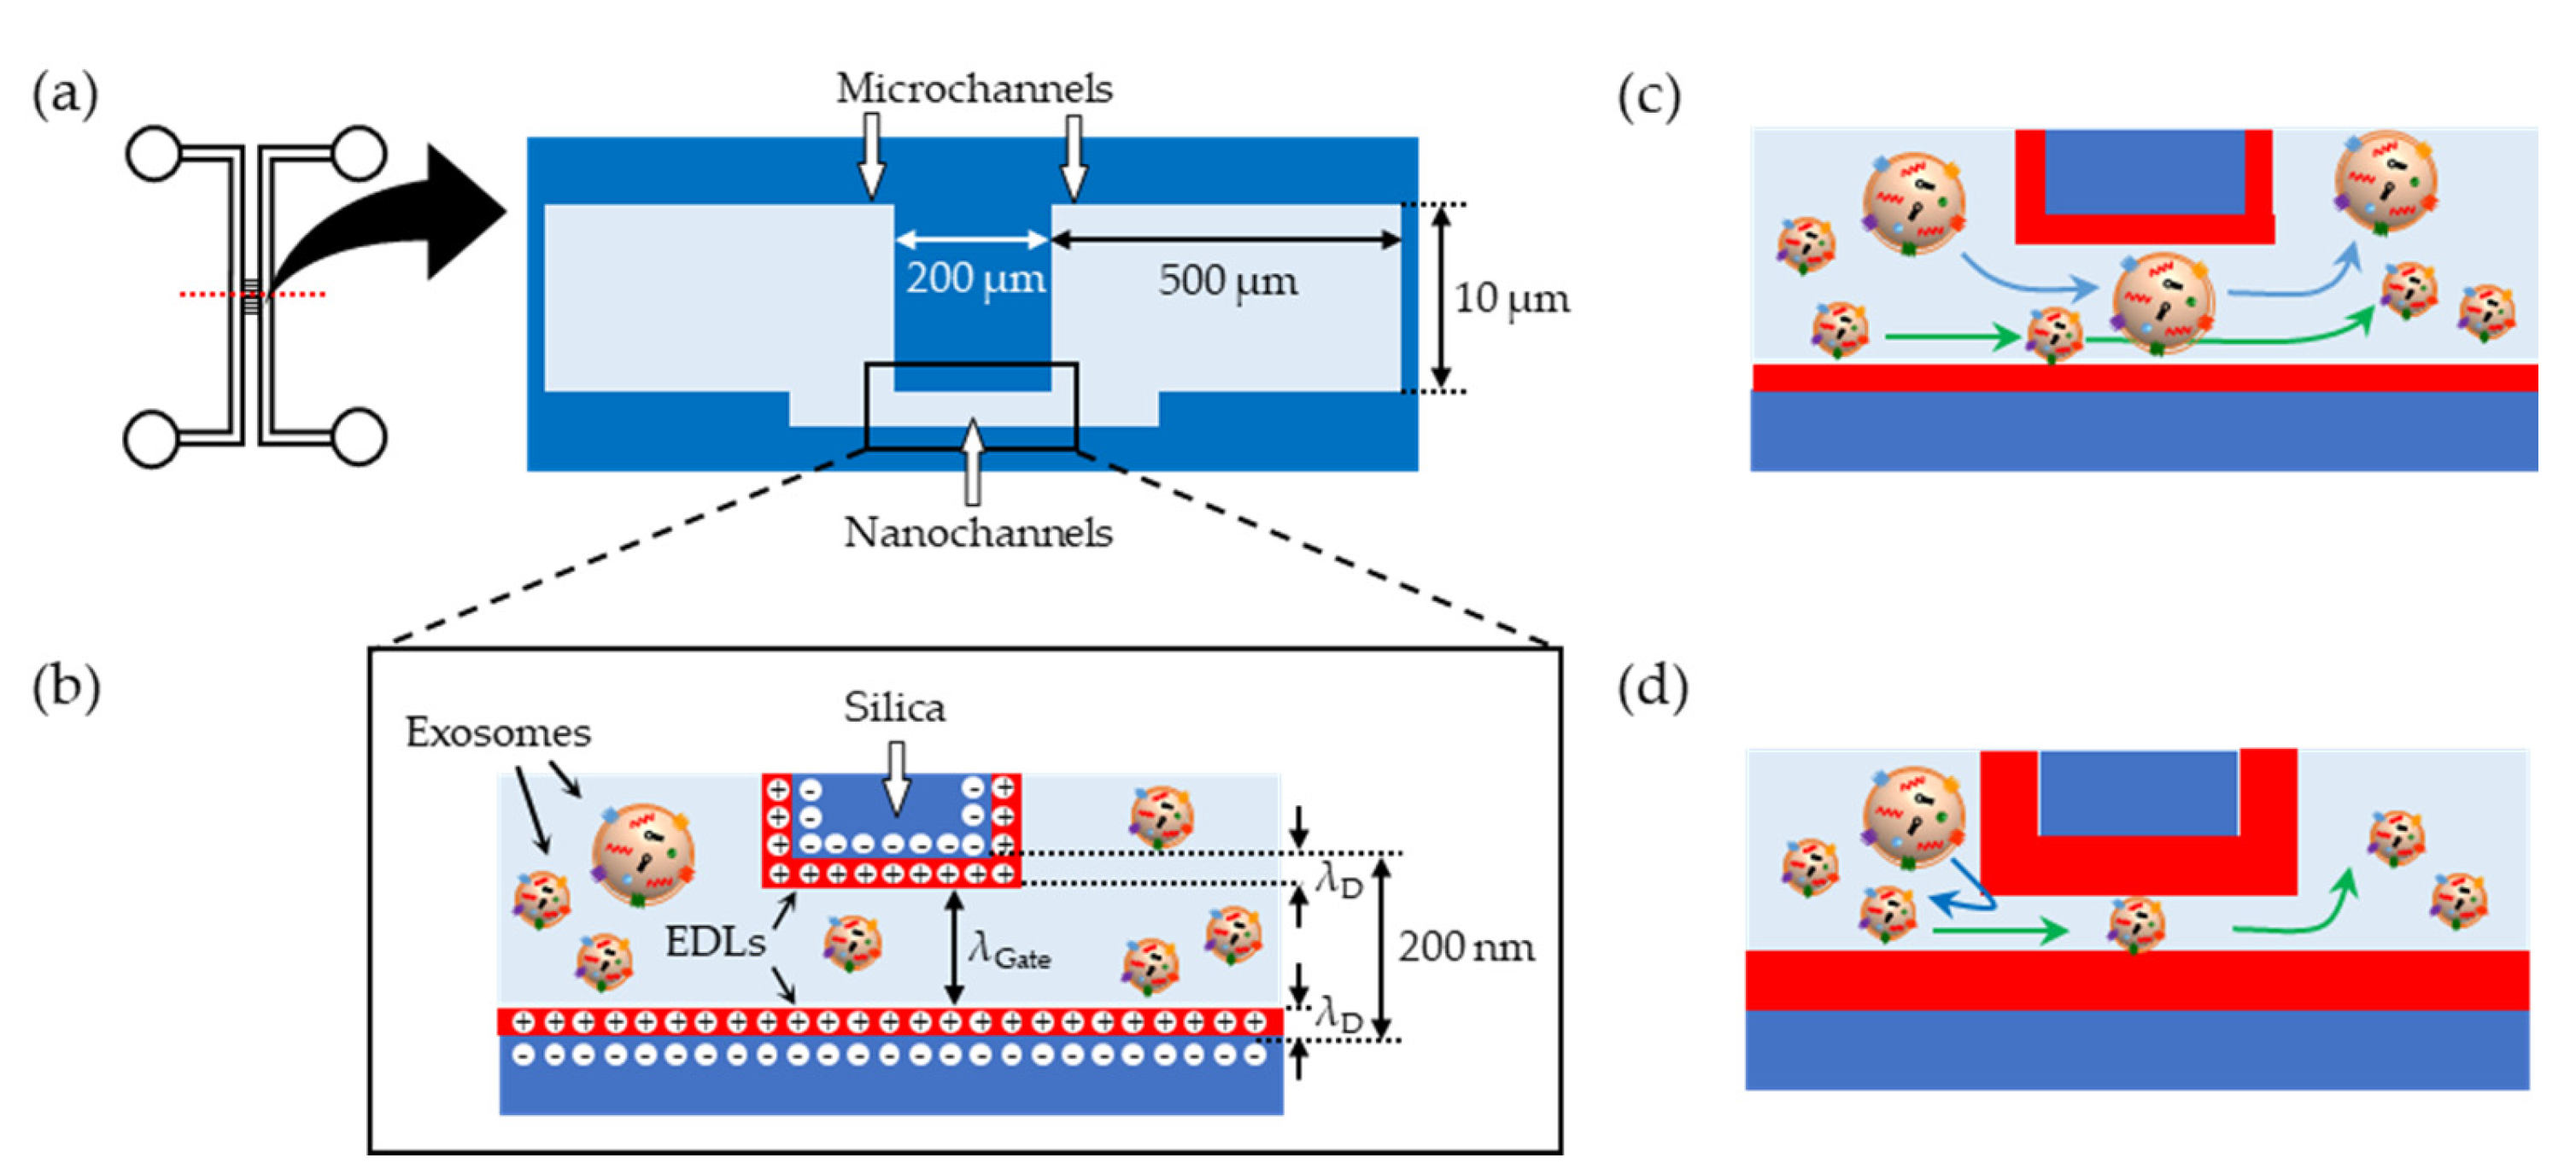
2. Theory
3. Materials and Methods
3.1. Materials
3.2. Apparatus
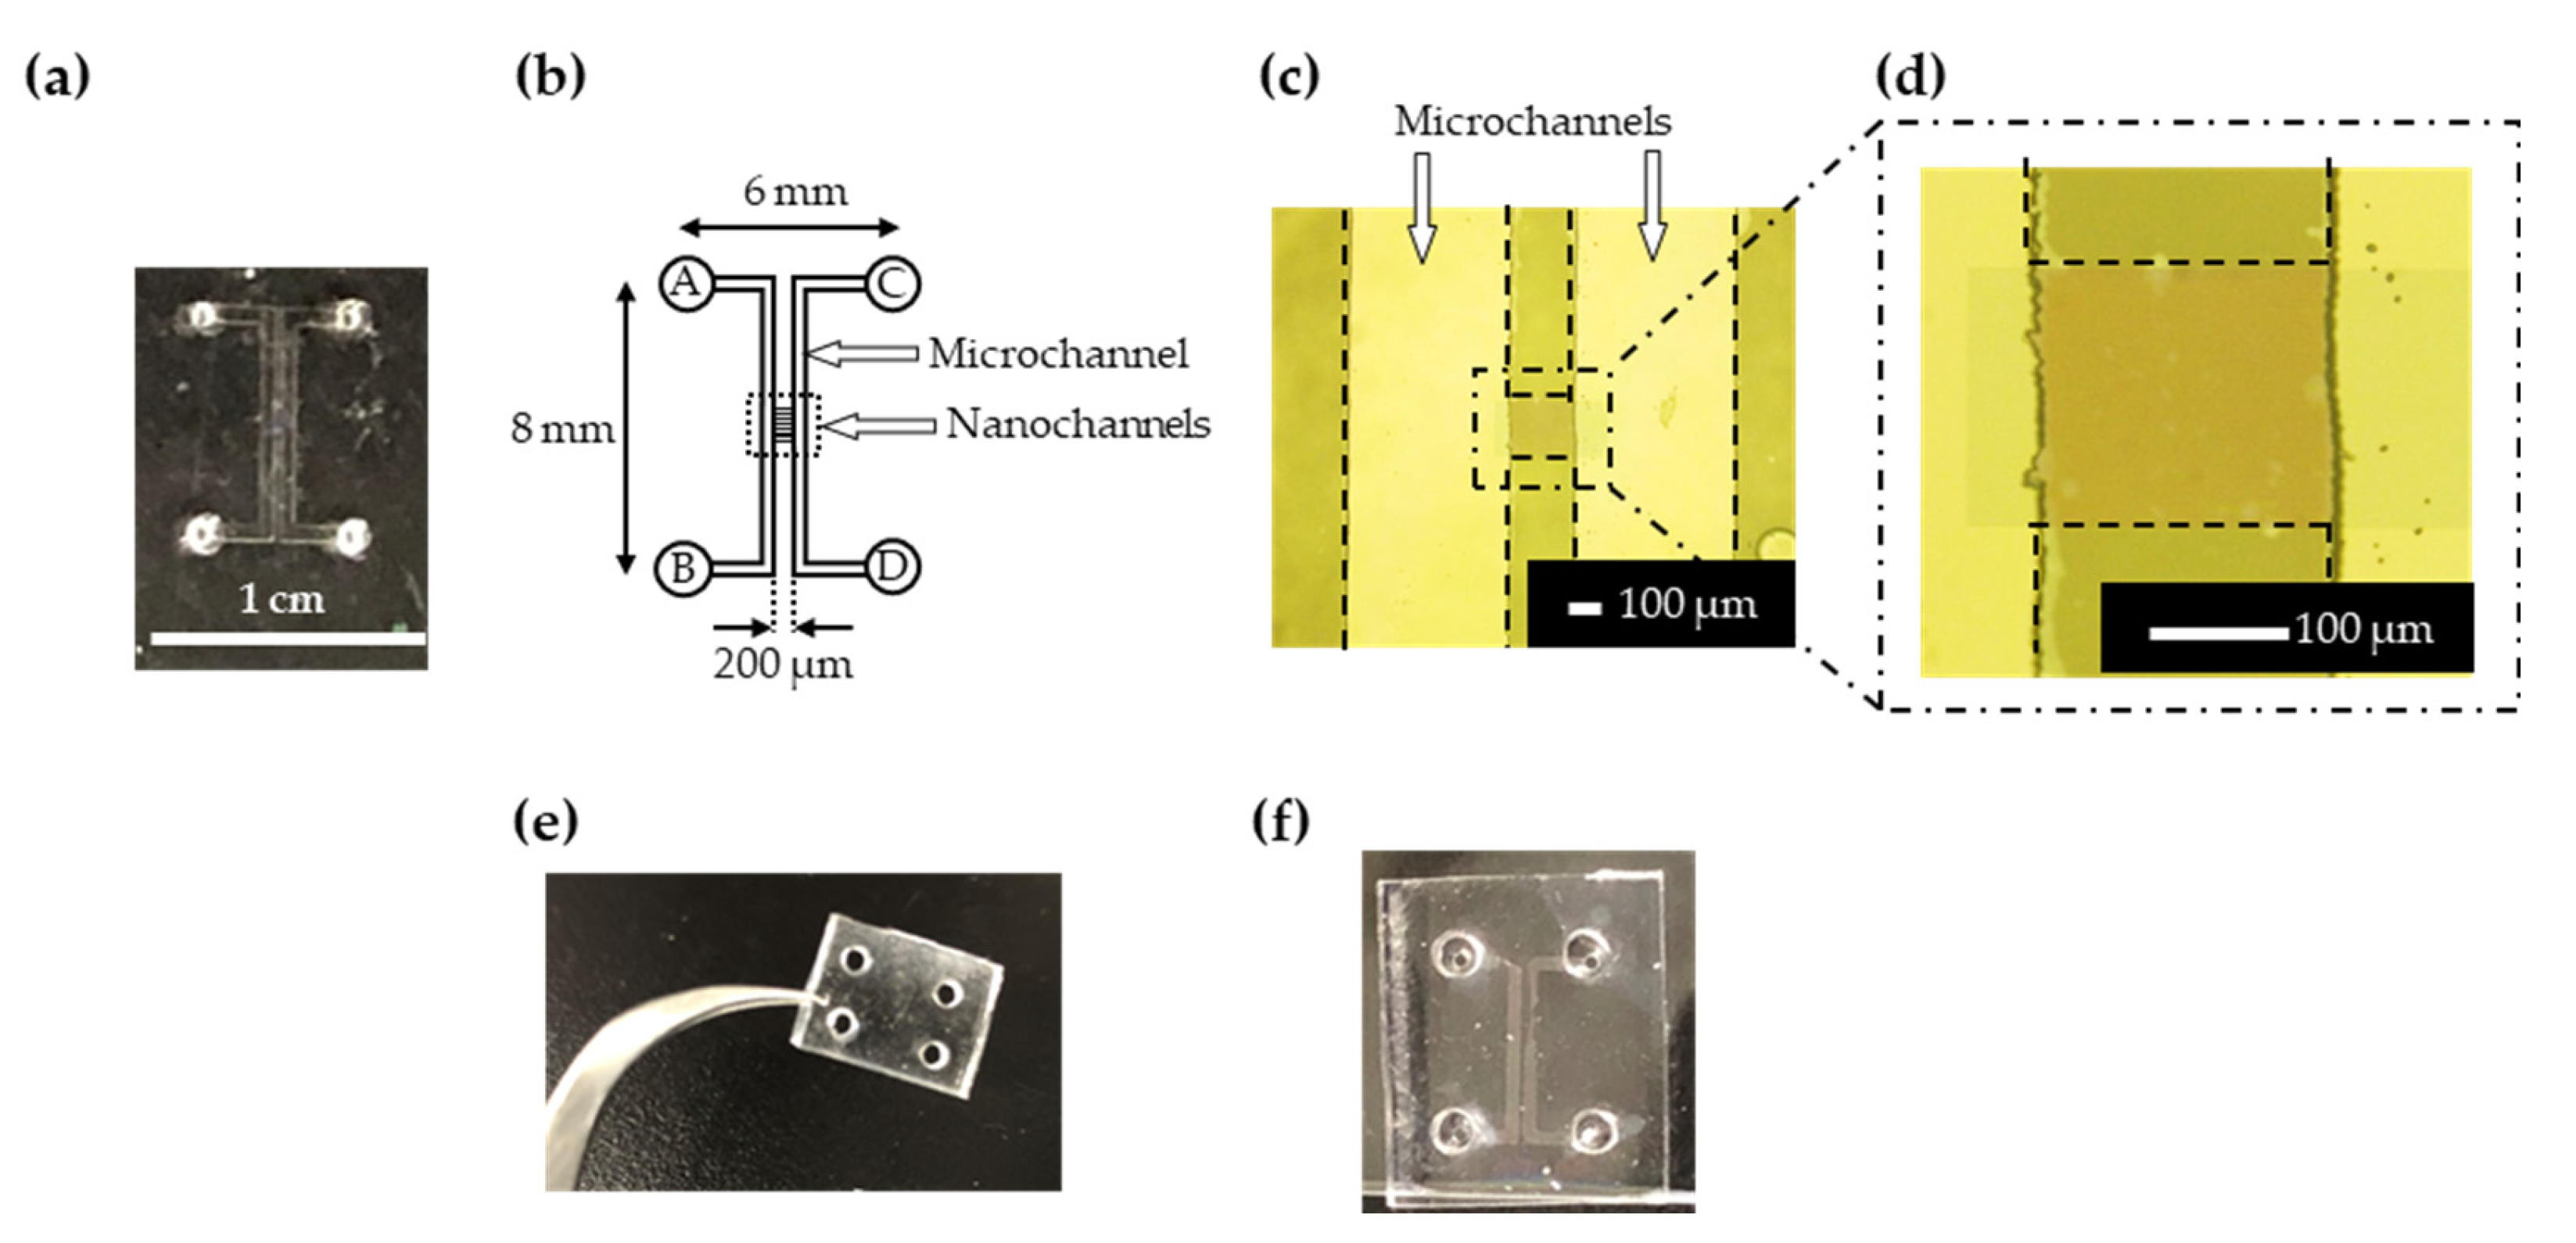
3.3. Fabrication of the Micro-Nanofluidic Device
3.4. Methods
3.4.1. Fluorescence Labeling of Exosomes
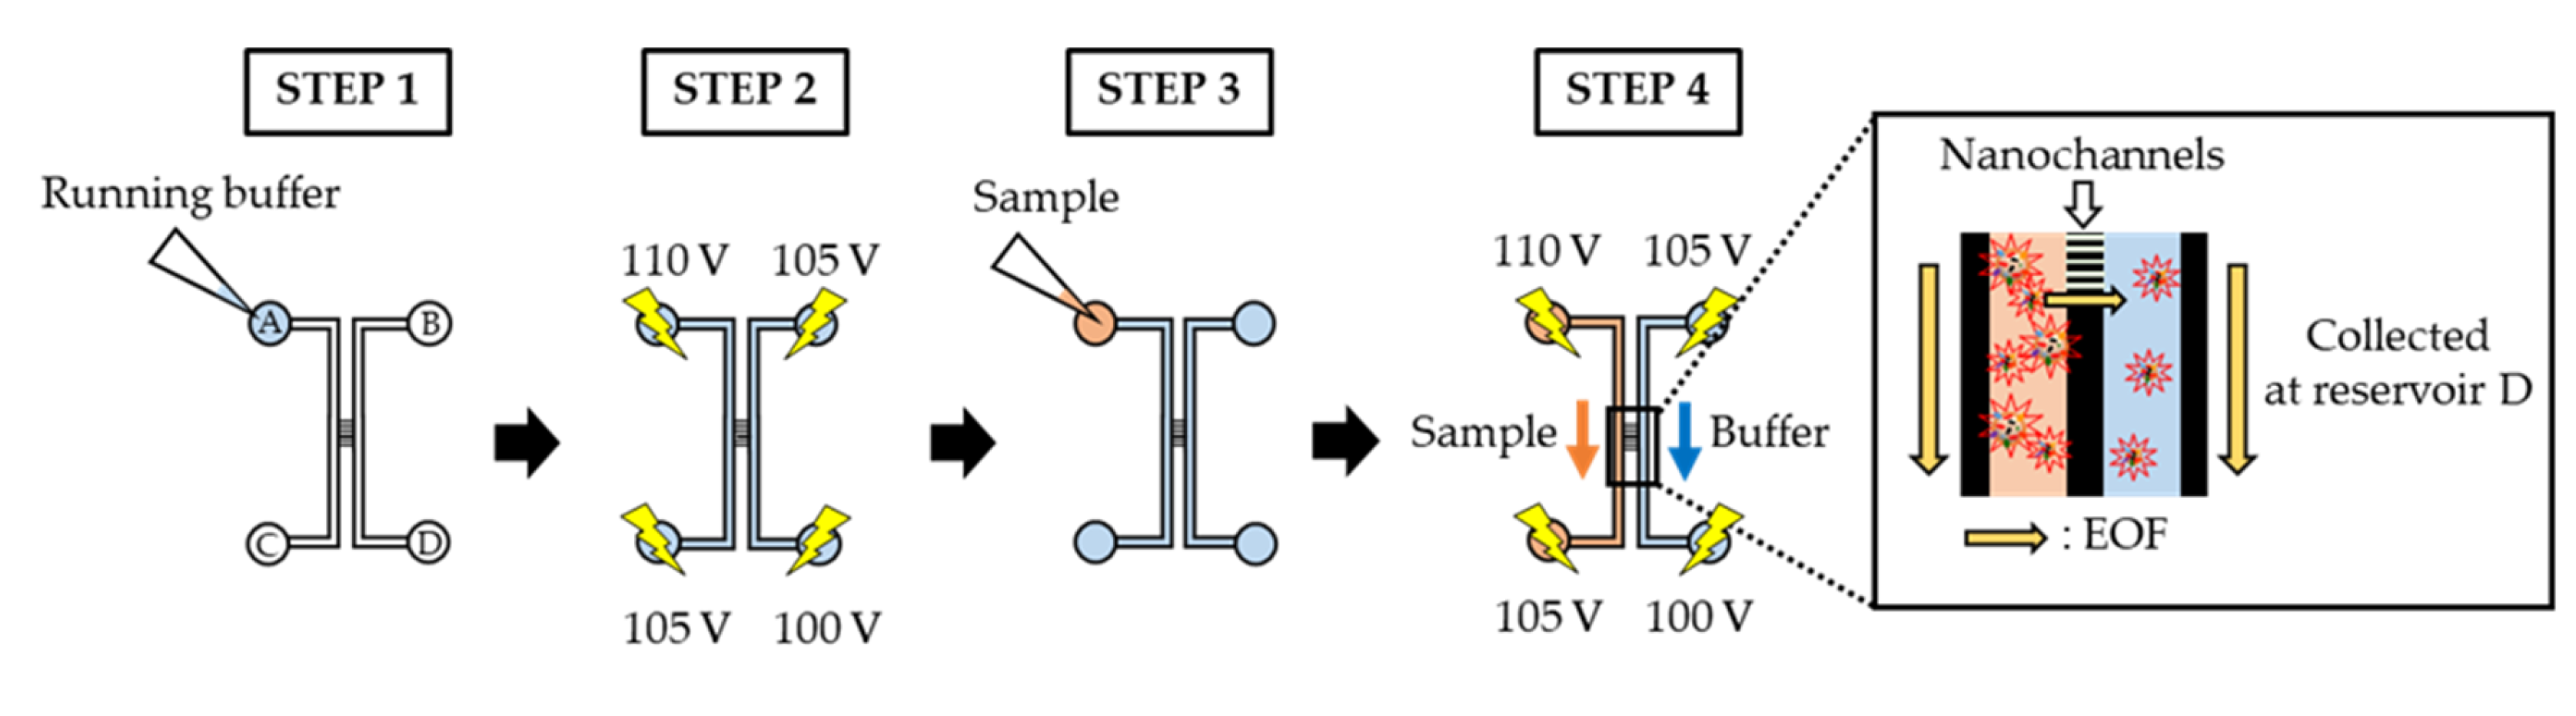
3.4.2. Electrokinetic Migration of Exosomes
3.4.3. Size Evaluation of Collected Exosomes
4. Results
5. Conclusions
Supplementary Materials
Author Contributions
Funding
Acknowledgments
Conflicts of Interest
References
- Raposo, G.; Stoorvogel, W. Extracellular vesicles: Exosomes, microvesicles, and friends. J. Cell. Biol. 2013, 200, 373–383. [Google Scholar] [CrossRef] [PubMed] [Green Version]
- Grӧrgy, B.; Szabó, T.G.; Pásztói, M.; Pál, Z.; Misják, P.; Aradi, B.; László, V.; Pállinger, É.; Pap, E.; Kittel, Á.; et al. Membrane vesicles, current state-of-the-art: Emerging role of extracellular vesicles. Cell. Mol. Life. Sci. 2011, 68, 2667–2688. [Google Scholar] [CrossRef] [PubMed] [Green Version]
- Braicu, C.; Tomuleasa, C.; Monroig, P.; Cucuianu, A.; Berindan-Neagoe, I.; Calin, G.A. Exosomes as divine messengers: Are they the Hermes of modern molecular oncology? Cell Death Differ. 2015, 22, 34–45. [Google Scholar] [CrossRef] [PubMed]
- De Jong, O.G.; Verhaar, M.C.; Chen, Y.; Vader, P.; Gremmels, H.; Posthuma, G.; Schiffelers, R.M.; Gucek, M.; van Balkom, B.W.M. Cellular stress conditions are reflected in the protein and RNA content of endothelial cell-derived exosomes. J. Extracell. Vesicles 2012, 1, 18396. [Google Scholar] [CrossRef]
- Valadi, H.; Ekström, K.; Bossios, A.; Sjöstrand, M.; Lee, J.J.; Lötvall, J.O. Exosome-mediated transfer of mRNAs and microRNAs is a novel mechanism of genetic exchange between cells. Nat. Cell. Biol. 2007, 9, 654–659. [Google Scholar] [CrossRef] [Green Version]
- Peinado, H.; Alečković, M.; Lavotshkin, S.; Matei, I.; Costa-Silva, B.; Moreno-Bueno, G.; Hergueta-Redondo, M.; Williams, C.; Garcia-Santos, G.; Ghajar, C.M.; et al. Melanoma exosomes educate bone marrow progenitor cells toward a pro-metastatic phenotype through MET. Nat. Med. 2012, 18, 883–891. [Google Scholar] [CrossRef] [Green Version]
- Kadota, T.; Fujita, Y.; Yoshioka, Y.; Araya, J.; Kuwano, K.; Ochiya, T. Extracellular Vesicles in Chronic Obstructive Pulmonary Disease. Int. J. Mol. Sci. 2016, 17, 1801. [Google Scholar] [CrossRef] [Green Version]
- Kosaka, N.; Yoshioka, Y.; Fujita, Y.; Ochiya, T. Versatile roles of extracellular vesicles in cancer. J. Clin. Investig. 2016, 126, 1163–1172. [Google Scholar] [CrossRef] [Green Version]
- Zomer, A.; Maynard, C.; Verweij, F.J.; Kamermans, A.; Schäfer, R.; Beerling, E.; Schiffelers, R.M.; de Wit, E.; Berenguer, J.; Ellenbroek, S.I.J.; et al. In Vivo Imaging Reveals Extracellular Vesicle-Mediated Phenocopying of Metastatic Behavior. Cell 2015, 161, 1046–1057. [Google Scholar] [CrossRef] [Green Version]
- Margolis, L.; Sadovsky, Y. The biology of extracellular vesicles: The known unknowns. PLoS Biol. 2019, 17, e3000363. [Google Scholar] [CrossRef]
- Kowal, J.; Arras, G.; Colombo, M.; Jouve, M.; Morath, J.P.; Primdal-Bengtson, B.; Dingli, F.; Loew, D.; Tkach, M.; Théry, C. Proteomic comparison defines novel markers to characterize heterogeneous populations of extracellular vesicle subtypes. Proc. Natl. Acad. Sci. USA 2016, 113, E968–E977. [Google Scholar] [CrossRef] [PubMed] [Green Version]
- Tkach, M.; Kowal, J.; Théry, C. Why the need and how to approach the functional diversity of extracellular vesicles. Phil. Trans. R. Soc. B 2017, 373, 20160479. [Google Scholar] [CrossRef] [PubMed]
- Gardiner, C.; Vizio, D.D.; Sahoo, S.; Théry, C.; Witwer, K.W.; Wauben, M.; Hill, A.F. Techniques used for the isolation and characterization of extracellular vesicles: Results of a worldwide survey. J. Extracell. Vesicles 2016, 5, 32945. [Google Scholar] [CrossRef] [PubMed]
- Patel, G.K.; Khan, M.A.; Zubair, H.; Srivastava, S.K.; Khushman, M.; Singh, S.; Singh, A.P. Comparative analysis of exosome isolation methods using culture supernatant for optimum yield, purity and downstream applications. Sci. Rep. 2019, 9, 5335. [Google Scholar] [CrossRef] [PubMed] [Green Version]
- Li, P.; Kaslan, M.; Lee, S.H.; Yao, J.; Gao, Z. Progress in Exosome Isolation Techniques. Theranostics 2017, 7, 789–804. [Google Scholar] [CrossRef] [PubMed]
- Baranyai, T.; Herczeg, K.; Onódi, Z.; Voszka, I.; Módos, K.; Marton, N.; Nagy, G.; Mäger, I.; Wood, M.J.; Andaloussi, S.E.; et al. Isolation of Exosomes from Blood Plasma: Qualitative and Quantitative Comparison of Ultracentrifugation and Size Exclusion Chromatography Methods. PLoS ONE 2015, 10, e0145686. [Google Scholar] [CrossRef] [Green Version]
- Böing, A.N.; van der Pol, E.; Grootemaat, A.E.; Coumans, F.A.W.; Sturk, A.; Nieuwland, R. Single-step isolation of extracellular vesicles by size-exclusion chromatography. J. Extracell. Vesicles 2014, 3, 23430. [Google Scholar] [CrossRef]
- Haywood, D.G.; Saha-Shah, A.; Baker, L.A.; Jacobson, S.C. Fundamental Studies of Nanofluidics: Nanopores, Nanochannels, and Nanopipets. Anal. Chem. 2015, 87, 172–187. [Google Scholar] [CrossRef] [Green Version]
- Salafi, T.; Zeming, K.K.; Zhang, Y. Advancements in microfluidics for nanoparticle separation. Lab Chip 2017, 17, 11–33. [Google Scholar] [CrossRef] [Green Version]
- Kazoe, Y.; Pihosh, Y.; Takahashi, H.; Ohyama, T.; Sano, H.; Morikawa, K.; Mawatari, K.; Kitamori, T. Femtoliter nanofluidic valve utilizing glass deformation. Lab Chip 2019, 19, 1686–1694. [Google Scholar] [CrossRef]
- Shimizu, H.; Toyoda, K.; Mawatari, K.; Terabe, S.; Kitamori, T. Femtoliter Gradient Elution System for Liquid Chromatography Utilizing Extended Nanofluidics. Anal. Chem. 2019, 91, 3009–3014. [Google Scholar] [CrossRef] [PubMed]
- Nakao, T.; Kazoe, Y.; Mori, E.; Morikawa, K.; Fukasawa, T.; Yoshizaki, A.; Kitamori, T. Cytokine analysis on a countable number of molecules from living single cells on nanofluidic devices. Analyst 2019, 144, 7200–7208. [Google Scholar] [CrossRef] [PubMed]
- Yang, F.; Liao, X.; Tian, Y.; Li, G. Exosome separation using microfluidic systems: Size-based, immunoaffinity-based and dynamic methodologies. Biotechnol. J. 2017, 12, 1600699. [Google Scholar] [CrossRef] [PubMed]
- Wang, W.; Luo, J.; Wang, S. Recent Progress in Isolation and Detection of Extracellular Vesicles for Cancer Diagnostics. Adv. Healthcare Mater. 2018, 7, 1800484. [Google Scholar] [CrossRef]
- Wunsch, B.H.; Smith, J.T.; Gifford, S.M.; Wang, C.; Brink, M.; Bruce, R.L.; Austin, R.H.; Stolovitzky, G.; Astier, Y. Nanoscale lateral displacement arrays for the separation of exosomes and colloids down to 20 nm. Nat. Nanotechnol. 2016, 11, 936–942. [Google Scholar] [CrossRef]
- Hattori, Y.; Shimada, T.; Yasui, T.; Kaji, N.; Baba, Y. Micro- and Nanopillar Chips for Continuous Separation of Extracellular Vesicles. Anal. Chem. 2019, 91, 6514–6521. [Google Scholar] [CrossRef]
- Zeming, K.K.; Thakor, N.V.; Zhang, Y.; Chen, C.-H. Real-time modulated nanoparticle separation with an ultra-large dynamic range. Lab Chip 2016, 16, 75–85. [Google Scholar] [CrossRef]
- Wang, Y.-C.; Stevens, A.L.; Han, J. Million-fold Preconcentration of Proteins and Peptides by Nanofluidic Filter. Anal. Chem. 2005, 77, 4293–4299. [Google Scholar] [CrossRef]
- Fu, J.; Schoch, R.B.; Han, J. A patterned anisotropic nanofluidic sieving structure for continuous-flow separation of DNA and proteins. Nat. Nanotechnol. 2007, 2, 121–128. [Google Scholar] [CrossRef] [Green Version]
- Regtmeier, J.; Käsewieter, J.; Everwand, M.; Anselmetti, D. Continuous-flow separation of nanoparticles by electrostatic sieving at a micro-nanofluidic interface. J. Sep. Sci. 2011, 34, 1180–1183. [Google Scholar] [CrossRef]
- Kirby, B.J.; Hasselbrink, E.F., Jr. Zeta potential of microfluidic substrates: 1. Theory, experimental techniques, and effects on separations. Electrophoresis 2004, 25, 187–202. [Google Scholar] [CrossRef] [PubMed]
- Akagi, T.; Kato, K.; Hanamura, N.; Kobayashi, M.; Ichiki, T. Evaluation of desialylation effect on zeta potential of extracellular vesicles secreted from human prostate cancer cells by on-chip microcapillary electrophoresis. Jpn. J. Appl. Phys. 2014, 53, 06JL01. [Google Scholar] [CrossRef]
- Mawatari, K.; Kazoe, Y.; Shimizu, H.; Pihosh, Y.; Kitamori, T. Extended-Nanofluidics: Fundamental Technologies, Unique Liquid Properties, and Application in Chemical and Bio Analysis Methods and Devices. Anal. Chem. 2014, 86, 4068–4077. [Google Scholar] [CrossRef] [PubMed]
- Morikawa, K.; Matsushita, K.; Tsukahara, T. Rapid Plasma Etching for Fabricating Fused Silica Microchannels. Anal. Sci. 2017, 33, 1453–1456. [Google Scholar] [CrossRef] [PubMed] [Green Version]
- Ohta, R.; Mawatari, K.; Takeuchi, T.; Morikawa, K.; Kitamori, T. Detachable glass micro/nanofluidic device. Biomicrofluidicsy 2019, 13, 024104. [Google Scholar] [CrossRef]
- Vogel, R.; Coumans, F.A.; Maltesen, R.G.; Böing, A.N.; Bonnington, K.E.; Broekman, M.L.; Broom, M.F.; Buzás, E.I.; Christiansen, G.; Hajji, N.; et al. A Standardized Method to Determine the Concentration of Extracellular Vesicles Using Tunable Resistive Pulse Sensing. J. Extracell. Vesicles 2016, 5, 31242. [Google Scholar] [CrossRef]
- Akers, J.C.; Ramakrishnan, V.; Nolan, J.P.; Duggan, E.; Fu, C.C.; Hochberg, F.H.; Chen, C.C.; Carter, B.S. Comparative Analysis of Technologies for Quantifying Extracellular Vesicles (EVs) in Clinical Cerebrospinal Fluids (CSF). PLoS ONE 2016, 11, e0149866. [Google Scholar] [CrossRef]
- Precis, A.; Schoch, R.B.; Renaud, P. Ionic Transport Phenomena in Nanofluidics: Experimental and Theoretical Study of the Exclusion-Enrichment Effect on a Chip. Nano Lett. 2005, 6, 1147–1155. [Google Scholar]
- Schoch, R.B.; Han, J.; Renaud, P. Transport phenomena in nanofluidics. Rev. Mod. Phys. 2008, 80, 839–883. [Google Scholar] [CrossRef] [Green Version]
- Tsukahara, T.; Hibara, A.; Ikeda, Y.; Kitamori, T. NMR Study of Water Molecules Confined in Extended Nanospaces. Angew. Chem. Int. Ed. 2007, 46, 1180–1183. [Google Scholar] [CrossRef]
- Chen, Z.; Wang, Y.; Wang, W.; Li, Z. Nanofluidic electrokinetics in nanoparticle crystal. Appl. Phys. Lett. 2009, 95, 102105. [Google Scholar] [CrossRef]
- Tsukahara, T.; Kuwahata, T.; Hibara, A.; Kim, H.-B.; Mawatari, K.; Kitamori, T. Electrochemical studies on liquid properties in extended nanospaces using mercury microelectrodes. Electrophoresis 2009, 30, 3212–3218. [Google Scholar] [CrossRef] [PubMed]
- Smith, J.T.; Wunsch, B.H.; Dogra, N.; Ahsen, M.E.; Lee, K.; Yadav, K.K.; Weil, R.; Pereira, M.A.; Patel, J.V.; Duch, E.A.; et al. Integrated nanoscale deterministic lateral displacement arrays for separation of extracellular vesicles from clinically-relevant volumes of biological samples. Lab Chip 2018, 18, 3913–3925. [Google Scholar] [CrossRef] [PubMed]
- Nakase, I.; Futaki, S. Combined treatment with a pHsensitive fusogenic peptide and cationic lipids achieves enhanced cytosolic delivery of exosomes. Sci. Rep. 2015, 5, 10112. [Google Scholar] [CrossRef]


| Experimental Condition (Running Buffer Used) | Measurement Condition | |
|---|---|---|
| Dilution Buffer | Rate of Dilution | |
| (i) 1 × 10⁻⁵ M HEPES * | 2×PBS | × 5–100 |
| (ii) 1 × 10⁻⁴ M HEPES | 1×PBS | |
| (iii) 1 × 10⁻³ M HEPES | ||
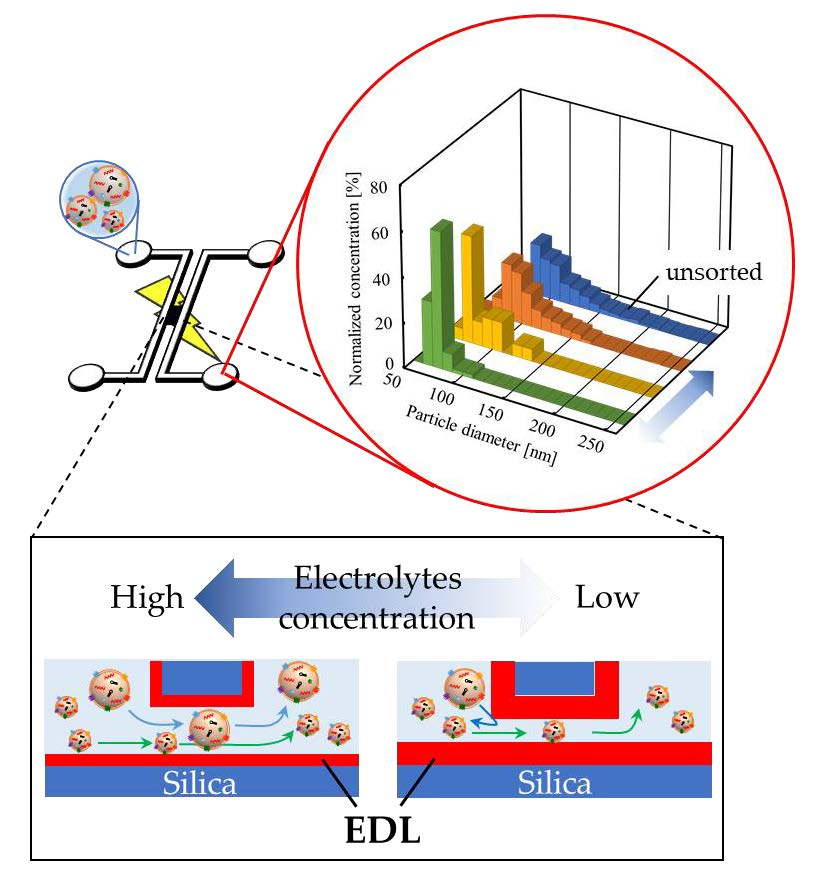
| unsorted ** | ||
| Size (nm) | Experimental Condition | ||||
|---|---|---|---|---|---|
| (i) 1 × 10⁻⁵ M HEPES | (ii) 1 × 10⁻⁴ M HEPES | (iii) 1 × 10⁻³ M HEPES | Unsorted | ||
| Exosomes | d90 | 81 | 112 | 142 | 153 |
| dmax | 102 | 138 | 180 * | 434 | |
| Nanogates | λGate,cal | 8 | 139 | 181 | - |
| λGate,exp | 70–140 | - | |||
© 2020 by the authors. Licensee MDPI, Basel, Switzerland. This article is an open access article distributed under the terms and conditions of the Creative Commons Attribution (CC BY) license (http://creativecommons.org/licenses/by/4.0/).
Share and Cite
Fujiwara, S.; Morikawa, K.; Endo, T.; Hisamoto, H.; Sueyoshi, K. Size Sorting of Exosomes by Tuning the Thicknesses of the Electric Double Layers on a Micro-Nanofluidic Device. Micromachines 2020, 11, 458. https://doi.org/10.3390/mi11050458
Fujiwara S, Morikawa K, Endo T, Hisamoto H, Sueyoshi K. Size Sorting of Exosomes by Tuning the Thicknesses of the Electric Double Layers on a Micro-Nanofluidic Device. Micromachines. 2020; 11(5):458. https://doi.org/10.3390/mi11050458
Chicago/Turabian StyleFujiwara, Satoko, Kyojiro Morikawa, Tatsuro Endo, Hideaki Hisamoto, and Kenji Sueyoshi. 2020. "Size Sorting of Exosomes by Tuning the Thicknesses of the Electric Double Layers on a Micro-Nanofluidic Device" Micromachines 11, no. 5: 458. https://doi.org/10.3390/mi11050458