2.1. Microfluidic Structure Design
The microfluidic structure consists of two chambers, i.e., a reaction chamber and a temperature monitor chamber. In
Figure 2, a close-up of the final chip is shown. For clarity reasons, the two microfluidic structures are colored with food coloring dye. The reaction chamber is based on the work of Bruijns et al. [
36] and its dimensions are chosen in such way that the internal volume of the reaction chamber is the same as the reaction volume of the used Illustra GenomiPhi V2 DNA amplification kit (GE Healthcare Life Sciences, Eindhoven, The Netherlands) together with the EvaGreen dye solution (Biotium, Fremont, CA, USA), while maintaining an as low as possible surface-area-to-volume ratio [
44]. Using SolidWorks 2018 computer-aided design (CAD) software (Dassault Systemes, Vélizy-Villacoublay, France), the 3D image of the chip is drawn and with the use of the AutoDesk HSMWorks computer-aided manufacturing (CAM) plug-in (Autodesk Inc., San Rafael, CA, USA), this image is transferred into a computer numerical control (CNC) milling code. The total chip size is 3 cm by 3 cm and contains an inlet and outlet of 1.5 mm diameter. The inlet and outlet are of such size that the reaction chamber can be filled using pipette tips. In between the inlet and outlet, a rectangular reaction chamber of 10 mm by 3 mm is located. Two trapezoid structures are placed in the tapered channels between the inlet/outlet and the chamber. The function of these trapezoids is twofold: First, they minimize the dead volume between the inlet/outlet and the reaction chamber, locating as much as possible of the reaction mixture inside the chamber. Second, they provide support for the chamber closure. A stadium-shaped channel of 1.5 mm wide and 1.0 mm deep is located next to the reaction chamber, in such way that this channel is also covered by the heater. This channel serves as temperature monitor chamber. A thermocouple is inserted in this channel for real-time monitoring of the temperature inside the chip. This way, a more accurate temperature of the reaction mixture inside the chip can be obtained. Via a feedback loop, the input potential can be changed when required. In
Figure 3, the SolidWorks design of the chamber-based chip with both chambers is shown. In
Figure A1, in
Appendix A, the technical drawing of the chip can be found.
2.2. Resistive Heater Structure Design
A resistive heater structure will be placed at the bottom side of the chip using shadow masks and a metal deposition method capable of being used for large-scale production. A meandering heater design is chosen, as this minimizes the input power required to heat up the heater. This is evident from Equation (
1), which is the relation between Joule’s law, Ohm’s law, and Pouillet’s law.
Here,
P is the input power,
is the cross-sectional area of the resistor,
V is the input potential,
is the resistivity of resistor material
i, and
is the length of the resistor. This makes a meandering structure, or any other narrow line structure, a quite often used pattern for heaters or electrodes within micro-electromechanical structures and microfluidics [
26,
29,
54,
55].
MDA is being done at temperatures of around 30 °C [
50], which is lower than, for example, temperatures required for HDA (64 °C) [
9] or LAMP (65 °C) [
11] and the required PCR temperatures of Chung et al. (95 °C, 54 °C, and 72 °C) [
28]. However, most amplification methods require a DNA denaturation step at 95 °C. Equation (
2) is used to make an estimation of the required heating powers for a COC–H
2O–COC stack (in the real device, the upper plate is an adhesive PCR foil, but the thermal properties of this foil are unknown).
Here,
is defined as the sum of all thermal resistances in series:
Here,
P is the required power,
is the temperature difference,
is the thermal resistance,
is the heated area,
h is the convective heat transfer coefficient (being 10 W m
−2 K
−1 for convection to air [
56]),
is the thermal conductivity of substance
i, and
is the thickness of substance
i. Values for
can be found in
Appendix B. From Equation (
3), the product
can be defined as the sum of
and
. Based on this summation, one can conclude that the convective heat transfer to the air is the most present heat transfer mechanism within the system (begin almost a factor 100 higher than the heat lost in the COC and H
2O). This is also evident from solving Equation (
2) for every individual temperature differences within the system and also including convective heat transfer directly from the heater into the air. If a heated area of 7.7 mm by 10.1 mm is assumed, which covers both the reaction chamber and the temperature monitor chamber, and a system consisting of 1 mm COC–0.5 mm H
2O–0.1 mm COC is assumed, than the heater temperatures and powers in
Table 1 are required. These are all in the workable range when a COC of a proper grade is chosen (e.g., TOPAS 6017 has a
of 170 °C). The only side note here is that at higher temperatures, the temperature gradient through the system also becomes larger. This can be eliminated by using double-sided heating, like Chung et al. [
28].
To determine the optimal heater width and heater spacing in the heated area, a parametric study using COMSOL Multiphysics 5.3a finite element method simulations with the
Heat Transfer in Solids (ht) package is done (COMSOL Inc., Burlington, MA, USA). The model is designed such that it consists of two parallel rectangles of COC (in the real device, the upper plate is an adhesive PCR foil) with H
2O in between. The meandering heater are assumed to be lines at the bottom side of the layer stack. This reduces the required complexity of the mesh tremendously, as the heater in the real device will be approximately 100 nm in thickness. The heater temperature is set at a constant temperature of 303.15 K. This makes the heater material independent and the model purely focused on the heat transfer inside the COC–H
2O–COC stack. All used values and equations are given in
Appendix B. The layer stack is meshed with an extremely fine mapped mesh consisting of 280.650 elements with average quality of 0.9966. A parametric sweep from 0.3 mm to 2.0 mm, in steps of 0.1 mm, is done for both the heater width (
) and the heater spacing (
), giving 324 combinations. The simulations are solved by using the fully coupled, direct Pardiso solver on a custom-build and 40% CPU overclocked simulation computer, containing the equipment listed in
Table 2.
To validate whether the metal tracks can withstand the required current, a quick analysis is done for the four extreme cases (i.e.,
of 0.3 mm and 2.0 mm and
of 0.3 mm and 2.0 mm). In the same heated area of 7.7 mm by 10.1 mm a 100 nm (
) thick heater track consisting of rectangles is assumed. The total amount of large and smaller interconnecting rectangles for all 4 cases is estimated in
Table 3. Based on the polynomial approximation equations for the resistivity of Au and Pt (
, where
i is either Au or Pt) which COMSOL MultiPhysics 5.3a uses (Equations (
4) and (
5)) and Equation (
6) an estimation is made for the required input currents and the created current densities (defined as
, in A m
−2) when the heater is operated at 129.4 mW to get a temperature of 95 °C. These estimations are also given in
Table 3.
In which is the resistivity, T is the temperature, is the current going through the resistor, is the input power, R is the resistance of the resistor, is the length of the resistor, and is the cross-sectional area of the resistor defined as width times thickness (). The subscript i denotes the material, being Au or Pt.
All these current densities are below the critical current densities for Au and Pt, which are around 10
10 A m
−2 [
57] and 10
11 A m
−2 [
58], respectively. Therefore, any possible combination of heater width and heater spacing will give a resistive that can withstand its operation.
2.3. Fabrication
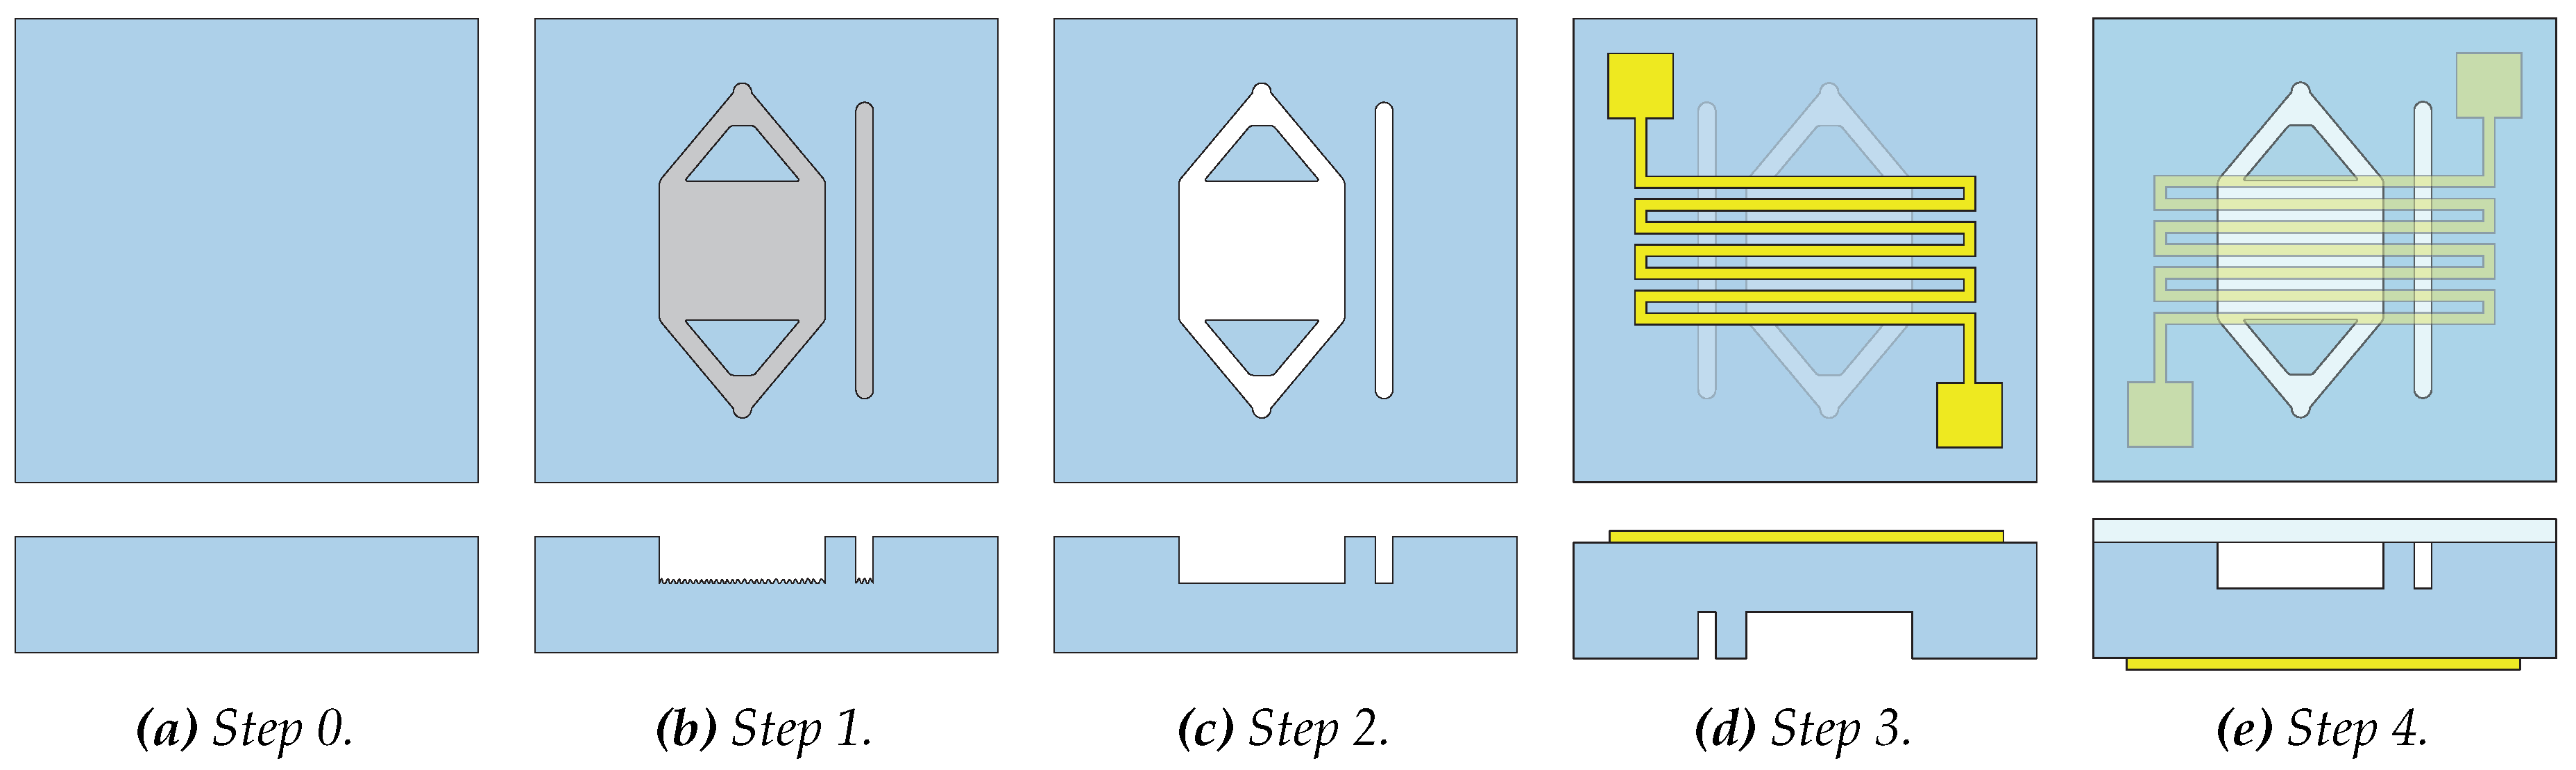
COC [
42] is chosen as polymeric substrate because of its biocompatibility, optical transparency, physical resistance, chemical resistance, electrical insulation, and price. This copolymer consists of two monomers, an apolar bridged cyclic hydrocarbon (norbornene) monomer and a linear, lesser apolar, linear ethene monomers. Injection molded COC plates (10 cm by 10 cm and 1.5 mm thickness) of the grade TOPAS 6017 (see
Figure 4a) are obtained via Kunststoff-Zentrum Leipzig (Kunststoff-Zentrum gGmbH, Leipzig, Germany). This grade is chosen because of its high norbornene content, giving it a relatively high
of 170 °C. This minimizes the chance of melting during the milling process and decreases the chance of heater failure due to a deforming substrate during operation of the heater [
28]. The microfluidic structure explained in
Section 2.1 is CNC-milled using a Mikron WF 21C milling machine (Mikron SA Agno, Agno, Switzerland), as can be seen in
Figure 4b. Milling is a very fast prototyping technique and chosen because of its flexibility [
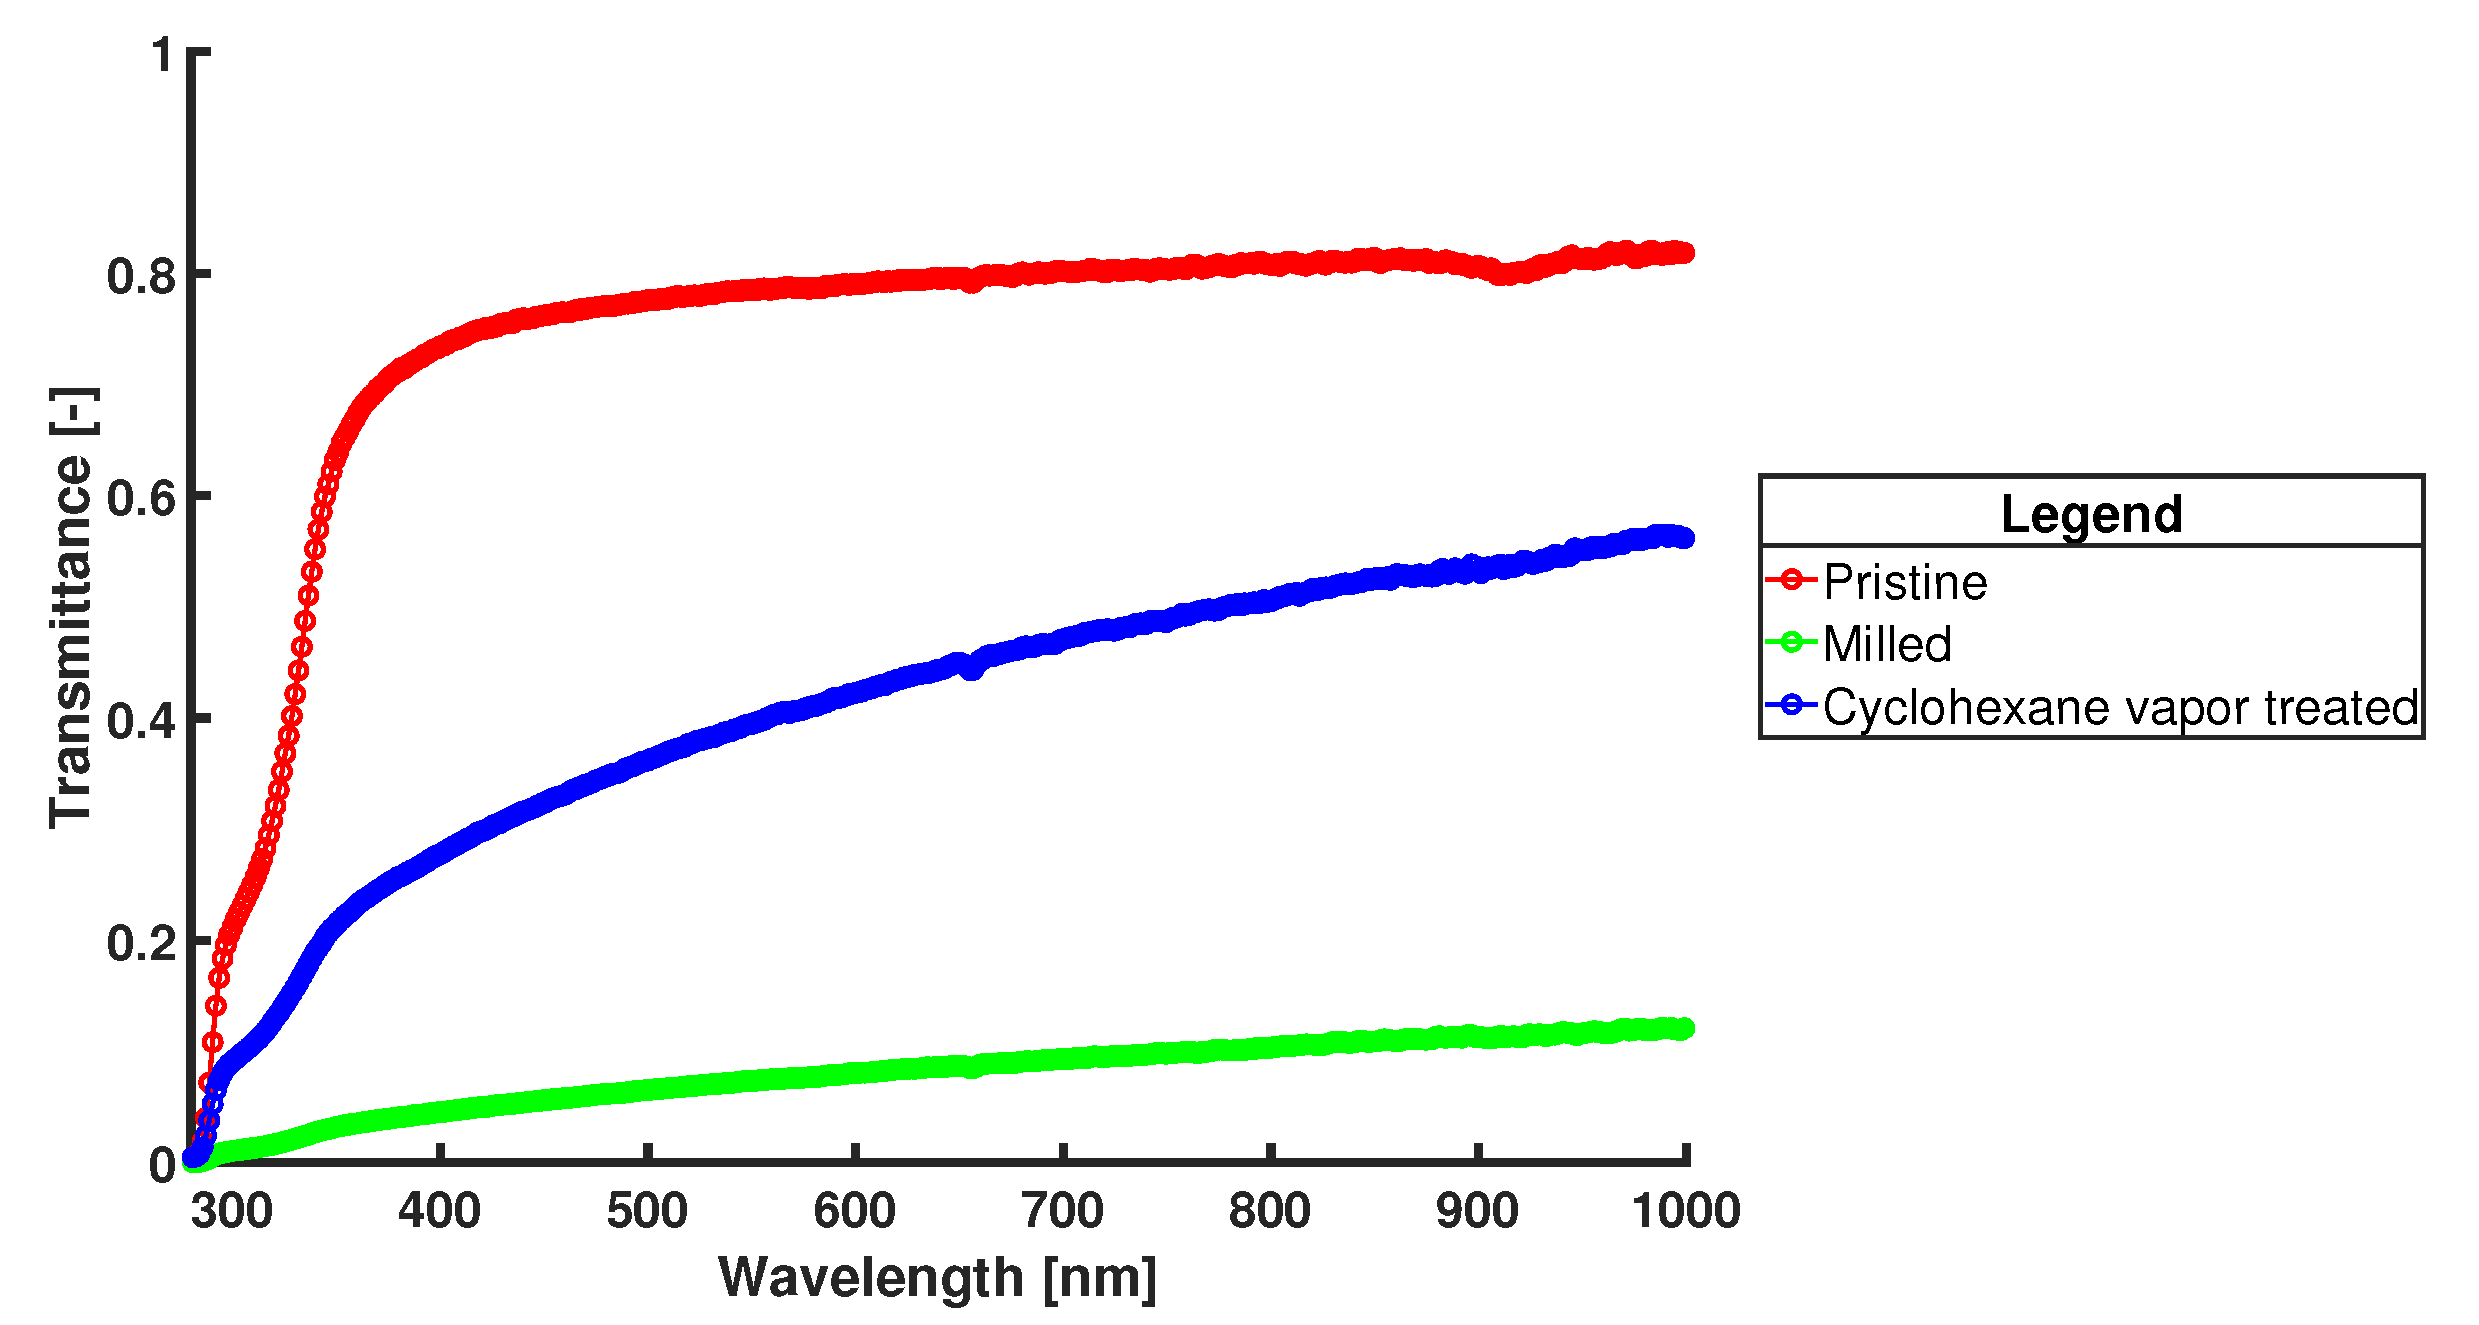
41]. The milling creates a surface roughness, which increases the surface-area-to-volume ratio. This roughness increases the chance of inhibition during the amplification due to the interaction of the used chemicals with the surface [
44]. It also causes a considerable loss of optical transparency, which could obstruct the potential use of in situ fluorescence detection in future devices. Therefore, a chemical post-treatment with cyclohexane vapor is done (see
Figure 4c). Such treatment dissolves a thin outer layer of the COC substrate and causes reflowing of the surface roughness due to the surface tension of the material, restoring the optical transparency and reducing the surface roughness [
59].
CNC milling and subsequent cyclohexane vapor post-treatment are less suitable for mass production. However, COC has the possibility of being injection molded [
42]. The used substrates are made using this method. This is a large-scale production method and could lower the costs of the eventual product and it eliminates the cyclohexane vapor post-treatment, as injection-molded chips would have the same optical transparency as the pristine substrates. Guckenberger et al. mention production costs of
$ 47 per simple microfluidic device when only 50 pieces are fabricated [
41]. This price is expected to drop drastically when large numbers are fabricated.
A metal is deposited on the backside of the substrate using two laser-cut metal (Mo) shadow masks to outline the shape of the resistive heater (see
Figure 4d). Mo has a smaller coefficient of thermal expansion than stainless steel, and therefore gives less deformation during the deposition. Metals of interest are Au or Pt, which are commonly used metals to function as resistive heaters [
54]. The deposition methods studied are DC magnetron sputtering using a custom-build machine (Techno Centrum voor Onderwijs en Onderzoek, University of Twente, Enschede, The Netherlands) and e-beam physical vapor deposition (evaporation) using a Balzers BAK 600 CE (Oerlikon Balzers limited, Balzers, Principality of Liechtenstein). Both deposition methods are capable of large-scale production, which will lower the production costs in the large-volume production stage. The metal and deposition method will be chosen based on the metal adhesion performances on the COC substrate, which is studied using the Scotch tape test [
60,
61], and the resistance versus temperature behavior in the range 20 °C to 100 °C, which is measured in a Heraeus T5025 oven (Heraeus Holding GmbH, Hanau, Germany), customized with electrical readout and connected to a custom-build National Instruments LabVIEW program (Austin, TX, USA).
2.4. Operation
The chambers with the resistive heater on the backside, are intensively cleaned by rinsing with acetone, MilliQ DI water, ethanol, and isopropanol [
45]. Each cleaning step was done 3 times and the chips are blow dried using N
2 gas. After drying, the chambers are closed using Microseal “B” PCR plate sealing foil from Bio-Rad (Bio-Rad Inc., Hercules, CA, USA), which is cut in the proper size and manually attached on top of the substrate (see
Figure 4e). The DNA, reactants and buffer solutions from the Illustra GenomiPhi V2 DNA amplification kit and an EvaGreen fluorescence dye are pipetted inside the chip using the inlet aperture, after which the inlet and outlet are closed using the same PCR foil. An input potential is applied on the resistive heater using a Keithley 2602 SYSTEM SourceMeter (Cleveland, OH, USA) until they acquire the desired temperature for the amplification. The temperature is real-time monitored by inserting a 162 series RS Technics thermocouple K (RS Components B.V., Haarlem, The Netherlands) in the temperature monitor chamber. The thermocouple is read out with a Tenma 72-7715 Thermometer (Premier Farnell Ltd., Leeds, UK). The source and the read-out of the thermocouple are operated using a custom-programmed LabVIEW program. The initial potential is based on the heater characterization measurements, but will be adjusted according to the feedback-loop of the thermocouple. Detection of the amplification is done
ex-situ by using quartz cuvets and an Horiba Scientific FluoroMax+ spectrofluorometer (Horiba Scientific, Piscataway, NJ, USA).

 ,
, 


