Dye-Doped ZnO Microcapsules for High Throughput and Sensitive Optofluidic Micro-Thermometry

 ,
, 
 and
and 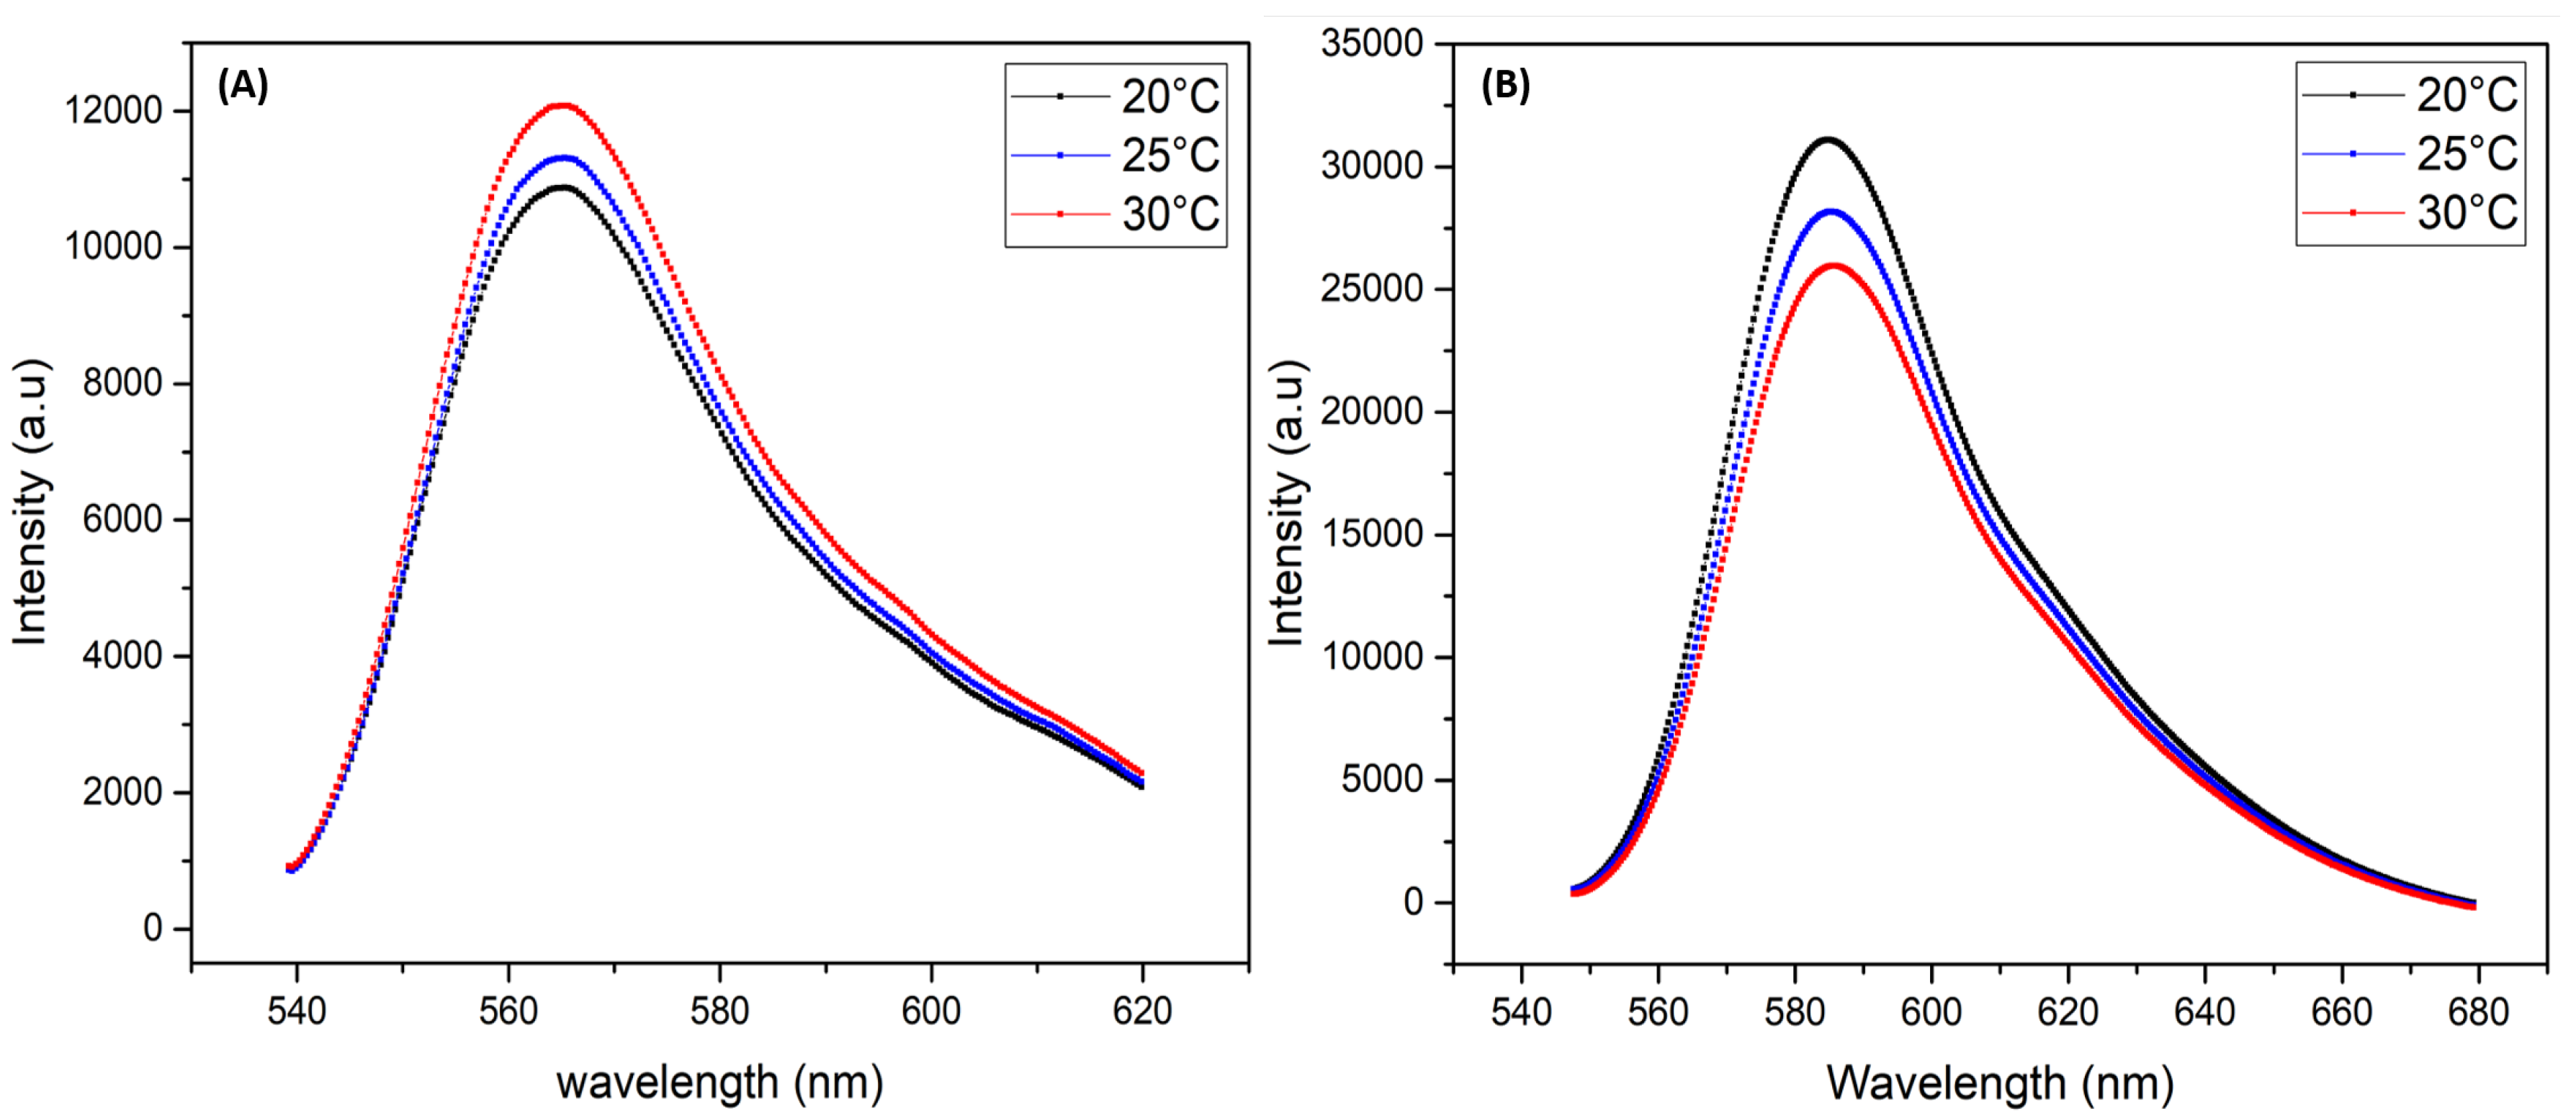
Abstract
:1. Introduction
2. Experimental Section
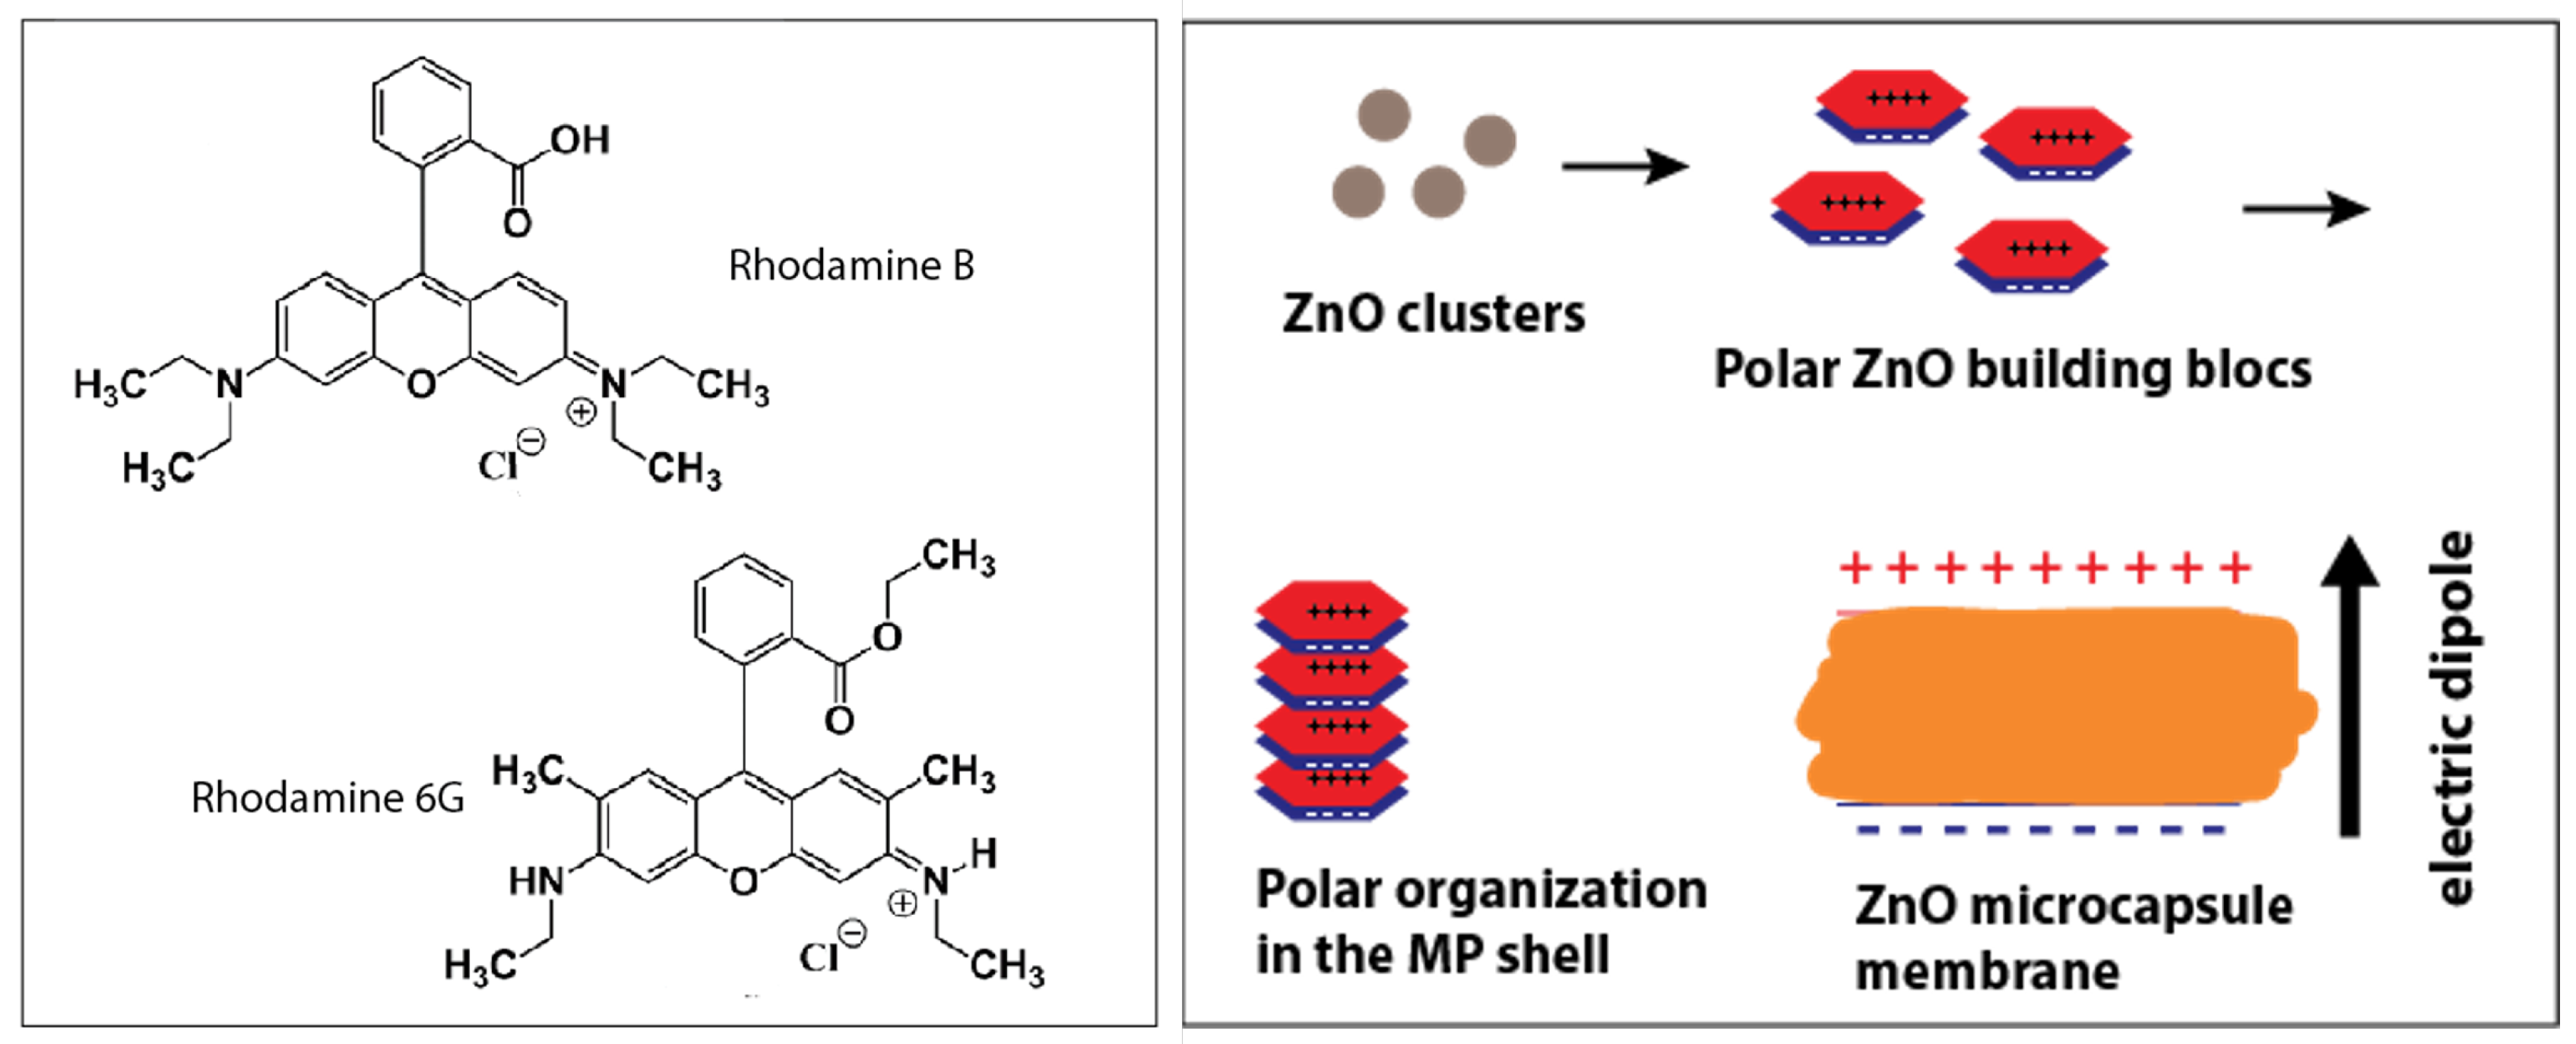
2.1. Synthesis of ZnO Nanoparticles Building Units
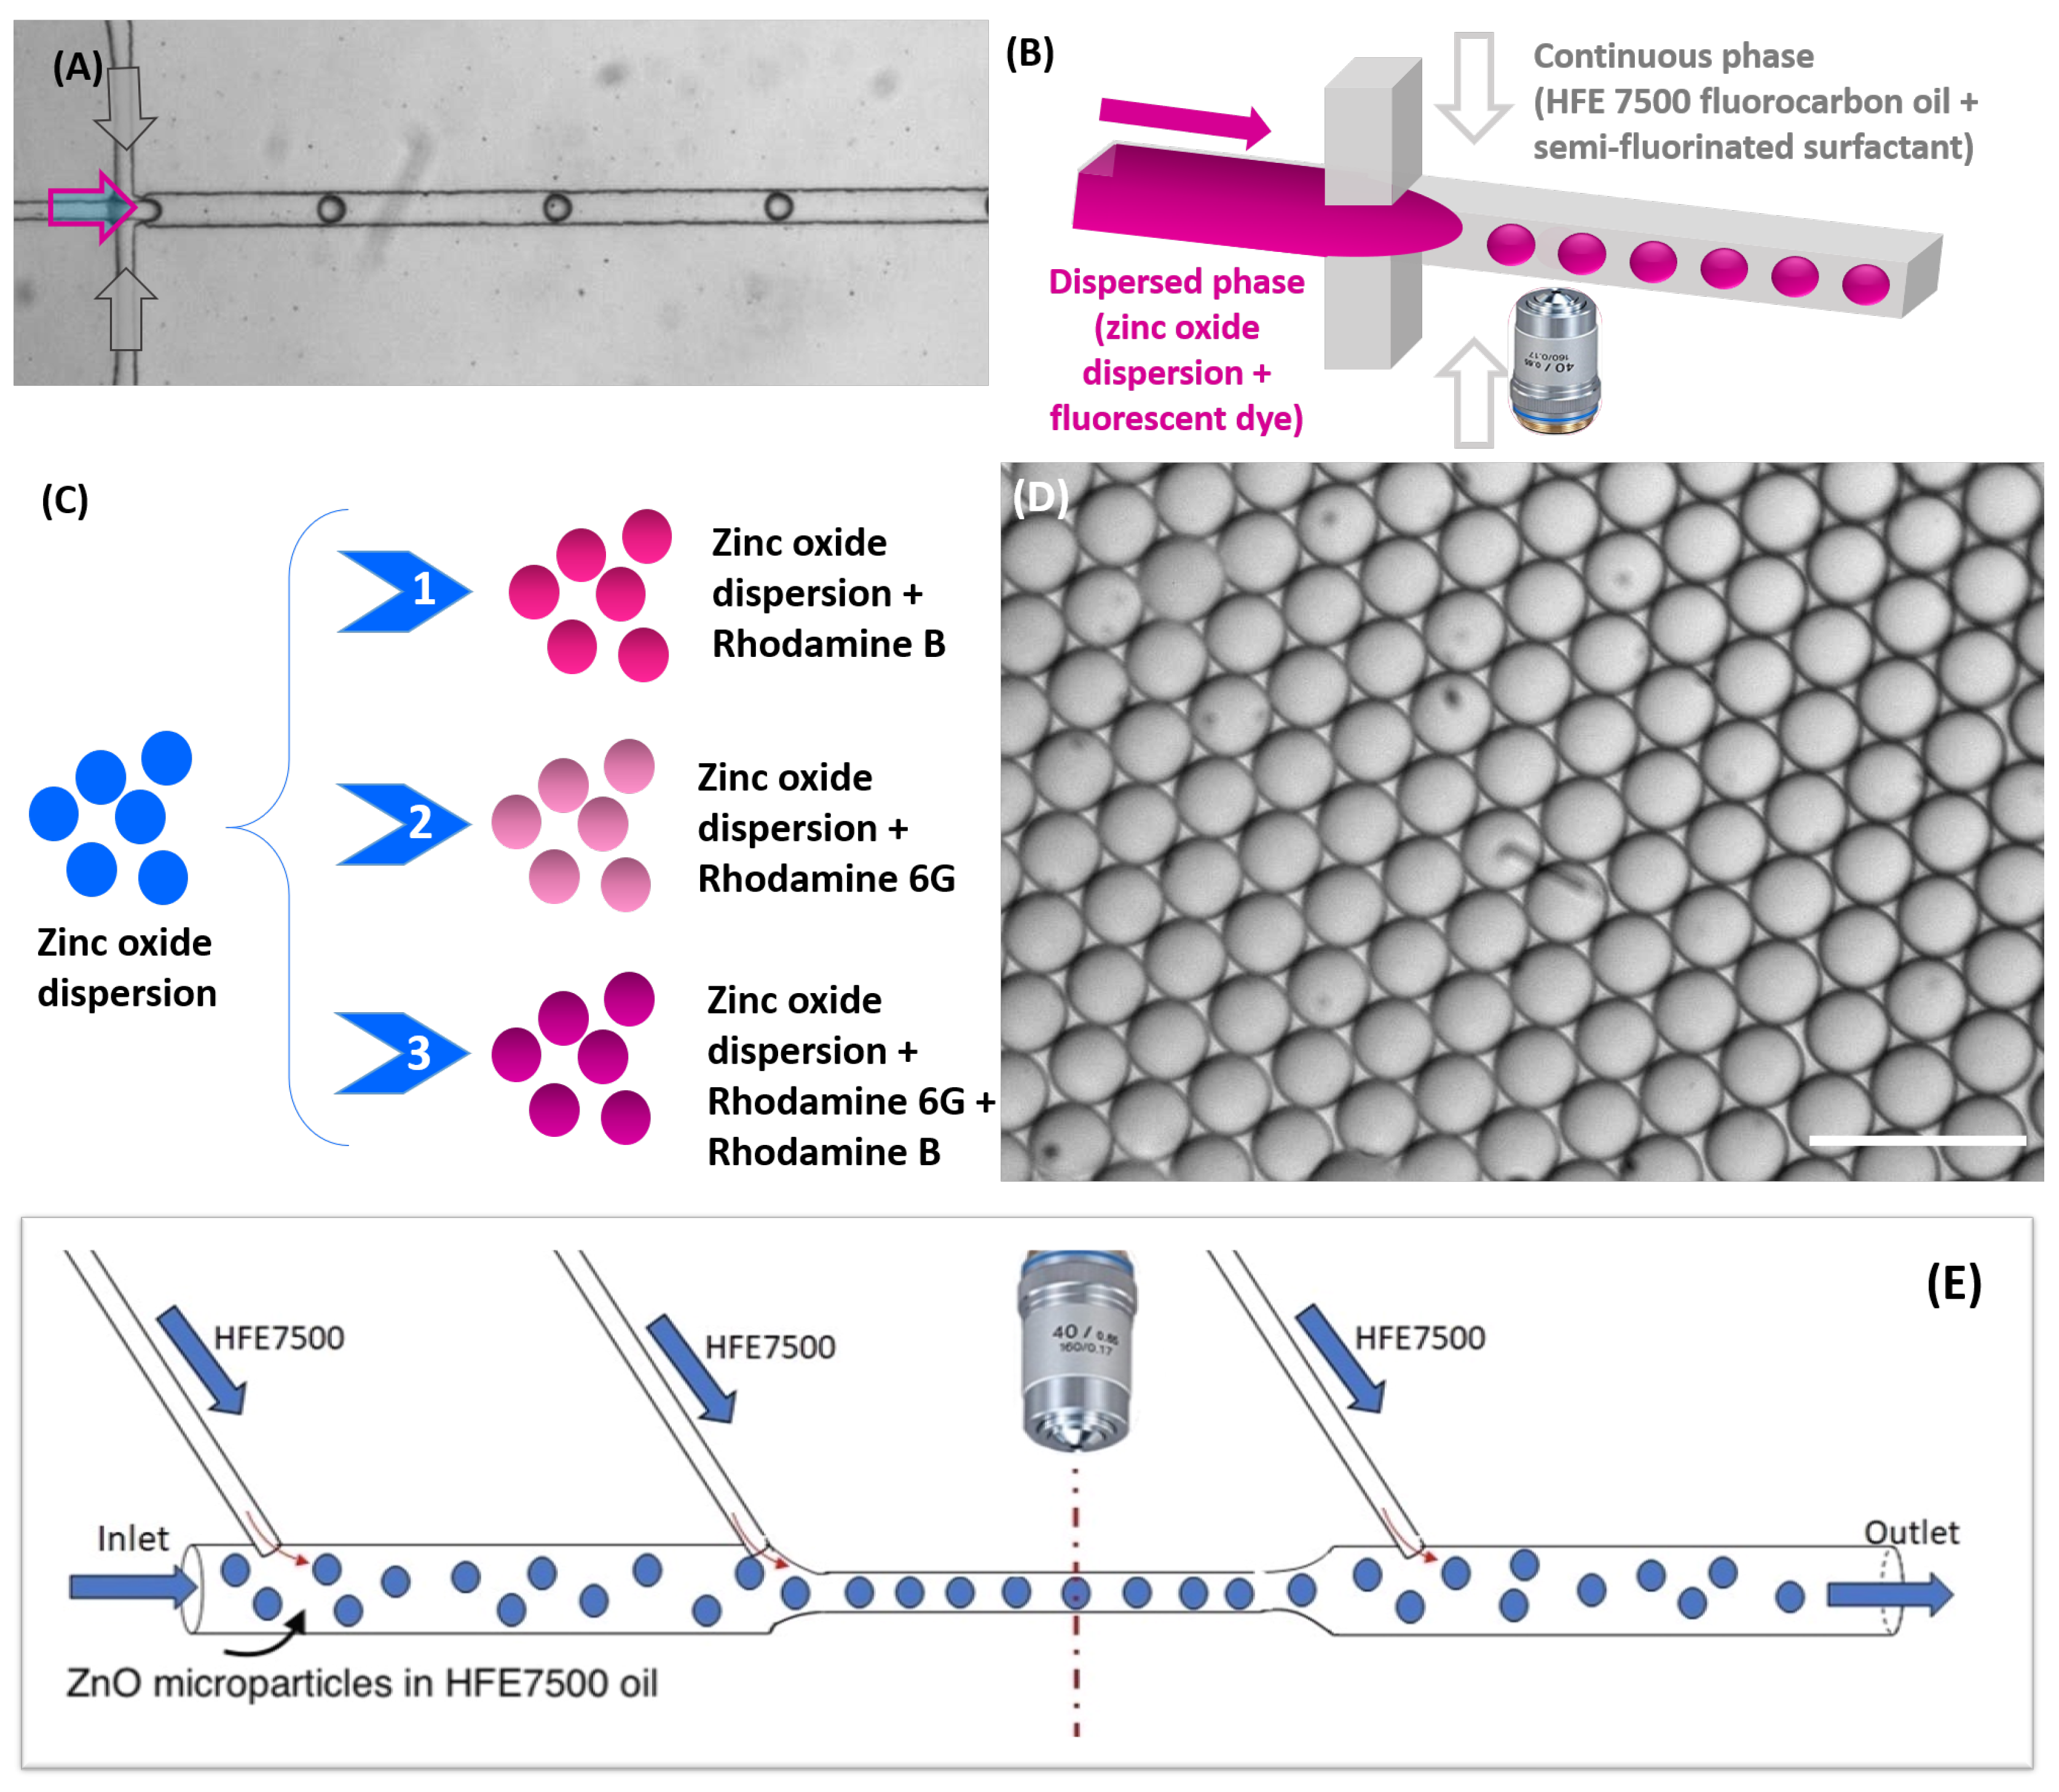
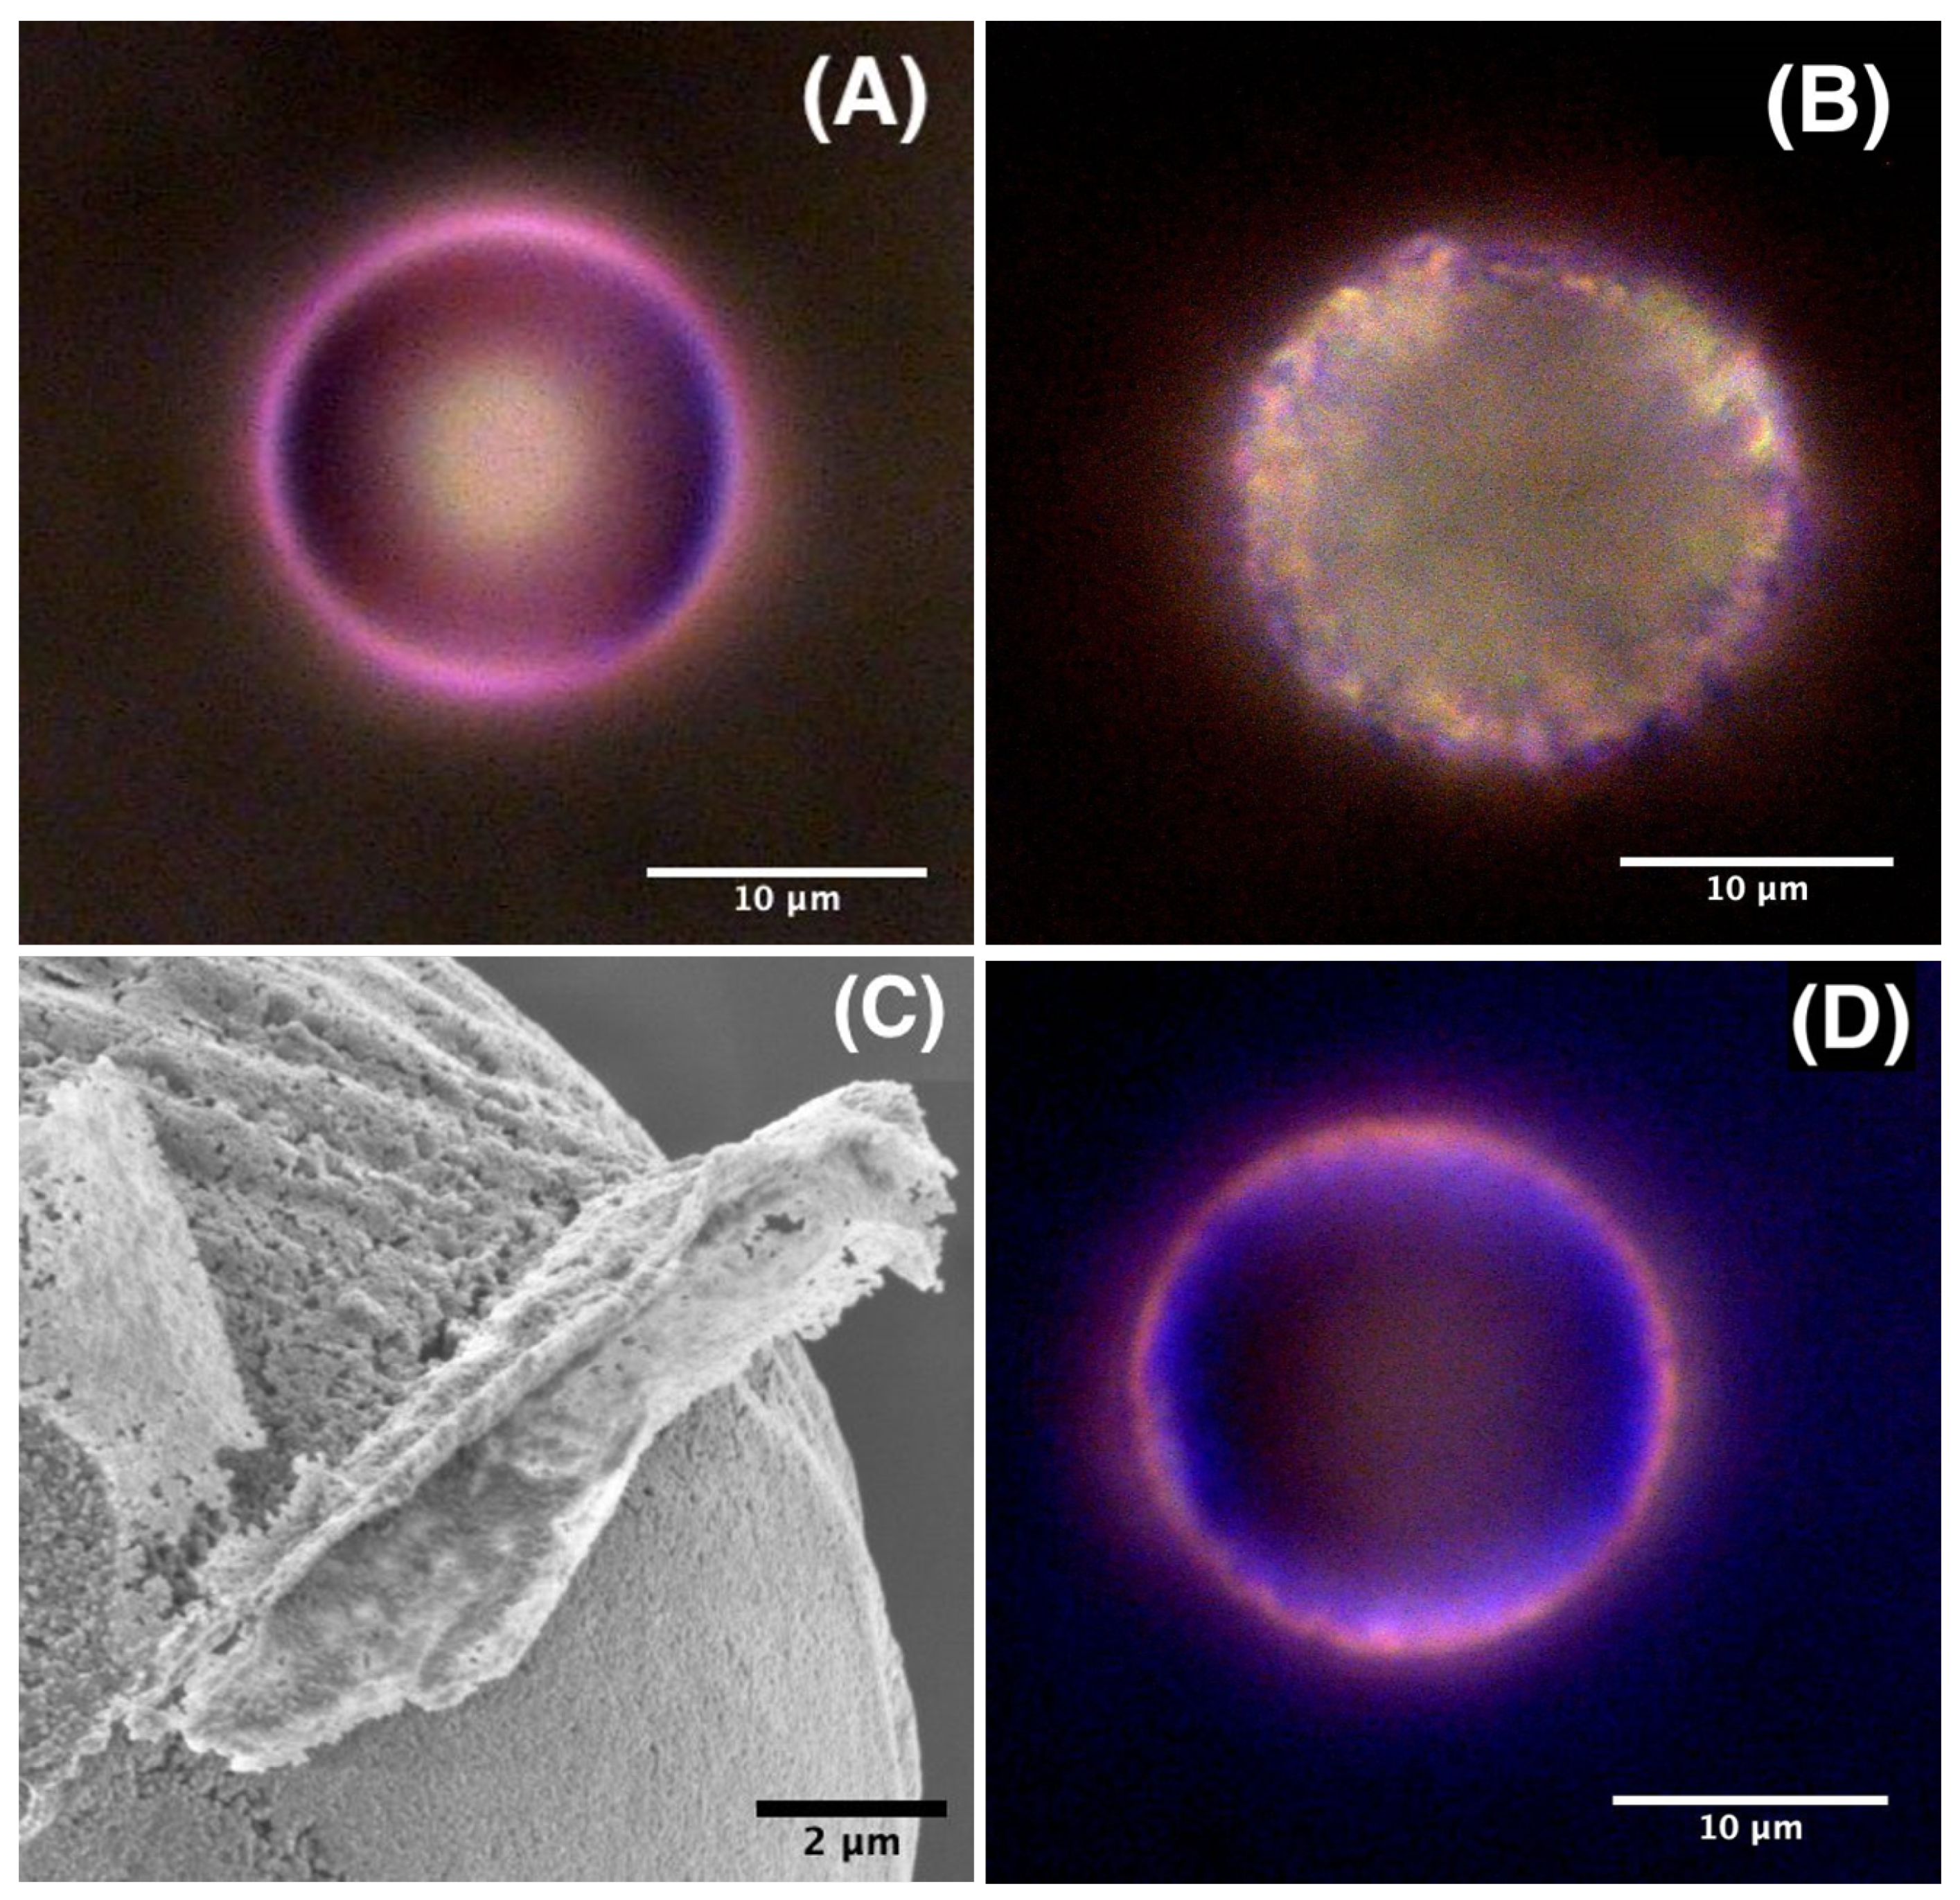
2.2. Fabrication of Microfluidic Devices and Synthesis of ZnO Microparticles
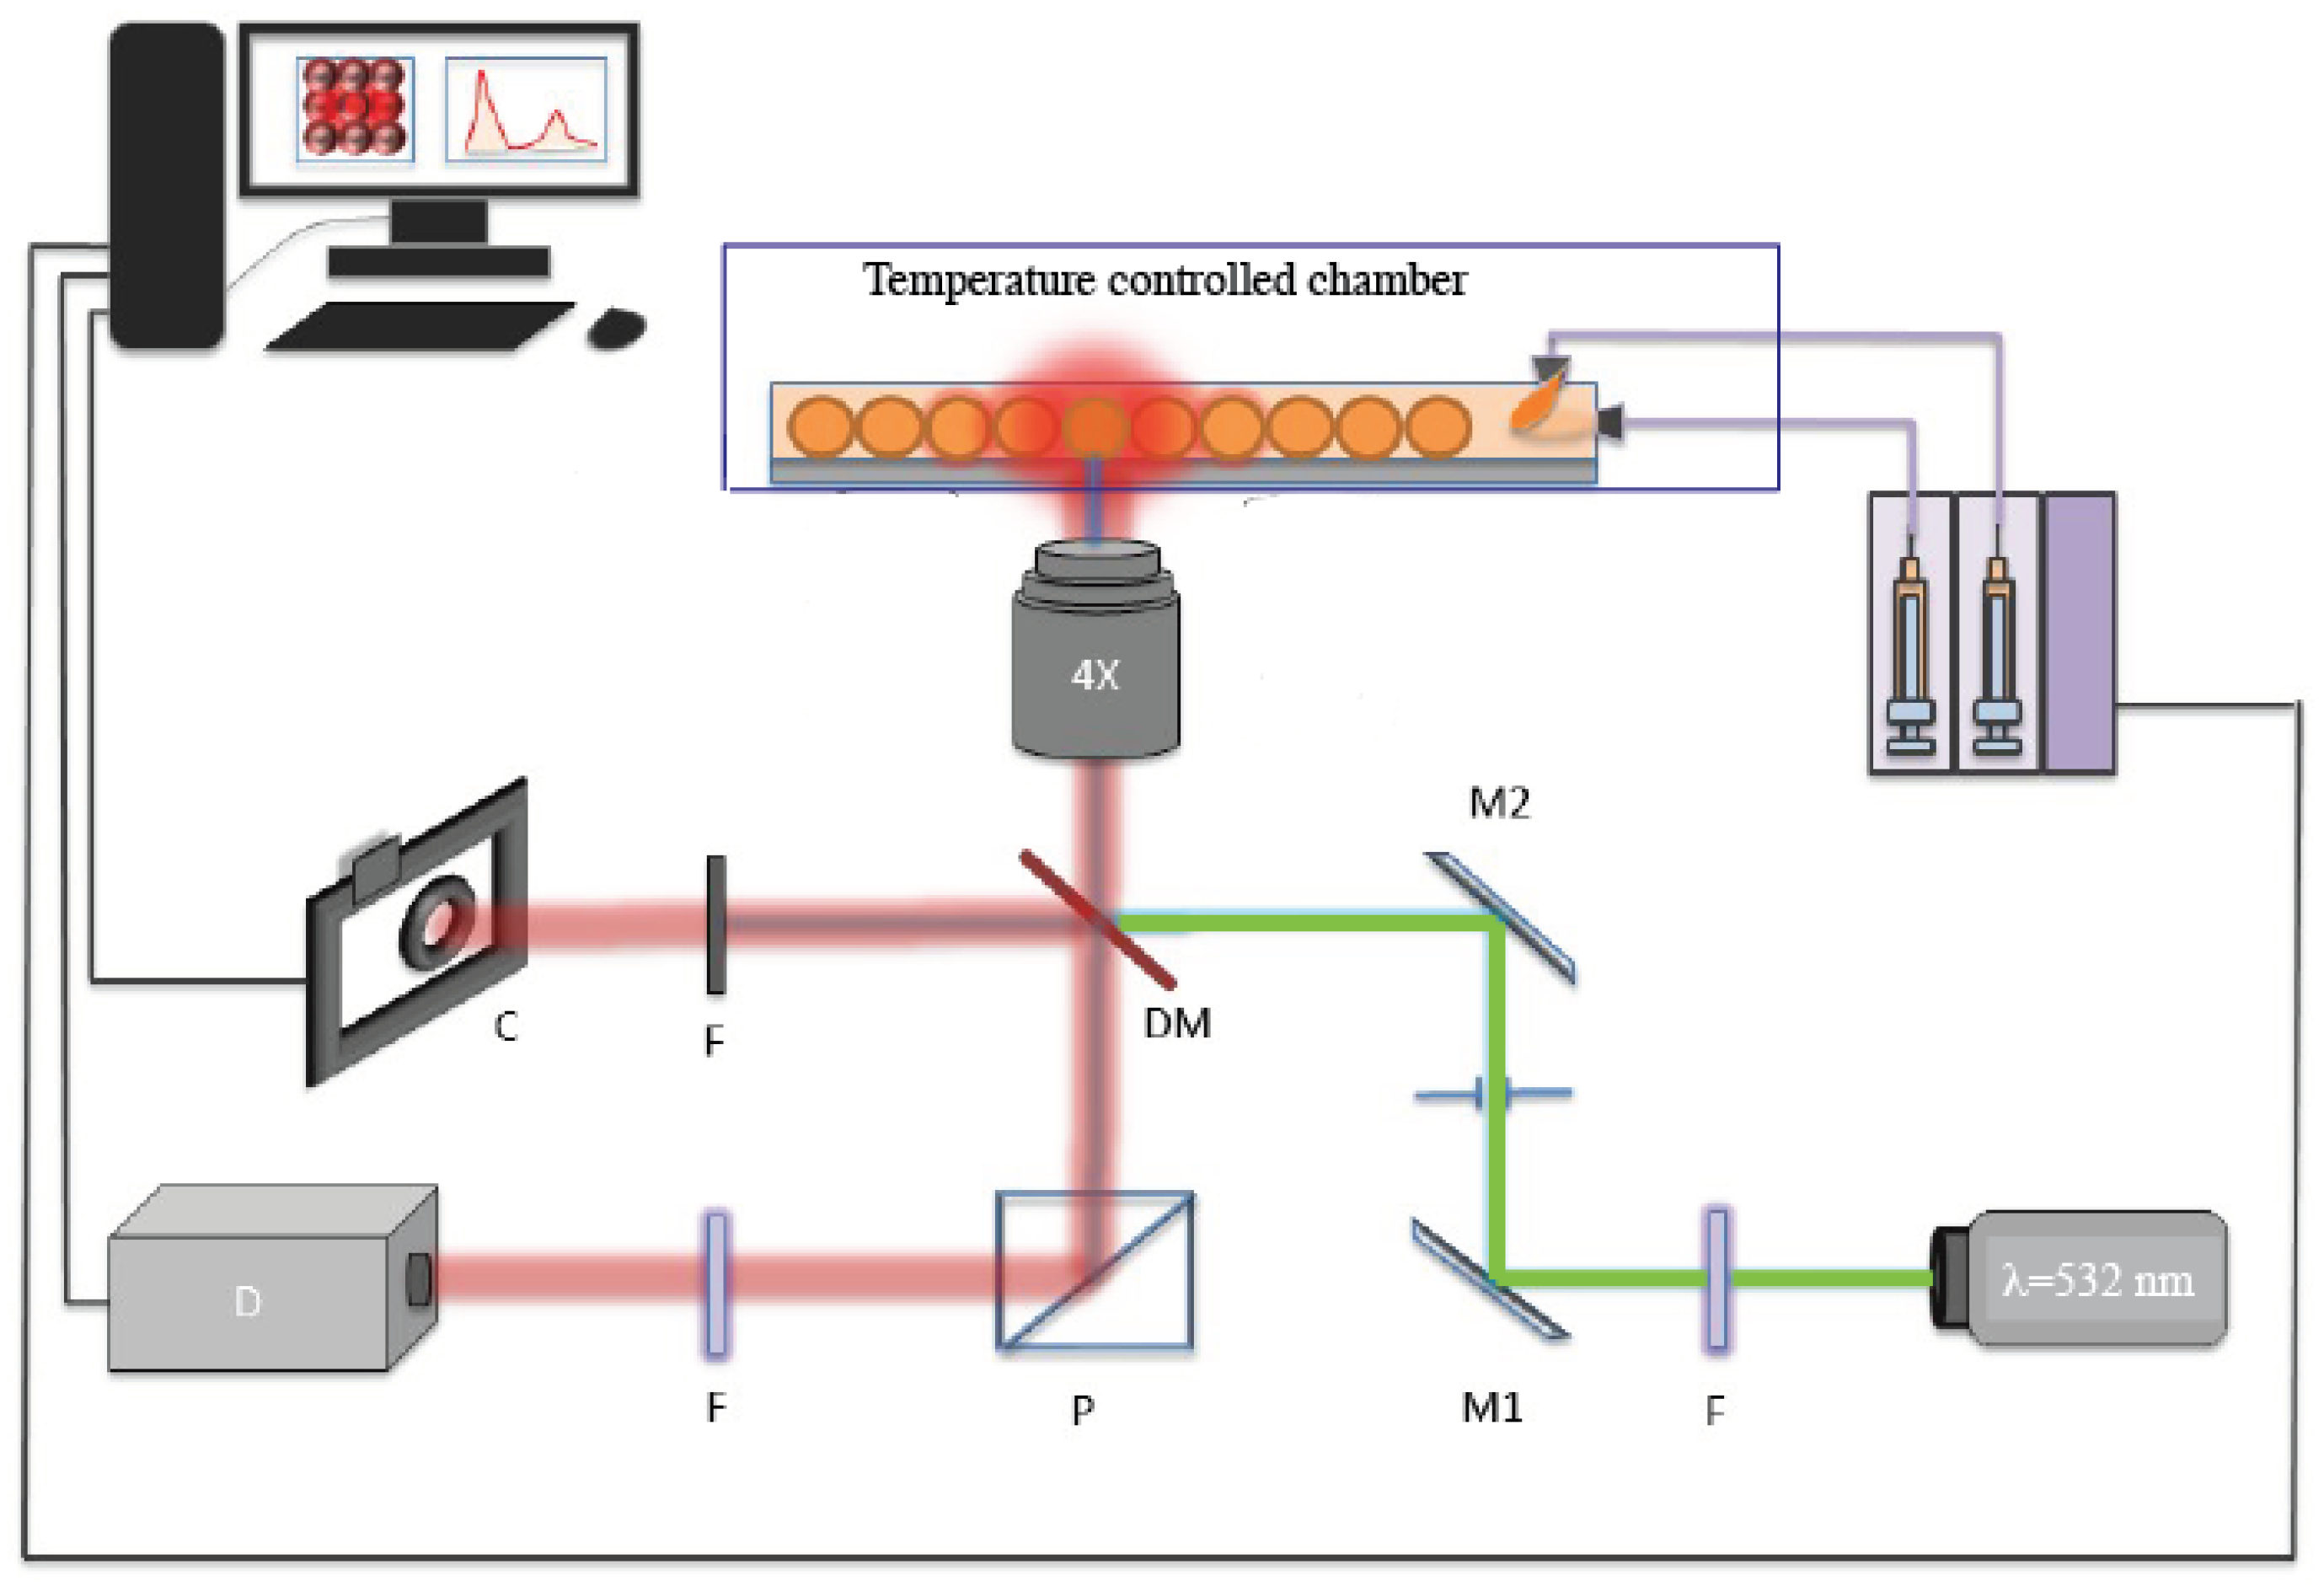
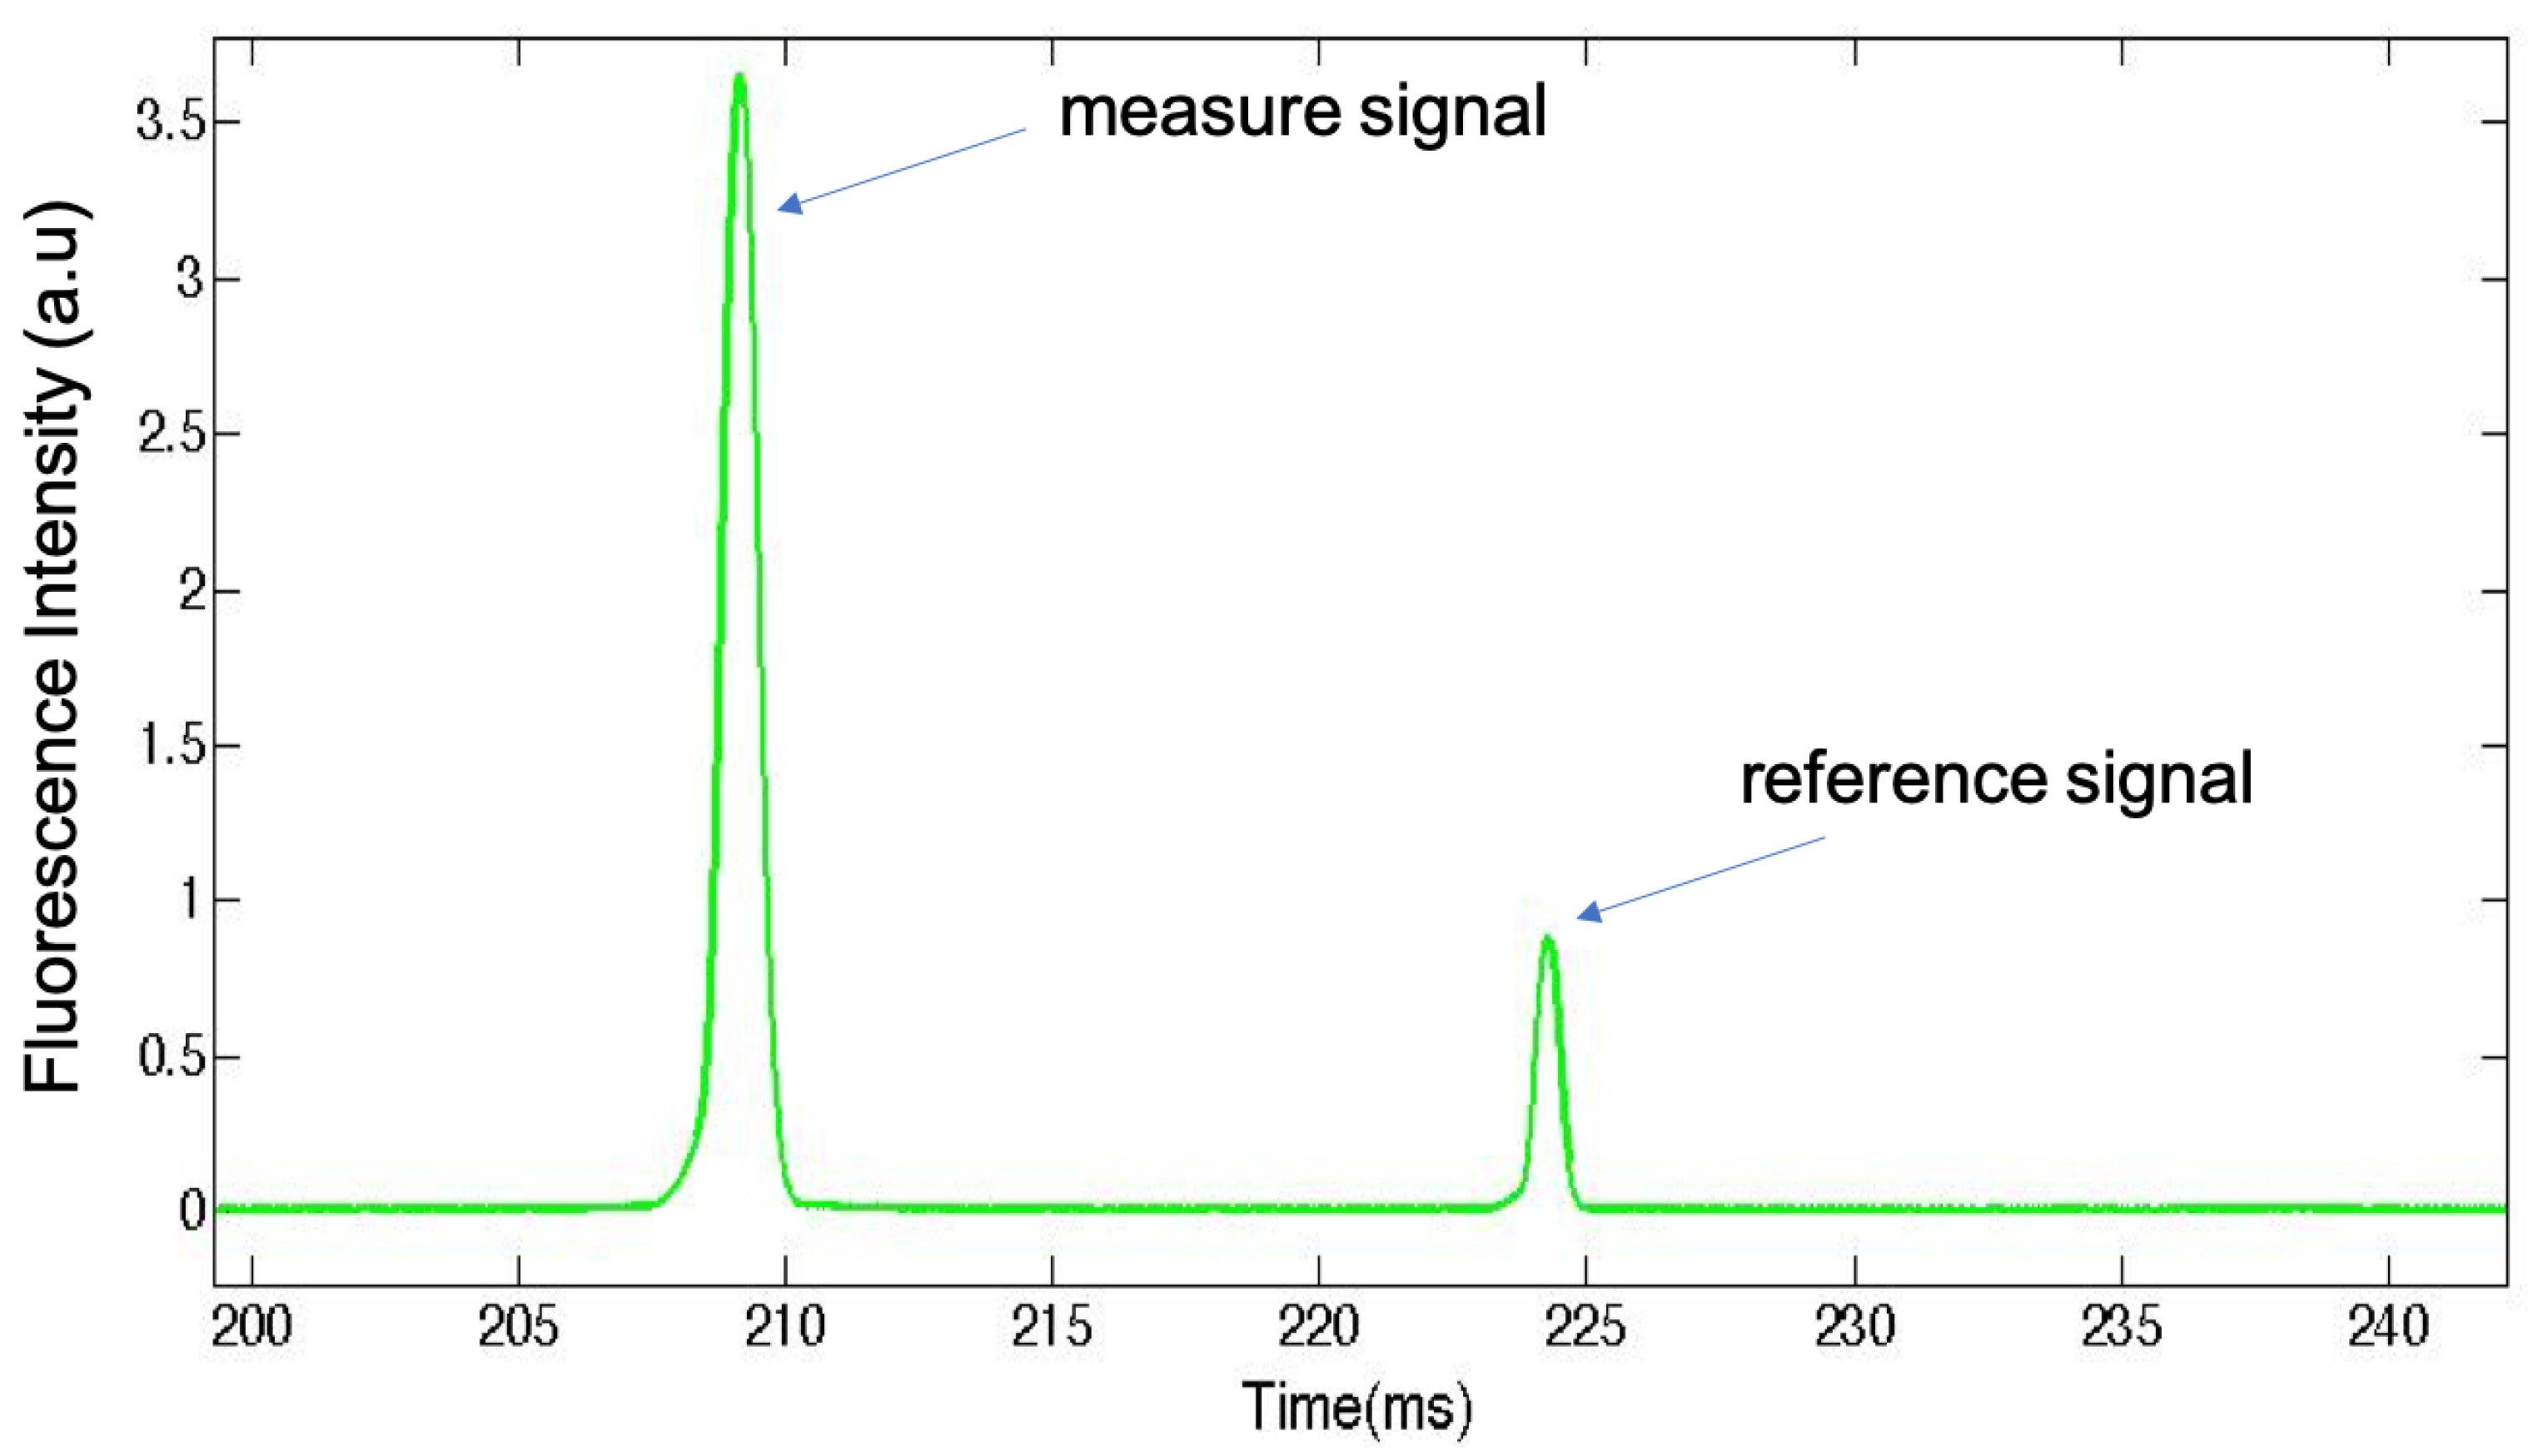
2.3. Fluorescence Detection of Flowing Microparticles
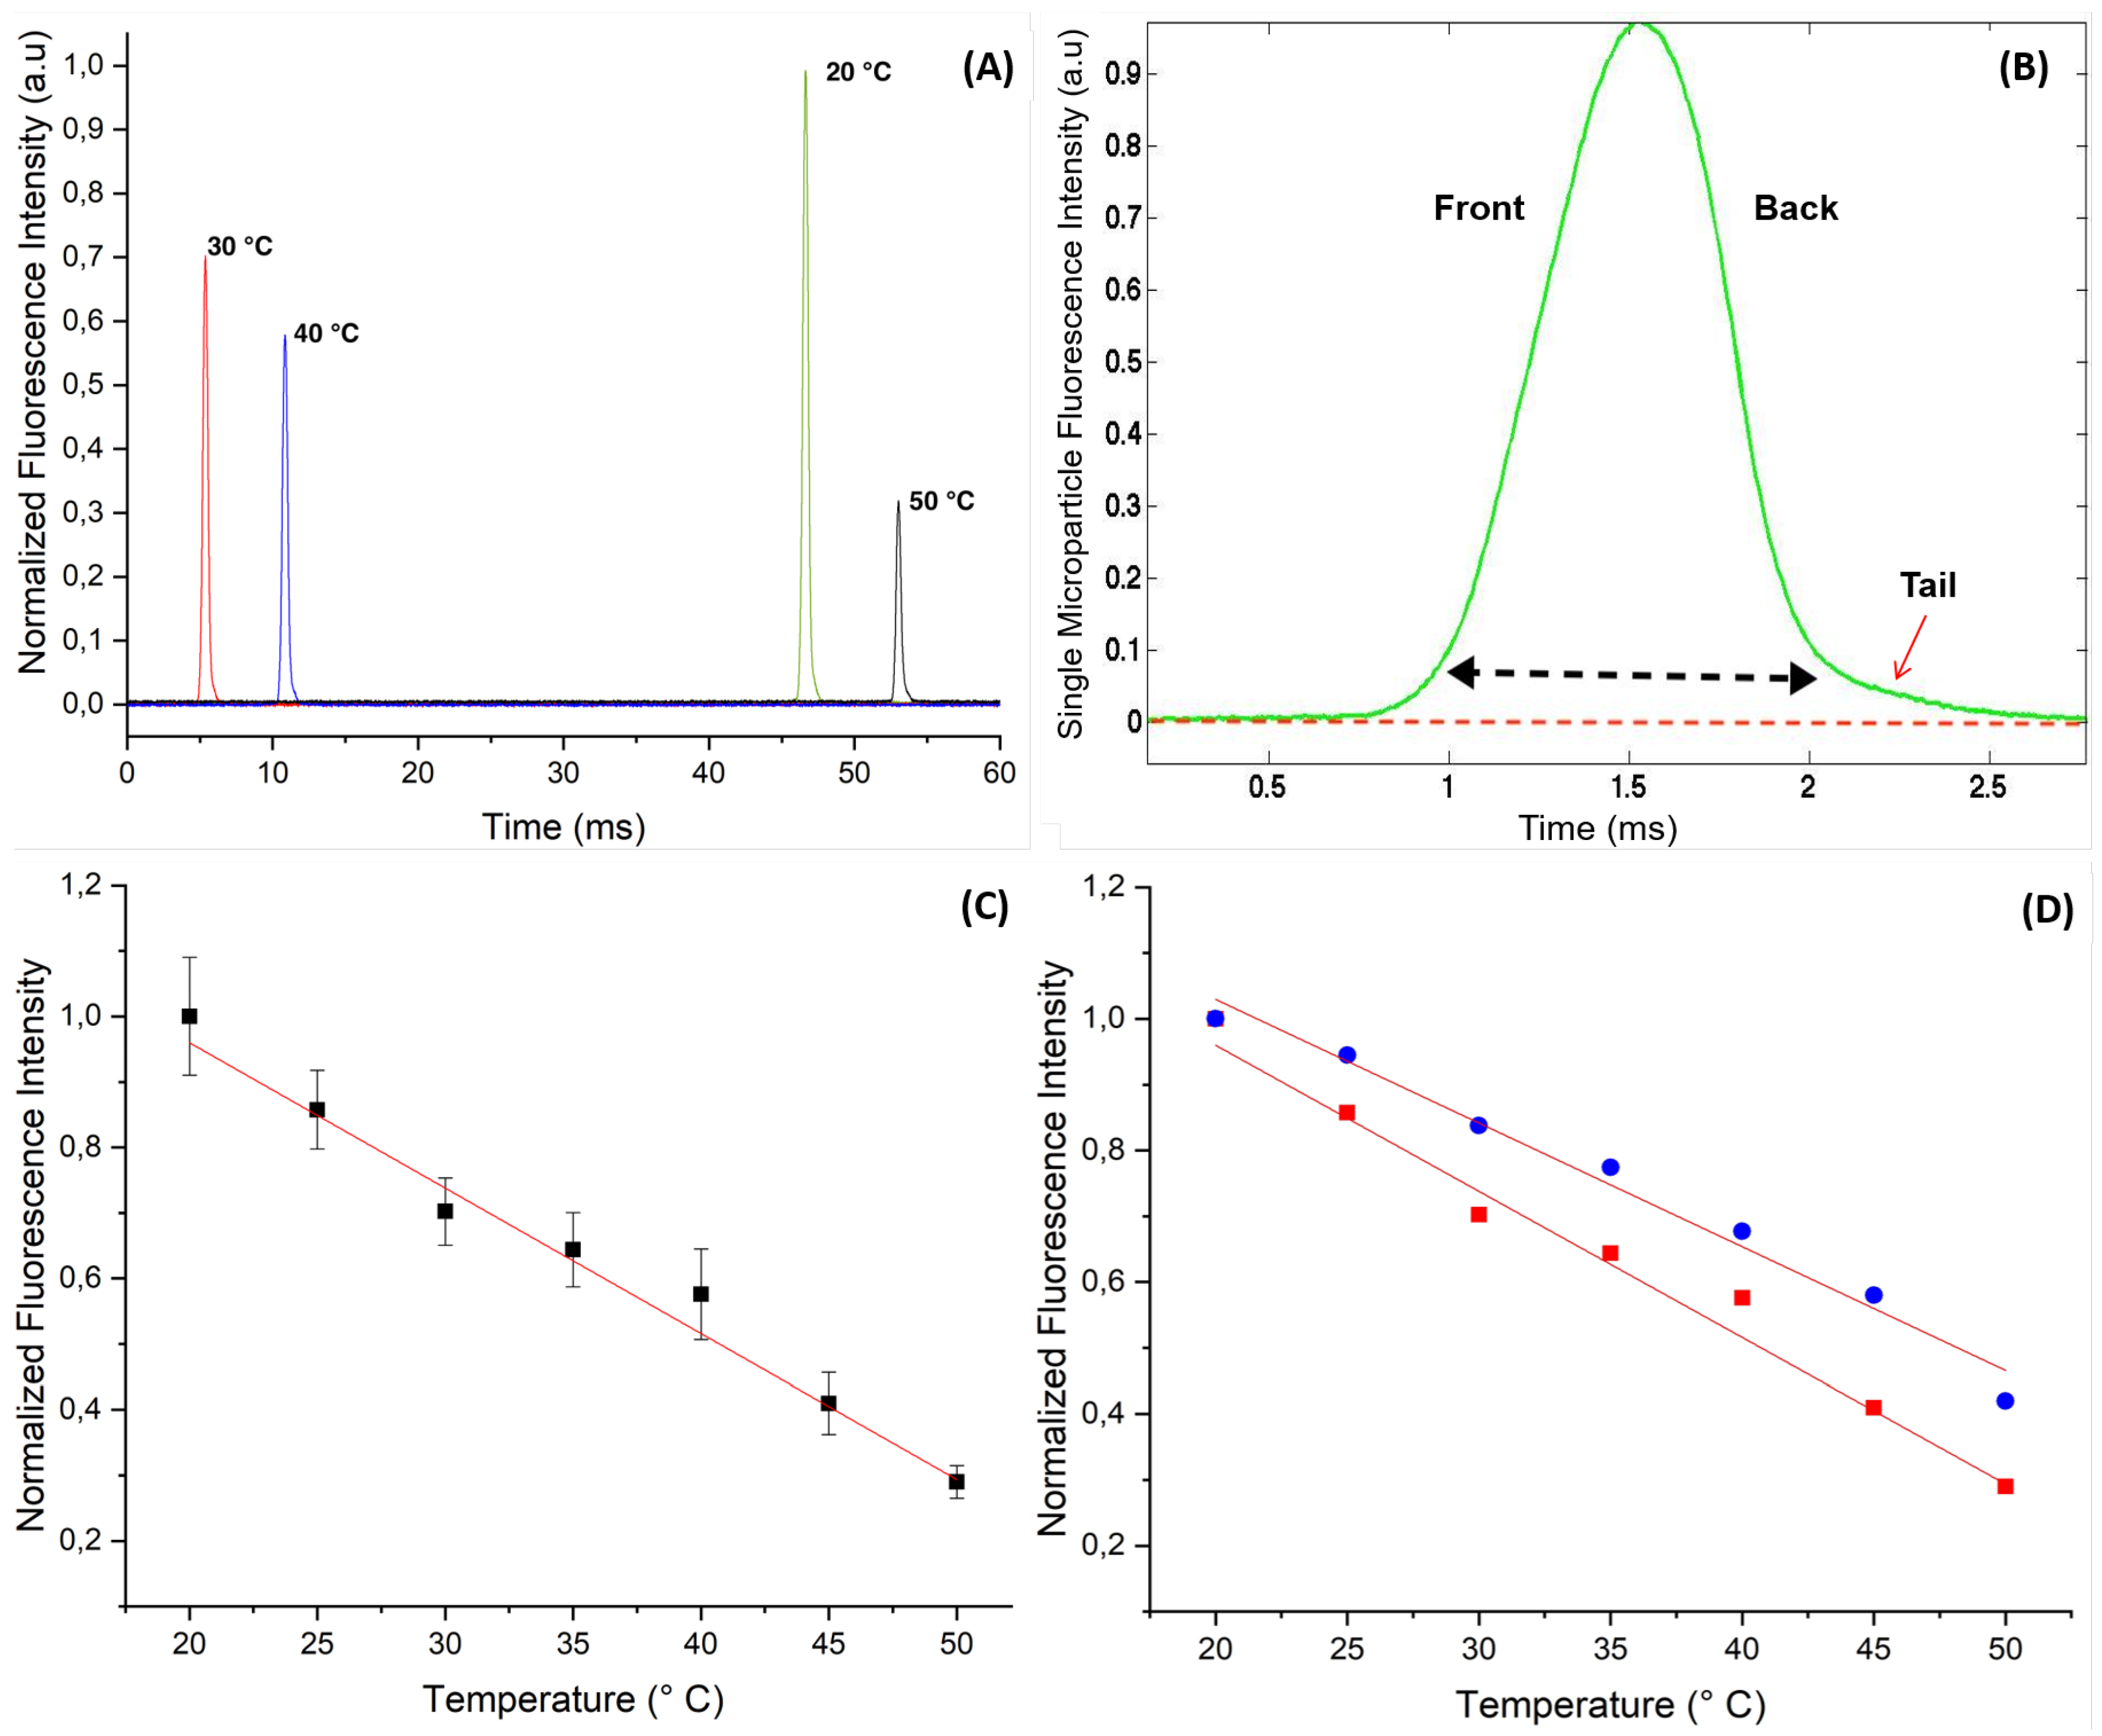
2.4. Calibration of Temperature Measurements
3. Results and Discussion
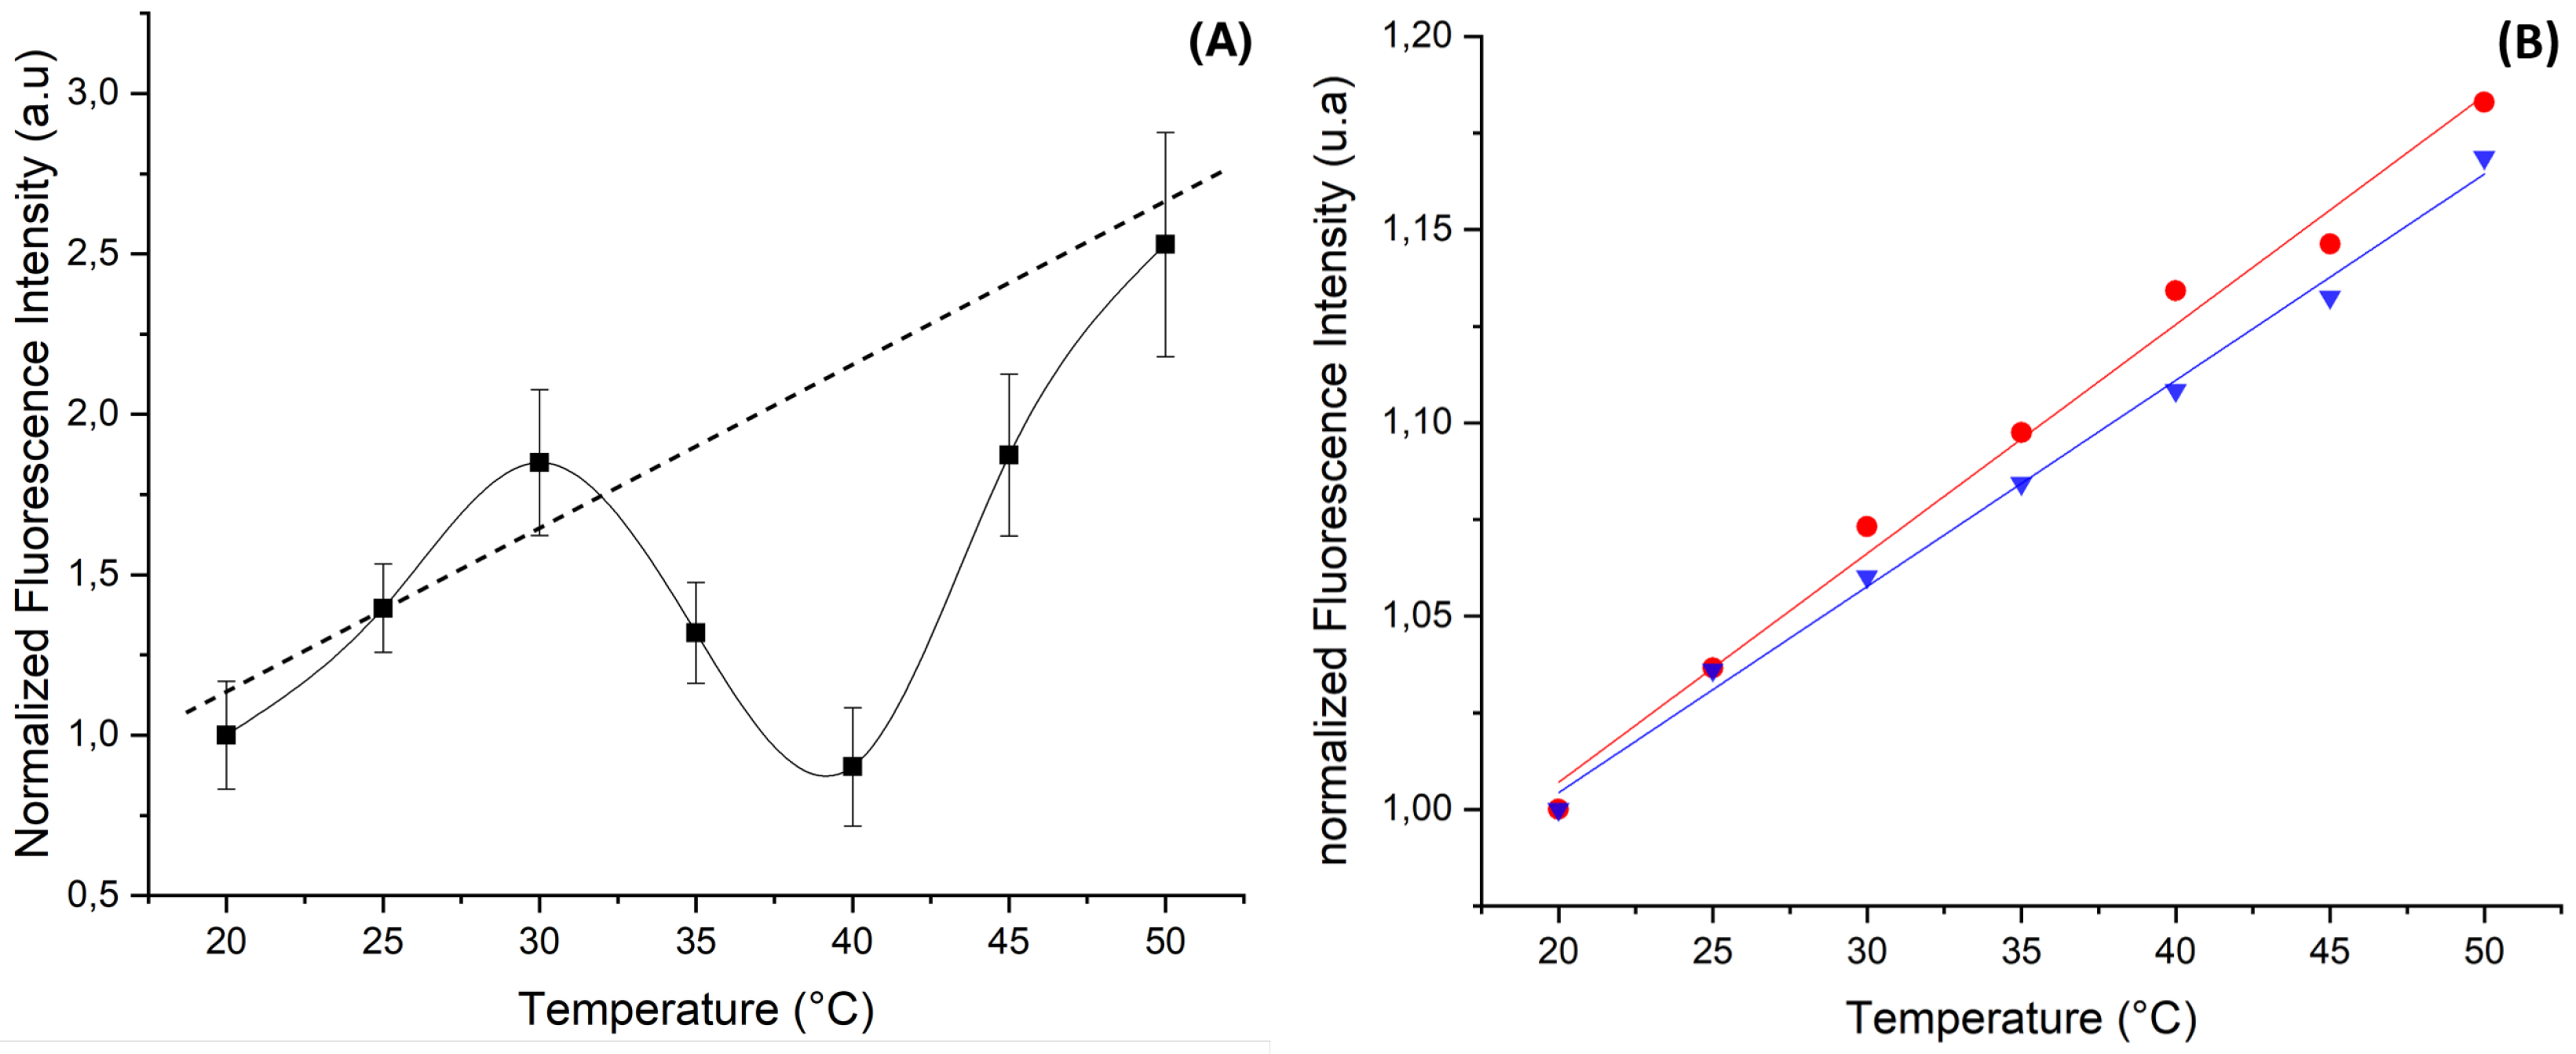
3.1. Fluorescence Intensity Versus Temperature of ZnO Microparticles Doped with rhodamine B (RhB)
3.2. Fluorescence Intensity Versus Temperature of ZnO Microparticles Doped with rhodamine 6G (Rh6G)
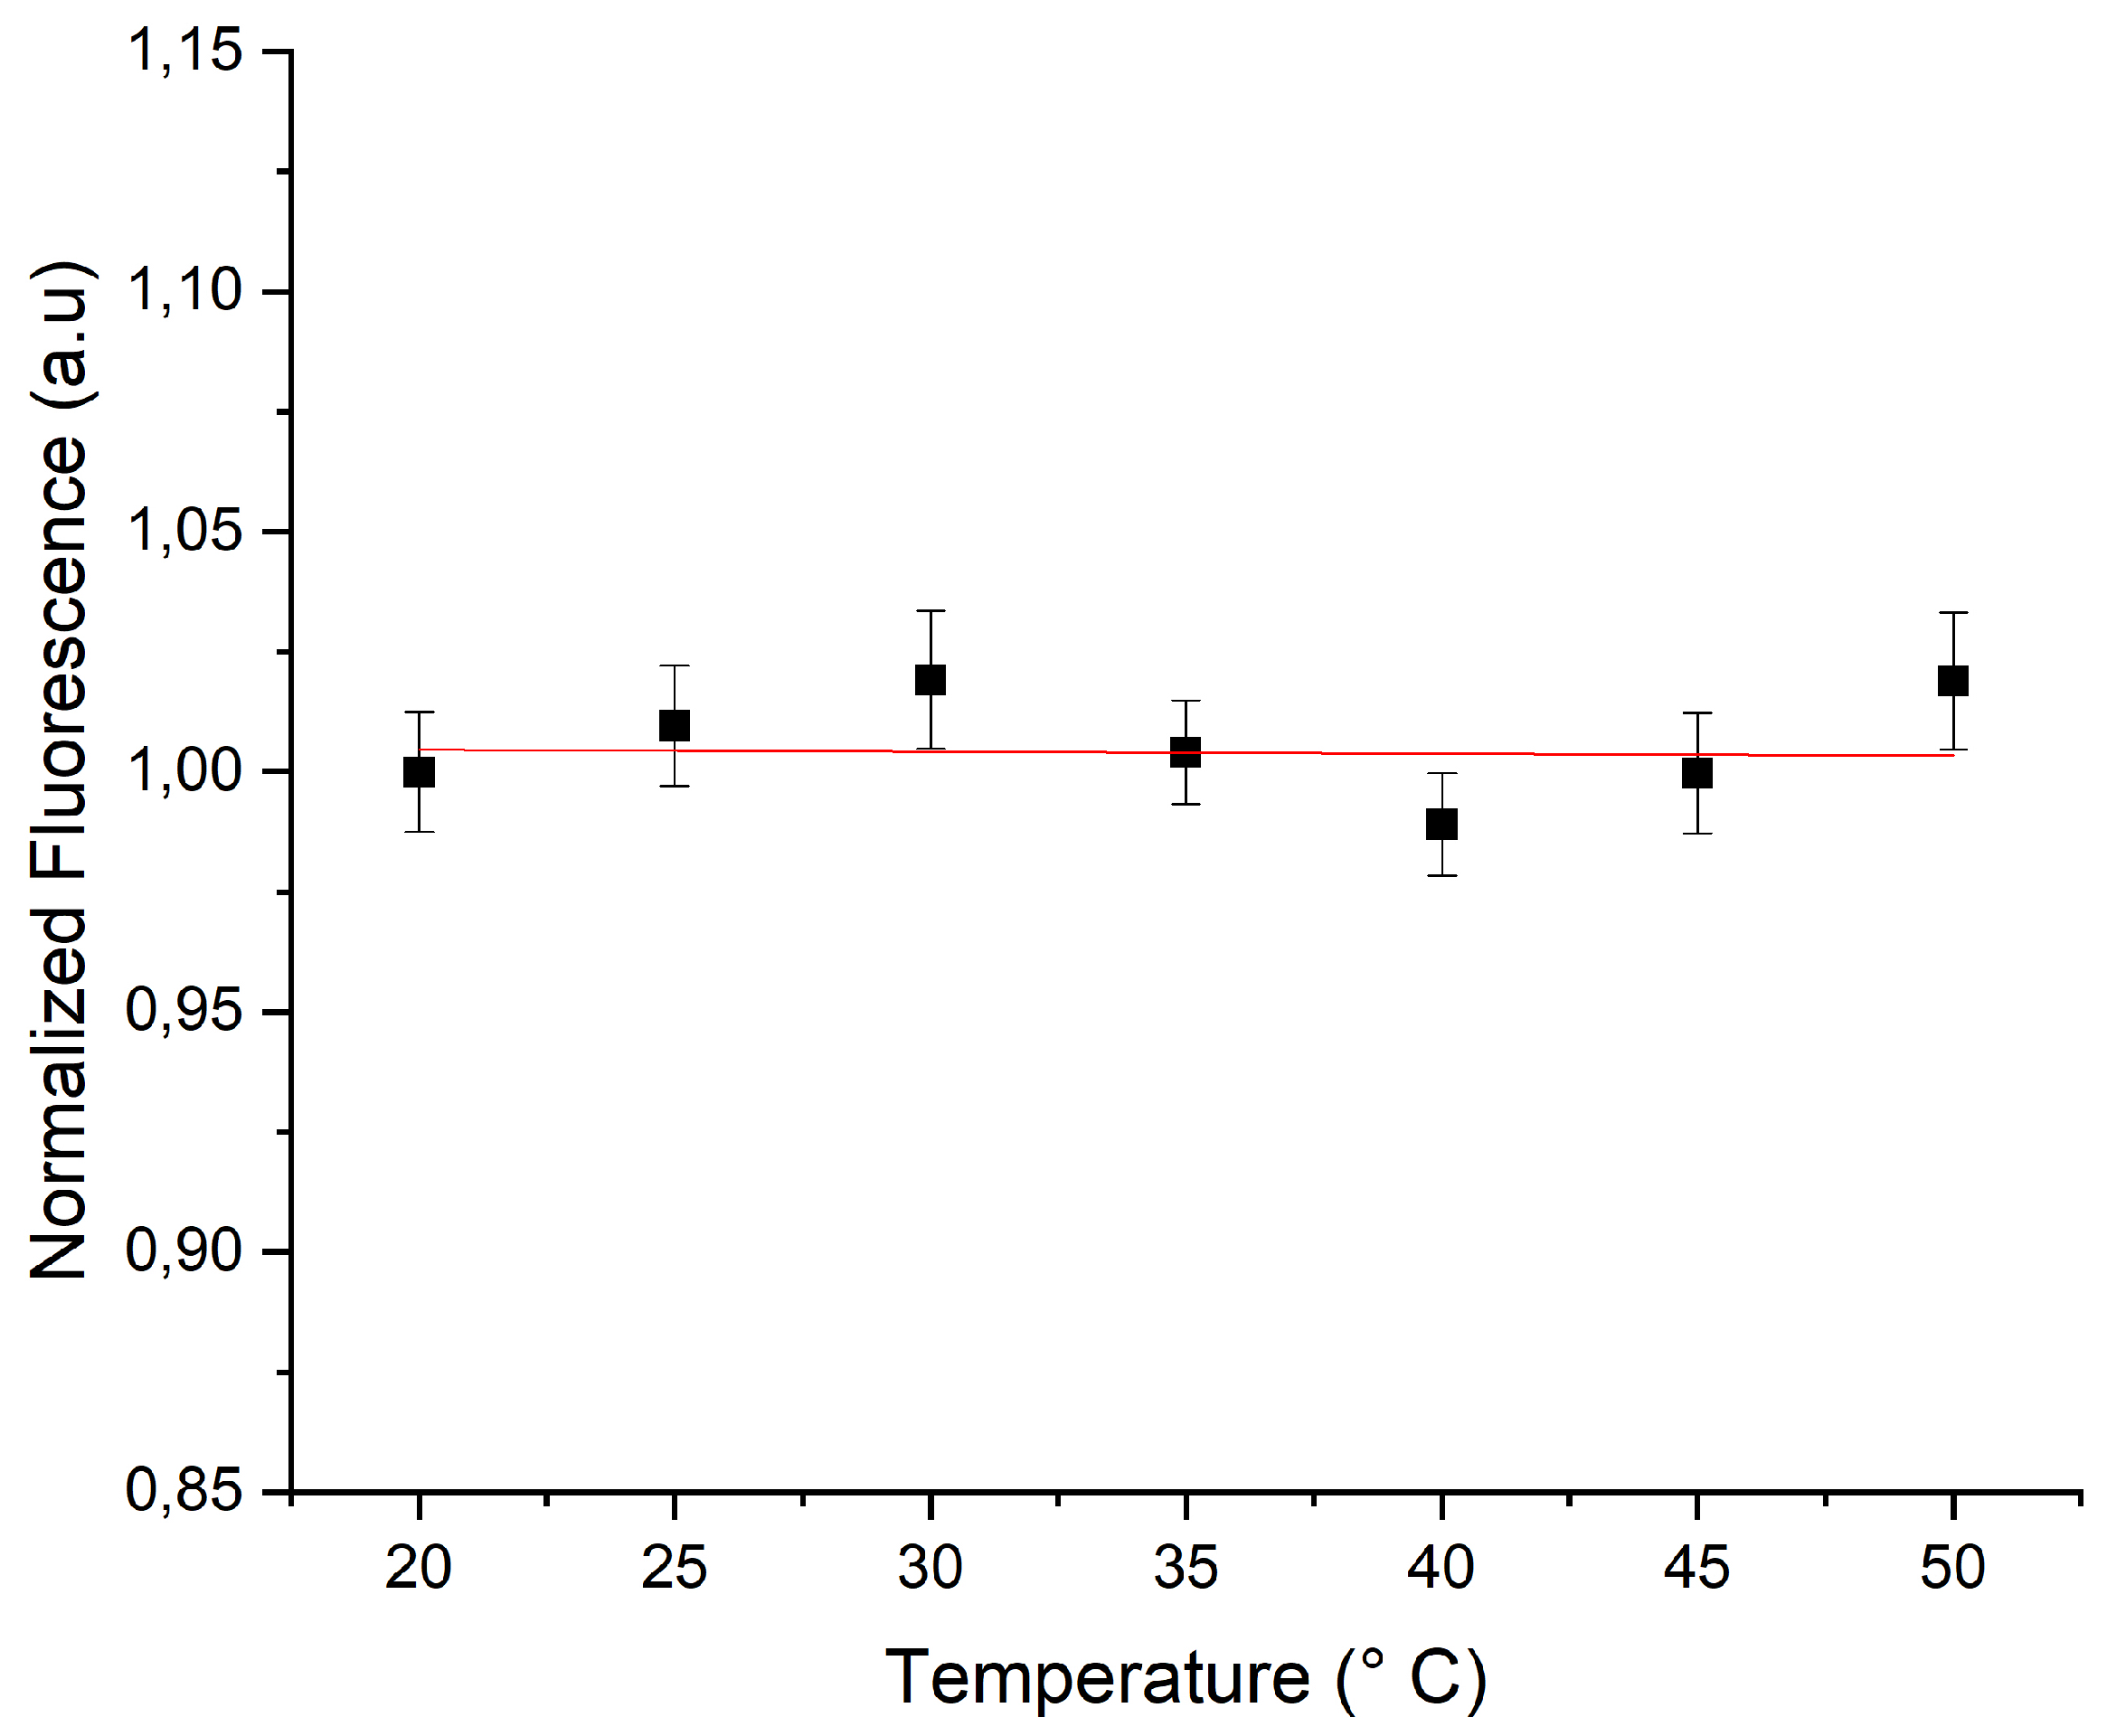
3.3. Fluorescence Properties of ZnO Microparticles Doped with a Mixture of RhB and Rh6G
4. Conclusions and Perspectives
Author Contributions
Funding
Conflicts of Interest
References
- Pohl, G.; Shih, I.M. Principle and applications of digital PCR. Expert Rev. Mol. Diagn. 2004, 4, 41–47. [Google Scholar] [CrossRef]
- Taly, V.; Pekin, D.; El Abed, A.; Laurent-Puig, P. Detecting biomarkers with microdroplet technology. Trends Mol. Med. 2012, 18, 405–416. [Google Scholar] [CrossRef]
- Guijt, R.M.; Dodge, A.; van Dedem, G.W.; de Rooij, N.F.; Verpoorte, E. Chemical and physical processes for integrated temperature control in microfluidic devices. Lab Chip 2003, 3, 1–4. [Google Scholar] [CrossRef]
- Gosse, C.; Bergaud, C.; Löw, P. Molecular probes for thermometry in microfluidic devices. In Thermal Nanosystems and Nanomaterials; Springer: Berlin, Germany, 2009; pp. 301–341. [Google Scholar]
- Ross, D.; Gaitan, M.; Locascio, L.E. Temperature measurement in microfluidic systems using a temperature-dependent fluorescent dye. Anal. Chem. 2001, 73, 4117–4123. [Google Scholar] [CrossRef] [PubMed]
- Kuzkova, N.; Popenko, O.; Yakunov, A. Application of temperature-dependent fluorescent dyes to the measurement of millimeter wave absorption in water applied to biomedical experiments. J. Biomed. Imaging 2014, 2014, 12. [Google Scholar] [CrossRef] [PubMed]
- Samy, R.; Glawdel, T.; Ren, C.L. Method for microfluidic whole-chip temperature measurement using thin-film poly (dimethylsiloxane)/Rhodamine B. Anal. Chem. 2008, 80, 369–375. [Google Scholar] [CrossRef]
- Kim, M.M.; Giry, A.; Mastiani, M.; Rodrigues, G.O.; Reis, A.; Mandin, P. Microscale thermometry: A review. Microelectron. Eng. 2015, 148, 129–142. [Google Scholar] [CrossRef]
- Christofferson, J.; Maize, K.; Ezzahri, Y.; Shabani, J.; Wang, X.; Shakouri, A. Microscale and nanoscale thermal characterization techniques. J. Electron. Packag. 2008, 130, 041101. [Google Scholar] [CrossRef]
- Erickson, D.; Sinton, D.; Li, D. Joule heating and heat transfer in poly (dimethylsiloxane) microfluidic systems. Lab Chip 2003, 3, 141–149. [Google Scholar] [CrossRef] [PubMed] [Green Version]
- Arata, H.F.; Löw, P.; Ishizuka, K.; Bergaud, C.; Kim, B.; Noji, H.; Fujita, H. Temperature distribution measurement on microfabricated thermodevice for single biomolecular observation using fluorescent dye. Sens. Actuators B: Chem. 2006, 117, 339–345. [Google Scholar] [CrossRef] [Green Version]
- Liu, G.; Lu, H. Laser-induced fluorescence of rhodamine B in ethylene glycol solution. Procedia Eng. 2015, 102, 95–105. [Google Scholar] [CrossRef] [Green Version]
- Ebert, S.; Travis, K.; Lincoln, B.; Guck, J. Fluorescence ratio thermometry in a microfluidic dual-beam laser trap. Opt. Express 2007, 15, 15493–15499. [Google Scholar] [CrossRef] [PubMed]
- Sakakibara, J.; Adrian, R.J. Whole field measurement of temperature in water using two-color laser induced fluorescence. Exp. Fluids 1999, 26, 7–15. [Google Scholar] [CrossRef]
- Valeur, B.; Berberan-Santos, M. Molecular Fluorescence: Principles and Applications. J. Biomed. Opt. 2013, 18, 039901. [Google Scholar]
- Guilbault, G.G. Practical Fluorescence, Theory, Methods and Techniques; Marcell Dekker: New York, NY, USA, 1973. [Google Scholar]
- Chamarthy, P.; Garimella, S.V.; Wereley, S.T. Measurement of the temperature non-uniformity in a microchannel heat sink using microscale laser-induced fluorescence. Int. J. Heat Mass Transf. 2010, 53, 3275–3283. [Google Scholar] [CrossRef] [Green Version]
- Hossain, M.A.; Canning, J.; Yu, Z.; Ast, S.; Rutledge, P.J.; Wong, J.K.H.; Jamalipour, A.; Crossley, M.J. Time-resolved and temperature tuneable measurements of fluorescent intensity using a smartphone fluorimeter. Analyst 2017, 142, 1953–1961. [Google Scholar] [CrossRef] [Green Version]
- Taylor, G. Dispersion of a solute in a solvent under laminar conditions. Proc. R. Soc. London, Ser. A 1953, 219, 186–203. [Google Scholar]
- Beard, D.A. Taylor dispersion of a solute in a microfluidic channel. J. Appl. Phys. 2001, 89, 4667–4669. [Google Scholar] [CrossRef]
- Özgür, Ü.; Gu, X.; Chevtchenko, S.; Spradlin, J.; Cho, S.J.; Morkoç, H.; Pollak, F.; Everitt, H.; Nemeth, B.; Nause, J. Thermal conductivity of bulk ZnO after different thermal treatments. J. Electron. Mater. 2006, 35, 550–555. [Google Scholar] [CrossRef]
- Florescu, D.I.; Mourokh, L.; Pollak, F.H.; Look, D.C.; Cantwell, G.; Li, X. High spatial resolution thermal conductivity of bulk ZnO (0001). J. Appl. Phys. 2002, 91, 890–892. [Google Scholar] [CrossRef]
- Alvarez-Quintana, J.; Martínez, E.; Pérez-Tijerina, E.; Pérez-García, S.; Rodríguez-Viejo, J. Temperature dependent thermal conductivity of polycrystalline ZnO films. J. Appl. Phys. 2010, 107, 063713. [Google Scholar] [CrossRef]
- Zehentbauer, F.M.; Moretto, C.; Stephen, R.; Thevar, T.; Gilchrist, J.R.; Pokrajac, D.; Richard, K.L.; Kiefer, J. Fluorescence spectroscopy of Rhodamine 6G: Concentration and solvent effects. Spectrochim. Acta A Mol. Biomol. Spectrosc. 2014, 121, 147–151. [Google Scholar] [CrossRef] [PubMed]
- Ali, M.; Moghaddasi, J.; Ahmed, S. Temperature effects in Rhodamine B dyes and improvement in CW dye laser performance. Laser Chem. 1991, 11, 31–38. [Google Scholar] [CrossRef] [Green Version]
- Hamzaoui, N.; Boukhachem, A.; Ghamnia, M.; Fauquet, C. Investigation of some physical properties of ZnO nanofilms synthesized by micro-droplet technique. Results Phys. 2017, 7, 1950–1958. [Google Scholar] [CrossRef]
- Ghifari, N.; Chahboun, A.; El Abed, A. One-Step Synthesis of Highly Monodisperse ZnO Core-Shell Microspheres in Microfluidic Devices. In Proceedings of the 2019 21st International Conference on Transparent Optical Networks (ICTON), Angers, France, 9–13 July 2019; pp. 1–6. [Google Scholar]
- Duffy, D.C.; McDonald, J.C.; Schueller, O.J.; Whitesides, G.M. Rapid prototyping of microfluidic systems in poly (dimethylsiloxane). Anal. Chem. 1998, 70, 4974–4984. [Google Scholar] [CrossRef] [PubMed]
- Hayat, Z.; El Abed, A.I. High-throughput optofluidic acquisition of microdroplets in microfluidic systems. Micromachines 2018, 9, 183. [Google Scholar] [CrossRef] [Green Version]
- Taylor, G. Deposition of a viscous fluid on the wall of a tube. J. Fluid Mech. 1961, 10, 161–165. [Google Scholar] [CrossRef]
- Baroud, C.N.; Gallaire, F.; Dangla, R. Dynamics of microfluidic droplets. Lab Chip 2010, 10, 2032–2045. [Google Scholar] [CrossRef] [Green Version]
- Chu, T.X.; Salsac, A.V.; Barthès-Biesel, D.; Griscom, L.; Edwards-Lévy, F.; Leclerc, E. Fabrication and in situ characterization of microcapsules in a microfluidic system. Microfluid. Nanofluidics 2013, 14, 309–317. [Google Scholar] [CrossRef]
- Hu, X.Q.; Salsac, A.V.; Barthès-Biesel, D. Flow of a spherical capsule in a pore with circular or square cross-section. J. Fluid Mech. 2012, 705, 176–194. [Google Scholar] [CrossRef] [Green Version]
- Liu, Z.; Wen, X.; Wu, X.; Gao, Y.; Chen, H.; Zhu, J.; Chu, P. Intrinsic dipole-field-driven mesoscale crystallization of core- shell ZnO mesocrystal microspheres. J. Am. Chem. Soc. 2009, 131, 9405–9412. [Google Scholar] [CrossRef] [PubMed]
- Tampo, H.; Fons, P.; Yamada, A.; Kim, K.K.; Shibata, H.; Matsubara, K.; Yoshikawa, H.; Kanie, H.; Niki, S. Determination of crystallographic polarity of ZnO bulk crystals and epilayers. Phys. Status Solidi C 2006, 3, 1018–1021. [Google Scholar] [CrossRef]
- Dai, S.; Park, H.S. Surface effects on the piezoelectricity of ZnO nanowires. J. Mech. Phys. Solids 2013, 61, 385–397. [Google Scholar] [CrossRef] [Green Version]
- Xiang, H.; Yang, J.; Hou, J.; Zhu, Q. Piezoelectricity in ZnO nanowires: A first-principles study. Appl. Phys. Lett. 2006, 89, 223111. [Google Scholar] [CrossRef] [Green Version]
- Yufei, Z.; Zhiyou, G.; Xiaoqi, G.; Dongxing, C.; Yunxiao, D.; Hongtao, Z. First-principles of wurtzite ZnO (0001) and (0001) surface structures. J. Semicond. 2010, 31, 082001. [Google Scholar] [CrossRef]


© 2020 by the authors. Licensee MDPI, Basel, Switzerland. This article is an open access article distributed under the terms and conditions of the Creative Commons Attribution (CC BY) license (http://creativecommons.org/licenses/by/4.0/).
Share and Cite
Ghifari, N.; Rassouk, S.; Hayat, Z.; Taleb, A.; Chahboun, A.; El Abed, A.I. Dye-Doped ZnO Microcapsules for High Throughput and Sensitive Optofluidic Micro-Thermometry. Micromachines 2020, 11, 100. https://doi.org/10.3390/mi11010100
Ghifari N, Rassouk S, Hayat Z, Taleb A, Chahboun A, El Abed AI. Dye-Doped ZnO Microcapsules for High Throughput and Sensitive Optofluidic Micro-Thermometry. Micromachines. 2020; 11(1):100. https://doi.org/10.3390/mi11010100
Chicago/Turabian StyleGhifari, Najla, Sara Rassouk, Zain Hayat, Abdelhafed Taleb, Adil Chahboun, and Abdel I. El Abed. 2020. "Dye-Doped ZnO Microcapsules for High Throughput and Sensitive Optofluidic Micro-Thermometry" Micromachines 11, no. 1: 100. https://doi.org/10.3390/mi11010100