1. Introduction
Satellite data provide vital information needed to predict severe meteorological events, such as hurricanes, severe storms and tornadoes. Efficient, timely processing of raw satellite data into higher-level products, such as radiances, imagery, cloud properties and soundings, is critical for operational meteorology. Since 1975, NOAA has been operating a series of Geostationary Operational Environmental Satellites (GOES). As of July 2015, three GOES satellites (GOES-13, 14, and 15) are available for meteorological operations, with two operational at any given time. The next generation of GOES satellites, the GOES-R series, is scheduled to launch in 2016, and, once operational, will provide significant enhancements that go well beyond the current capabilities [
1,
2] Four satellites will be launched (GOES-R, S, T and U) and, in accordance with NOAA naming convention, will be designated GOES-16 through 19 after successful insertion into geostationary orbit.
The GOES-R series represents a generational change in geostationary meteorological observation to meet forecasting and environmental monitoring requirements. GOES-R products will be much more advanced compared to the legacy GOES I-P (GOES 8-15) series in terms of spatial, spectral, and, especially, temporal resolution. The two operational satellites will be located at East (75°W longitude) and West (137°W longitude), providing simultaneous, continuous coverage of the entire Western hemisphere 24 h a day.
The Earth and space observation technology improvements embodied in GOES-R will enable a higher science data rate compared to the current GOES satellites. For instance, while the downlink data rate for raw science and telemetry from the current operational GOES satellites is 2.76 Megabits per second (Mbps) 24 hours per day, the peak downlink data rate for raw science and telemetry from the GOES-R series spacecraft command and data handling system is 120 Mbps in the X-band. Under nominal operations, the data content from the six GOES-R series instruments is expected to reach 78 Mbps, offering margin for higher data rates to support instruments operating in diagnostic mode. A high-performance, high-availability Ground System (GS) has been designed and implemented to accommodate the real-time data processing demands of this much higher data rate. This paper describes the architecture of the GOES-R GS, specifically the High Performance Computing (HPC) architecture of the Product Generation and Product Distribution subsystems.
The following sections expand on various aspects of the GOES-R GS, including driving requirements, novel architecture, and preliminary test results.
Section 2, Mission Overview, describes the GOES-R mission and sensor data characteristics, as well as the key driving requirements of the GS.
Section 3, Subsystems Design and Implementation, describes the novel, service-oriented, high-performance architecture that enables the processing of raw sensor data into higher-level science products by the Product Generation and Product Distribution subsystems.
Section 4, GS Performance Test Results, presents the results of pre-launch testing of the GS.
Section 5, Conclusions, presents a synopsis of some of the key points made in this paper.
2. Mission Overview
Each GOES-R series satellite will have two earth-observing sensors,
i.e., the Advanced Baseline Imager (ABI) [
3] and the Geostationary Lightning Mapper (GLM) [
4], as well as four sensors to provide solar imagery and space weather measurements. The four sensors are the Solar Ultra Violet Imager (SUVI), the Extreme Ultraviolet and X-ray Irradiance Sensors (EXIS), the Space Environment In-Situ Suite (SEISS) and the Magnetometer (MAG) [
1,
2].
The ABI provides the earth-viewing, 16-channel Cloud and Moisture Imagery (CMI), with four times the spatial resolution, three times the spectral information, and five times the temporal resolution of the current five-channel imager. Generation of the CMI data products is the mission’s Key Performance Parameter (KPP), representing the minimum data products that must be created to meet operational objectives. The ABI can operate in two modes or timelines: Mode 3, or flex mode, and Mode 4, or continuous full-disk mode. In Mode 3, the Earth’s full hemisphere is imaged every 15 min, a Continental U.S. (CONUS) image is collected every 5 min, and one mesoscale image (1000 km × 1000 km at the satellite sub point) is collected every 30 s. In Mode 4, the Earth’s hemisphere is imaged every 5 min. The GLM is a new operational instrument for providing total lightning detection. This includes in-cloud and ground flashes during day and night, with storm-scale resolution of about 10 km and a latency of 20 s or less, encompassing much of the Western Hemisphere.
GOES-R data and products are grouped into five categories based on the level of processing applied [
5]:
Instrument Data: Output data from an instrument, which consists of raw science data, instrument engineering telemetry, and associated spacecraft telemetry.
Level 0 Data: Reconstructed unprocessed instrument data at full resolution, with any communications artifacts, such as synchronization frames and headers, removed.
Level 1b Data: Level 0 data, with calibration and geometric correction applied to produce parameters in physical units (e.g., ABI radiances mapped to an ABI fixed grid or geographical latitude/longitude projection).
Level 2 Data: Derived environmental variables, such as sea surface temperature, at a temporal and spatial resolution comparable to the Level 1 source.
Level 2+ Data: All Level 2 and higher products.
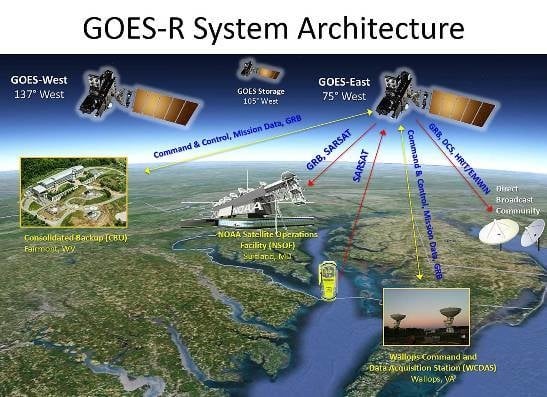
The GOES-R Ground System (
Figure 1) has three geographically separate operational sites. The first of these, the Wallops Command and Data Acquisition Station (WCDAS) in Wallops, Virginia, will provide the primary Mission Management (MM) satellite command and control services and selected Product Generation (PG) and Product Distribution (PD) services. These services convert the raw satellite sensor measurements to L1b data and distribute CMI from ABI to the National Weather Service (NWS). The second operational GS site is the Consolidated Backup Unit (CBU) in Fairmont, West Virginia, which performs all MM, PG and PD functions performed at WCDAS as a redundant, secondary “hot backup”. The GS is designed to failover from WCDAS to the CBU and transition to operational status within five min when directed by the ground operators.
The L1b data from all GOES-R instruments is rebroadcast as GOES Rebroadcast (GRB) data over the Western Hemisphere from either WCDAS (primary) or CBU (redundant backup). Users with a direct broadcast readout receiver antenna can receive this data in real time. The GRB data rate is 31 Mbps in the L-band.
Figure 1.
GOES-R System Architecture.
Figure 1.
GOES-R System Architecture.
The third operational GS site is the NOAA Satellite Operations Facility (NSOF) in Suitland, Maryland. The GRB data is received at NSOF by the GS. The ABI L1b data is then extracted from the GRB stream and processed into higher-level products (Level 2+), as shown in
List 1. All L1b and L2+ products are distributed to external users from NSOF. All satellite operations at the three sites can be run from NSOF.
There are several key requirements that the GS architecture must meet [
6]. Some of these drive the design of the GS, including:
Product Latency—Stringent latency requirements are associated with many of the L1b and L2+ products generated and distributed by the GS. All sensor data has to be processed in real time as the data is received, and meteorological products, such as CMI, have to be created and distributed at low latencies. For example, the raw ABI measurements have to be calibrated, navigated and geolocated to a geographic projection and then used to generate and distribute CMI within 50 s for a Full Disk image. Each L2+ product has unique refresh and coverage requirements corresponding to the Full Disk, CONUS, and Mesoscale coverage regions. The product latencies were defined by the NOAA user community during program formulation as part of the requirements development process and were driven by the users need to have timely access to the products for their operational needs, such as weather forecasting.
Modular, scalable and extensible design capable of:
- ○
Mission Management for up to four satellites simultaneously;
- ○
Product Generation and Distribution for high data rate / high throughput for three satellites (~105 Mbps × 3 satellites × 24 h/day × 365 days/year) agnostic of mission, sensor type or algorithm.
List 1.
Baseline GOES-R Products. Products highlighted in blue are L1b products created and re-broadcast as GRB from either WCDAS or CBU. Due to the very low latency requirements for lightning data from GLM, GRB has both L1 and L2+ products from GLM. Products in yellow are higher ABI Level 2+ products created from GRB at NSOF.
| Advanced Baseline Imager (ABI) | | Geostationary Lightning Mapper (GLM) |
|---|
Aerosol Detection (Including Smoke and Dust) Aerosol Optical Depth Clear Sky Masks Cloud and Moisture Imagery (KPP) Cloud Optical Depth Cloud Particle Size Distribution Cloud Top Height Cloud Top Phase Cloud Top Pressure Cloud Top Temperature Derived Motion Winds Derived Stability Indices Downward Shortwave Radiation: Surface Fire/Hot Spot Characterization Hurricane Intensity Estimation Land Surface Temperature (Skin) Legacy Vertical Moisture Profile Legacy Vertical Temperature Profile
| | - 1.
Lightning Detection: Events, Groups & Flashes (L1b and L2+)
|
| Space Environment In-Situ Suite (SEISS) |
- 2.
Energetic Heavy Ions - 3.
Magnetospheric Electrons & Protons: Low Energy - 4.
Magnetospheric Electrons & Protons: Medium & High Energy - 5.
Solar and Galactic Protons
|
| Magnetometer (MAG) |
- 6.
Geomagnetic Field
|
| Extreme Ultraviolet and X-ray Irradiance Sensors (EXIS) |
- 7.
Solar Flux: EUV - 8.
Solar Flux: X-ray Irradiance
|
- 19.
Radiances
| Solar Ultraviolet Imager (SUVI) |
- 20.
Rainfall Rate/QPE - 21.
Reflected Shortwave Radiation: TOA - 22.
Sea Surface Temperature (Skin) - 23.
Snow Cover - 24.
Total Precipitable Water - 25.
Volcanic Ash: Detection and Height
| - 9.
Solar Imagery (X-ray)
|
No single point of failure at any site for L0, L1b, GLM, GRB, and CMI product generation and distribution.
High system availability and reliability to ensure mission operations. For example, factoring in all system availability and redundancy requirements, calculated downtimes cannot exceed:
- ○
0.14 s/year—Spacecraft Command & Control;
- ○
2.9 s/year—Rebroadcast Signal Sent to Satellite;
- ○
3.9 s/year—Deliver of CMI KPP to NWS;
- ○
6.7 min/year—Availability of Weather Products Delivered to external users.
Hardware and software are “hot-swappable”, “plug-and-play”, and modular to minimize impact to ongoing operations in the event that a unit is upgraded or otherwise modified.
GS software designs for product generation algorithms should be stand-alone and modular so that algorithm changes, additions and deletions can occur without impacting the performance of existing algorithms or systems.
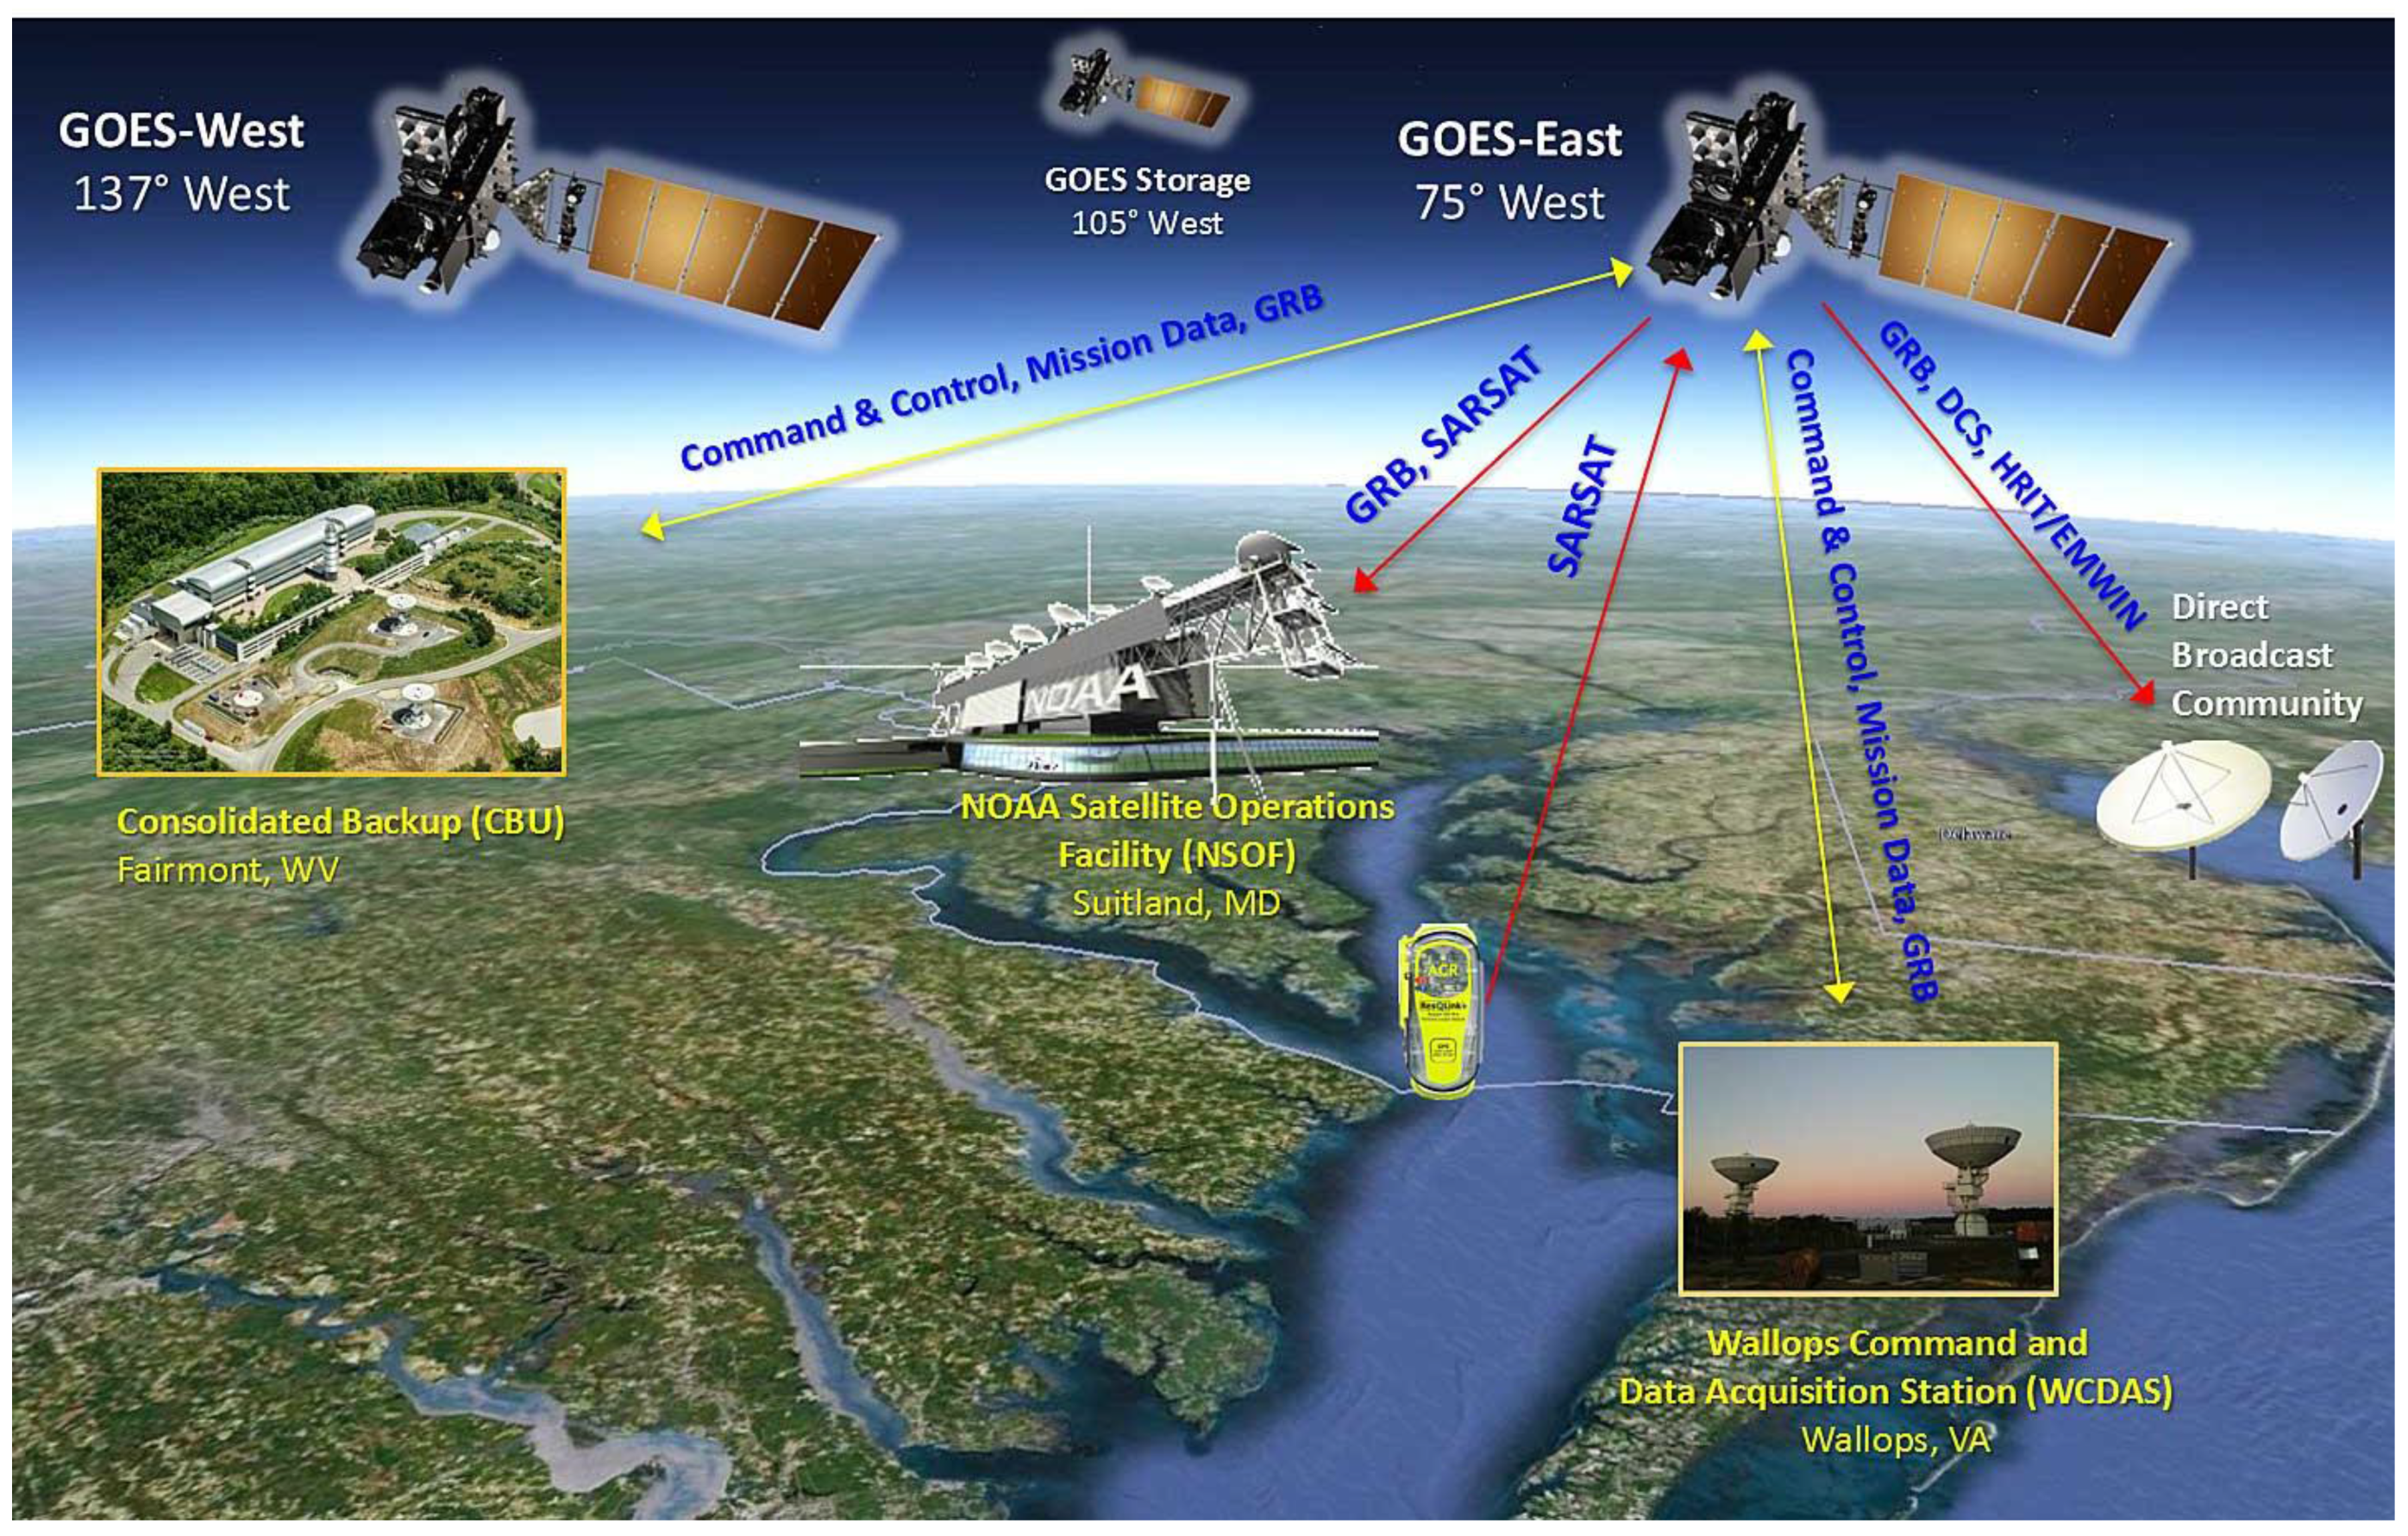
ABI products have to be generated using a product precedence chain. Radiances are processed to generate CMI (
i.e., reflectance and brightness temperatures). Together, the CMI and Radiances are used with dynamic ancillary data (e.g., Numerical Weather Prediction data) and Community Radiative Transfer Model processed ancillary data to derive the cloud mask (Clear Sky Masks product). In turn, outputs from Cloud Mask processing are used with other inputs to support Sea Surface Temperature processing (
Figure 2). The GS design accounts for the product refresh and coverage requirements, as well as any derived requirements associated with the precedence chain dependencies.
Figure 2.
End-to-end algorithm precedence flow of ABI L2+ products. Each box is an algorithm that generates a set of L2+ products using inputs that are color coded. For example, Derived Motion Winds uses six precedent inputs, as shown next to “inputs”. Since the first five inputs are used upstream to generate the Cloud Height products, only the arrow for this latest precedent input is shown.
3. GOES-R Product Generation and Product Distribution Subsystems Design and Implementation
The decision to design and implement a high-performance computing architecture rests, in part, on assessments of several available hardware and software alternatives to ensure an optimum solution. Several successful high-performance approaches have been demonstrated that divided the input data into equal-sized blocks, with the blocks distributed uniformly among the available nodes of the computing cluster [
7]. The computing cluster could either be located at a single site [
8] or distributed at several locations [
9]. Each data block could be multi-dimensional (spatial, spectral, and temporal). This implementation is highly suitable for algorithms for which each compute node processes the data independently (also known as “embarrassingly parallel”). Message Passing Interface (MPI) [
10] is the protocol most commonly used to orchestrate the sending of messages and data among the computing cluster [
11]. In addition to advances in HPC software implementations using commodity hardware, there are also new developments in specialized hardware devices, such as field programmable gate arrays (FPGAs) and Graphic Processing Units (GPUs), that are relatively low in cost compared to clusters or networks of computers, e.g., [
12,
13].
When the HPC is needed to process disparate data from multiple sensors, each with unique data structures, and to manage multiple, high-throughput functions, a Service Oriented Architecture (SOA) design is considered optimal. In a SOA-based design, a service is provided by a software module that performs a specific set of functions, generally self-contained, with multiple services coupled into a larger system. In this way, each data processing algorithm can be encapsulated as a service. Multiple services can communicate and exchange data using standardized interfaces and open communications protocols that are agnostic to the underlying hardware. The SOA architectural concept allows for the design, development and integration of modular, loosely coupled, reusable software components at different levels of granularity. Services are dynamic (
i.e., they can be added, started or stopped without impacting operations) and can communicate with each other to perform as a system of manageable services, which results in an application [
14,
15,
16]. Given these advantages and the complexity otherwise associated with integrating and managing several components of the data processing system, the GOES-R product generation and distribution HPC system has been implemented within a SOA architecture. This approach is described below.
Within the GOES-R GS, the real-time ingest and processing of satellite data involves three steps. The first step is to aggregate data from the satellite into data blocks and distribute them among the nodes of the computing cluster. The second step is to pass the processed blocks to downstream algorithms in accordance with product precedence rules, as shown in
Figure 2. The third step is to aggregate the end-product blocks into a NetCDF file for distribution to users. In keeping with the SOA design concept, each science algorithm is executed as a service, given that each performs a specific function.
Each processing step involves manipulation of the data blocks and subsequent updates to associated metadata. For example, block-level statistics are computed for each product and are subsequently aggregated to file level. What constitutes a data “block” varies as a function of the processing in a given step, while size is determined by the characteristics of that part of the pipeline. For product processing, formatting, and storage functions, data blocks are defined and sized to ensure that product latency requirements are satisfied. This often means optimizing data block size based on the computational, storage, and network characteristics associated with the processing step.
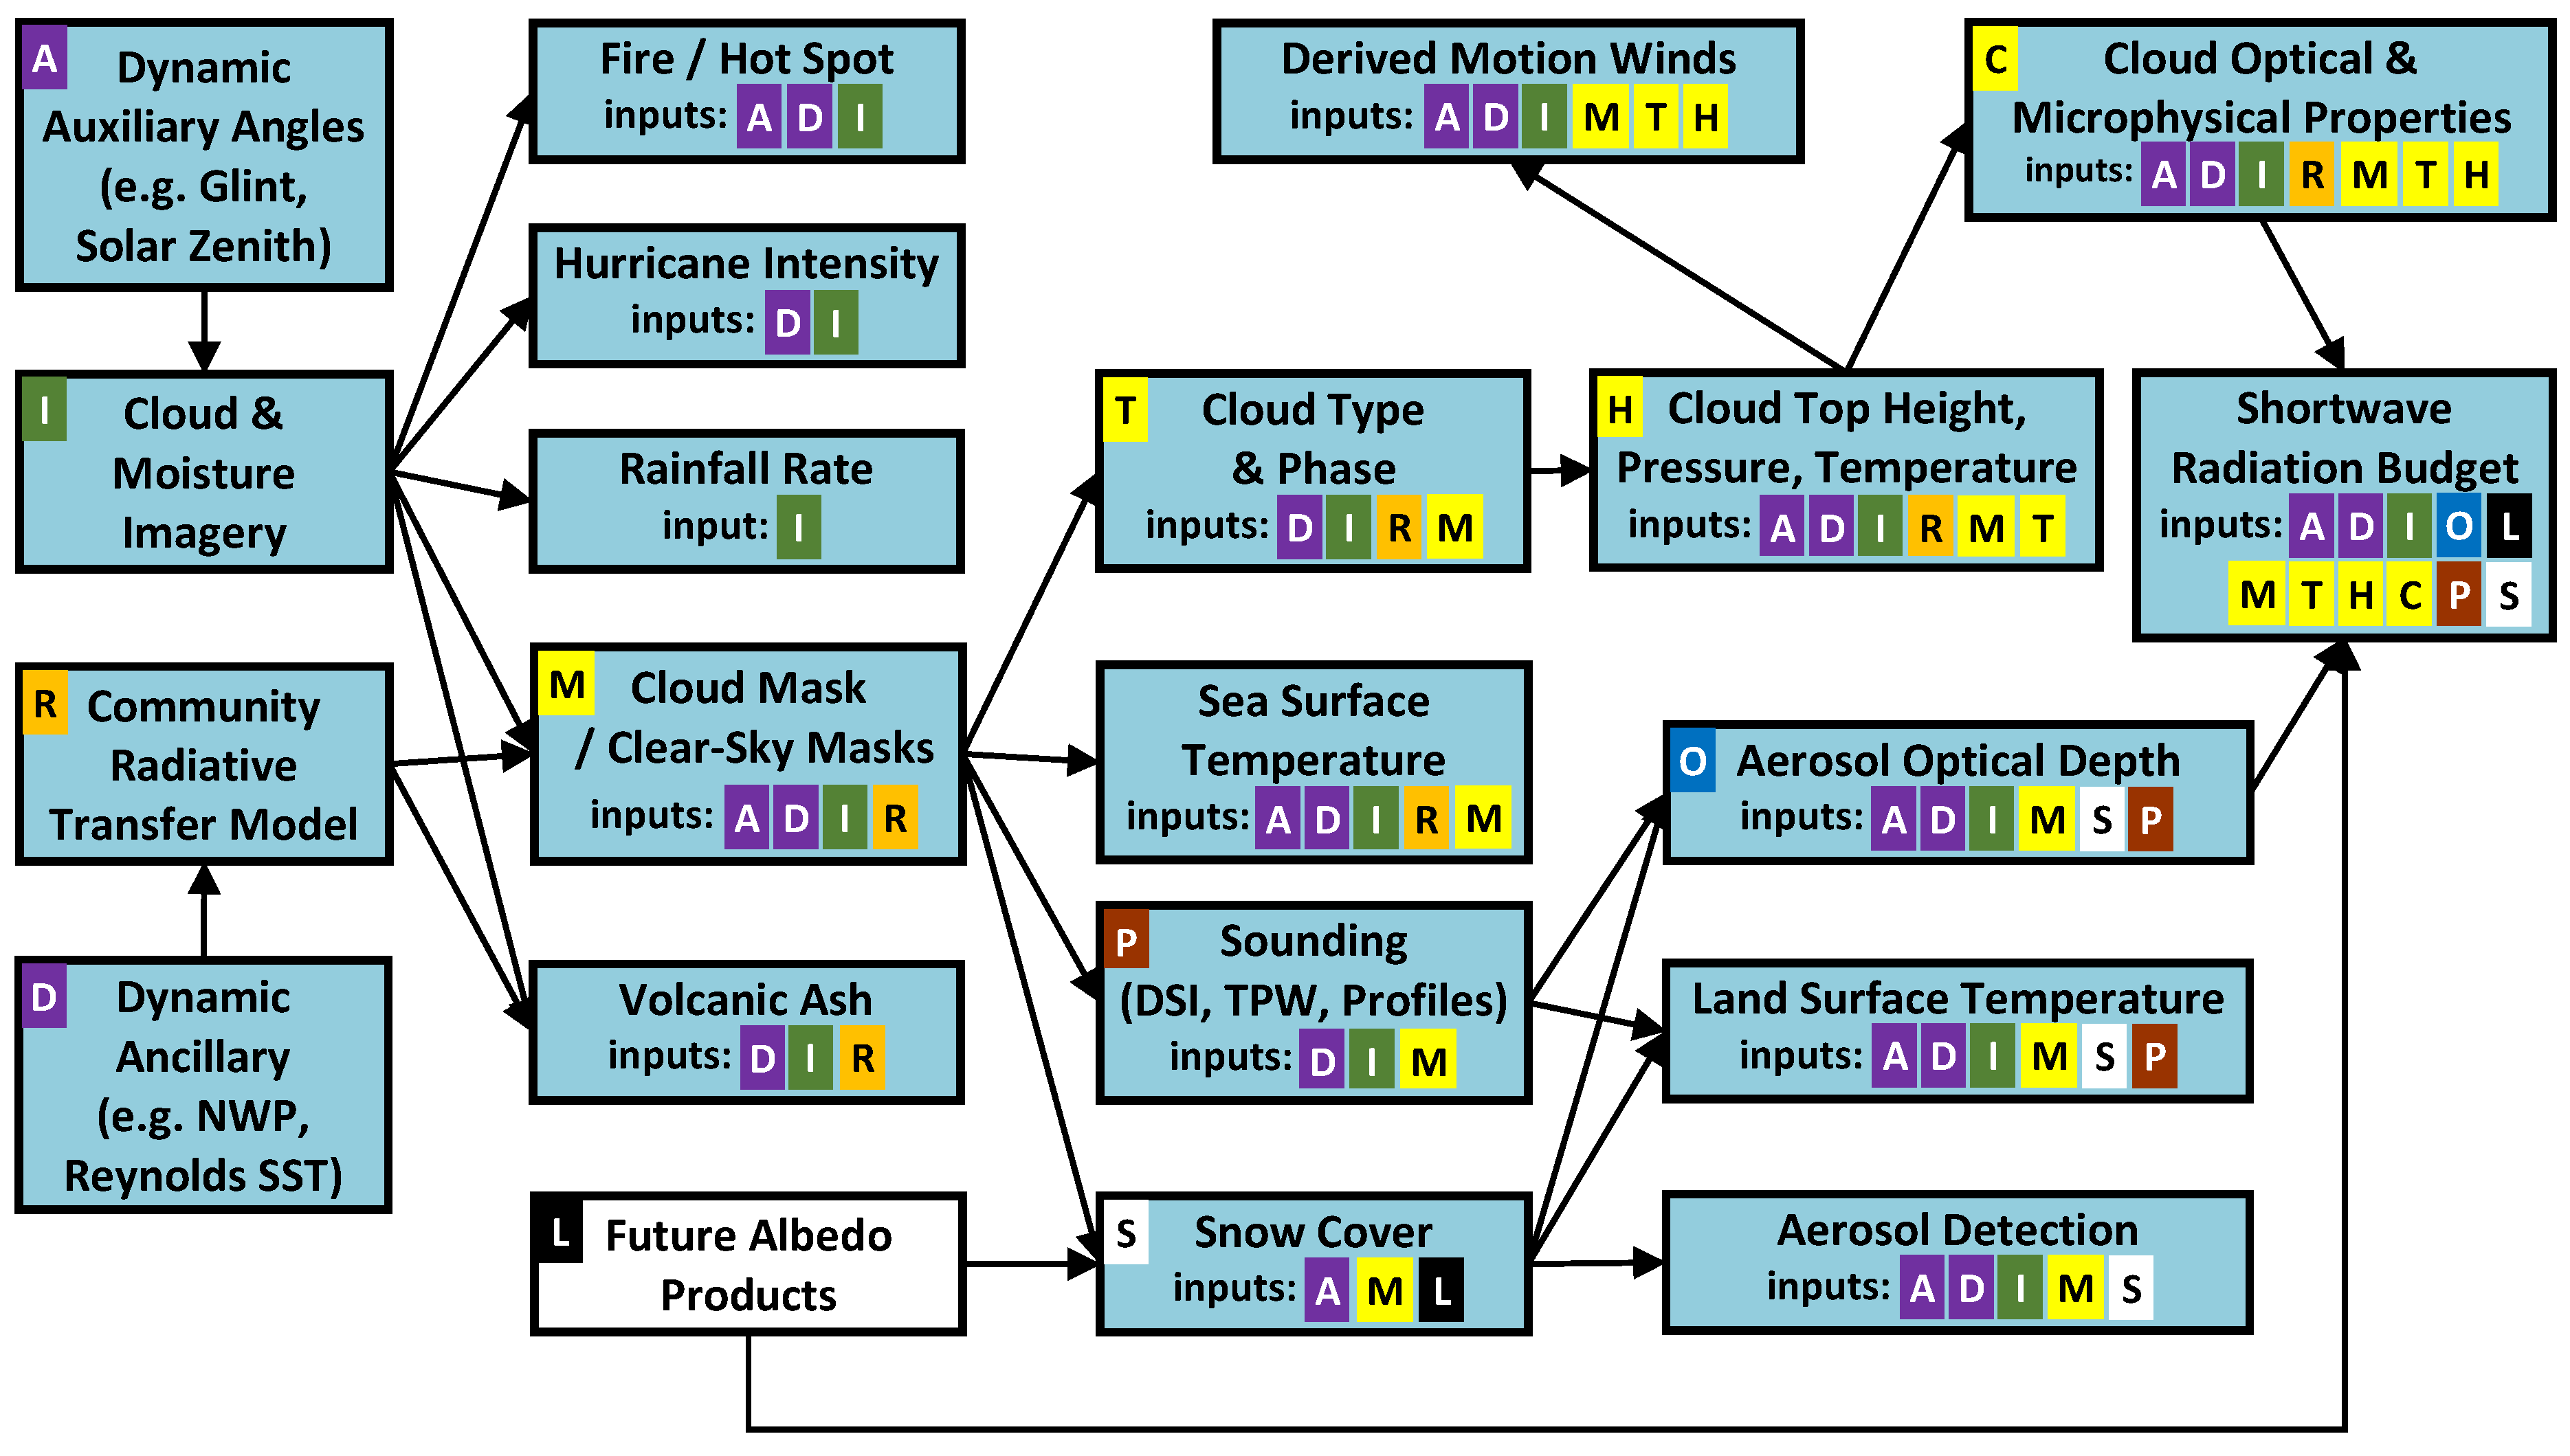
The data processing steps are accomplished using a three-layered, SOA-based software architecture, as shown in
Figure 3:
The top-most layer is the Management Layer, consisting of two software components: the Resource Manager and the Service Manager.
- ○
The Resource Manager manages and provisions the algorithm services among the available hardware resources based on a predefined workload configuration to execute each algorithm as a service. The configuration of an algorithm service is predetermined and includes the product precedence structure, i.e., inputs and outputs; the definition of the product processing block sizes; and the number of computing nodes needed to process the input data into an output product block at the start of the system. These service configurations are empirically verified and optimized based on several runs of an algorithm under stressing cases to arrive at processing parameters and resources needed to meet latency and product refresh rate. Processing margin is added to the observed values to ensure that the system has excess capacity. The Resource Manager also manages all other non-service jobs on the PG servers.
- ○
The Service Manager provides centralized logging and collection and reporting of hardware and software status, including any failure or problems, such as server availability, through an Enterprise Service Bus (ESB) to the GS operators. The Service Manager also starts and stops algorithm services and functions.
The Compute Layer comprises hardware and algorithm software that read data and write processed data blocks from the Data Layer. This layer provides an execution environment for Product Generation algorithms and Product Distribution services. Each algorithm is encapsulated in a service that subscribes to data from the Data Layer such that it is notified when data is available to process. When notified, it then reads the data from the Data Layer and processing by the algorithm begins. It publishes output product blocks from the algorithm to the Data Layer. This approach decouples the algorithms from the data access and management operations, thus minimizing internal dependencies and processing overhead.
- ○
The Compute Layer hardware for PG and PD consists of a mix of IBM HS22 and HS23 blade servers. The IBM HS22 blade servers are equipped with a pair of Intel Xeon E5640 2.66 GHz quad-core processors, with either 192 GB (for Product Processing, Cache and Product Performance) or 72 GB (for Ingest, L0 Processing, GRB Processing and Resource Management) of system memory. The IBM HS23 blade servers are equipped with a pair of Intel Xeon E5-2643 3.33 GHz quad-core processors, with either 192 GB (for Product Processing, Cache and Product Performance) or 96 GB (for Ingest, L0 Processing, GRB Processing and Resource Management) of system memory. There are a total of 240 IBM blade servers used for operational product processing in the GOES-R GS.
The Data Layer provides a high-performance, high-availability messaging system for retrieving and storing data during product processing. In the GOES-R GS, the Data Layer is also referred to as the Data Fabric (DF), in that it acts like a fabric woven from the data services between algorithms and enables the processing and seamless transfer of data blocks. The DF consists of a reliable, solid-state, distributed-network-based RAM caching system. This system provides high throughput, low latency, flow control, fault tolerance, and linear scalability, with direct access to its contents from computer servers on a network. All of these features are key to satisfying requirements for product latency, operational availability, data delivery, and scalability. The DF caching system allows services and other DF clients to efficiently exchange data, whether operating locally or distributed across the network. The DF also provides messaging technology used to exchange messages regarding data in cache. Messages are sent using a dedicated messaging appliance following the Java Message Service (JMS) Application Programming Interface (API) specifications. This technology utilizes Publish/Subscribe architecture to allow DF clients to register for notifications of data pushed into the cache and supports both synchronous and asynchronous, one-to-one and one-to-many messaging patterns. This data and communications throughput includes publishing, caching, and retrieving data in support of product processing and distribution across a network of PG and PD computers. The Data Fabric is designed to have:
- ○
Sustained aggregate data throughput greater than 3000 Mbps
- ○
Sustained aggregate transactions greater than 500/s
- ○
Individual product data throughputs greater than 500 Mbps
- ○
The DF is designed to support concurrent reads and writes for both PG and PD. For example, when an algorithm service, which is a client to the DF within PG, finishes processing a region or block of data, it is published onto the DF. The Product Distribution services that subscribe to this block of data are then notified by a message that this data is available. The PD services then aggregate the product data blocks into NetCDF files and make them available to the external data distribution systems.
Within the Processing Services of the Compute Layer, a Data Model Interface (DMI) provides a standard mechanism to exchange data between algorithms and the Data Fabric (i.e., between the Compute Layer and the Data Layer). Additionally, “context” information within each algorithm describes the size and location of each data block within the larger data grouping that the distributed processing services will utilize. For example, the full disk image of ABI, which is 5424 rows × 5424 columns of pixels at 2 km spatial resolution, is broken into blocks of pixels. The size of the block varies by algorithm and is optimized to meet performance. Each block is a region that will be populated by output results from an algorithm execution. The blocks do not overlap. The outputs blocks are pieced together to form the final product file. This block is defined as the “context” and the context definition has a time stamp, size, and location of the data block within the full disk image. To generate its outputs for this context region, an algorithm may request input data which is the same size as the context region or larger than the context region. For many algorithms, the input regions are the same as the context. For some algorithms that use neighborhood information, the input ranges are larger than the context range so that the neighborhood operations can be performed for pixels at the context boundaries. In addition, the input ranges may be different for each input. Each algorithm subscribes to the input data it requires to execute for each of the input ranges required. These subscriptions mean that processing of data within a context will only begin when all the input data is populated by the preceding processes. An algorithm may have more than one context, i.e., blocks of different sizes. It should be noted that the image does not have to be evenly divisible by the context size. There will be blocks at the edge of the image which may have a different context than the rest of the image. Additionally, processing can start and end anywhere within the two dimensional space of the image. This level of flexibility offers the capability to process datasets at multiple spatial resolution.
Figure 3.
The Product Generation and Distribution Architecture and Data Flows at NSOF. “Custom” refers to software that was developed by the software engineers specifically for the GS. Commercial Off The Shelf (COTS) is a commercial software package that was integrated in to the system.
Figure 3.
The Product Generation and Distribution Architecture and Data Flows at NSOF. “Custom” refers to software that was developed by the software engineers specifically for the GS. Commercial Off The Shelf (COTS) is a commercial software package that was integrated in to the system.
As shown in
Figure 3, the data flow at NSOF can be described in five steps: (1) the Mission Management System receives data from the GS antenna and sends the Level 1b data to PG to be published onto the DF (note that Mission Management does not interface directly with the DF); (2) once all the data subscribed to by an algorithm is available, the algorithm service is notified through a message; (3) after the data is processed by an algorithm service, it is put back on the DF for downstream processing; (4) the previous steps are continuously repeated; (5) PD services subscribe to the DF in order to receive completed output products as they become available from PG and distribute these products to the external interfaces and short/long-term storage depending on how specific products are configured.
PG element operations, in terms of real-time product data/metadata generation, are largely automated and thus capable of 24 × 7 “steady-state” operations without human intervention, assuming no configuration changes are needed. When ABI data collection is switched between Mode 3 and Mode 4 timelines, data processing and product generation continues without interruption since two independent sets of services are always running to process either the Mode 3 or Mode 4 timeline. Even component failure recovery is automatic, providing ample time for corrective maintenance personnel to remove and replace failed components. The PG architecture’s inherent capacity to operate as a robust embedded capability supports the concept of near lights-out PG operations.
4. GS Performance Test Results
The SOA-based approach to producing operational satellite products described in
Section 3 was implemented and tested at the three GOES-R GS sites (
i.e., WCDAS, CBU and NSOF). Given that GS development and deployment necessarily precedes the launch of the GOES-R spacecraft, simulated data representing the output characteristics of each GOES-R instrument had to be created for testing the GS. The simulated data was created using either data from legacy sensors as a proxy or by generating synthetic data through modeling. For example, Weather Research Forecast (WRF) model profiles of the atmosphere based on meteorological observations were used to simulate top of the atmosphere radiances in ABI spectral bands through an advanced forward radiative transfer model [
17,
18]. Simulated data from all the GOES-R instruments were ingested into the system at operational data rates (~78 Mbps from each of two satellites) and the system was tested for the following capabilities:
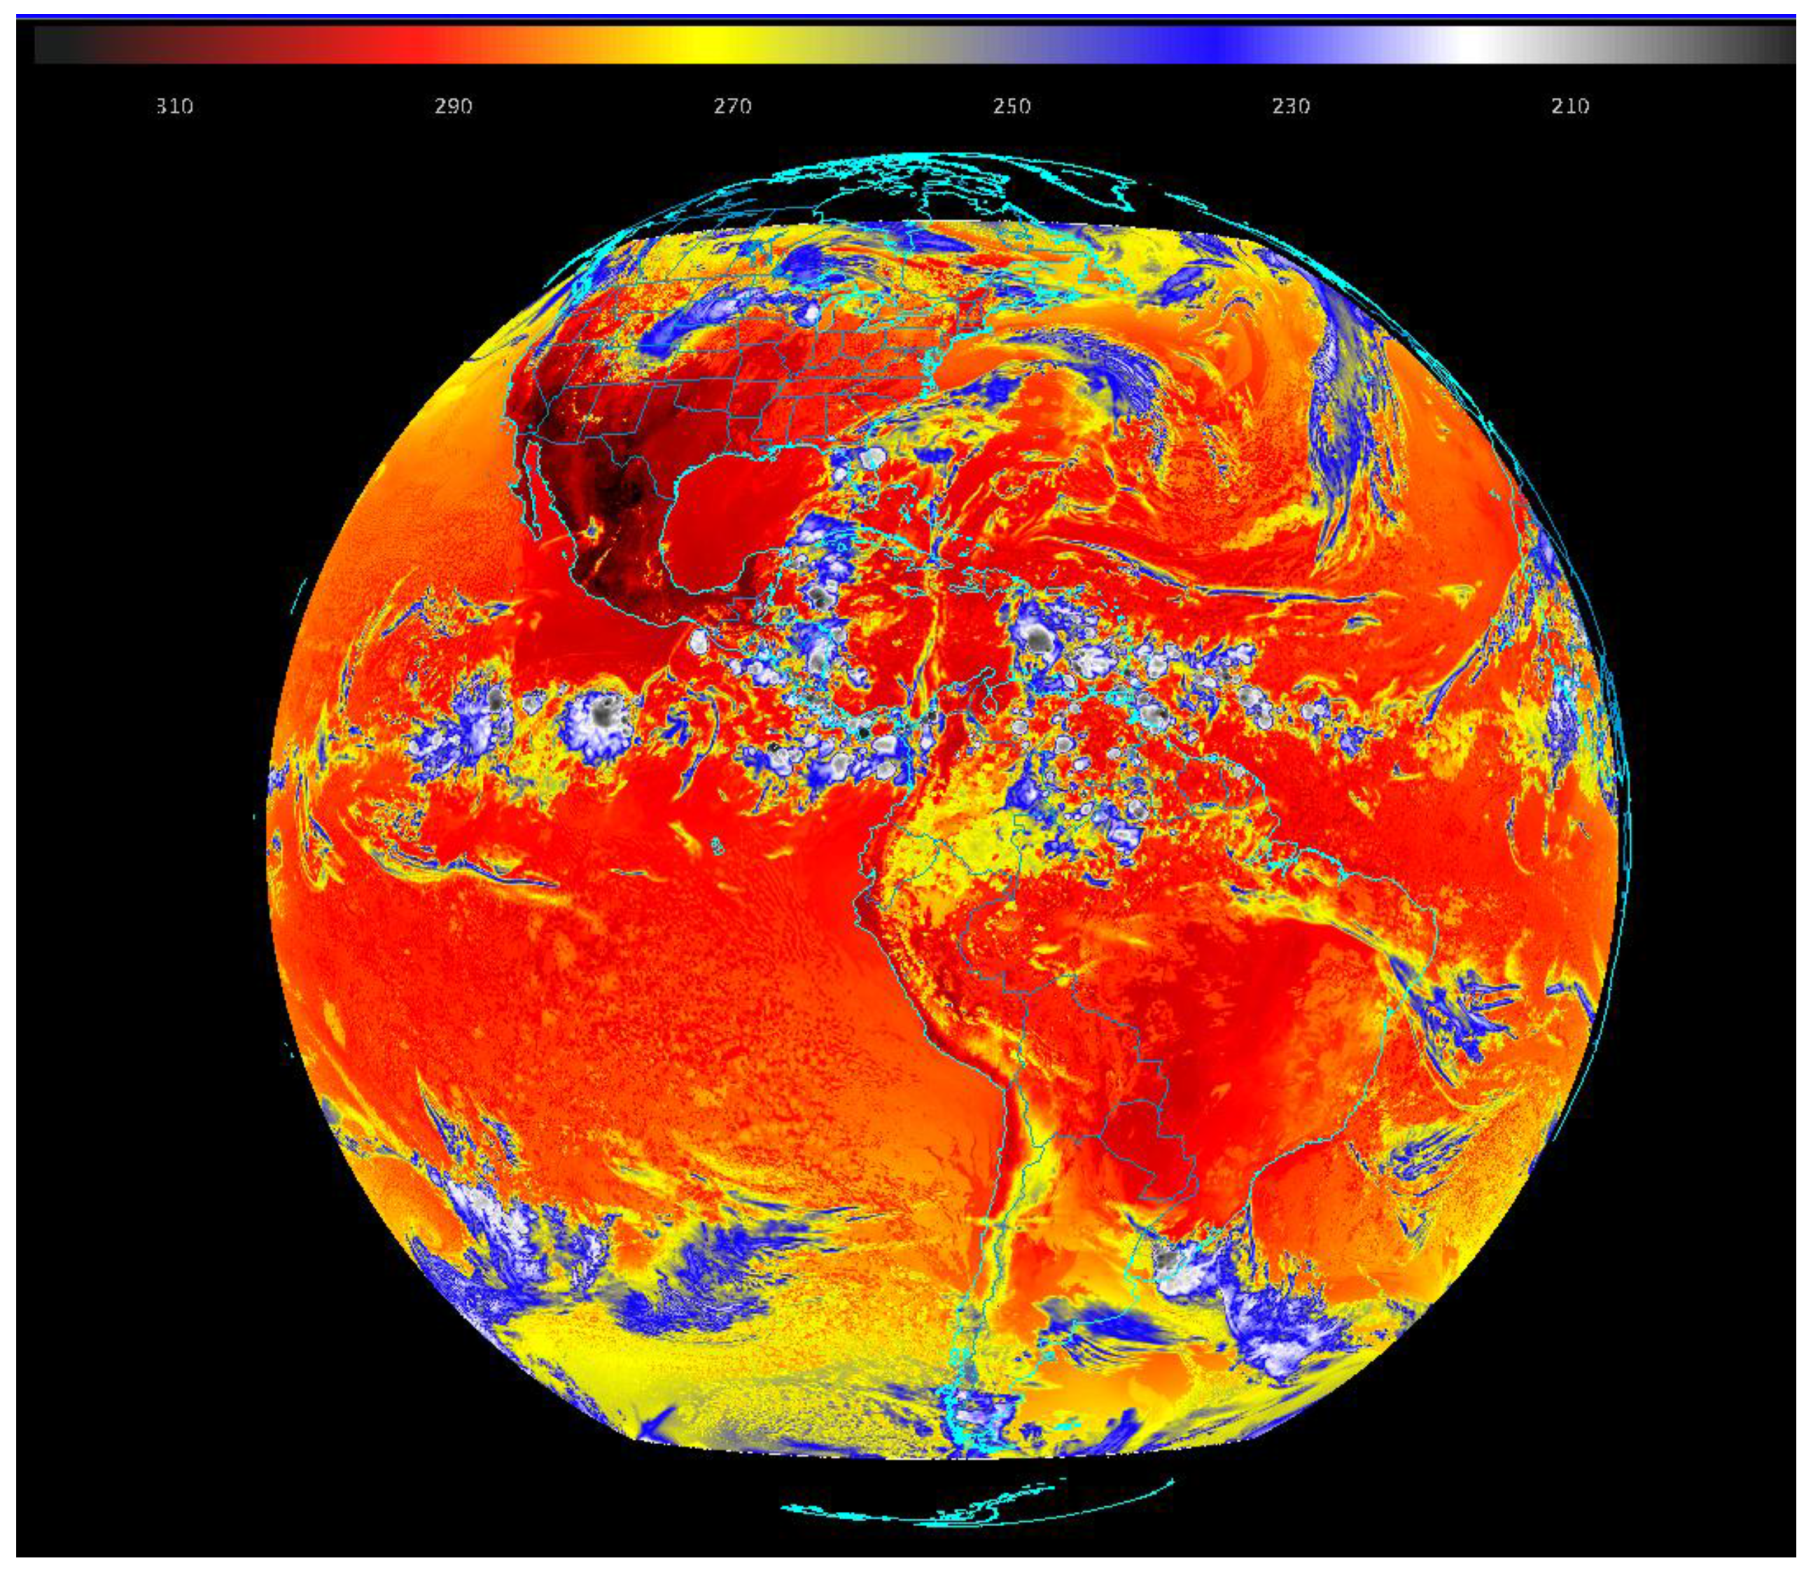
Figure 4 shows an example of a brightness temperature image generated by the GS using simulated ABI data in Band 13 (10.1–10.6 µm), and
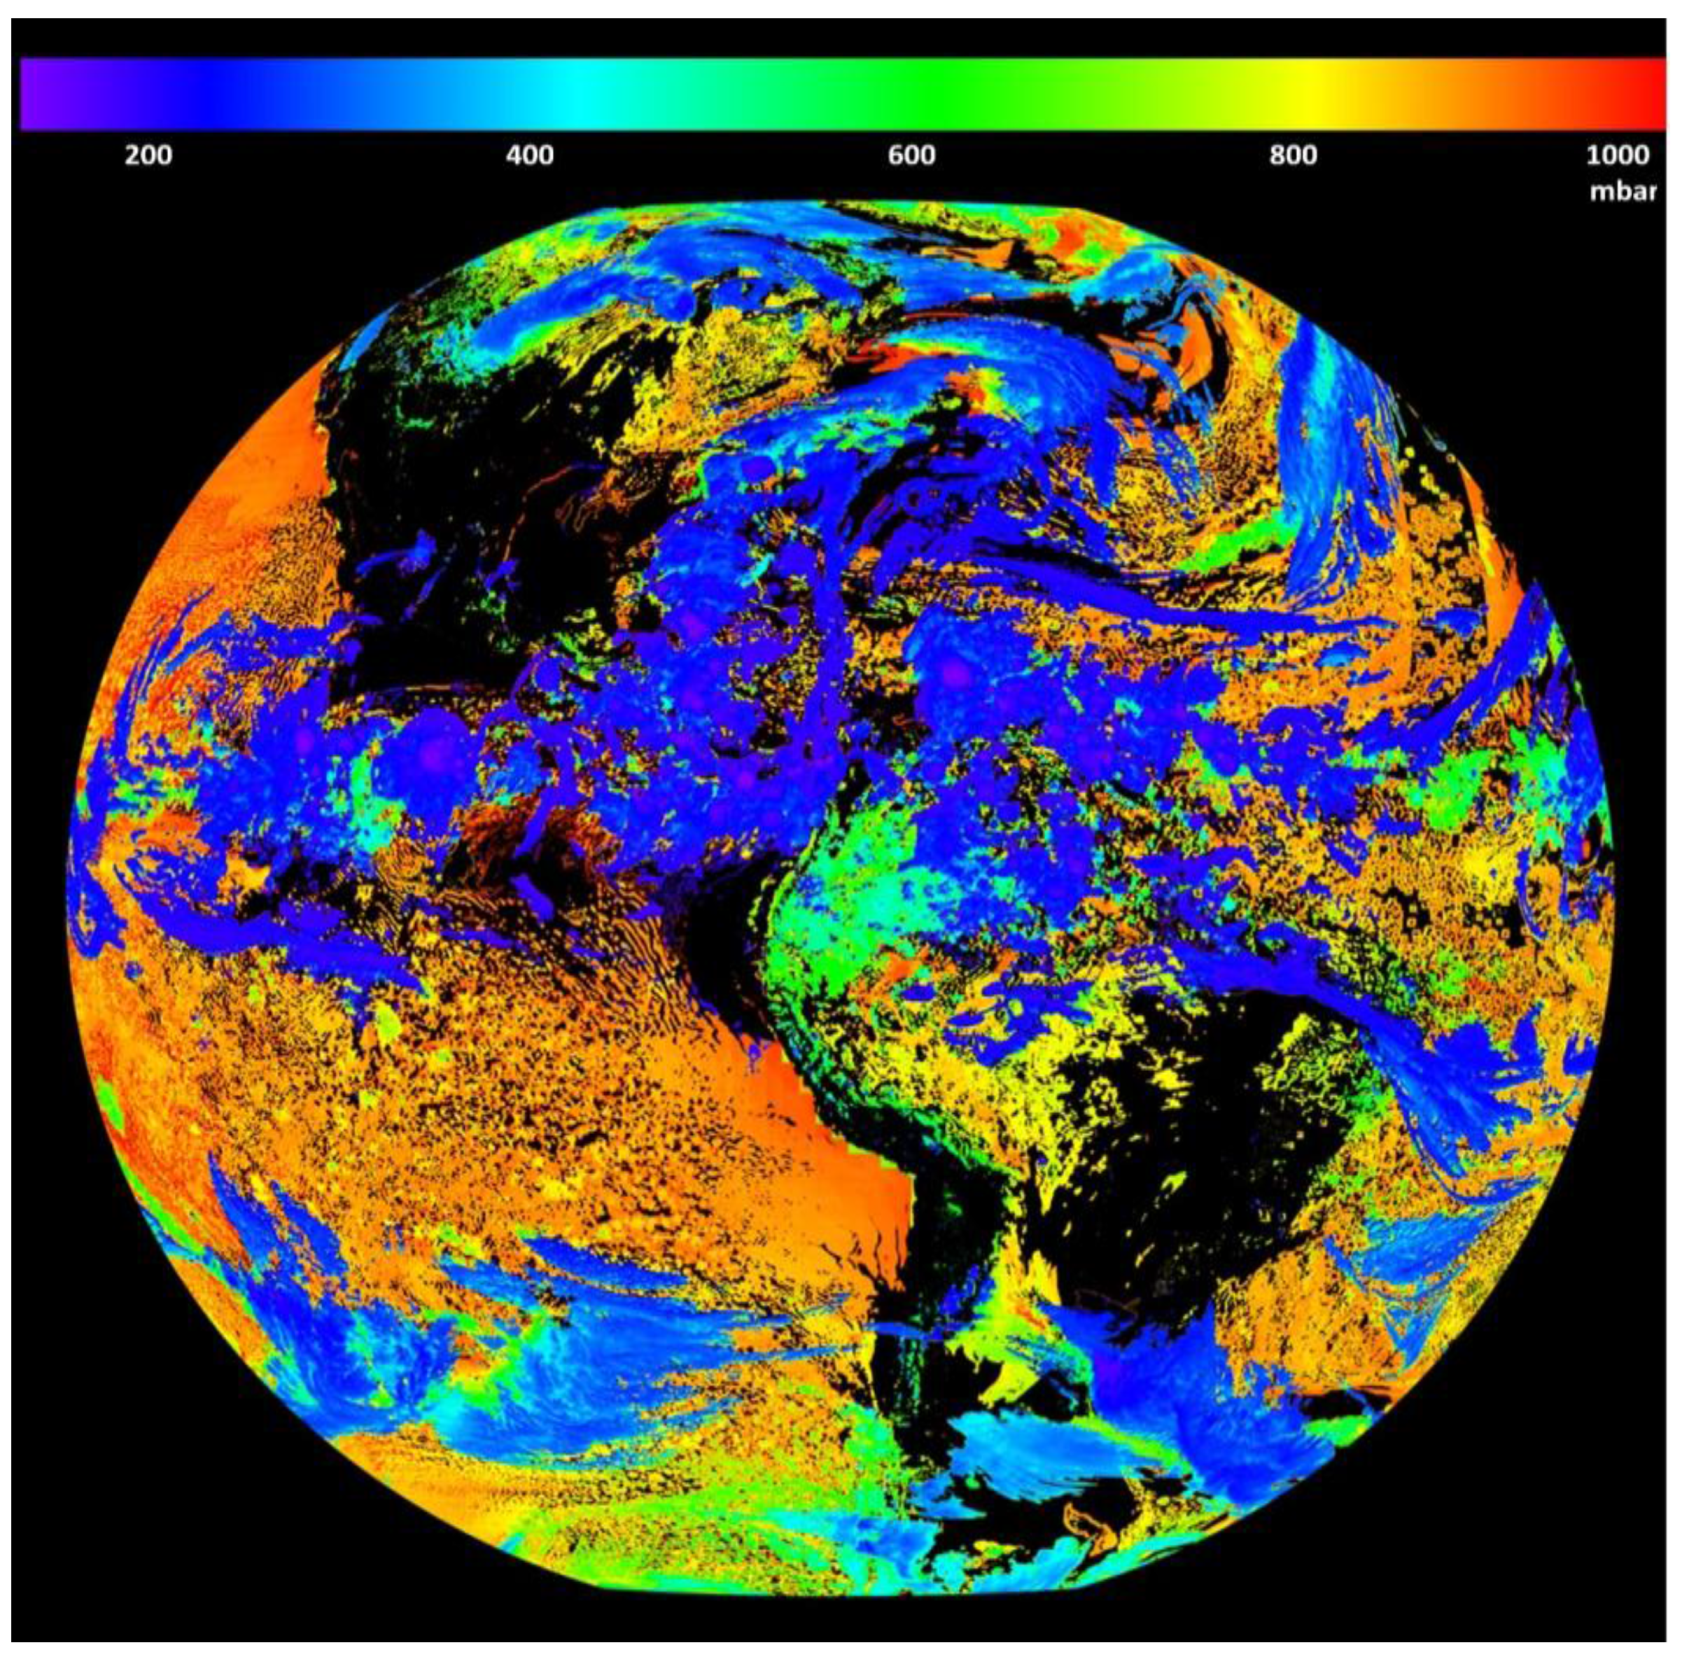
Figure 5 shows a cloud top pressure product created from simulated ABI data from GOES East (75°W longitude) location.
Figure 4.
Brightness temperature (K) image corresponding to ABI Band 13 (10.1–10.6 µm) generated by the GS using simulated ABI data (Courtesy: Cooperative Institute for Meteorological Satellite Studies).
Figure 4.
Brightness temperature (K) image corresponding to ABI Band 13 (10.1–10.6 µm) generated by the GS using simulated ABI data (Courtesy: Cooperative Institute for Meteorological Satellite Studies).
Figure 5.
Cloud top pressure (mbar) generated by the GS using simulated ABI data.
Figure 5.
Cloud top pressure (mbar) generated by the GS using simulated ABI data.
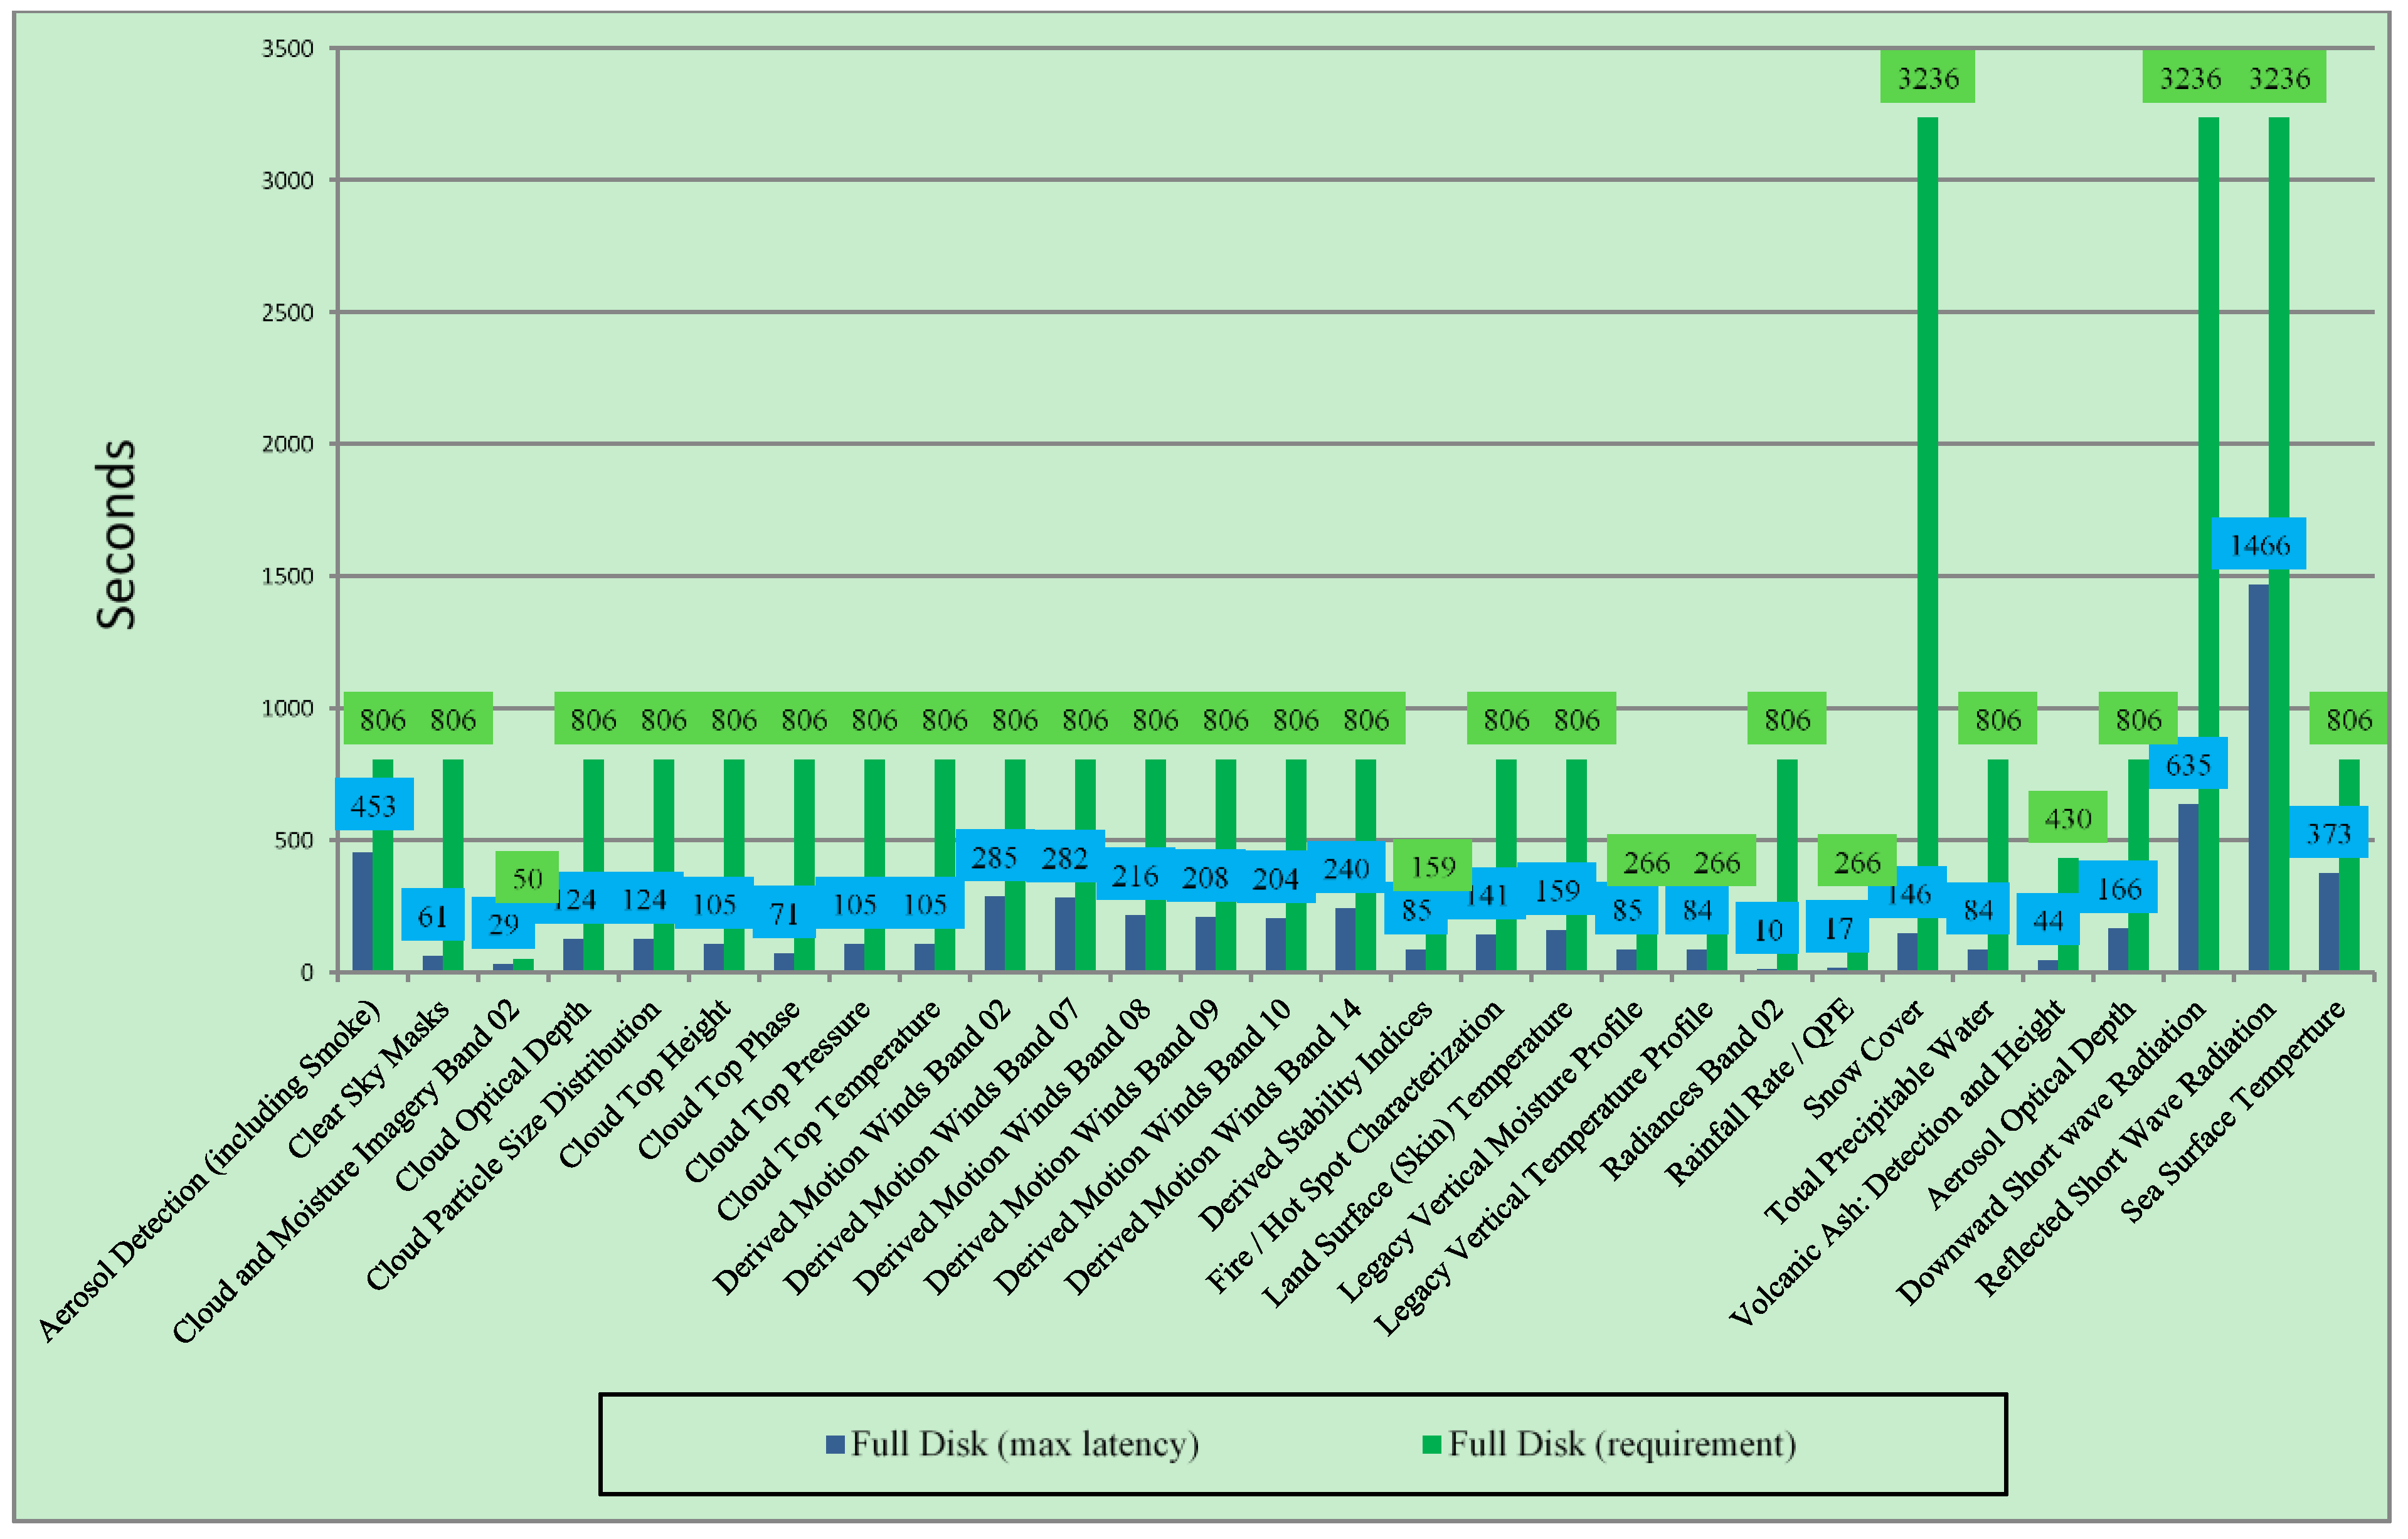
Figure 6.
Product latency measured for a full disk ABI scene. Full disk imagery is collected every 5 min. Green bars indicate required values and blue bars measured values. Latencies for CMI Band 2 are shown because it has the highest spatial resolution at 0.5 km pixels and represents the stressing case.
Figure 6 shows the required and actual latency in creating all the ABI products listed in
List 1. All products were created well below the required latency. It should be noted that the product latency specifications were sometimes higher than the expected values since they were specified on an individual product basis, as if each algorithm is run with all the precedence inputs readily available at the time of execution. However, in the integrated system, the output product from one algorithm is often an input to another algorithm. Therefore, to achieve the required latency for a downstream algorithm, algorithms early in the precedence chain must have better latency performance than the specification. For example, the specified latencies for generating full disk radiances and CMI are 266 s and 50 s, respectively. However, since radiances have to be generated before CMI, the derived latencies for radiances have to be well below 266 s.
Failover of services was tested by stopping and starting servers, during which, failed services were automatically started on redundant backup servers and data production continued. Algorithms running in precedence were switched at predetermined times to a different version while the system was running. The switchover was seamless. In addition, datasets with missing data were run through the algorithm chain to demonstrate system stability in non-ideal processing conditions. Note that for missing data scenarios, re-processing is not required with the GOES-R GS. The impact on algorithms from external failures, such as those to fileservers, network switches, and databases, was tested to demonstrate that algorithm performance is not vulnerable to external factors, given the level of hardware redundancy.
Reproducibility testing was performed to ensure that product integrity and latency was repeated over time and that overall system performance remained steady. Statistical comparisons were executed between products to prove repeatability throughout the algorithm chain, and product counts were performed to ensure consistency between runs. During testing, extended data sets containing varying ABI timelines and GLM and space weather products were used to demonstrate the PG capability to reliably produce approximately 27,700 products, totaling nearly 862 Gigabytes of output data, using standard NetCDF format and compression at the specified sensor suite data downlink rate over a four-hour period. Multiple 24-hour runs were used to validate successful L1b and CMI product generation and distribution to the National Weather Service.
5. Conclusions
To support GOES-R GS mission needs, the PG Subsystem must meet processing and reliability requirements that are unique and challenging. As designed, the PG Subsystem will process over two terabytes of data per day with 34 unique products, each with stringent latency requirements. These products also depend on each other for their data, creating an implicit precedence tree for processing. In addition, the system must be highly reliable, with only seconds of downtime allowed per month. The challenging latency, throughput, and reliability requirements of the PG Subsystem are accomplished by incorporating HPC within a SOA.
The DF provides the algorithm services with a messaging framework to quickly communicate with each other. It also abstracts the data, allowing algorithms to avoid the need to know which service produced the data or how it was produced. When data is available for a service to start, it begins processing immediately, with no need to coordinate with other algorithm services. The data abstraction enables operators to introduce new algorithms with “plug-and-play” simplicity, as algorithms need only communicate with the DF. In this way, new algorithms gain full access to the wealth of data available on the DF without requiring information about how other services are run. The SOA-based distributed data solution enables massive parallelization of algorithm processing and distribution services in the GOES-R architecture. The use of a commodity-hardware-based, high-performance compute grid to run CPU-intensive scientific algorithm services and a distributed in-memory DF to pass product data between interconnected algorithm and distribution services represents a significant advance in operational satellite data processing.
The latest information about the GOES-R program can be found at
www.goes-r.gov.
Acknowledgments
The views, opinions, and findings contained in this paper are those of the author(s) and should not be construed as an official National Oceanic and Atmospheric Administration or U.S. Government position, policy, or decision. Harris Corporation was funded by NOAA contract DG133E-09-CN-0094. The authors would like to thank Steven Goodman, Tim Schmit, Basil Chiasson, and the three anonymous reviewers for their valuable comments and feedback on the original manuscript. Their contributions led to significant improvements in the final published version. ABI L2+ algorithms were provided by the GOES-R Algorithm Working Group. The L1b algorithms were provided by the following instrument vendors: Exelis (ABI), Lockheed Martin (SUVI, GLM and Magnetometer), Laboratory for Atmospheric and Space Physics (EXIS), and Assurance Technology Corporation (SEISS).
Author Contributions
Satya Kalluri was the lead NOAA scientist for the GOES-R Product Generation System development. Brian Haman and Allan Weiner were the Harris Product Generation Integrated Product Team (IPT) leads, James Gundy designed the SOA architecture, and Dave Vititoe, Paul Van Rompay, and Anthony Paullin implemented the algorithms and the HPC system.
Conflicts of Interest
The authors declare no conflict of interest.
References
- Kalluri, S.; Gurka, J.; Race, R. Improved observations of earth and space weather from GOES-R. Proc. SPIE 2009, 7456. [Google Scholar] [CrossRef]
- Kalluri, S.; Sullivan, P.; Goodman, S. GOES-R, the Next Series of Geostationary Weather Satellites. Available online: http://www.ukipme.com/pub-meteorological.php (accessed on 12 August 2015).
- Schmit, T.J.; Gunshor, M.J.; Menzel, W.P.; Gurka, J.J.; Li, J.; Bachmeier, A.S. Introducing the next generation Advanced Baseline Imager on GOES-R. Bull. Am. Meteorol. Soc. 2005, 86, 1079–1096. [Google Scholar] [CrossRef]
- Goodman, S.J.; Blakeslee, R.J.; Koshak, W.J.; Mach, D.; Bailey, J.; Buechler, D.; Carey, L.; Schultz, C.; Bateman, M.; McCaul, E., Jr.; et al. The GOES-R geostationary lightning mapper (GLM). Atmos. Res. 2013, 125, 34–49. [Google Scholar] [CrossRef]
- GOES-R Series Acronym & Glossary Document, Version 1.2, P417-R-LIST-0142, September 2009. Available online: http://www.goes-r.gov/resources/Acronym-Glossary_V1-2.pdf (accessed on 10 August 2015).
- GOES-R Series Ground Segment (GS) Project Functional and Performance Specification (F&PS), Version 3.6, G416-R-FPS-0089, 13 February 2015. Available online: http://www.goes-r.gov/resources/docs/GOES-R_GS_FPS.pdf (accessed on 10 August 2015).
- Zhang, Z.; Kalluri, S.N.V.; JaJa, J.; Liang, S.; Townshend, J.R.G. Models and high-performance algorithms for global BRDF retrieval. IEEE Comp. Sci. Eng. 1998, 5, 16–29. [Google Scholar] [CrossRef]
- Kalluri, S.N.V.; JaJa, J.; Bader, D.; Zhang, Z.; Townshend, J.R.G.; Fallah-adl, H. High performance computing algorithms for land cover dynamics using remote sensing data. Int. J. Remote Sens. 2000, 21, 1513–1536. [Google Scholar] [CrossRef]
- Liu, F.; Seinstra, F.J.; Plaza, A. Parallel hyperspectral image processing on distributed multicluster systems. J. Appl. Remote Sens. 2011, 5. [Google Scholar] [CrossRef]
- Message Passing Interface Forum Home Page. Available online: http://www.mpi-forum.org/ (accessed on 10 August 2015).
- Chang, Y.; Hsieh, T.; Plaza, A.; Chen, Y.; Liang, W.; Fang, J.; Huang, B. Parallel positive boolean function approach to classification of remote sensing images. J. Appl. Remote Sens. 2011, 5. [Google Scholar] [CrossRef]
- Plaza, A.; Du, Q.; Change, Y.; King, R.L. High performance computing for hyperspectral remote sensing. IEEE J. Sel. Top. Appl. Earth Obs. Remote Sens. 2011, 4, 528–544. [Google Scholar] [CrossRef]
- Plaza, A.J.; Chang, C. High Performance Computing in Remote Sensing; Chapman & Hall: Boca Raton, FL, USA, 2008. [Google Scholar]
- Erl, T. Service-Oriented Architecture: Concepts, Technology, and Design; Prentice Hall: Upper Saddle River, NJ, USA, 2005. [Google Scholar]
- McGovern, J.; Sims, O.; Jain, A.; Little, M. Enterprise Service Oriented Architectures. Concepts, Challenges, Recommendations; Springer: Dordrecht, The Netherlands, 2006. [Google Scholar]
- The SOA Source Book. Available online: http://www.opengroup.org/soa/source-book/soa/soa.htm (accessed on 10 August 2015).
- Otkin, J.A.; Greenwald, T.J.; Sieglaff, J.; Huang, H.L. Validation of a large-scale simulated brightness temperature dataset using SEVIRI satellite observations. J. Appl. Meteorol. Climatol. 2009, 48, 1613–1626. [Google Scholar] [CrossRef]
- Greenwald, T.J.; Bradly Pierce, R.; Schaack, T.; Otkin, J.; Rogal, M.; Bah, K.; Lenzen, A.; Nelson, J.; Li, J.; Huang, H-L. Real-simulation of the GOES-R ABI for user readiness and product evaluation. Bull. Am. Meteorol. Soc. 2015, in press. [Google Scholar]
© 2015 by the authors; licensee MDPI, Basel, Switzerland. This article is an open access article distributed under the terms and conditions of the Creative Commons Attribution license (http://creativecommons.org/licenses/by/4.0/).


