Article

Retrieval of High-Resolution Atmospheric Particulate Matter Concentrations from Satellite-Based Aerosol Optical Thickness over the Pearl River Delta Area, China

1
State Key Laboratory of Organic Geochemistry, Guangzhou Institute of Geochemistry, Chinese Academy of Sciences, Guangzhou 510640, China
2
University of Chinese Academy of Sciences, Beijing 100049, China
3
Guangdong Research Institute of Water Resources and Hydropower, Guangzhou 510365, China
*
Author to whom correspondence should be addressed.
Remote Sens. 2015, 7(6), 7914-7937; https://doi.org/10.3390/rs70607914
Submission received: 30 January 2015 / Revised: 8 June 2015 / Accepted: 10 June 2015 / Published: 17 June 2015

Abstract

:
Satellite remote sensing offers an effective approach to estimate indicators of air quality on a large scale. It is critically significant for air quality monitoring in areas experiencing rapid urbanization and consequently severe air pollution, like the Pearl River Delta (PRD) in China. This paper starts with examining ground observations of particulate matter (PM) and the relationship between PM10 (particles smaller than 10 μm) and aerosol optical thickness (AOT) by analyzing observations on the sampling sites in the PRD. A linear regression (R2 = 0.51) is carried out using MODIS-derived 500 m-resolution AOT and PM10 concentration from monitoring stations. Data of atmospheric boundary layer (ABL) height and relative humidity are used to make vertical and humidity corrections on AOT. Results after correction show higher correlations (R2 = 0.55) between extinction coefficient and PM10. However, coarse spatial resolution of meteorological data affects the smoothness of retrieved maps, which suggests high-resolution and accurate meteorological data are critical to increase retrieval accuracy of PM. Finally, the model provides the spatial distribution maps of instantaneous and yearly average PM10 over the PRD. It is proved that observed PM10 is more relevant to yearly mean AOT than instantaneous values.

Graphical Abstract

1. Introduction

Particulate matters (PM), or aerosols, not only have direct and indirect radiative forcing effects on climate systems [1,2], but also reduce visibility and induce respiratory diseases thus affecting air quality and human health [3]. The strong and consistent links between ambient PM exposure and adverse health effects have been shown in epidemiological and toxicological studies around the world [4,5,6,7]. Therefore, monitoring air quality at high spatial-temporal resolution is of great significance, especially for rapidly growing megacities which are facing severe air pollution owing to industrial development and population expansion.
Current ground measurement networks, though well-calibrated, are spatially-limited and inadequate to evaluate time-space dynamics of air pollution and effects on human health. Advances in satellite remote sensing have provided a cost-effective approach to frequently monitor the spatial distribution and the regional transport of aerosol particles on a large scale [8,9,10,11,12,13,14], though the discontinuous satellite observations could hardly reflect the diurnal variations of particle matters. Aerosol optical thickness (AOT), derived from satellite observations, is a dimensionless measure of aerosol abundance and atmospheric extinction of radiance over the entire air column. Previous researches have revealed a strong positive relationship between satellite-based measurements of AOT and ground-based measurements of particulate matters smaller than 2.5 μm and 10 μm in aerodynamic diameters (PM2.5 and PM10, respectively) [15,16,17,18,19,20,21,22,23,24,25]. A summary of linear AOT/PM relationships, intercepts and correlation coefficients in several previous studies is shown in Table 1. IDEA (Infusion satellite Data into Environmental air quality application), as a NASA-EPA-NOAA partnership, has produced the daily surface PM estimation across the United States from MODIS AOT products through predefined regression relation. Its time ranges from 1 January 2008 to the present, with a coarse spatial resolution of 10 km.
Located in south-central Guangdong, China (about 21.5°N–24°N and 112°E–115.5°E), the Pearl River Delta (PRD) (Figure 1) is an area that boasts the fastest economic growth and population increase in the world. It also has become an area of China which is facing the severest air pollution because of rapid industrial development, vegetation reduction, and heavy traffic pressure. Deaths and health effects resulting from air pollution in the PRD had been calculated from an economic perspective by scholars at Peking University. Economic losses caused by air pollution were estimated to be 292 billion RMB in 2006, accounting for 1.35% of the regional Gross Domestic Product (GDP) [26]. As a consequence, the increase in hazy days and deteriorating air quality, greatly impairing the health of the population and the visibility over the region, has drawn widespread attention from the Chinese government and the public [27,28,29,30]. However, there is still a lack of AOT-based estimations for PM concentrations in this area currently. By combining ground measurements and remote sensing observations, estimations of AOT-based PM concentrations, especially with high spatial resolution data, could offer spatially continuous mapping with high accuracy, which is useful for regional air quality monitoring.
Table 1. Literature survey linear AOT-PM relationships, intercepts and correlation coefficients.
AuthorStudy AreaDateModel descriptionLinear RegressionR2
Wang et al. [17]Alabama2002MODIS 10 km AOT and PM2.577τ − 0.23 (Terra) 68.6τ + 1.93 (Aqua)0.67 0.76
Chu et al. [18]ItalyAugust–October 2000AOT from AERONET and PM1054.7τ + 80.82
Engel-cox et al. [11]Eastern United StatesSummer 2004MODIS 10 km AOT and PM2.525.329τ + 11.0910.574
Gupta et al. [20]Global urban areas2002MODIS 10 km AOT and PM2.5166.7τ − 250.96
Li et al. [21]Hong Kong15–17 September 2001MODIS 1 km AOT and PM2.5171.3τ + 0.40.77
Zheng et al. [22]Pearl River Delta2006 to 2008MODIS 1 km AOT and PM1063.35τ + 39.940.458
Guo et al. [23]Eastern China2007MODIS 10 km AOT and hourly PMNA0.46 (PM1) 0.61 (PM2.5) 0.52 (PM10)
Schaap et al. [14]Cabauw, NetherlandsAugust 2006 to May 2007MODIS 10 km AOT and PM2.5120τ+5.09260.518
Wang et al. [24]BeijingJuly 2007 to October 2008MODIS 1 km AOT and PM10361.1τ + 19.60.65
You et al. [25]Xi’an2013MODIS 10 km AOT, MISR 17.6 km AOT and PM2.5NA0.816 0.847
Figure 1. Location of 11 cities and the 15 air quality monitoring stations in the Pearl River Delta region in Guangdong Province, China. The blue spots in the map represent the sampling sites selected to conduct our ground observations of PM and AOT.
Remotesensing 07 07914 g001
In this study, we developed correlative linear models between AOT and PM10 in the Pearl River Delta region, based upon ground-based observations from 2010 to 2011. We also explored the potential of retrieving the spatial distribution of particulate matters both daily and yearly from MODIS-derived AOT using these models, with an aim to provide more intuitive and reliable images of air quality in the area and reasonably illustrate the usefulness of satellite-derived AOT as a proxy for particulate matters.

2. Data

2.1. Station Monitoring Data of PM10

Hourly air quality measurements from 15 monitoring stations Figure 1 from January 2008 to December 2008 were provided by the Department of Environmental Protection of Guangdong Province, China. Locations and the underlying surface types of the stations are shown in Table 2 and quoted from a report of monitoring results in 2008: Pearl River Delta regional air quality monitoring network. The measurements included concentrations of PM10 and major gaseous pollutants such as surface-level O3, SO2 and NO2. Also, the government has fully implemented the QA/QC program to ensure that the air quality data from the monitoring stations are highly accurate and reliable, and the control limit set for PM10 are ±10%. Nevertheless, the sparse distribution of stations cannot reliably reflect the spatial distribution of atmospheric particulate matter over the Pearl River Delta region.
Table 2. Locations and types of the monitoring stations in the Pearl River Delta.
StationsType(Lat, Lon)City
TianhuRural(23.646° N, 113.638° E)Guangzhou
Luhu ParkCity(23.156° N, 113.277° E)Guangzhou
Haogang schoolMixed residential/commercial/industrial(23.017° N, 113.734° E)Dongguan
XiapuUrban: commercial(23.054° N, 114.41° E)Huizhou
JinguowanResidential(23.074° N, 114.406° E)Huizhou
LiyuanCity(22.545° N, 114.089° E)Shenzhen
TamenRural(22.477° N, 114.361° E)Hong Kong
QuanwanMixed residential/commercial/industrial(22.375° N, 114.115° E)Hong Kong
TangjiaMixed educational/commercial and residential/commercial(22.354° N, 113.58° E)Zhuhai
Zimaling ParkMixed residential/commercial(22.509° N, 113.406° E)Zhongshan
WanqinshaMixed educational/commercial and residential/industrial(22.709° N, 113.55° E)Guangzhou
DonghuCity(22.59° N, 113.087° E)Jiangmen
JinjuzuiTourist and cultural/educational(22.804° N, 113.291° E)Foshan
HuijingchengMixed residential/commercial/industrial(22.978° N, 113.106° E)Foshan
ChengzhongMixed residential/commercial(23.053° N, 112.476° E)Zhaoqing

2.2. Ground-Based Sampling Observations of AOT and PM

AOT ground observations were obtained using a MICROTOP II sun photometer Manufactured by U.S Solarlight Company. The MICROTOP II is a hand-held sun photometer for measuring aerosol optical thickness and direct solar irradiance at the following five discrete wavelengths: 380 nm, 500 nm, 870 nm, 936 nm and 1020 nm. The water vapor column can also be measured at the following three wavelengths: 870 nm, 936 nm and 1020 nm. Features of MICROTOP II include high accuracy, ease of use, portability and instantaneous results.
A DustTrak DRX aerosol particulate monitor was used to measure the particulate concentrations in a wide variety of environments. It provided reliable exposure assessment by simultaneously measuring size-segregated mass fraction concentrations corresponding to PM1, PM2.5, PM10 and Total PM size fractions. The one-minute resolution of DustTrak DRX offers us an insight into the occurrence of high concentrations of PM, and the clear duration of the dust plumes. The comparison among eight PM10 measurement instruments shows that multiple size ranges in the DustTrak DRX could identify the spatial non-uniformity for the sources [31].
For the limitation of monitoring devices and manpower, we chose several sampling sites, including urban areas, suburbs and their borders in the three cities of the Pearl River Delta, to avoid the uncertainty caused by observations on a single underlying surface Table 3. The total number of sample points is 305, with 162 points in the urban areas and 143 points in the suburbs. Rapid urbanization process makes the difference between the locations less apparent, thus the monitoring results reflect the air quality of urban actually. The sampling time was from 10:30 a.m. to 3:00 p.m. between October 2010 and November 2011, to be consistent with the pass time of MODIS, about 11 a.m. for Terra and 2 p.m. for Aqua.
Table 3. Location of AOT and PM sampling sites in the Pearl River Delta.
PlacesTypeLatitude(° N)Longitude(° E)N
Guangzhou Institute of GeochemistryUrban23.133113.35028
Guangzhou Luhu parkBorders of urban and suburb23.15113.28366
Maofeng Mountain Forestry ParkSuburb23.3113.4674
Conghua cityUrban23.55113.58360
Liuxihe National Forest ParkSuburb23.75113.783104
Zhongshan forestSuburb22.4113.46721
Zhongshan collegeUrban22.533113.3838
Nansha wetland parkSuburb by the sea22.617113.65014
Notes: N is the number of sampling dataset.

2.3. Satellite Data

Data used in this study over the PRD from a Moderate-resolution imaging spectroradiometer (MODIS) (onboard the Terra and Aqua satellite) were downloaded from NASA LAADS (Level 1 and Atmosphere Archive and Distribution System). They are calibrated L1B data with 500 m spatial resolution including visible, near-infrared, and mid-infrared bands. The complete set of cloud-free remote sensing images during 2008 was acquired, together with monitoring data of air quality from 15 stations in 2008 provided by the Department of Environmental Protection of Guangdong Province, China.

2.4. Atmospheric Boundary Layer (ABL) Height and Relative Humidity (RH)

The National Centers for Environmental Prediction (NCEP) Climate Forest System Reanalysis (CFSR) provide global atmospheric analyzed products, such as boundary layer height and relative humidity, with a 0.5 degree horizontal resolution at 6-hourly intervals, initialized four times per day (0:00, 6:00, 12:00 and 18:00 UTC) [32] The products are proved to be accurate by using the 5-day forecast scores as a measure of the accuracy of initial states [33]. We used data from 2, 3 and 5 January 2008 to perform height and humidity corrections on AOT.

3. Analyses on Particulate Concentration in the PRD

3.1. Ground Observations of Particulate Matter

The concentrations of PM10, PM2.5 and PM1 are expressed in terms of milliequivalents of particles smaller than 10 μm, 2.5 μm and 1 μm in diameter per cubic meter of air in units of µg/m3. Ground-based observations of PM10, PM2.5 and PM1 at all the sampling sites from November 2010 to November 2011 were used to analyze the size distribution of particles. The percentage of PM1 from PM2.5 and PM10 calculated from all the sample points range from 90% to 100% and from 60% to 90%, respectively. Most of the atmospheric particles over the sampling sites are small-size respirable particles, consistent with research results by Wu [27,34,35]. He pointed out that the ratio of PM2.5 to PM10 over PRD has obviously increased in the past two decades, reaching 60% to 80%, which is higher in dry seasons than in rainy seasons. Our results are slightly higher, perhaps caused by the difference between measuring instruments. The aerosol monitor used in our study is a continuous real-time 90° light-scattering laser photometer. Aerosol particles are absorbed into the optics chamber through the built-in air pump, and the concentration of the particles is measured by the amount of light scattering. The measurements of fine-mode particles are less accurate than those from β-ray decay method and tapered element oscillating microbalance (TEOM) method.

3.2. Station Monitoring Data of Particulate Matters in PRD

Measurements of PM10 from the 15 stations in the PRD at 11 a.m. (the passing time of Terra satellite) from 1 to 5 January are listed in Table 4. The PM10 concentration on most of the sites on 2 January increased especially at stations in Nansha (Guangzhou) and Foshan compared with those on 1 January. Dongguan, Foshan and Nansha became areas with peak value on 3 January and the value from Huijingcheng in Foshan was the highest, followed by Donghu in Jiangmen, Haogang School in Dongguan and Chenzhong in Zhaoqing on 4 January. In general, station measurements in Guangzhou, Conghua, Huizhou, Shenzhen and Hongkong did not change much during the period. Our field survey reveals that stations with small variations are mostly located in areas with high vegetation cover. This apparently enhances subsidence of atmospheric particles.
The hourly PM10 limit concentration in the Pearl River Delta is set to be 150 µg/m3, according to the ambient air quality standards issued by China’s Ministry of Environmental Protection and China’s General Administration of Quality Supervision in 2012. Inspection of Table 4 shows that on 1 and 2 January PM10 of all sites were below this standard. However, on days of severe air pollution such as 3, 4 and 5 January, measurements were far above the standard threshold 150 µg/m3 at Jinjuzui and Huijincheng in Foshan, Haogang school in Dongguan, Donghu in Jiangmen and Wanqinsha in Guangzhou. Concentrations of PM10 from several stations, exceeding the standard (150 µg/m3), are marked in bold format.
Table 4. Station measurements of PM10 at 11:00 a.m. on 1–5 January 2008 (µg/m3).
Stations1 January2 January 3 January 4 January5 January
Tianhu404354110104
Luhu Park3127343979
Haogang school4873152174200
Xiapu101122133147186
Jinguowan2840535854
Liyuan689512288120
Tamen--899264111
Quanwan--649152101
Tangjia3334776179
Zimaling Park526711979233
Wanqinsha8812515123232
Donghu5473118197336
Jinjuzui60629163190
Huijingcheng--119197265311
Chengzhong6278119157146

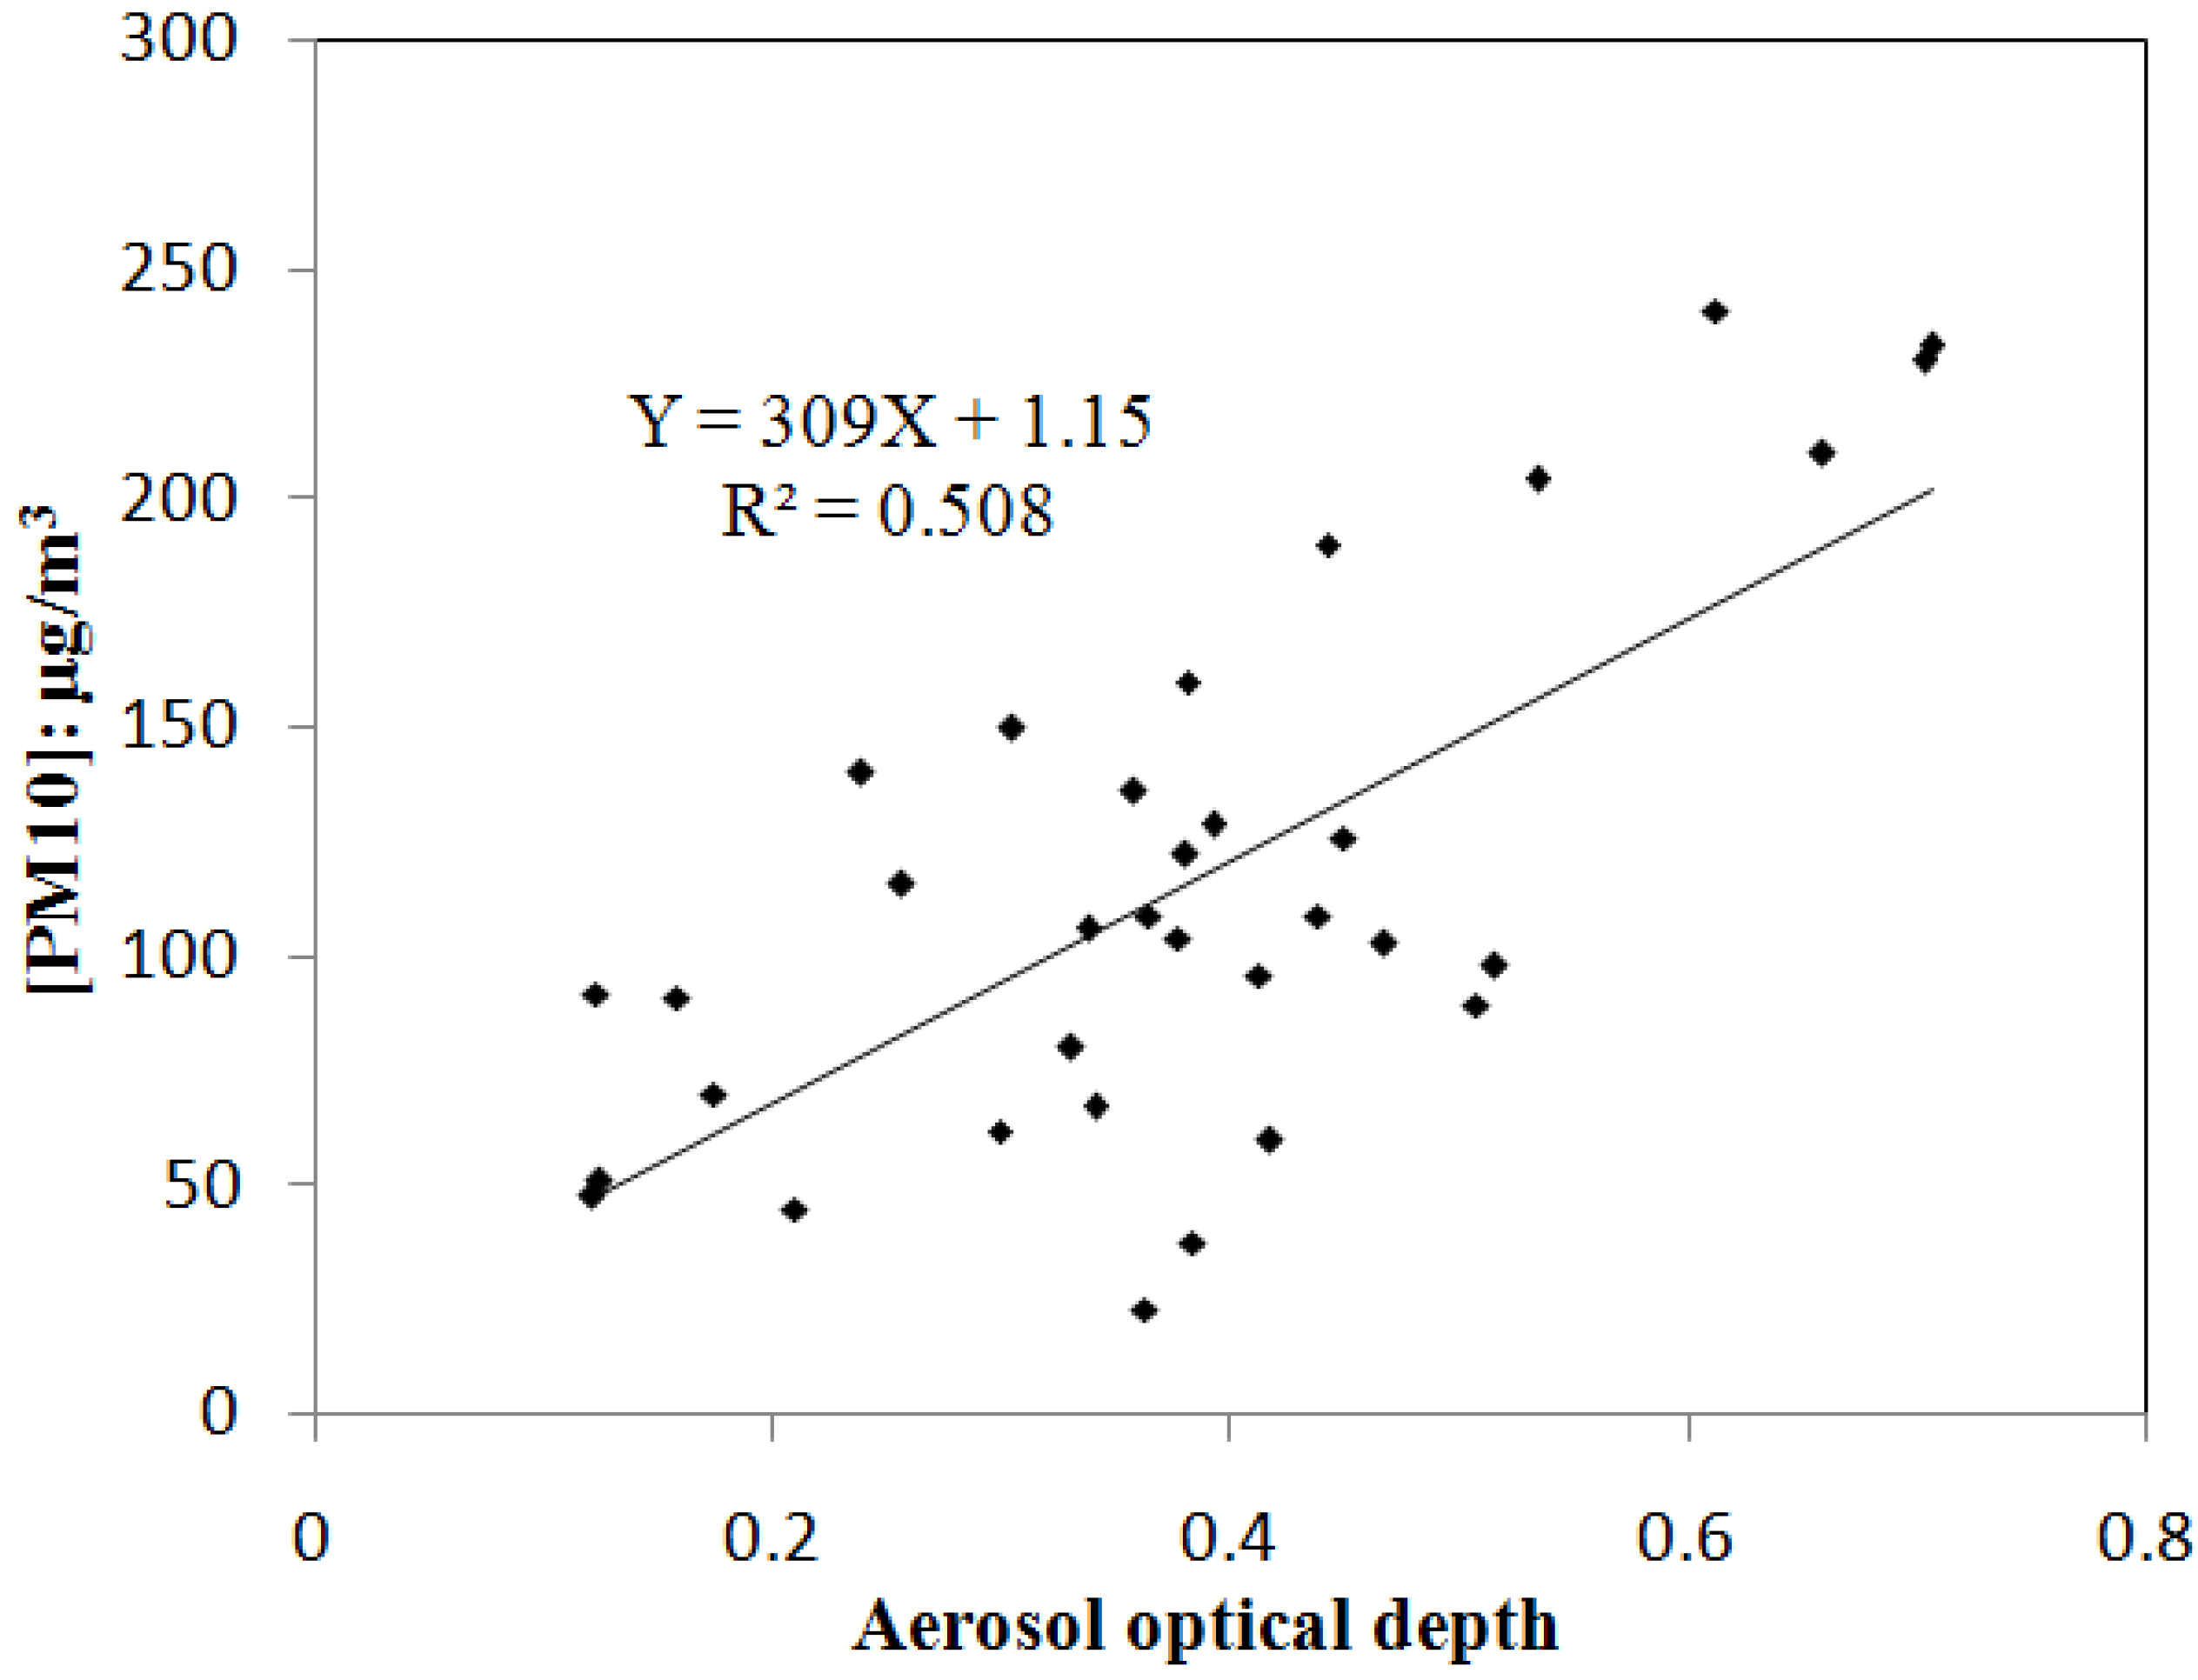
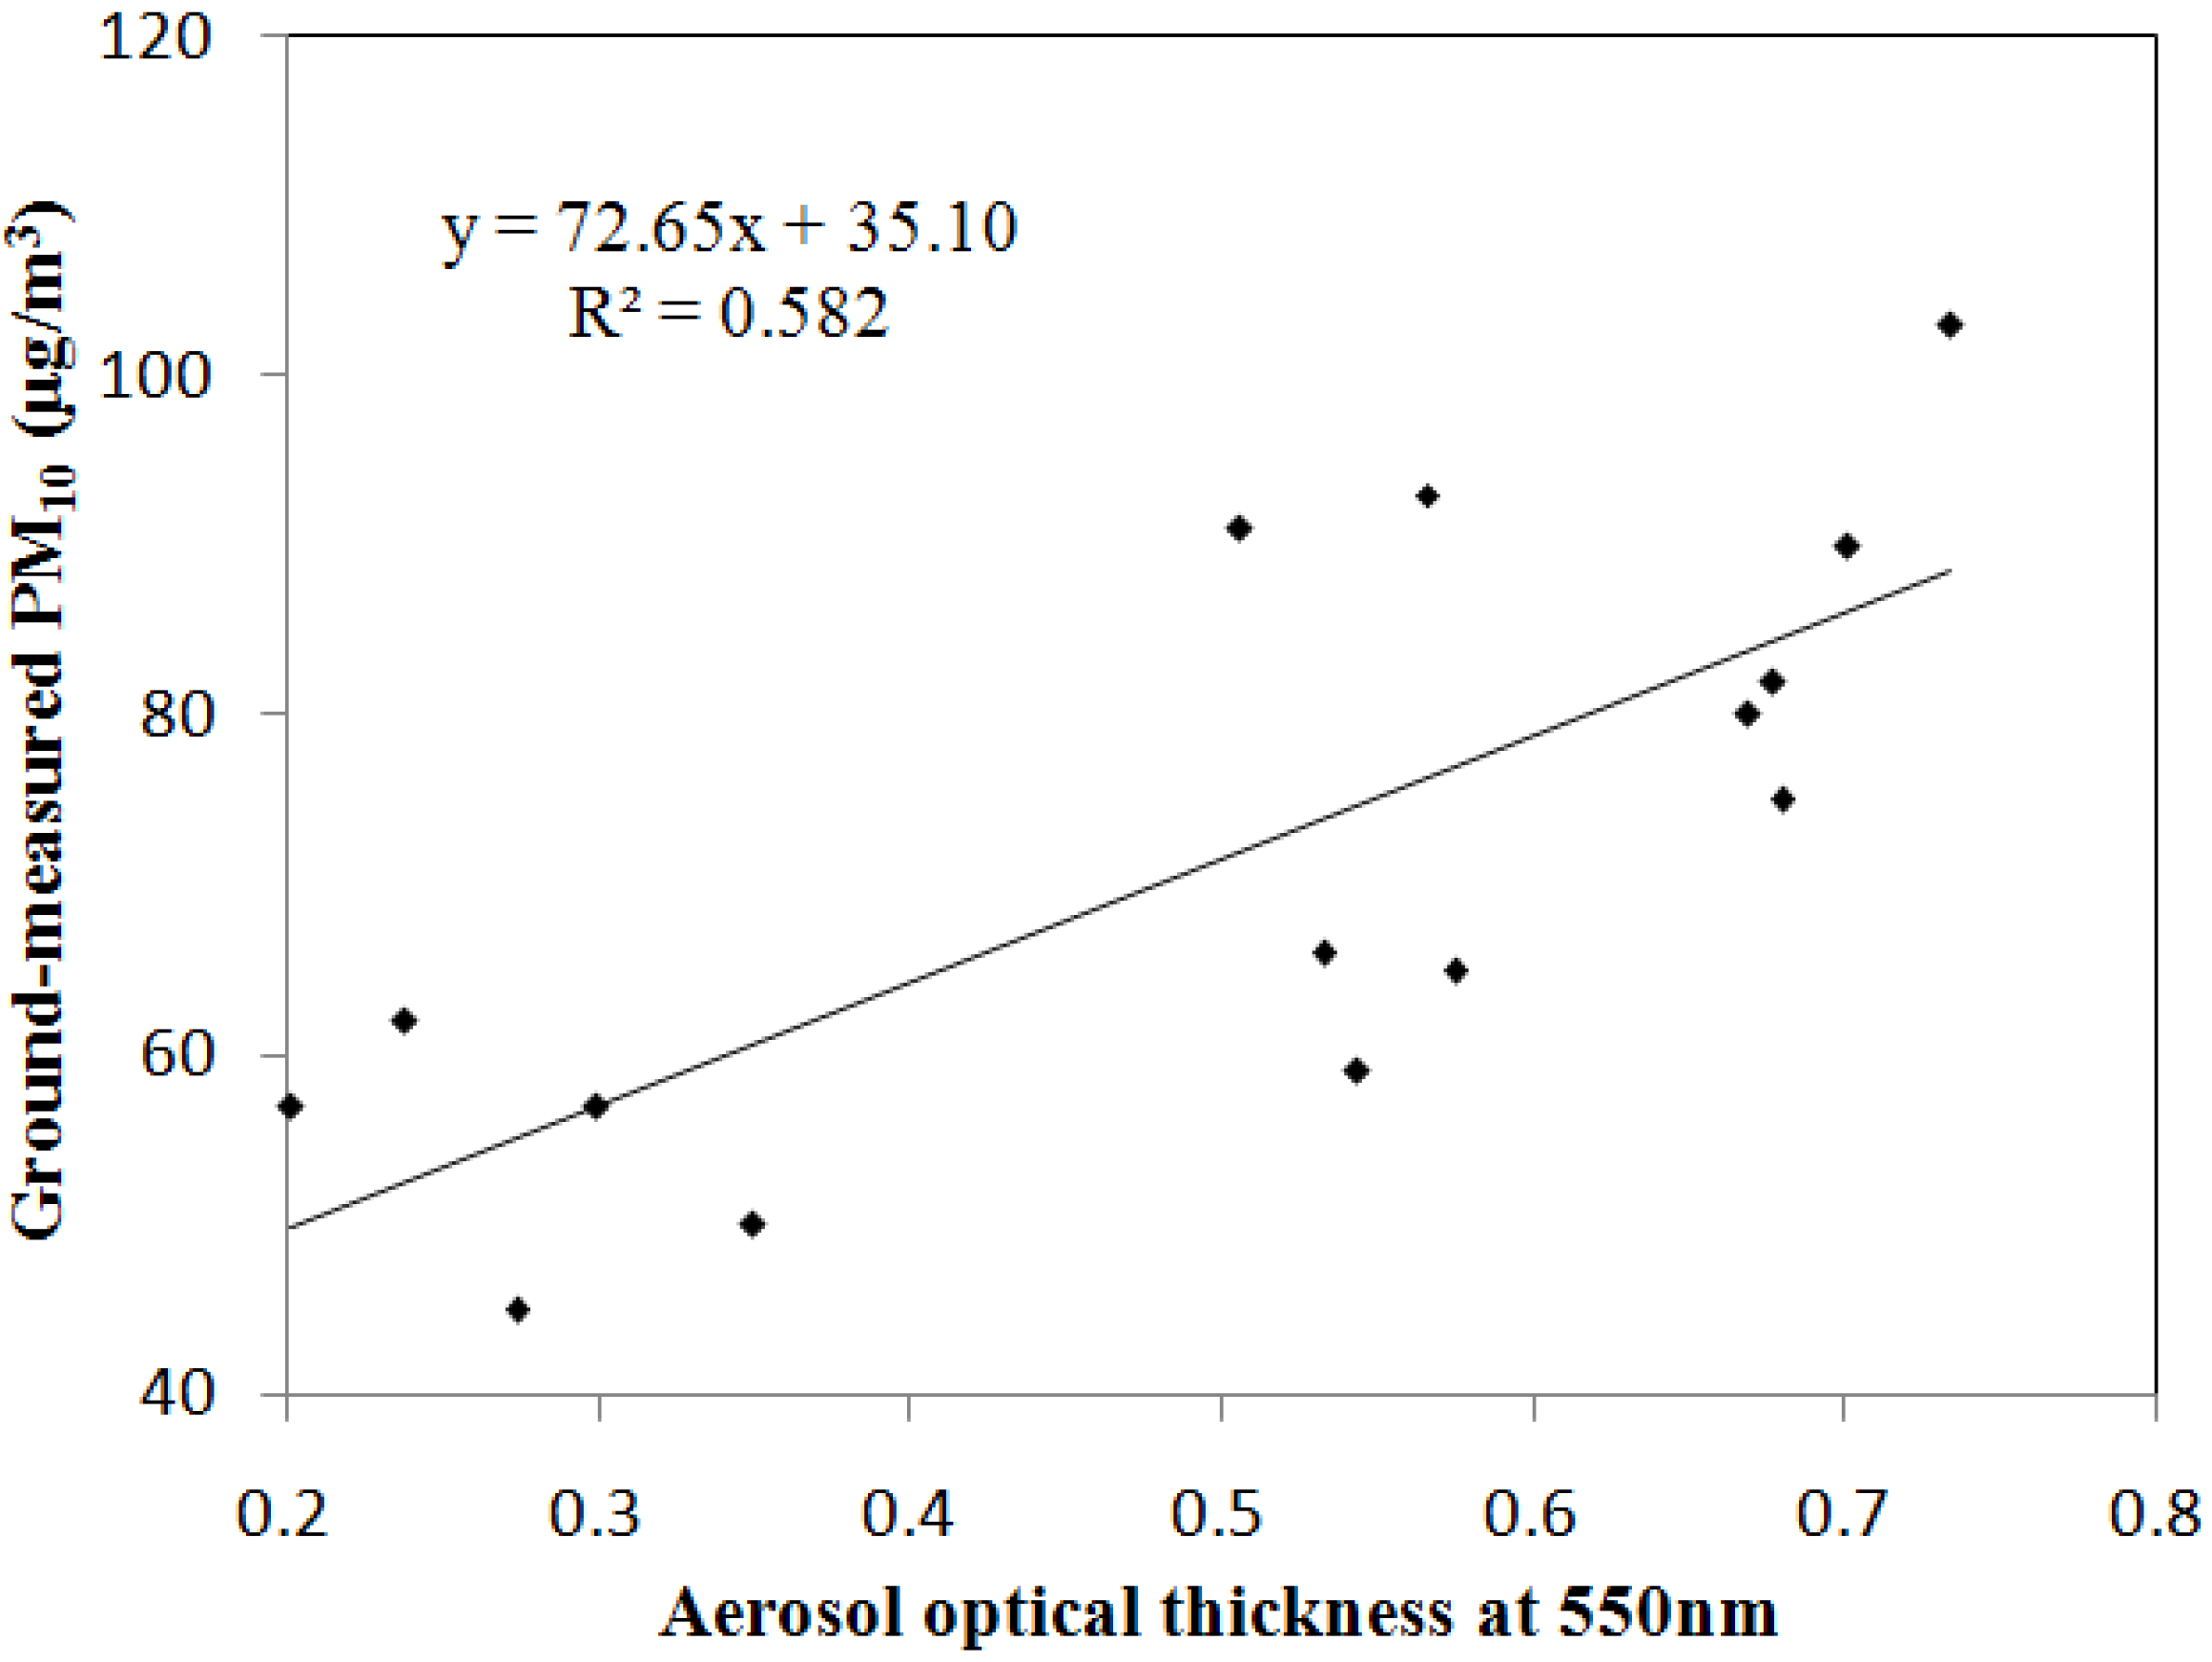
3.3. Correlation Test between Particulate Concentration and AOT

We developed linear relationships between PM10 and aerosol optical thickness (AOT) at 500 nm by using 305 datasets of ground-based observation from our instruments between 18 October and 29 November 2011 (Figure 2), with correlation coefficients of 0.67. In winter, the hazy weather occurred more frequently and visibility dramatically deteriorated over the Pearl River Delta region [35]. The strong linear correlation between AOT and PM reveals that it is reasonable and feasible to retrieve the spatial distribution of PM from AOT. Factors affecting the accuracy of the models include: (a) AOT are column measurements whereas PM are recorded 5 feet above the ground; (b) the average particle sizes of aerosols increases with increasing relative humidity [36,37]. Therefore, it is concluded that satellite-retrieved aerosol maps provide the possibility and capability of monitoring and characterizing spatio-temporal distribution of the surface PM with a reasonable degree of accuracy.
Figure 2. Linear regression between AOT at 500 nm and ground measurements PM10.
Remotesensing 07 07914 g002

4. Retrieval of Atmospheric Particulate Concentrations

A unary linear regression is used to estimate the spatial distribution of particulate matter over the PRD, as expressed in Equation (1):
Y = a + b X
where Y is the predicted variable, X are the independent variables of the model, a is a constant and b is the coefficient of the variables. In our model, X represents AOT values with high-resolution, and Y is predicted PM concentrations. As Figure 2 shows, PM10 and AOT are highly linear-correlated, thus an observed set of values of station-measured PM10 concentrations and satellite-derived AOT values at the same place in 2008 could be used to develop the linear model in Figure 3. Then, through the established regression model, the unmeasured PM concentrations in non-station areas can be retrieved from 500 m-resolution aerosol optical thickness, for the satellite-derived AOT maps are spatially continuous, and show values both at station and non-station points.
Figure 3. Correlation diagram between average aerosol optical thickness within 500 m radius of the monitoring station and station-measured PM10 concentrations.
Remotesensing 07 07914 g003
Retrieval of 500 m-resolution AOT in this study is based on an improved dark dense vegetation (DDV) method, proposed by our previous study [38]. Aerosol products of satellite remote-sensing provide an effective way to study air pollution, but have a conflict between resolution and signal-to-noise ratio (SNR). Our method, on a basis of MOD04-C005 algorithm, hopes to obtain Aerosol Optical Thickness (AOT) with a higher spatial resolution in the case of moderate decreases in SNR [39]. The theory of the method is that in the case of low surface reflectance, the 2.1-μm channel is transparent to most aerosol types so that its apparent reflectance can be considered to be equal to the surface reflectance [40,41]. The relations among the surface reflectance in the blue, red and SWIR band are not a fixed ratio but depend on the scattering angle and NDVISWIR derived from reflectance at 1.24 and 2.12 μm bands, taking into account the angular variability and surface type, since the Earth’s surface is not Lambertian and some surface types exhibit bidirectional reflectance functions (BRDF). Besides, before AOT retrieval, the MODIS cloud mask products (MOD35_L2) were applied to remove the cloud on MODIS L1B images. For the remaining potentially clear pixels, the selection of dark pixels by discarding brightest 50% and darkest 20% of reflectance at 0.66 μm, also reduce the cloud and surface contamination. Thus, the AOT can be retrieved from the surface reflectance due to the correlation between surface reflection in the blue (0.49 μm), red (0.66 μm), and 2.12 μm bands. Changing the movement pattern of the retrieval window, selecting a more suitable aerosol type, and storing the look-up table as a four-dimensional array, enhance the spatial resolution of AOT considerably relative to MODIS AOT products. The selection of effective dark pixels is conducted in a window of 20 × 20 pixels (10 km × 10 km), and the calculation of the surface reflectance at 0.47 and 0.66 μm are functions of the surface reflectance at 2.13 μm, NDVI and the scattering angle. We also adopted the aerosol type suitable for the study area proposed by Li [21], rather than using the urban or continental aerosols in the 6S model. All of these factors would reduce the errors of AOT retrieval on the bright surfaces, especially in urban areas. The AOT maps by our algorithm are much smoother and show more extensive value ranges with fewer null values. We also validated the retrieval results with ground measurements and 10 km-resolution MODIS AOT products, both showing high precision. We will further validate our retrieval results of aerosol optical thickness in specific seasons and regions once we get ground observations of AOT and PM on a long time scale.

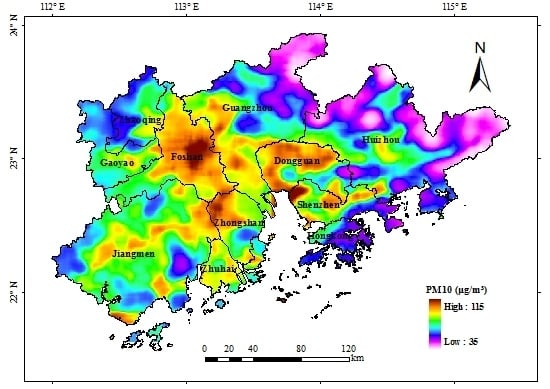
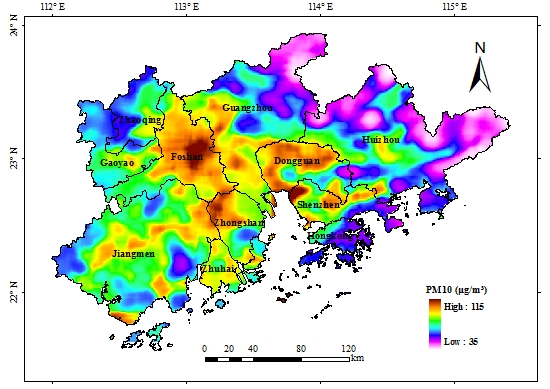
4.1. Retrieval of the Instantaneous Particulate Distribution

Data involved in the retrieval include MODIS L1B data onboard the Terra satellite covering the whole Pearl River Delta, and PM10 measurements at 10:00 to 11:00 a.m. at the 15 stations on 2, 3 and 5 January 2008, together with atmospheric boundary height and relative humidity were downloaded from NCEP CFSR on the same days. The MODIS instrument passes the entire Earth twice per day, with Terra in the morning and Aqua in the afternoon, while the PM data at the stations were recorded hourly. To reduce the effects of the difference in temporal resolution on the relationship between PM10 and AOT, PM data recorded from 10:00 to 11:00 at the 15 point locations were used to match the Terra data in our study. After deriving the AOT from the MODIS images, the relationship between average AOT values within 500 m radius of the monitoring station and PM10 from all sites was established as shown in Figure 3. The accuracy of the relationship is affected by the imperfect match between the spatial-temporal resolutions of AOT-PM data, as the AOT was estimated at about 10:30 a.m. with a spatial resolution of 500 m, and the null values were excluded from the calculation. The PM data, on the other hand were recorded from 10:00 to 11:00 at the 15 point locations. In addition, the relative humidity and atmospheric boundary layer height have impacts on the correlation between column AOT and ground PM10 concentrations. The spatial distribution maps of PM10 on 2, 3 and 5 January using the linear model in Figure 3 are shown in Figure 4. The difference between the slope values of the models in Figure 2 and Figure 3 is possibly caused by the measuring instruments, and the PM concentrations from ground observations are a little higher than that from the monitoring stations.
Figure 4. Spatial distribution of PM10 derived from 500 m-rsolution AOT in PRD on 2, 3 and 5 January 2008 (unit: μg/m3).
Remotesensing 07 07914 g004
Variations in local meteorological conditions and occurrence of multiple aerosol layers play important roles in the relationship between AOT and PM10. To estimate the PM concentrations directly from AOT may be somewhat tenuous, and the vertical distribution of aerosols and the relative humidity, related to atmospheric profiles, ambient condition, the size distributions and chemical compositions of aerosols, are especially important. As AOT reflects the aerosol optical properties of the total column whereas particle matter concentrations are usually recorded at 5 feet above the ground, the relation between them is greatly influenced by the vertical distribution of aerosols. As we know, AOT is the integral of the extinction coefficient ka at all altitudes along the vertical orientation, and is expressed as:
τ α ( λ ) = 0 k a ( λ , z ) d z
where τ a ( λ ) is the total atmospheric optical thickness, and k a ( λ , z ) is the extinction coefficient at the altitude of z and the wavelength of λ. Additionally, the vertical distribution of k a ( λ , z ) could be described as the negative exponent form as:
k a ( λ , z ) k a , 0 ( λ ) exp ( z / H A )
where k a , 0 ( λ ) is the extinction coefficient at the wavelength of λ near the surface, and HA is the scale height of aerosol, approximately represented by the atmospheric boundary layer height (ABL) [42,43]. Combining Equations (2) and (3), we calculate τ a ( λ ) as:
τ α ( λ ) = k a , 0 ( λ ) 0 exp ( z / H A ) d z = k a , 0 ( λ ) H A
On the other hand, the hygroscopic growth of particles has effects on the refraction and extinction index, as well as other optical properties of aerosols [44]. The correlation between extinction coefficient ka and PM10 is also affected by the chemical components of particles and relative humidity of the air, since the PM10 concentrations measured by the instruments are almost the dry mass of the particles with aerodynamic diameter less than 10 μm. Thus, f (RH) is used to define the hygroscopic growing factor as [36,45]:
f ( R H ) = ( 1 R H / 100 ) g
where g is an empirical fie coefficient and set as 1 in our study. The dry k a , 0 ( λ ) is obtained from
k α , D R Y ( λ ) = k a , 0 ( λ ) / f ( R H )
Hence, we could calculate the aerosol extinction coefficient in the dry air near the surface k a ,   DRY   ( λ ) from Equation (1) to Equation (5), and express it as
k α , D R Y ( λ ) = τ a ( λ ) / [ H A ( 1 R H / 100 ) g ) ]
Wang et al. [24] once described the relationship between ka and PM concentration on the basis of the Mie theory as
k α = 3 Q e x t 4 r e f f ρ P M x
where Qext is the size distribution integrated extinction efficiency, reff is the effective radius, being approximately constant, and PMx is the mass concentration of PM. Therefore, it is possible to develop a linear correlation between   k a ,   DRY   ( λ ) and PM10 concentrations, like
PM 10 = a × k a , D R Y + b
Furthermore, the vertical and relative humidity corrections on AOT could enhance the relationship and increase the robustness of the estimate.
Spatial distributions of ABL height and relative humidity on 2 and 3 January are displayed in Figure 5. The comparison of measurements at the weather stations and forecast of relative humidity is shown in Figure 6, with a correlation coefficient of 0.816. The deviation of the correlation is caused by the different temporal resolutions of these two datasets. Data from NCEP CFSR was at 6-hourly intervals while the station observations are hourly averaged.
Figure 5. Spatial distribution of atmospheric boundary layer (ABL) height (unit: meter) on the left and relative humidity (unit: %) on the right in PRD at 6:00 UTC on 2, 3 and 5 January 2008, provided by NCEP CFSR, with a resolution of 0.5 degree.
Remotesensing 07 07914 g005
Figure 6. The scatter plot of measurements at the weather stations and forecast of relative humidity from NCEP CFSR.
Remotesensing 07 07914 g006
ABL height and relative humidity data at 6:00 UTC (14:00 pm local time), which are the closest datasets to the overpassing time of satellite, were applied to the vertical and humidity correction on MODIS Terra images to reduce the errors from temporal scale. The correlation between average corrected   k AOT ,   DRY   ( λ ) and PM10 is shown in Figure 7. Comparison between Figure 3 and Figure 7 indicates that the correlation (R2 = 0.55) is slightly higher after this correction but not significant, mainly because of the low spatial resolution of meteorological data. The final retrieved PM10 images over the Pearl River Delta on 2, 3 and 5 January are displayed in Figure 8.
Figure 7. Correlation between extinction coefficient and surface-level PM10 after vertical and humidity correction using meteorologic data form NCEP CFSR.
Remotesensing 07 07914 g007
Figure 8. Spatial distribution of PM10 in PRD on 2, 3 and 5 January 2008 after vertical and humidity correction (unit: μg/m3).
Remotesensing 07 07914 g008
The coarse spatial resolution of meteorological data leads to apparent grids in the images in Figure 8. We therefore averaged the values of ABL height and relative humidity from NECP CFSR over the PRD to smooth and refine the maps. To do so, we took HA and RH in Equation (2) to be single valued rather than maps with 0.5° resolution. The relationship between corrected AOT and PM10 is shown in Figure 9 with a coefficient of 0.531. It indicates that the correlation can be enhanced by vertical and humidity corrections, but the degree of improvement depends on the accuracy of the meteorological data. The retrieved PM10 images over the Pearl River Delta on 2, 3 and 5 January are displayed in Figure 10.
Figure 9. Correlation between extinction coefficient corrected by average value of atmospheric boundary layer height and relative humidity, and the surface-level PM10.
Remotesensing 07 07914 g009
Figure 10. Spatial distribution of derived PM10 in PRD on 2, 3 and 5 January 2008 after correction (unit: μg/m3).
Remotesensing 07 07914 g010aRemotesensing 07 07914 g010b

4.2. Retrieval of Yearly Average PM10 Distributions

We used all cloud-free MODIS data in 2008 to derive the corresponding AOT using the dark dense vegetation method. Averaging the results leads to an estimate of the yearly aerosol optical thickness over the PRD Figure 11. However, in summer the common occurrence of clouds makes AOT rarely observable, thus only a few MODIS images were studied. The average results would be a little lower since AOT values in summer are higher than these in winter [46]. Additionally we estimated the PM concentrations in non-site areas from our regression model. According to the station measurements provided by Guangdong Environmental Protection Bureau, the days of PM10 exceeding the standard threshold 150 µg/m3 in 2008 were 5 in Tianhu, 11 in Luhu Park, 46 in Xiapu, 20 in Chenzhong, 37 in Hangang School, 63 in Huijingcheng, 1 in Jinguowan, 27 in Jinjuzui, 43 in Wanqinsha, 23 in Donghu, 5 in Liyuan, 35 in Zimaling Park, 2 in Tamen, 1 in Quanwan and 0 in Tangjia, respectively. Linear regression of these data is shown in Figure 12 with a correlation coefficient of 0.582. The slope coefficient in the linear regression model of yearly average AOT and PM10 is relatively low, probably because of the average calculation on AOT and fewer sample points. The correlation between yearly mean AOT and observed PM10 is slightly higher than that between the instantaneous values, mainly because averaging tends to eliminate outliers. The instantaneous AOT is influenced by many factors that show frequent fluctuations, such as temperature, monsoon, and precipitation, as well as human activities, such as fossil fuel burning. Retrieved AOT maps cannot reflect the true air quality when there appears to be a low or high value anomaly of these factors. Occurrence of clouds also makes aerosols sometimes rarely observable, accompanied by null values of AOT. Outliers and missing data may introduce bias or affect the representativeness of the results. The yearly average AOT can remove the occasional effects and eliminate the outliers of AOT by replacing them with the average values of the pixel. Thus, the larger the time scales, the higher the correlation between aerosol optical thickness and PM10 concentration. The yearly average PM10 is then retrieved through the regression equation (Figure 13).
Figure 11. A 500 m-resolution yearly average aerosol optical thickness in 2008 over the Pearl River Delta region retrieved from all cloud-free MODIS L1B data by using an improved Dark Dense Vegetation method.
Remotesensing 07 07914 g011
Table 5 lists the yearly average values of AOT, measured PM10 and regressive PM10 of the 15 monitoring stations in PRD, 2008. The predicted PM10 was derived from the model shown in Figure 12, by putting in the yearly average AOT values at each monitoring station. The deviations between the actually-measured and predicted PM10 concentrations were calculated to indicate the stability of the model. The root mean square error (RMSE) between station measured PM10 and the predicted PM10 was calculated from the deviations to be ±10 µg/m3, indicative of the reliability of the retrieved results while the relative errors of the predicted results are from 1.75% to 27.12%, showing the limitations of the applicability of the model. Air quality at most sites is poor according to the standards of both yearly average PM10 (70 µg/m3) laid down in the ambient air quality standards. Figure 13 show that areas with the worst air pollution are located in Foshan city, at the border of Shunde and Zhongshan, west of Gongguan, and northwest of Shenzhen.
Figure 12. Regression analysis between the yearly averaged retrieved AOT and ground-measured PM10 of the 15 monitoring stations in the PRD, 2008.
Remotesensing 07 07914 g012
Figure 13. Spatial distribution of retrieved yearly average PM10 concentrations in the PRD, 2008 (unit: μg/m3).
Remotesensing 07 07914 g013
Table 5. Yearly average values of AOT, measured PM10 and Predicted PM10 of the 15 monitoring stations in the PRD, 2008.
SitesAOTMeasured PM10 (µg/m3)Predicted PM10 (µg/m3)Deviation (µg/m3)Relative Errors (%)
Tianhu0.2386254−8−12.90
Luhu Park0.57565771218.46
Haogang school0.7019086−4−4.44
Xiapu0.5069172−19−20.88
Jinguowan0.27445561124.44
Liyuan0.54459751627.12
Tamen0.3575811.75
Quanwan0.2025751−6−10.53
Tangjia0.3550611122.00
Zimaling Park0.677828422.44
Wanqinsha0.5669376−17−18.28
Donghu0.687584912.00
Jinjuzui0.669808445.00
Huijingcheng0.73410388−15−14.56
Chengzhong0.5336674−8−12.12

5. Conclusions

Analysis on the size distribution of particles indicates that most of the atmospheric particulate matters in Pearl River Delta region are inhaled particles of small sizes. Simultaneous observations of AOT and PM10 are proved to be strongly correlated; R2 being 0.670. It forms the basis for successful linear regression between AOT and PM.
A linear regression (R2 = 0.51) is carried out using MODIS-derived 500 m-resolution aerosol optical thickness and PM10 concentration from monitoring stations on 2, 3 and 5 January 2008. However, the relationship between AOT and PM over PRD is not necessarily suitable for other regions because of regional variations in aerosols type, sources, and air pollution affecting the relationship between AOT and PM. In addition the relationship may vary over time, for seasonal differences in climate would affect the formation and movement of atmospheric particles. The model in our study successfully demonstrates the possibility and feasibility of retrieval particulate matters from satellite-derived AOT, especially high-resolution AOT maps, which makes air quality monitoring in smaller regions more reliable. The correlation between AOT and PM10 also increased a little after vertical and relative humidity correction. Our further work aims at using more accurate meteorological data to increase retrieval accuracy for air pollution assessment.
Retrieval of atmospheric particulate concentrations shows that yearly mean AOT and observed PM10 correlate better than instantaneous values, and the root mean square error (RMSE) of our predictive model was 0.01.The yearly average particle matter concentration in 2008 shows the four most polluted regions to be: Foshan city, the border between Shunde and Zhongshan, the area to the west of Dongguan, and the northwest of Shenzhen.
However, there still exist some uncertainties in the linear model. The relationship between AOT and PM varies with time and region, and the chemical reactions in the air are more complicated than the linear regression models reflect [47]. Assimilating the satellite products and meteorological data into numerical models could be a good way to retrieve the spatial distributions of PM. Also, the relation between AOT and PM are influenced by the lack of accurate information on particle composition, size distribution and vertical profile. It is also affected by the accuracy and spatio-temporal resolution of the input data. The variations of water vapor could lead to the swelling or condensation of particles, and consequently the change of the microstructure and composition of the particles, which affects the relationship between AOT and PM. Vertical profile of aerosols could also introduce errors in the relationship, because of the significant contribution of aerosols above the boundary layer to extinction, especially when weak atmospheric convection happens [48]. Therefore, information on the aerosol vertical profiles from ground-based lidars and space-borne lidars, such as the Cloud-Aerosol Lidar and Infrared Pathfinder Satellite Observations (CALIPSO), could be applied into the retrieval of PM from satellite data. The accuracy of the input data, like the satellite-derived AOT, the instruments for ground measurements and the meteorological data for corrections, would also affect the linear model between AOT and PM. Furthermore, the satellite images covering the local region are obtained twice a day, and have a relatively coarse spatial resolution, while the station data are measured on the ground all day. The imperfect match of spatio-temporal resolution between satellite data and surface observations brings errors to the model. The seasonal variation of the relationship is another issue that should be taken into account. The seasonal difference in the meteorological conditions, such as temperature, precipitation and relative humidity, and human activities could result in the change of the relationship.

Acknowledgments

China National Key Technology R&D Program (2012BAH32B03), China National 863 Program (2006AA06A306), China NSFC (41401485) and Guangdong NSF (S2013010014097) are acknowledged for financial supports. We also thank the NASA Earth System for the MODIS products and Guangdong Environmental Protection Bureau for the station monitoring data. Bernard de Jong of Utrecht University and Z. Zhou of Lancaster University are thanked for comments and corrections. This is contribution No. SKLOG2013A01 from SKLOG and No. IS-2088 from GIGCAS.

Author Contributions

The study was completed by all authors. Lili Li, Jingxue Yang and Yunpeng Wang conceived and designed the experiments; Lili Li and Jingxue Yang performed the experiments and analyzed the data; Lili Li wrote the paper; Yunpeng Wang checked the experimental results and finalized the paper.

Conflicts of Interest

The authors declare no conflict of interest.

References

  1. King, M.D.; Kaufman, Y.J.; Tanré, D.; Nakajima, T. Remote sensing of tropospheric aerosols from space: Past, present and future. Bull. Am. Meteorol. Soc. 1999, 80, 2229–2259. [Google Scholar] [CrossRef]
  2. Kaufman, Y.J.; Tanré, D.; Boucher, O. A satellite view of aerosols in the climate system. Nature 2002, 419, 215–223. [Google Scholar] [CrossRef] [PubMed]
  3. Dockery, D.W.; Pope, C.A.; Xu, X.P.; Spengler, J.D.; Ware, J.H.; Fay, M.E.; Ferris, B.G., Jr.; Speizer, F.E. An association between air pollution and mortality in six U.S. cities. N. Engl. J. Med. 1993, 329, 1753–1759. [Google Scholar] [CrossRef] [PubMed]
  4. Schwartz, J.; Dockery, D.W.; Neas, L.M. Is daily mortality associated specifically with fine particles? J. Air Waste Manag. Assoc. 1996, 46, 927–939. [Google Scholar] [CrossRef] [PubMed]
  5. Pope, C.A., III. Review: Epidemiological basis for particulate air pollution health standards. Aerosol Sci. Technol. 2000, 32, 4–14. [Google Scholar] [CrossRef]
  6. Samet, J.M.; Dominici, F.; Curriero, F.C.; Coursac, I.; Zeger, S.L. Fine particulate air pollution and mortality in 20 U.S. cities, 1987–1994. N. Engl. J. Med. 2000, 343, 1742–1749. [Google Scholar] [CrossRef] [PubMed]
  7. Wallace, L. Correlations of personal exposure to particles with outdoor air measurements: A review of recent studies. Aerosol Sci. Technol. 2000, 32, 15–25. [Google Scholar] [CrossRef]
  8. Husar, R.B.; Tratt, D.M.; Schichtel, B.A.; Falke, S.R.; Li, F.; Jaffe, D.; Gassó, S.; Gill, T.; Malm, W.C. Asian dust events of April 1998. J. Geophys. Res.: Atmos. 2001, 106, 18317–18330. [Google Scholar] [CrossRef]
  9. Hutchison, K.D. Applications of MODIS satellite data and products for monitoring air quality in the state of Texas. Atmos. Environ. 2003, 37, 2403–2412. [Google Scholar] [CrossRef]
  10. Wang, J.; Christopher, S.A.; Reid, J.S.; Maring, H.; Savoie, D.; Holben, B.N.; Livingston, J.M.; Russell, P.B.; Yang, S.-K. GOES 8 retrieval of dust aerosol optical thickness over the Atlantic Ocean during PRIDE. J. Geophys. Res.: Atmos. 2003, 108. [Google Scholar] [CrossRef]
  11. Engel-Cox, J.A.; Holloman, C.H.; Coutant, B.W.; Hoff, R.M. Qualitative and quantitative evaluation of MODIS satellite sensor data for regional and urban scale air quality. Atmos. Environ. 2004, 38, 2495–2509. [Google Scholar] [CrossRef]
  12. Engel-Cox, J.A.; Young, G.S.; Hoff, R.M. Application of satellite remote-sensing data for source analysis of find particulate matter transport events. J. Air Waste Manag. Assoc. 2005, 55, 1389–1397. [Google Scholar] [CrossRef] [PubMed]
  13. Kacenelenbogen, M.; Léon, J.F.; Chiapello, I.; Tanré, D. Characterisation of aerosol pollution events in France using ground-based and POLDER-2 satellite data. Atmos. Chem. Phys. 2006, 6, 4843–4849. [Google Scholar] [CrossRef]
  14. Schaap, M.; Apituley, A.; Timmermans, R.M.A.; Koelemeijer, R.B.A.; de Leeuw, G. Exploring the relation between aerosol optical depth and PM2.5 at Cabauw, The Netherlands. Atmos. Chem. Phys. 2009, 9, 909–925. [Google Scholar] [CrossRef]
  15. Malm, W.C.; Sisler, J.F.; Huffman, D.; Eldred, R.A.; Cahill, T.A. Spatial and seasonal trends in particle concentration and optical extinction in the United States. J. Geophys. Res. 1994, 99, 1347–1370. [Google Scholar] [CrossRef]
  16. Chow, J.C.; Watson, J.G.; Lowenthal, D.H.; Richards, L.W. Comparability between PM2.5 and particle light scattering measurements. Environ. Monit. Assess. 2002, 79, 29–45. [Google Scholar] [CrossRef] [PubMed]
  17. Wang, J.; Christopher, S.A. Intercomparison between satellite-derived aerosol optical thickness and PM2.5 mass: Implications for air quality studies. Geophys. Res. Lett. 2003, 30. [Google Scholar] [CrossRef]
  18. Chu, D.A.; Kaufman, Y.J.; Zibordi, G.; Chern, J.D.; Mao, J.T.; Li, C.C.; Holben, B.N. Global monitoring of air pollution over land from the Earth Observing System-Terra Moderate Resolution Imaging Spectroradiometer (MODIS). J. Geophys. Res.: Atmos. 2003. [Google Scholar] [CrossRef]
  19. Engel-Cox, J.A.; Hoff, R.M.; Rogers, R.; Dimmick, F.; Rush, A.C.; Szykman, J.J.; Al-Saadi, J.; Chu, D.A.; Zell, E.R. Integrating lidar and satellite optical depth with ambient monitoring for 3-D dimensional particulate characterisation. Atmos. Environ. 2006, 40, 8056–8067. [Google Scholar] [CrossRef]
  20. Gupta, P.; Christopher, S.A.; Wang, J.; Gehrig, R.; Lee, Y.C.; Kumar, N. Satellite remote sensing of particulate matter and air quality assessment over global cities. Atmos. Environ. 2006, 40, 5880–5892. [Google Scholar] [CrossRef]
  21. Li, C.C.; Lau, A.K.-H.; Mao, J.T.; Chu, D.A. Retrieval, validation and application of the 1-km aerosol optical depth from MODIS measurement over Hong Kong. IEEE Trans. Geosci. Remote Sens. 2005, 43, 2650–2658. [Google Scholar]
  22. Zheng, J.Y.; Che, W.W.; Zheng, Z.Y.; Chen, L.F.; Zhong, L.J. Analysis of spatial and temporal varialility of PM10 concentrations using MODIS aerosol optical thickness in the Pearl River Delta region, China. Aerosol Air Qual. Res. 2013, 13, 862–876. [Google Scholar]
  23. Guo, J.P.; Zhang, X.Y.; Che, H.Z.; Gong, S.L.; An, X.; Cao, C.X.; Li, X.W. Correlation between PM concentrations and aerosol optical depth in eastern China. Atmos. Environ. 2009, 43, 5876–5886. [Google Scholar] [CrossRef]
  24. Wang, Z.F.; Chen, L.F.; Tao, J.H.; Zhang, Y.; Su, L. Satellite-based estimation of regional particulate matter (PM) in Beijing using vertical-and-RH correcting method. Remote Sens. Environ. 2010, 114, 50–63. [Google Scholar] [CrossRef]
  25. You, W.; Zang, Z.; Pan, X.; Zhang, L.; Chen, D. Estimating PM2. 5 in Xi’an, China using aerosol optical depth: A comparison between the MODIS and MISR retrieval models. Sci. Total Environ. 2015, 505, 1156–1165. [Google Scholar] [CrossRef] [PubMed]
  26. Huang, D.S.; Xu, J.H.; Zhang, S.Q. Valuing the health risks of particulate air pollution in the Pearl River Delta, China. Environ. Sci. Policy 2012, 15, 38–47. [Google Scholar] [CrossRef]
  27. Wu, D.; Deng, X.J.; Bi, X.Y.; Li, F.; Tan, H.B.; Liao, G.L. Study on the visibility reduction caused by atmospheric haze in Guangzhou area. J. Trop. Meteorol. 2007, 23, 1–6. [Google Scholar]
  28. Deng, X.J.; Tie, X.X.; Wu, D.; Zhou, X.J.; Bi, X.Y.; Tan, H.B.; Li, F.; Jiang, C.L. Long-term trend of visibility and its characterizations in the Pearl River Delta (PRD) region, China. Atmos. Environ. 2008, 42, 1424–1435. [Google Scholar] [CrossRef]
  29. Huang, J.; Wu, D.; Huang, M.H.; Li, F.; Bi, X.Y.; Tan, H.B.; Deng, X.J. Visibility variations in the Pearl River Delta of China during the Period of 1954–2004. J. Appl. Meteorol. Sci. 2008, 19, 61–70. [Google Scholar]
  30. Xie, P.; Liu, X.Y.; Liu, Z.R.; Li, T.T.; Zhong, L.J.; Xiang, Y.R. Human health impact of exposure to airborne particulate matter in Pearl River Delta, China. Water Air Soil Pollut. 2011, 215, 349–363. [Google Scholar] [CrossRef]
  31. Watson, J.G.; Chow, J.C.; Chen, L.; Wang, X.L.; Merrifield, T.M.; Fine, P.M.; Barker, K. Measurement system evaluation for upwind/downwind sampling of fugitive dust emissions. Aerosol Air Qual. Res. 2011, 11, 331–350. [Google Scholar] [CrossRef]
  32. The National Centers for Environmental Prediction (NCEP) Climate Forecast System Reanalysis (CFSR) 6-hourly Products, January 1979 to December 2010. Available online: http://dx.doi.org/10.5065/D69K487J (accessed on 5 January 2008).
  33. Saha, S.; Suranjana, M.; Pan, H.L.; Wu, X.G.; Wang, J.D.; Sudhir, N.; Patrick, T.; Glenn, R.; Mitch, G. The NCEP Climate Forecast System Reanalysis. Am. Meteorol. Soc. 2010, 91, 1015–1057. [Google Scholar] [CrossRef]
  34. Wu, D.; Bi, X.Y.; Deng, X.J.; Li, F.; Tan, H.B.; Liao, G.L.; Huang, J. Effect of atmospheric haze on the deterioration of visibility over the Pearl River Delta. Acta Meteorol. Sin. 2006, 64, 510–517. [Google Scholar]
  35. Wu, D.; Lau, A.K.-H.; Leung, Y.K. Hazy weather formation and visibility deterioration resulted from fine particulate (PM2.5) pollutions in Guangdong and Hong Kong. Acta Sci. Circumst. 2012, 32, 2660–2669. [Google Scholar]
  36. Kotchenruther, R.B.A.; Hobbs, P.V.; Hegg, D.A. Humidification factors for atmospheric aerosols off the mid-Atlantic coast of the United States. J. Geophys. Res.: Atmos. 1999, 104, 2239–2251. [Google Scholar] [CrossRef]
  37. Li, C.C.; Mao, J.T.; Liu, Q.H.; Yuan, Z.B.; Wang, M.H.; Liu, X.Y. Application of MODIS aerosol product in the study of air pollution in Beijing. Sci. China Series D Earth Sci. 2005, 35, 177–186. [Google Scholar]
  38. Li, L.L.; Yang, J.X.; Wang, Y.P. An improved dark object method to retrieve 500 m-resolution AOT (Aerosol Optical Thickness) image from MODIS data: A case study in the Pearl River Delta area, China. ISPRS J. Photogramm. Remote Sens. 2014, 89, 1–12. [Google Scholar] [CrossRef]
  39. Levy, R.C.; Remer, L.A.; Mattoo, S.; Vermote, E.F.; Kaufman, Y.J. Second-generation operational algorithm: Retrieval of aerosol properties over land from inversion of Moderate Resolution Imaging Spectroradiometer spectral reflectance. J. Geophys. Res.: Atmos. 2007, 112. [Google Scholar] [CrossRef]
  40. Kaufman, Y.J.; Tanré, D.; Remer, L.A.; Vermote, E.F.; Chu, A.; Holben, B.N. Operational remote sensing of tropospheric aerosol over land from EOS moderate resolution imaging spectroradiometer. J. Geophys. Res.: Atmos. 1997, 102, 17051–17067. [Google Scholar] [CrossRef]
  41. Kaufman, Y.J.; Wald, A.E.; Remer, L.A.; Gao, B.C.; Li, R.R.; Flynn, L. The MODIS 2.1-μm channel-correlation with visible reflectance for use in remote sensing of aerosol. IEEE Trans. Geosci. Remote Sens. 1997, 35, 1286–1298. [Google Scholar] [CrossRef]
  42. Koelemeijer, R.B.; Homan, C.D.; Matthijsen, J. Comparison of spatial and temporal variations of aerosol optical thickness and particulate matter over Europe. Atmos. Environ. 2006, 40, 5304–5315. [Google Scholar] [CrossRef]
  43. Liu, Y.; Sarnat, J.A.; Kilaru, V.; Jacob, D.J.; Koutrakis, P. Estimating ground-level PM2.5 in the eastern United States using satellite remote sensing. Environ. Sci. Technol. 2005, 39, 3269–3278. [Google Scholar] [CrossRef] [PubMed]
  44. Liu, X.G.; Cheng, Y.F.; Zhang, Y.H.; Jung, J.S.; Sugimoto, N.; Chang, S.Y.; Kim, Y.J.; Fan, S.J.; Zeng, L.M. Influences of relative humidity and particle chemical composition on aerosol scattering properties during the 2006 PRD. Atmos. Environ. 2008, 42, 1525–1536. [Google Scholar] [CrossRef]
  45. Im, J.S.; Saxena, V.K.; Wenny, B.N. An assessment of hygroscopic growth factors for aerosols in the surface boundary layer for computing direct radiative forcing. J. Geophys. Res.: Atmos. 2001, 106, 20213–20224. [Google Scholar] [CrossRef]
  46. Li, L.L.; Wang, Y.P. What drives the aerosol distribution in Guangdong-the most developed province in Southern China? Sci. Rep. 2014, 4. [Google Scholar] [CrossRef] [PubMed]
  47. Duncan, B.N.; Prados, A.I.; Lamsal, L.N.; Liu, Y.; Streets, D.G.; Gupta, P.; Hilsenrath, E.; Ziemba, L.D. Satellite data of atmospheric pollution for US air quality applications: Examples of applications, summary of data end-user resources, answers to FAQs, and common mistakes to avoid. Atmos. Environ. 2014, 94, 647–662. [Google Scholar] [CrossRef]
  48. Bergin, M.H.; Schwartz, S.E.; Halthore, R.N.; Ogren, J.A.; Hlavka, D.L. Comparison of aerosol optical depth inferred from surface measurements with that determined by Sun photometry for cloud-free conditions at a continental U.S. site. J. Geophys. Res. 2000, 105, 6807–6816. [Google Scholar] [CrossRef]

