Article

Ability of the Photochemical Reflectance Index to Track Light Use Efficiency for a Sub-Tropical Planted Coniferous Forest

1
Jiangsu Provincial Key Laboratory of Geographic Information Science and Technology, International Institute for Earth System Science, Nanjing University, Nanjing 210023, China
2
Jiangsu Center for Collaborative Innovation in Geographic Information Resource Development and Application, Nanjing 210023, China
3
Department of Geography and Program in Planning, University of Toronto, Toronto, ON M5S 3G3, Canada
4
Institute of Geographic Sciences and Natural Resources Research, Chinese Academy of Sciences, Beijing 100101, China
5
State Key Laboratory of Remote Sensing Science, Institute of Remote Sensing and Digital Earth, Chinese Academy of Sciences, Beijing 100101, China
6
School of Geographic and Oceanographic Science, Nanjing University, Nanjing 210023, China
7
Numerical Terradynamic Simulation Group, the University of Montana, Missoula, MT 59812, USA
8
State Key Laboratory of Soil and Sustainable Agriculture, Institute of Soil Science, Chinese Academy of Sciences, Nanjing 210008, China
9
Jiangsu Key laboratory of Agricultural Meteorology, College of Applied Meteorology, Nanjing University of Information Science and Technology, Nanjing 210044, China
*
Author to whom correspondence should be addressed.
Remote Sens. 2015, 7(12), 16938-16962; https://doi.org/10.3390/rs71215860
Submission received: 27 September 2015 / Revised: 19 November 2015 / Accepted: 7 December 2015 / Published: 15 December 2015
(This article belongs to the Special Issue Carbon Cycle, Global Change, and Multi-Sensor Remote Sensing)

Abstract

:
Light use efficiency (LUE) models are widely used to estimate gross primary productivity (GPP), a dominant component of the terrestrial carbon cycle. Their outputs are very sensitive to LUE. Proper determination of this parameter is a prerequisite for LUE models to simulate GPP at regional and global scales. This study was devoted to investigating the ability of the photochemical reflectance index (PRI) to track LUE variations for a sub-tropical planted coniferous forest in southern China using tower-based PRI and GPP measurements over the period from day 101 to 275 in 2013. Both half-hourly PRI and LUE exhibited detectable diurnal and seasonal variations, and decreased with increases of vapor pressure deficit (VPD), air temperature (Ta), and photosynthetically active radiation (PAR). Generally, PRI is able to capture diurnal and seasonal changes in LUE. However, correlations of PRI with LUE varied dramatically throughout the growing season. The correlation was the strongest (R2 = 0.6427, p < 0.001) in July and the poorest in May. Over the entire growing season, PRI relates better to LUE under clear or partially cloudy skies (clearness index, CI > 0.3) with moderate to high VPD (>20 hPa) and high temperatures (>31 °C). Overall, we found that PRI is most sensitive to variations in LUE under stressed conditions, and the sensitivity decreases as the growing conditions become favorable when atmosphere water vapor, temperature and soil moisture are near the optimum conditions.

Graphical Abstract

1. Introduction

Gross primary productivity (GPP) is an important component of the terrestrial carbon cycle and exhibits significant spatial and temporal variations. Reliable estimation of GPP is a prerequisite for quantifying terrestrial carbon sinks and sources. Remote sensing data have the potential for estimating the regional distributions of GPP, as they can provide the needed spatial and temporal coverages. They have been widely used to calculate GPP in combination with light use efficiency (LUE) models, which commonly express GPP as the product of the amount of absorbed photosynthetically active radiation (APAR) and a LUE term (GPP = LUE × APAR) [1,2,3,4]. APAR can be computed as the product of photosynthetically active radiation (PAR) incident on the top of vegetation and the fraction of PAR absorbed by the vegetation canopy (FPAR). The incident PAR can normally be obtained from meteorological observation while FPAR can be retrieved from remote sensing data [5,6,7,8].
LUE models take advantage of remotely sensed data and are easy to operate. However, their outputs are very sensitive to LUE [9,10], which is significantly affected by numerous factors, including vegetation species and types, nutrient supply, temperature, atmospheric water vapor pressure deficit, soil water, and so on [9,11,12,13,14,15,16]. In most LUE models to date, the influences of these factors on LUE are considered through the use of various scalars defined with empirical functions and coefficients [11,17,18]. Such simplification for LUE estimation definitely induces considerable uncertainties in calculated GPP [19,20,21,22,23]. Proper determination of this parameter is a prerequisite and also a challenge for calculating GPP using remote sensing data and LUE models at regional and global scales.
A number of studies found that LUE is well related to the photochemical reflectance index (PRI = (R531 − R570)/(R531 + R570), and R531 and R570 are reflectance at wavelengths 531 and 570 nm) [3,24,25,26,27,28,29,30,31,32,33,34,35,36,37]. However, there are still some uncertainties regarding to the reliability of this relationship as affected by many factors. Barton and North [38] indicated that PRI is strongly influenced by sun-view geometry, and by varying soil background when the leaf area index (LAI) of the canopy is below 3. At large view zenith angles (>30°), PRI is also sensitive to leaf angle distribution (LAD). Canopy LUE varies with radiation received by the canopy, while PRI also shows a similar property due to its sensitivity to the fraction of shaded or sunlit leaves [26,39,40,41]. Additionally, the dependence of PRI on the shadow fraction is affected by the ratio of diffuse sky radiation [42,43]. Therefore, the relationship between PRI and LUE is affected by various factors, including the interference to the PRI signal by external factors not related to photosynthetic efficiency, the structural characteristics of canopies, background signals, different reference bands (if the band is not centered at 570 nm), and sun-view geometry [44].
In addition, changes in environmental conditions might induce some pigment activity or photosynthetic physiology variations that confound the PRI signal [27,45,46,47], while they might cause different variation patterns of LUE over a long time span. Soudani et al. [32] reported that correlations between PRI and LUE differ seasonally based on eight years of continuous in situ observations in deciduous and evergreen broadleaf forests. Nakaji et al. [30] also showed a limited sensitivity of PRI to LUE across seasons in a tropical rainforest. This highlights that the hypothesis of coordinated regulation between PRI and photosynthetic activity needs to be tested in different seasons and ecosystems [27].
In this study, we investigated the relationships between PRI and LUE from continuous in situ multi-angle spectral and concurrent flux measurements during a growing season in a sub-tropical planted evergreen conifer forest in China. Planted forests in southern China occupy more than a half of the national total area and stock volume of planted forests, which act as a dominant driver for the national carbon sink of forests in recent decades [48]. Specially, the objectives of this study are: (1) investigating the variations of bioclimatic factors, PRI and LUE; (2) analyzing the seasonality of the relationship between PRI and LUE under different circumstances; and (3) identifying factors affecting the linkages of PRI with LUE.

2. Materials and Methods

2.1. Study Site

We observed the CO2 flux and canopy spectral reflectance of a planted evergreen coniferous forest at Qianyanzhou Experimental Station (QYZ) in southeastern China. As a part of the Chinese Ecosystem Research Network (CERN) and the China FLUX network, QYZ station is located in the subtropical continental monsoon region (26°44′52″N, 115°03′47″E, elevation 102 m). According to long-term records of an adjacent weather station (1985–2004), the mean annual air temperature and precipitation were 17.9 °C and 1485.1 mm, respectively. The flux tower is built, in late August 2002, on a gentle undulating terrain with slopes ranging from 2.8° to 13.5°. The plantation, which was planted in 1985, is dominated by Pinus elliottii, Pinus massoniana and Cunninghamia lanceolata [49,50]. The understory shrub includes mainly Loropetalum Chinense and Lyonia compta. The soil is red soil, which is weathered from red sand rocks [51]. A field survey made in early August 2013 around the flux tower indicates that the mean canopy height, mean diameter at breast height, and effective green leaf area index (LAIe) of the top canopy were about 15.5 m, 18.8 cm and 3.3, respectively. LAIe was the mean value of about 60 samples measured with Li-cor LAI2200 (LI-COR, Inc., Lincoln, NE, USA) covering the spectral observation area, and showed little temporal variation during the study period. Thus, LAIe was defined here as a constant for the mature evergreen forest [3], and the effect of clumping index (Ω = 0.5) was considered on true LAI (True LAI = LAIe/Ω = 6.6).

2.2. Flux Data and LUE Calculation

The eddy covariance (EC) method has greatly advanced the understanding of stand-level carbon fluxes and provides indirect measurements of LUE. EC data has been used in numerous studies for calibrating and validating LUE models at leaf, stand and landscape scales [11,52,53,54,55].
Flux data measured by an open path eddy covariance system at 39.6 m and radiation measured at 41.6 m above the ground surface were used in this study [50]. Available meteorological measurements were also made around the same flux tower, mainly including air temperature (Ta), vapor pressure (VP), precipitation, soil moisture (SM) and temperature, etc. For long period analysis (i.e., month and whole study period), days with total rainfall above 5 mm were excluded owing to inaccuracy of both flux and spectral observations under rainy conditions.
GPP was calculated from measured net ecosystem productivity (NEP) with daytime ecosystem respiration (Re) estimated with an empirical equation fitted using nighttime NEP and temperature measurements, i.e.,
GPP = NEP + Re
APAR was estimated using two methods. The first method calculates APAR with PAR × FPAR. FPAR was estimated according to true LAI [56] and the solar zenith angle (θ) as [57,58]:
FPAR = (1 − ρ1(θ)) − (1 − ρ2(θ)) × e(−G(θ) × Ω × LAI/cosθ)
where ρ1(θ) and ρ2(θ) are the PAR reflectivity above and below the canopy and assigned values of 0.05 and 0.06, respectively; G(θ) is the projection coefficient of leaves and is set as 0.5 for a spherical (random) distribution of foliage inclination angles [21,57]; Ω is the clumping index determined by the spatial distribution pattern of foliage and is set as 0.5 for this forest. The term e(−G(θ) × Ω × LAI/cosθ) is the gap fraction of the canopy at the zenith angle θ.
Half-hourly LUE was calculated as:
LUE = GPP/(PAR × FPAR)
Previous studies indicated that the fractions of diffuse and direct radiation absorbed by canopies differ [59,60]. To capture this difference, another method for calculating LUE was performed as APAR was calculated using the algorithm in a TL-LUE model developed by He et al. [21,61]. The specific description of this method was presented in Appendix B.
Clearness index (CI) is the ratio of the global solar radiation on the surface of the earth (Rg) to the extraterrestrial radiation at the top of the atmosphere (R0) [62]. R0 for any day and any moment can be calculated using the solar zenith angle (θ) at a given place as:
R0 = S0 × (1 + cos(360 × DOY/365))/cosθ
where S0 is the solar constant (1367 W/m2); DOY represents day of the year. With observed half-hourly total incident radiation (Rg), CI is calculated as Rg/R0.

2.3. Multi-Angle Spectral Observations

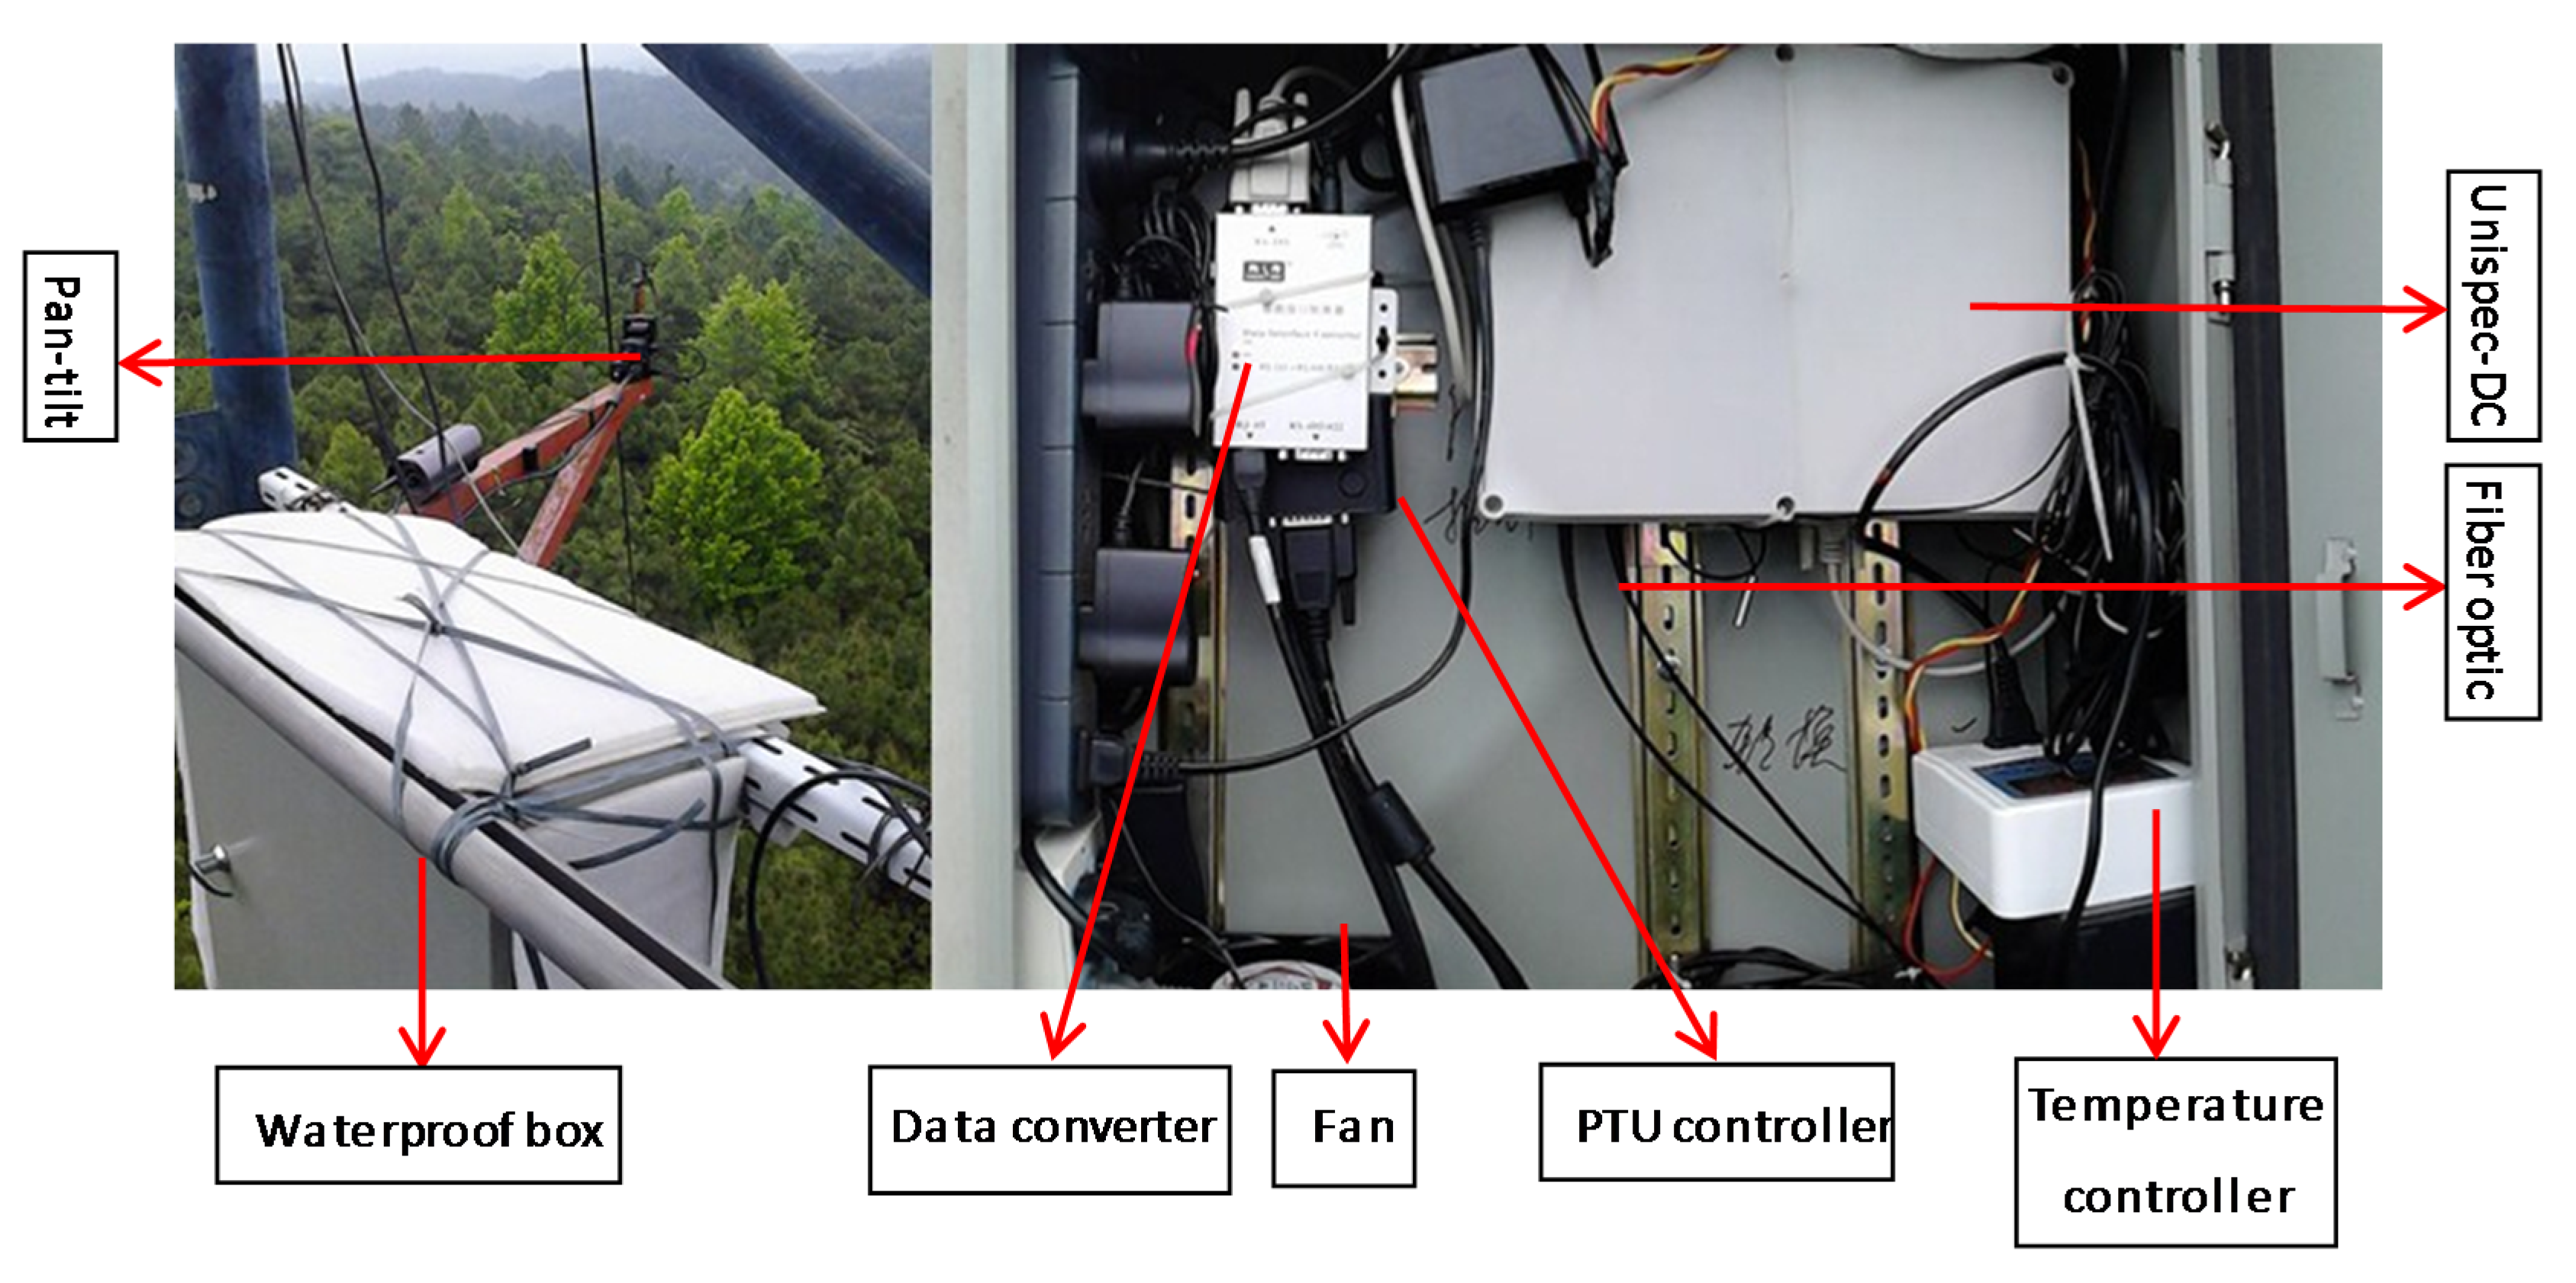
2.3.1. iAMSPEC II System

Multi-angle canopy spectral data were obtained from an improved tower-based observation system stemmed from AMSPEC II, which was first developed by Hilker et al. [63]. The new system is named iAMSPEC II, and was mounted at 31 m (about 16 m above the canopy) on the flux tower in QYZ in January of 2013. The system (Appendix A) is mainly composed of a dual channel spectrometer, a dual axis rotating device, a computer, and some accessories (e.g., uninterruptible power supply (UPS), fans, temperature controller, wireless internet).
The spectrometer used is Unispec-DC (PP Systems, Amesbury, MA, USA) featuring 256 contiguous bands for both upwelling and downwelling channels covering a nominal spectral range from approximately 305 nm to 1135 nm with about 3 nm nominal bandwidth (10 nm full width, half max). The upwelling channel measures incoming solar irradiance while the downwelling channel simultaneously measures canopy-reflected radiance with fiber optics. This instrument allows measurements to be conducted under different weather conditions [63]. The upward pointing fiber optic equipped with a cosine receptor is used to acquire hemisphere sky irradiance for varying solar altitudes. The downward-looking fiber optic, with an instantaneous field of view (IFOV) of 20°, is attached to an axis of the rotating device to measure canopy reflectance at various angles.
The rotating device is a pan-tilt unit, PTU-D46 (FLIR Systems, Goleta, CA, USA), possessing two rotatable parts (pan axis is horizontal and tilt axis is vertical). The downward-looking probe is mounted on the tilt axis with a 45° angular holder (Appendix A), which is different with AMSPEC II [63]. This improvement allows the sensor head to be moved at a full range of zenith angle (θV), while the inherent motion range of the tilt axis is only between −37° and 42° around the vertical axis. Due to obstruction by the tower, view azimuth angles range actually from 45° to 325° (defined from geodetic north).
Both Unispec-DC and PTU are connected to a computer (Thinkpad T430U) via the RS232 serial port. However, due to the long distance (about 50 m) from the tower to the control house, the RS422 serial communication (using RJ45 cables) is used to connect Unispec-DC and PTU with the computer (Appendix A). This system is controlled by a MATLAB GUI program, which is able to automatically initialize PTU and Unispec-DC, acquire spectra from the spectrometer, and save data every 15 min. Canopy spectra were sampled every 2~3 s all day at a 10° angular step width (horizontally and vertically).

2.3.2. Spectra Preprocessing

The irradiance and radiance can only be used after the calibration of both dark current (DC) and the sensitivity of two channels to light. Unispec-DC lacks an internal shutter mechanism to correct for DC automatically. However, it has a thermometer that could track the dependency of DC on temperature. The measurements at midnight were used to fit the correlations between DC and temperature. Daytime DC for each band was estimated using these fitted midnight correlations. A cross-calibration approach by measuring the reflectance of a standardized reference target was used to correct differences in light sensitivity of two channels [63]. Then, canopy reflectance (ρ) was calculated as:
ρ = ((ρr − ρrDC) × (ρi − ρiDC))/((ρi − ρiDC) × (ρr − ρrDC))
where ρi and ρr are the irradiance and radiance of the canopy measured using Unispec-DC, respectively; ρiDC and ρrDC are the irradiance and radiance produced by DC, respectively; the single quote mark means data measured from the reference target.
Data measured with view azimuth angles ranging from 45° to 325° view zenith angles less than 63° (true view zenith angles approximately less than 75° owing to IFOV), and the solar zenith angle less than 75° was used. Due to failures of instruments, only data from day 101 to 275 in 2013 were used in this study.

2.4. Statistical Data Analysis

In total, there are 3118 half-hourly samples of good quality data obtained under different weather conditions. All variables were expressed with mean values, except for PAR and GPP which were total values either in half-hourly or daily time units. The effects of main bioclimatic factors (PAR, vapor pressure deficit (VPD), CI, Ta and SM) on PRI and LUE variations and their relationship were assessed for the whole growing season and individual months using linear and logarithmic functions (y = a × x + b, y = a × ln(x) + b; x and y denote bioclimatic factors and PRI or LUE, respectively). Statistical analyses were performed using MATLAB and Microsoft Excel software.

3. Results

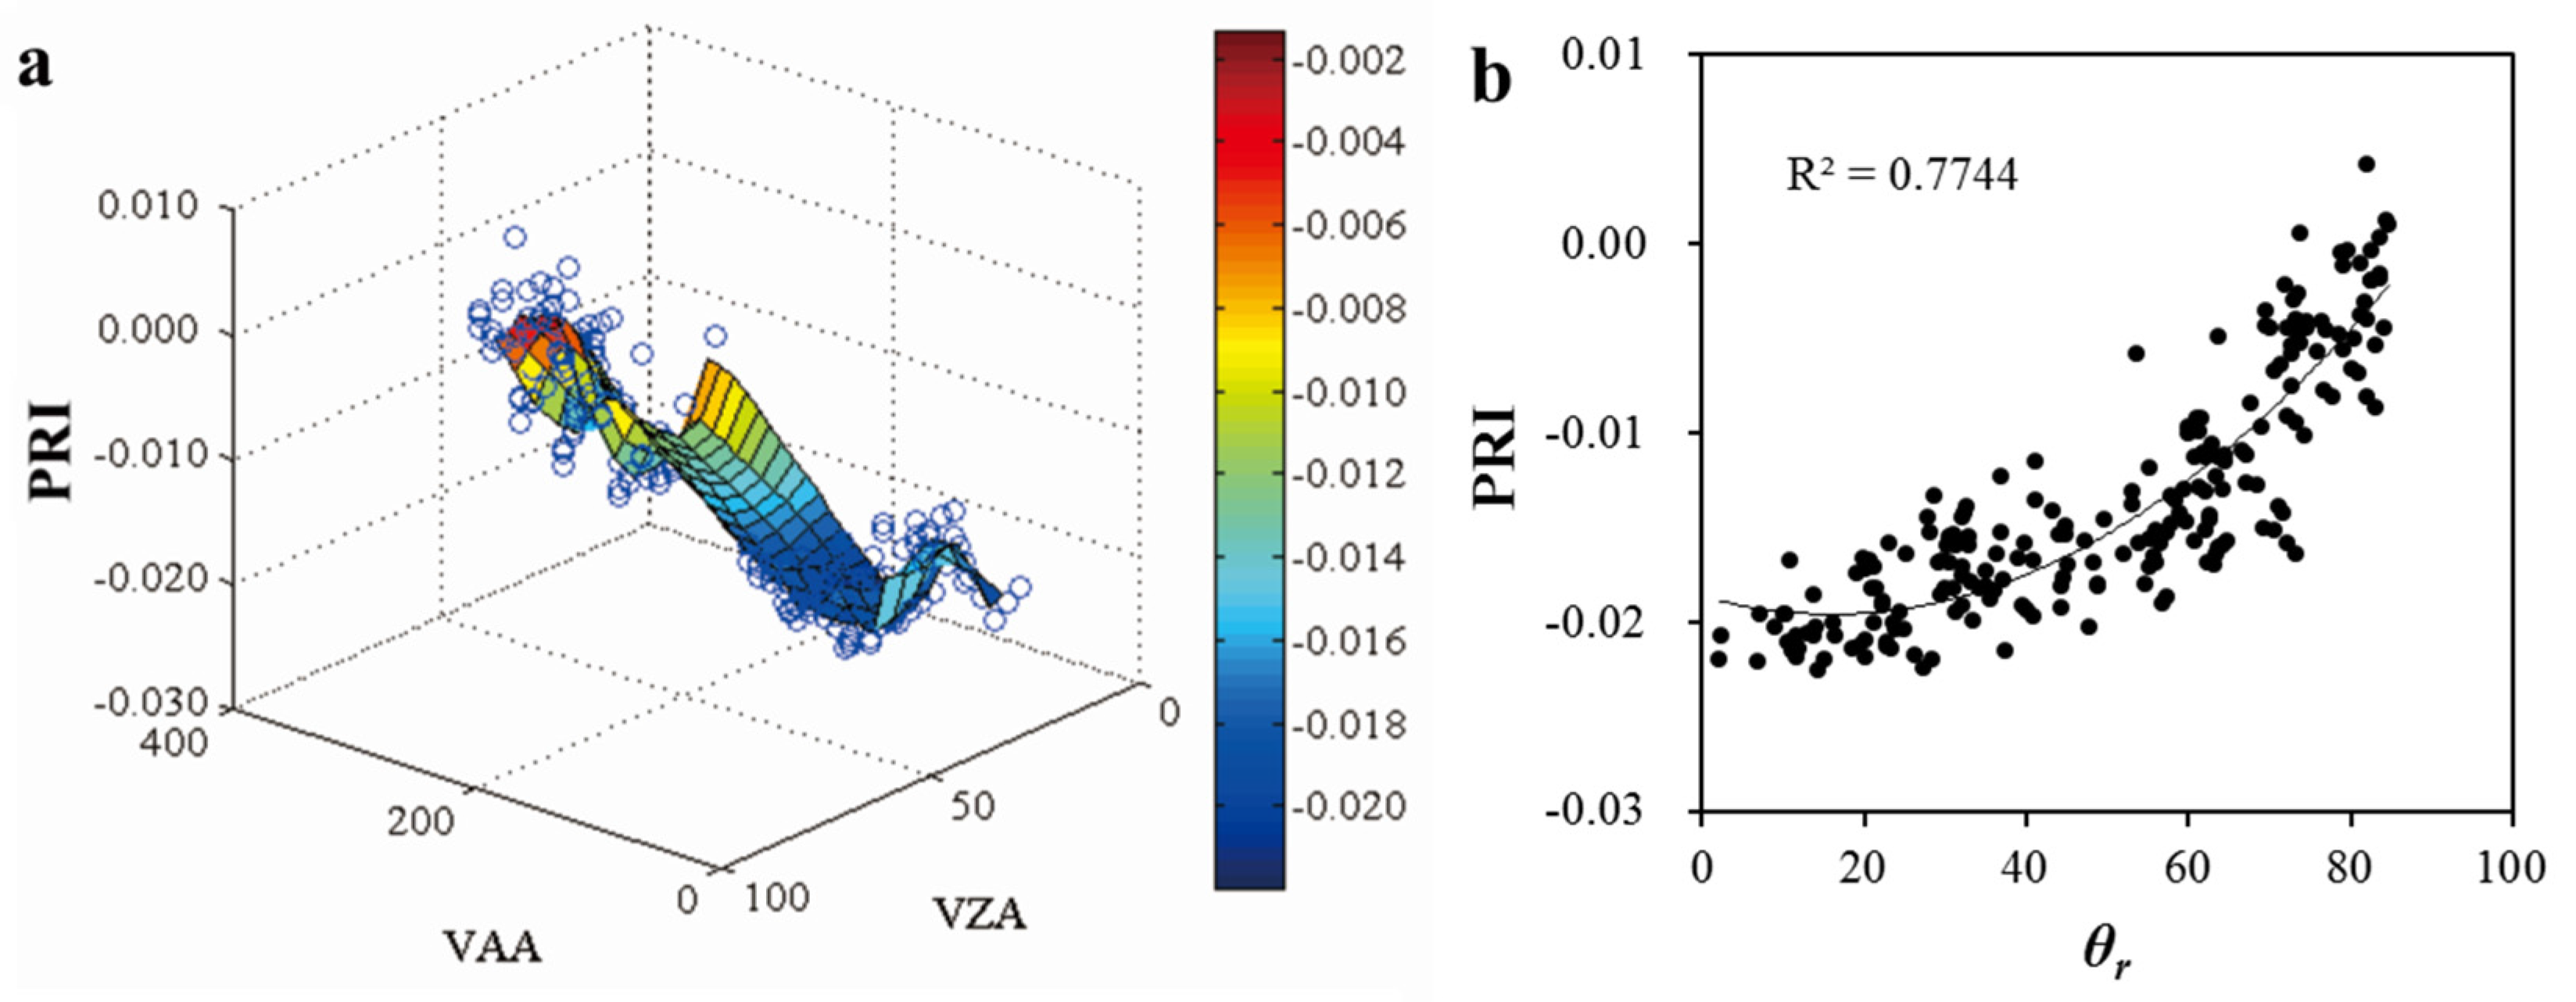
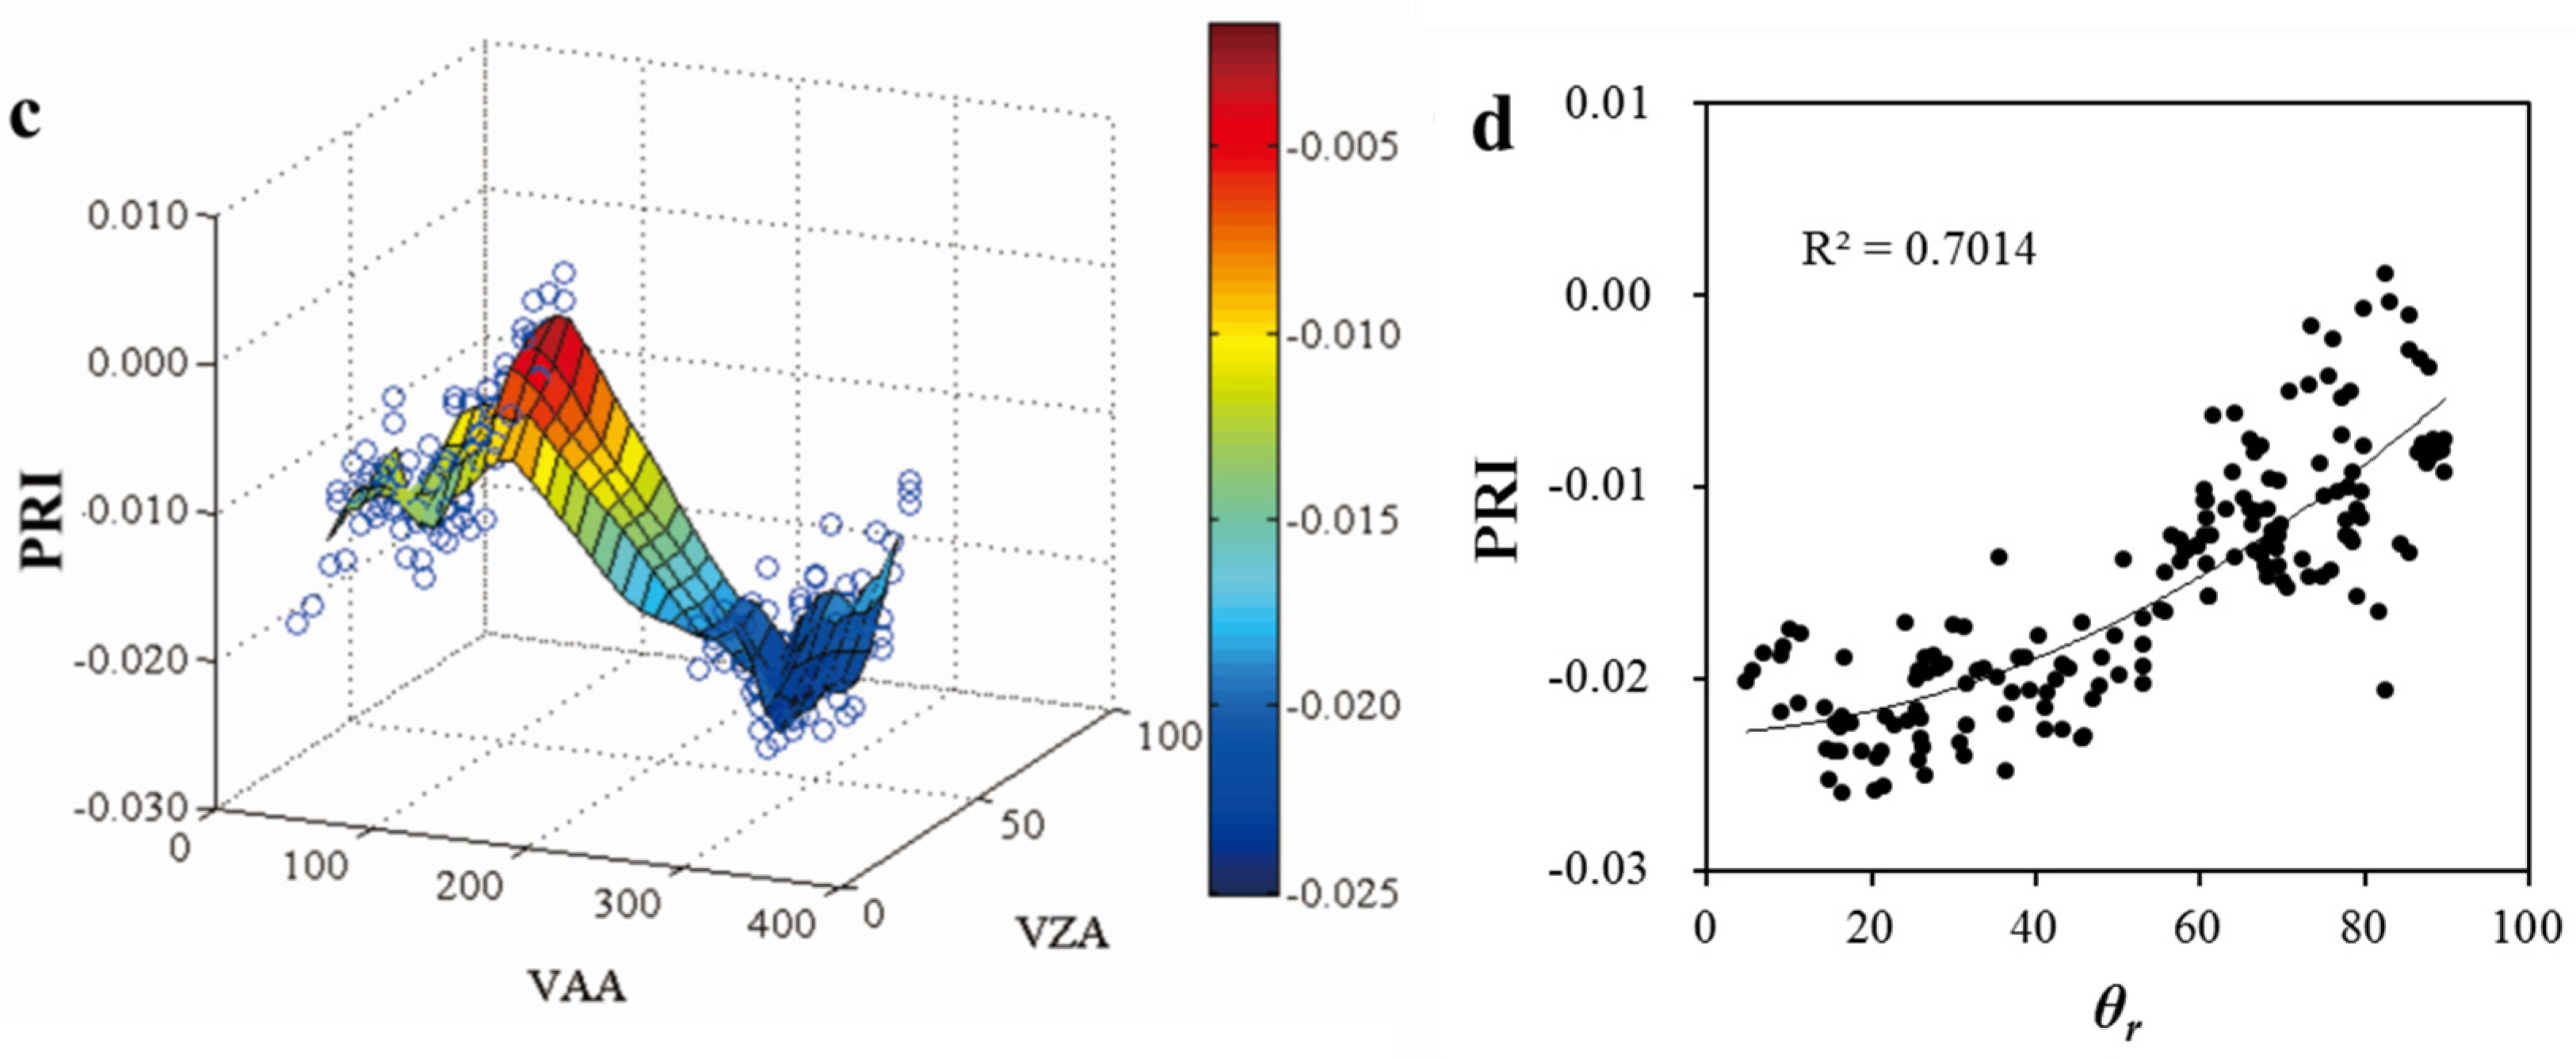
3.1. Variability of PRI with Multiple View Angles

Within 15 min of spectral observation, PRI dramatically varied with view angles (Figure 1). As solar radiation was nearly constant during this period, this variation of PRI was mostly induced by viewing different portions of the canopy at different angles. Figure 1a,b used spectral data obtained from 10:45 a.m. to 11 a.m. on day 218 under clear sky conditions (n = 218), when the solar azimuth angle was about 105° (here defined from geodetic north) and the solar zenith angle was about 28°. Figure 1a showed PRI varied with different view azimuth angles (VAA, here defined from geodetic south to conveniently calculate the angle between sun and viewer) and view zenith angles (VZA). The PRI values in the backward scattering direction were generally lower than those in the forward scattering direction. Figure 1b illustrated PRI variations in relation to the angle between the sun and viewer (θr) as the value of PRI was the lowest near the hotspot (θr ≈ 0) and was high when the sun and viewer were far apart. Figure 1c and d used spectral data obtained from 14:45 to 15:00 on day 218 (n = 175), when the solar azimuth angle was about 258° and the solar zenith angle was about 31°. The variation patterns of PRI with view angle and θr were quite similar to those shown in Figure 1a,b. For half-hourly comparison with LUE, the top-canopy PRI was calculated as the mean value of the multi-angle PRI, which could reduce the angular effects to some extent with hundreds of samples evenly distributed at different angles.
Figure 1. Variability of PRI with different view angles at different times. (a) and (b) used data obtained from 10:45 a.m. to 11 a.m. on day 218, while (c) and (d) used data obtained from 14:45 to 15:00; (a) and (c) showed variability of PRI with different view azimuth angles (VAA) and view zenith angles (VZA); (b) and (d) illustrated PRI variations in relation to the angle between sun and viewer (θr).
Remotesensing 07 15860 g001aRemotesensing 07 15860 g001b

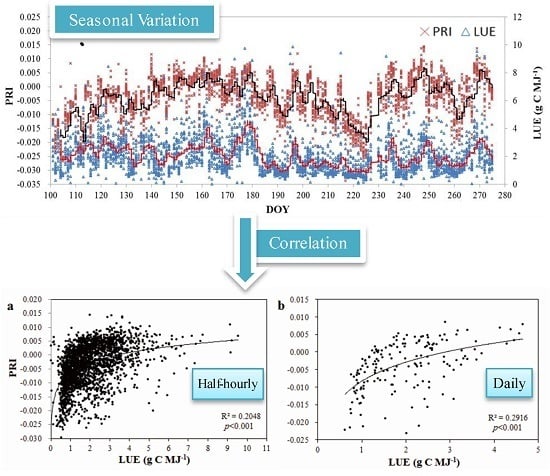
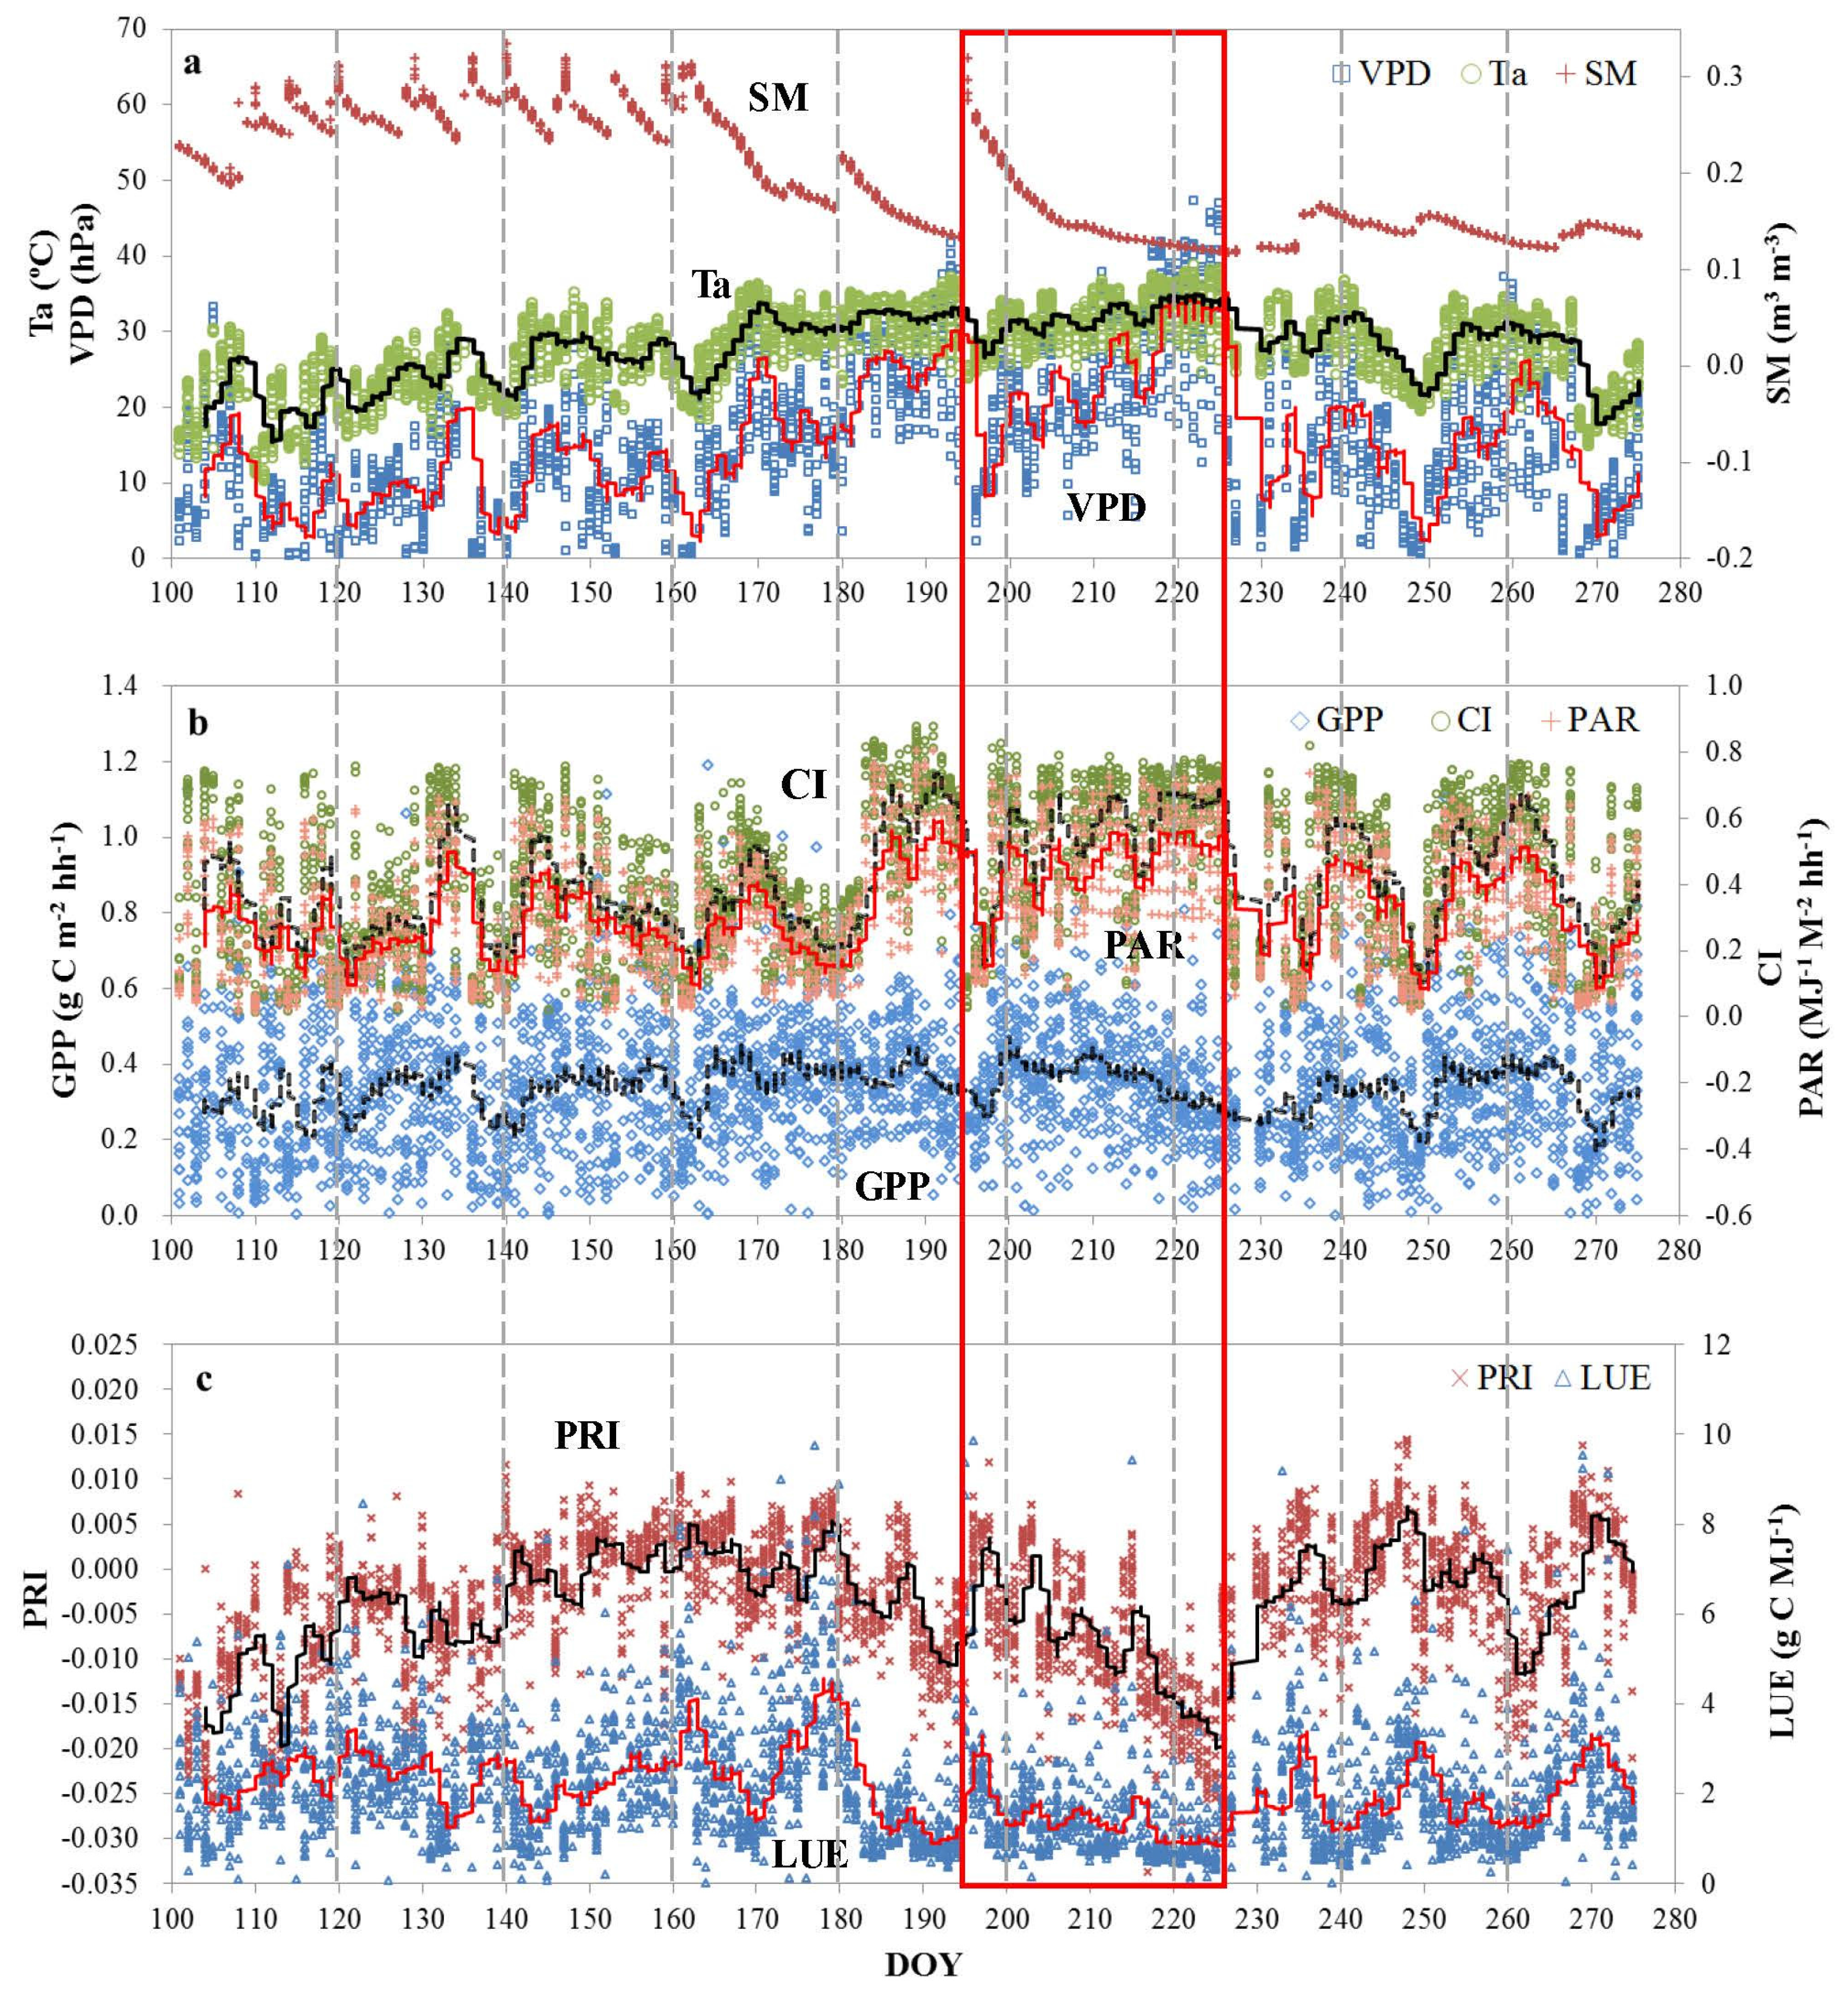
3.2. Seasonal Patterns of Bioclimatic Factors, Productivity, PRI, and LUE

Figure 2 illustrates the seasonal variations of the bioclimatic parameters of productivity, PRI, and LUE. A data gap from day 228 to 229 was caused by instrumental failure. Ta, VPD, PAR, CI, and GPP exhibited mostly similar seasonal patterns (Figure 2a,b), while PRI and LUE showed opposite trends (Figure 2c). According to the temporal pattern of precipitation, the seasonal dynamics can be characterized by two phases (Figure 2a): the rainy season from day 101 to 167 and the dry season from day 168 to 275. In the rainy season, SM (at 5 cm) was high. The dry season was characterized by less precipitation, low SM, and continuously high temperature.
VPD, PAR, and CI varied synchronously across the season. In the dry season, VPD was high (up to 50 hPa sometimes) due to high temperatures. Meanwhile, SM decreased quickly due to high evapotranspiration consumption. During the period from day 218 to 225, daily maximum temperatures were continuously above 35 °C. Such a long-term heat wave was second only to that which occurred in 2003 during the years from 2003 to 2013 with flux measurements available. During the period from day 196 to 226, rainfall was low and temperature was high. We defined this period as a summer depression period (highlighted by a red rectangle in Figure 2).
GPP exhibited an overall seasonal variation similar to air temperature (Figure 2a). However, GPP declined during the summer depression period. Previous studies also reported that high temperatures and low soil water content might cause GPP to decline in this forest [64,65].
The seasonal patterns of LUE and PRI appeared to be complicated. LUE generally varied inversely with PAR, and reached the lowest level during the summer depression period. PRI could track variations of LUE to some extent, especially in the dry season. Although PRI and LUE were correlated, the variability of PRI was greater than that of LUE. In the rainy season, the fraction of diffuse radiation was high, which might induce high LUE [23,42]. Overall, PRI inversely varied with PAR. However, the change of PRI with PAR was not obvious on rainy or overcast days. PRI was more obviously correlated with PAR and CI in the dry season than in the rainy season. Moreover, PRI, GPP, and LUE all apparently decreased during the depression period with continuously high temperature.
Figure 2. Seasonal variations of (a) SM (at 5 cm), Ta, VPD; (b) GPP, CI, PAR; and (c) PRI, LUE measured every half hour from 7 a.m. to 17:30 when the solar zenith angles were less than 75°. The solid lines indicated 50 samples’ moving averages. The red rectangle indicated the depression period.
Remotesensing 07 15860 g002
As presented in Figure 3, PAR could explain 52% of LUE variance (Figure 3b), followed by VPD (Figure 3a) and Ta (Figure 3c). LUE decreased significantly with increases of PAR, Ta, and VPD (p < 0.05). PRI also decreased with increases of PAR, Ta, and VPD. Both PAR (Figure 3e) and VPD (Figure 3d) could explain more than 20% of PRI variance. The correlations between PRI and Ta are weak (Figure 3f).
Figure 3. Relationships of half-hourly bioclimatic parameters (i.e., VPD, PAR, and Ta) with LUE (ac); and with PRI (df) observed from 9 a.m. to 16:30 each day across the season.
Remotesensing 07 15860 g003

3.3. Temporal Variation of the Relationship between PRI and LUE

Figure 4 shows the correlation coefficients (R) of half-hourly PRI with LUE on individual days with more than five good-quality observations between 9 a.m. and 16:30 with high solar elevation angles. Generally, PRI is positively correlated with LUE. Among 163 days, PRI was significantly correlated with LUE on 58 days (p < 0.05).
Figure 4. Correlation coefficients (R) of half-hourly PRI with LUE on individual days, with data acquired from 9 a.m. to 16:30. The length of error-bars represents the p-value of each linear regression. PR: positive correlation, NR: negative correlation.
Remotesensing 07 15860 g004
The correlations of PRI with LUE changed with weather conditions. PRI was significantly correlated with LUE on 40.6% of the days in the dry season. The corresponding ratio decreased to 22.4% in the rainy season. On days when PRI was significantly correlated with LUE, PRI was affected by both CI and VPD before day 206. On the following days, VPD was a more important factor for regulating PRI than CI. During the period of consecutively high temperature in August, VPD was high and acted as the dominant controller of GPP. It increased continuously after sunrise, resulting in a corresponding decrease of GPP due to the closure of leaf stomata. As a consequence, LUE continuously decreased. Meanwhile, a continuous decrease of PRI was observed since the fraction of radiation used for carbon fixation continuously decreased during daytime. PRI was positively correlated with both LUE and GPP. Similar phenomena were also found on some other clear days with high VPD (>20 hPa). Some unexpected significantly negative relationships between PRI and LUE were observed on or shortly after some heavily raining days. At this site, fluxes were measured using an open path EC system. When the sensor is wet, the accuracy of the measured flux is low. Water accumulated on leaves also impacts the measurements of the optical spectra. Uncertainties in estimated GPP and measured spectra resulted in an unexpected relationship between PRI and LUE.
Figure 5a,b show the relationships between LUE and PRI at half-hourly and daily temporal scales, respectively, throughout the study period. Significant logarithmic correlations were found at both half-hourly and daily temporal scales, even though the coefficients of determination (R2) were not very high. The difference in dominant regulators of PRI and LUE variations appeared to be the reason for the low correlation coefficients between PRI and LUE throughout the entire growing season (Figure 3). The difference in the correlations between these two temporal steps indicates that the temporal scale can have some effects on the correlation of PRI with LUE.
Figure 5. Relationships between (a) half-hourly and (b) daily average PRI and LUE calculated using data observed from 9 a.m. to 16:30 each day throughout the study period.
Remotesensing 07 15860 g005
For individual months, logarithmic relationships between daily average PRI and LUE were presented in Figure 6. The relationship varied dramatically throughout the growing season. The worst regression between PRI and LUE was observed in May due to the abundance of rainy days. PRI can act as a good indicator of LUE in July and August, in which severe drought and consecutive high temperature occurred.
Figure 6. Logarithmic relationships between daily average PRI and LUE calculated using data observed from 9 a.m, to 16:30 each day for six months (Apr.–Sep.).
Remotesensing 07 15860 g006

3.4. Effects of Bioclimatic Factors on the Ability of PRI as a Proxy of LUE

Light, water and temperature are the most essential factors regulating photosynthesis. The effects of these bioclimatic factors on PRI and LUE and on the ability of PRI to indicate LUE were investigated.
In April, when Ta was low, both LUE and PRI were less sensitive to Ta, but were more sensitive to PAR, leading to a moderate correlation between LUE and PRI (Figure 7). PRI was decoupled with LUE in May, as LUE was significantly correlated to the three bioclimatic factors while the PRI variation was irrelevant to any of them, due to the abundance of rainfall which might induce uncertainties in spectral observations. The correlation between LUE and Ta was much stronger than all other five correlations in June, while the correlation between PRI and LUE was not strong. In July, all six correlations were at a high level which made the best correlation between PRI and LUE among all six months. In this month, there were many sunny or slightly cloudy days (CI > 0.5). Since then, in August and September, PRI was much more correlated to VPD while LUE was more correlated to PAR, which apparently caused the decline of the correlation between PRI and LUE.
Figure 7. Variations of linear coefficients of determination (R2) between PRI or LUE and the three bioclimatic parameters (i.e., VPD, PAR, and Ta) observed from 9 a.m. to 16:30 each day at monthly interval.
Remotesensing 07 15860 g007
Figure 8 illustrated variations of diurnal correlation coefficients (R) of half-hourly PRI with LUE binned according to different daily means of bioclimatic factors and GPP. With increases of VPD, PAR and CI, the R increased obviously (Figure 8a–c). The R of half-hourly PRI with LUE changed marginally with daily mean air temperatures when the daily mean air temperatures was below 30 °C and then increased considerably with the further increase of daily mean air temperatures. The R of half-hourly PRI with LUE slightly decreased with the increase of soil moisture (Figure 8d). Overall, PRI performed better in tracking diurnal variations of LUE on clear and dry days than on overcast and wet days. In addition, the ability of PRI to track LUE became weaker on days with low and high daily GPP (Figure 7f).
Figure 9 showed the variations of diurnal correlation coefficients (R) between half-hourly PRI and LUE in the two-dimensional space of two bioclimatic parameters. High values of R between PRI and LUE were mostly under conditions when VPD was above 20 hPa. If VPD was above 30 hPa, PRI was able to track LUE well regardless of the values of the other bioclimatic factors (Figure 9a–c). As to same given values of Ta, SM, PAR and CI, the ability of PRI to act as a proxy of LUE increased with VPD. The effects of CI and PAR on the relationship of PRI with LUE were not synchronous (Figure 9e). When PAR was less than 4 MJ∙m−2∙d−1, R was low, but decreased with the increase of CI when PAR varied from 4 to 8 MJ∙m−2∙d−1. Additionally, the values of R were generally high when PAR was above 8 MJ∙m−2∙d−1. For different levels of SM (Figure 9f), high values of R were mostly found on sunny or slightly cloudy days (CI > 0.5).
Figure 8. Average diurnal correlation coefficients (R) of half-hourly PRI with LUE in relation to (ae) individual bioclimatic factors or (f) GPP throughout the whole season. Error bars indicated one standard deviation.
Remotesensing 07 15860 g008
Figure 9. (af) Diurnal correlation coefficients (R) between PRI and LUE as affected by two bioclimatic factors.
Remotesensing 07 15860 g009aRemotesensing 07 15860 g009b
The ability of PRI to track LUE changed with different combinations of bioclimatic factors (Table 1). There are 2223 paired samples of PRI and LUE in total between 9 a.m. and 16:30 throughout the entire study period. When these samples were binned according to VPD in conjunction with Ta, PRI was correlated with LUE at the significance levels of 0.05, 0.01 and 0.001 for 1712, 1703, and 1680 samples. Classifying samples according to the configuration of VPD and Ta could greatly improve the ability of PRI to track LUE. Under the condition of Ta above 30 °C and PAR above 0.3 MJ∙m−2∙hh−1, PRI was significantly correlated with LUE. When CI was below 0.3, PRI and LUE were poorly correlated. This analysis further confirmed that PRI is able to act as an effective indicator of LUE under clear or partially cloudy skies (CI > 0.3) with moderate to high VPD (>20 hPa) and high temperatures (>31 °C). In total, 630 samples satisfy such criteria. PRI could explain 33.5% of the variations of LUE when satisfied samples were lumped together, while PRI could only explain 5.3% of the LUE variations when the remaining 1593 samples were lumped together.
Table 1. Linear coefficients of determination (R2) between half-hourly photochemical reflectance index (PRI) and light use efficiency (LUE) binned according to two different bioclimatic factors throughout the whole season. Numbers in parentheses are samples in individual groups binned according to two bioclimatic factors.
R2Ta (ºC)
<2020–2525–3030–35>35
VPD(hPa)<100.0943 ***0.04320.018900
(175)(289)(222)(0)(0)
10–2000.2352***0.0693***0.0908***0
(0)(66)(439)(321)(0)
20–30000.3203**0.1800***0.6266*
(0)(0)(23)(467)(9)
30–400000.1239***0.3155***
(0)(0)(0)(73)(106)
>4000000.1966***
(0)(0)(0)(0)(33)
R2CI
<0.150.15–0.300.30–0.500.50–0.70>0.70
VPD(hPa)<100.00950.01190.00080.0031n0.1161
(241)(242)(131)(62)(10)
10–200.05370.01330.01540.0009n0.0058n
(32)(162)(267)(268)(97)
20–3000.09770.1003***0.0744***0.0112n
(0)(33)(92)(217)(157)
30–40000.5707***0.1025***0.2105***
(0)(0)(14)(99)(66)
>400000.05980.4611*
(0)(0)(0)(21)(12)
R2PAR (MJ m−2 hh−1)
<0.150.15–0.300.30–0.450.45–0.60>0.60
VPD(hPa)<100.0123*0.00110.00730.00000
(345)(272)(57)(12)(0)
10–200.0925**0.0165*0.0342**0.00060.0797n
(84)(272)(266)(181)(23)
20–300.12010.0888*0.1677***0.0511**0.0348
(15)(58)(135)(184)(107)
30–40000.2534***0.0824*0.1741***
(0)(0)(45)(69)(65)
>40000.07110.23370.4024*
(0)(0)(7)(16)(10)
R2PAR (MJ m−2 hh−1)
<0.150.15–0.300.30–0.450.45–0.60>0.60
Ta (ºC)<200.02710.00060.13020.4787n0
(137)(27)(8)(4)(0)
20–250.00740.00340.2280***0.06420
(135)(144)(47)(29)(0)
25–300.0570**0.01090.00450.03990.0317n
(131)(288)(169)(90)(6)
30–350.06620.0220.2367***0.0674***0.0959***
(40)(143)(252)(278)(147)
>3500.54670.3722***0.3053***0.3409***
(0)(5)(30)(63)(50)
R2CI
<0.150.15–0.300.30–0.500.50–0.70>0.70
Ta (ºC)<200.02230.00030.02290.02440
(108)(40)(19)(9)(0)
20–250.00040.0412*0.00040.1000*0.1702
(93)(118)(77)(47)(20)
25–300.0737*0.01600.00060.00390.0435
(63)(185)(215)(177)(44)
30–350.00010.01790.1420***0.0810***0.0079
(12)(90)(182)(348)(228)
>35000.5091**0.3115***0.3809***
(0)(0)(13)(87)(48)
R2PAR (MJ m−2 hh−1)
<0.150.15–0.300.30–0.450.45–0.60>0.60
CI<0.150.01240000
(276)(0)(0)(0)(0)
0.15–0.300.0402**0.0061000
(168)(266)(0)(0)(0)
0.30–0.5000.0006n0.0619***00
(0)(291)(214)(0)(0)
0.50–0.7000.0133n0.0770***0.1285***0.2985***
(0)(49)(248)(330)(39)
>0.70000.005n0.0657**0.2805***
(0)(0)(45)(131)(166)
*: (p < 0.05); **: (p < 0.01); ***: (p < 0.001), n: negative correlation.

4. Discussion

4.1. Feasibility of PRI to Indicate LUE

During this study period (Figure 2), GPP roughly varied with temperature in the rainy season, but was limited by the water condition in the dry season. Differently, PRI and LUE showed quite complicated seasonal variations due to polytropic meteorological conditions. According to diurnal (Figure 4), monthly (Figure 6), and six-month results (Figure 5), PRI showed the potential to be a proxy of LUE in this sub-tropic evergreen coniferous forest, but the best correlations between PRI and LUE are found only under certain meteorological conditions.
Significant positive correlations between PRI and LUE were found on some days (Figure 4), months (Figure 6), as well as throughout the study period (Figure 5). These results are consistent with previous studies at canopy scales and different temporal scales [3,26,32,44,66]. LUE is mostly determined by environmental stress factors that reduce photosynthetic rates, such as photoinhibition in short terms and water deficit in long terms. This reduction inversely increases the proportion of absorbed energy dissipated as heat, which can be detected by the decrease of R531, forming the basis of PRI [33,37,55,67]. Thus, PRI could track LUE at different temporal scales. Garbulsky et al. [44] indicated different types of relationships between PRI and LUE. In this study, PRI was mostly linearly correlated to LUE at the diurnal scale and logarithmically correlated to LUE for longer periods, which was possibly due to the complicated canopy structure of conifer forest.
PRI was announced as a short-term variable index [32,34], which allowed it to track the variation of LUE at short temporal scales. However, even though PRI could track LUE variations to some extent (Figure 2c), some distinctive variations among bioclimatic factors, PRI and LUE were observed, which indicated that PRI and LUE were driven by different factors (Figure 3 and Figure 7, Figure 8 and Figure 9) during such a long period [30]. Additionally, the difference in meteorological conditions between the rainy and dry seasons further magnified this gap.

4.2. Uncertainties in the Relationship between PRI and LUE

The relationships of PRI and LUE over long periods were significant, but were scattered (Figure 5 and Figure 6). Moreover, a negative correlation between PRI and LUE (Figure 4) highlighted the complexity of the confounding factors regulating PRI and LUE, which had been discussed by many works [24,26,38,39,41,47,68,69,70,71,72] and are still far from settled. Three factors might be the main causes for the scattered relationship between PRI and LUE.
First, solar radiation affects the relationship between PRI and LUE over different temporal scales. As shown in Table 1, at the same levels of CI, correlations between PRI and LUE generally became stronger with increasing PAR. During the entire study period, PAR was the key factor controlling variations of both half-hourly PRI and LUE (Figure 3). When the study period was separated to six months, radiation became a ’double-edged sword’, although the most important determinant of the correlation between PRI and LUE was always the relationship of PRI with PAR (Figure 7). Under rainy or severely overcast sky conditions, since canopy reflectance observations were contaminated by rain or low illumination, abnormal PRI might be observed that induced inconsistent, even negative correlations of PRI with LUE (Figure 4). In May, because of frequent alternations between sunny and rainy conditions, the relationship between PRI and LUE was very scattered. Even if only data on clear and slightly overcast days in this month were used, this relationship was still poor, which was consistent with the findings reported by Soudani et al. [32]. In the dry season, both PRI and LUE were more sensitive to VPD and Ta than to PAR, especially during the summer depression period. However, as illustrated in Table 1, the strongest correlation between PRI and LUE was not found at the highest level of VPD, indicating that the ability of PRI to track LUE is compromised under high atmospheric water stress.
At the diurnal scale, the findings here were slightly different from the conclusion declared by Gamon and Bond [27]. In this sub-tropic conifer forest, both radiation (i.e., PAR and CI) and VPD (Figure 8a,b,d) are dominant factors regulating the correlation between PRI and LUE. Under conditions of moderate to high PAR, CI, VPD, and Ta, the correlation coefficients between PRI and LUE were high (Figure 8a–d and Figure 9), indicating the ability of PRI to act as a proxy of LUE under climatic stress. A paired factors analysis illustrated the complexity of correlation between PRI and LUE under different weather conditions (Figure 9). The relationship between PRI and LUE differed in different months and under different combinations of bioclimatic factors (Table 1), implying the necessity to estimate LUE based on PRI using different empirical equations in different months and under different weather conditions. It is still a challenge to derive a generalized relationship between LUE and PRI.
Tower-based LUE was estimated according to GPP derived from NEP measurements and empirically estimated APAR. The latter would definitely affect the relationship between PRI and LUE. When APAR was calculated using the two-leaf LUE approach, which differentiates the different interactions of direct and diffuse radiation within the canopy and the different responses of photosynthesis rates of sunlit and shaded leaves to incoming PAR, the ability of PRI to approximate LUE was improved (Appendix C). For thoroughly investigating the ability of PRI to indicate LUE, accurate estimates or measurements of APAR were required.
The effect of sun-view geometry on PRI has been discussed in many ways [3,27,40,41,69,73], and with no doubt that multi-angle measurements are the best way to tackle this issue (Figure 1). The fraction of sunlit leaves of the whole canopy is the biggest at noon. However, the sensor is possibly unable to observe all sunlit leaves at this moment, which might lead to a smaller diurnal variation of observed PRI than the reality. Similarly, Gamon and Bond [27] also reported that the relationship between PRI and PAR was influenced by the ratio of observed sunlit leaves to shaded ones. At the beginning and the end of the growing season, the values of PRI were relatively low. This phenomenon might be caused by more measurements of sunlit leaves with low PRI, which was induced by larger solar zenith angles. Therefore, it is needed for an effective way to reduce the impact of sun-view geometry and varied shadow and sunlit fractions on PRI. A semi-empirical kernel-driven bidirectional reflectance distribution function (BRDF) model was first applied to standardize the directional reflectance to one direction that significantly enhanced the correlation between canopy PRI and LUE [3]. However, based on in situ observations and model simulations, Cheng [72] mentioned that, as directional PRI responses associated with sunlit/shaded foliage, various sunlit/shaded canopy ratios affected the utilization of canopy PRI over different stages of corn during a growing season. Additionally, the best sunlit/shaded canopy ratio for retrieving “true” canopy PRI might change with canopy types. Thus, a best direction with a proper sunlit/shaded foliage ratio, a structure-based parameter, needs to be considered when using the BRDF model to interpret canopy PRI. Furthermore, the contribution of the background to the reflectance of the forest canopy varyies with the changing view angle [31,74], and it is hard to eliminate the influence of the background signal using the semi-empirical kernel-driven model.
Additionally, the changing diffuse fraction of the incident radiation amplified the effect of sun-view geometry. It is necessary to consider the impact of diffuse irradiance that may cause variations of structurally and physiologically absorbed PAR, which induces carbon uptake [75,76], and further influences the relationship between PRI and LUE (Appendix C) under changing sky conditions. As both PRI and LUE are very sensitive to the shadow fraction in the canopy [39,42], separating the canopy to sunlit and shaded parts and then calculating the true (two-leaf) PRI and LUE of the whole canopy might be a robust and widely applicable approach to overcome this issue, based on the multi-angle observation. Further consideration of this approach could help interpret PRI information to identify underlying leaf physiological mechanisms, and to reduce uncertainties in LUE estimates using remote-sensing observations.
According to recent works presented by Wong and Gamon [77] and Felella et al. [46], long-term variation of PRI was mainly driven by pigment pools or the carotenoid:chlorophyll (Car/Chl) ratio. In this conifer forest, abundant new leaves sprout out in early spring around March, and an amount of old leaves falls in late autumn around October, meaning that the canopy Car/Chl ratio exhibited considerable seasonal variations. In addition, the Car/Chl ratio also changes vertically within the canopy. However, the ways of these variations affecting the relationship between PRI and LUE might be different or in different magnitudes at different times in the growing season, causing the scatters in the correlation between PRI and LUE over the whole season [44]. In this study, the Car/Chl ratio was assumed to be constant, as there was not an effective way to evaluate its effect only with multi-angle spectral data for this site.

4.3. Unresolved Questions

The correlation between PRI and LUE has been tested over a wide range of ecosystems. A universal relationship of PRI with LUE has not been found yet due to the complex response of plant photosynthesis to radiation under various environmental conditions [44]. The relationship between PRI and LUE and the sensitivity of this relationship to bioclimatic factors vary in different types of ecosystems.
For boreal forests, previous studies mainly investigated the effects of non-physiological factors (e.g., sun-view geometry) on the relationship between PRI and LUE, as the distinct canopy structure makes the observed PRI strongly dependent on the sun-view geometry [3,14,40,41,53,54,78]. With considering or eliminating these factors, PRI is strongly correlated with LUE and can be used to monitor regional productivity over long time periods [3,24,25,79]. Even though PRI is useful for tracking seasonal changes in LUE as affected by temperature and nutrient variations in evergreen forests, the influences of the seasonal Car/Chl ratio and temperature variations via the expansion of leaves and aging on PRI signals cannot be neglected [46,47,66,77,80]. These factors need to be further investigated.
In temperate ecosystems, PRI is also useful for detecting water stress [81] and estimating LUE or carbon uptake [82,83,84,85] in conifer forests. Soundani et al. [32] found different factors driving PRI variations and the relationship between PRI and LUE under various environmental conditions for temperate deciduous and evergreen broadleaf forests. Additionally, the highest correlations between PRI and LUE were mostly observed under clear or slightly overcast sky conditions. However, they reported an insignificant correlation of PRI with APAR or LUE during a drought period in 2010, due to an insufficient signal-to-noise ratio for the PRI measurement. Besides, according to a significant correlation between PRI and GPP found in their study, we infer that a long-term drought might induce changes in the pigment pool size and leaf morphology, which further confound the PRI signals [77,86]. Variations of solar radiation and diffuse radiation also affect the relationship between PRI and LUE [27,42].
Grace et al. [87] found that PRI could track seasonal (dry/rainy) variations of LUE in Botswana. However, Nakaji et al. [30] exhibited limited sensitivity of the PRI to LUE, while a model with both PRI and VPD as predictors is able to significantly improve LUE estimation for a tropical evergreen rainforest, as there is no clearly defined dry/rainy season cycle. In Mediterranean forests, which often suffer heat and drought stress in summer, PRI is successfully used to detect water stress on LUE and assess LUE across different seasons [31,88,89,90,91].
Studies of PRI in sub-tropical forests are very limited. To our knowledge, only one study in a Pinus taiwanensis forest pointed out that PRI is more sensitive than photosystem II efficiency to water deficits, and is closely related to photosynthetic capacity at both high- and low-elevation sites in different seasons [92]. In our study, the strongest correlation between PRI and LUE was found during the dry season (Figure 8 and Figure 9 and Table 1), which confirms the sensitivity of PRI to water and heat stress previously reported for tropical and Mediterranean forests [87,88,89,90,91,93,94,95] and its ability to detect variations of LUE under stress conditions similar to that in other forests.
The distinction of illumination between the rainy and dry seasons and different proportions of observed sunlit and shaded leaves caused by the diurnal variation of sun-view geometry confounded this finding that PRI works better in tracking LUE under dry and heat stresses. Moreover, whether canopy pigment ratios changed under continuous heat and drought stress could further change the PRI signal is still unclear. To better understand the potential of PRI to be a proxy of LUE and advance carbon uptake monitoring capabilities in this sub-tropical coniferous forest, these confounding factors need to be clarified through further research.

5. Conclusions

Multi-angle tower-based optical spectra and flux datasets acquired during the period from April to September 2013 were used to study the ability of PRI to act as a proxy of LUE in a sub-tropic planted coniferous forest stand in Southern China. The following conclusions could be drawn from this study.
(1)
Both half-hourly PRI and LUE decreased with increases of VPD, Ta, and PAR. LUE is more sensitive to changes of these bioclimatic factors than PRI. Significantly positive diurnal correlations between PRI and LUE were mostly found on clear or partially cloudy days.
(2)
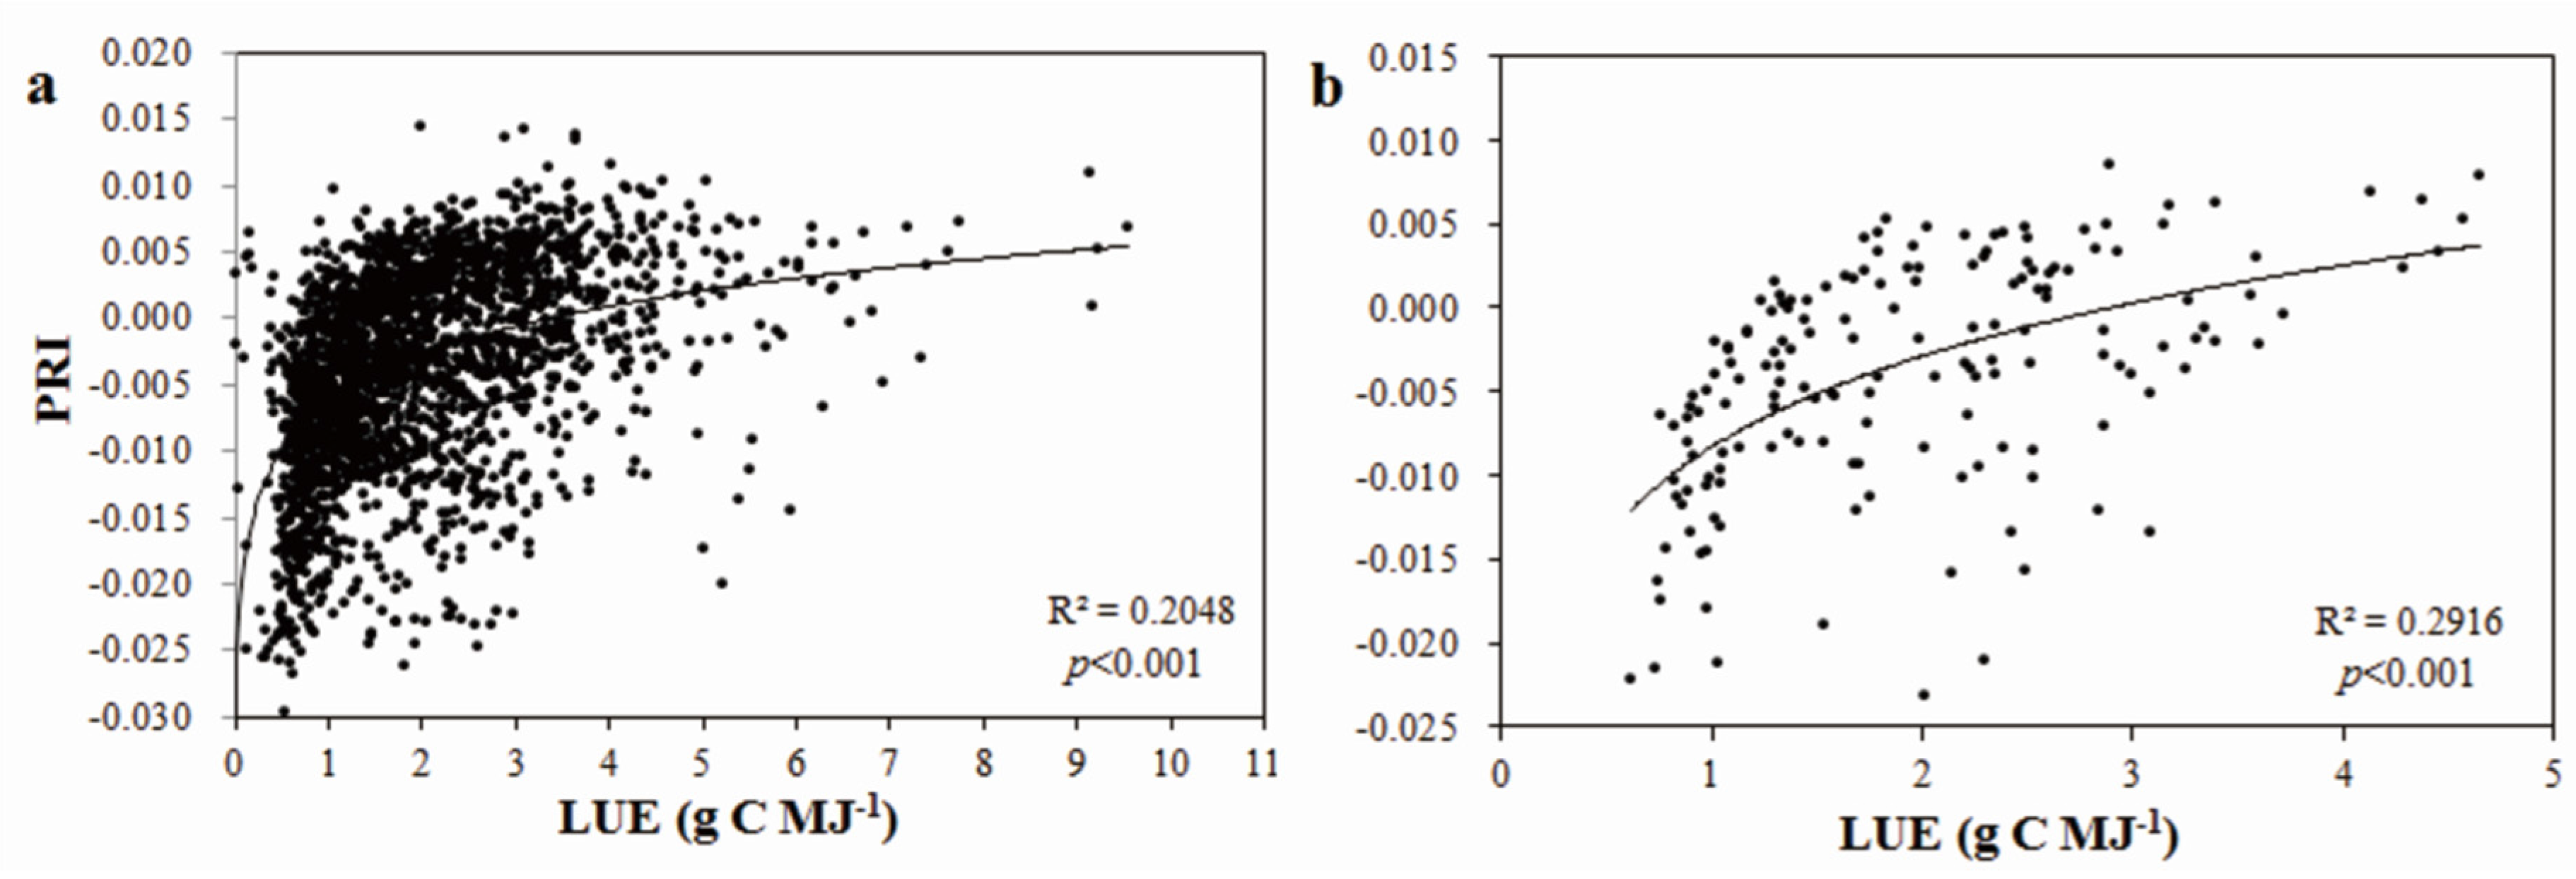
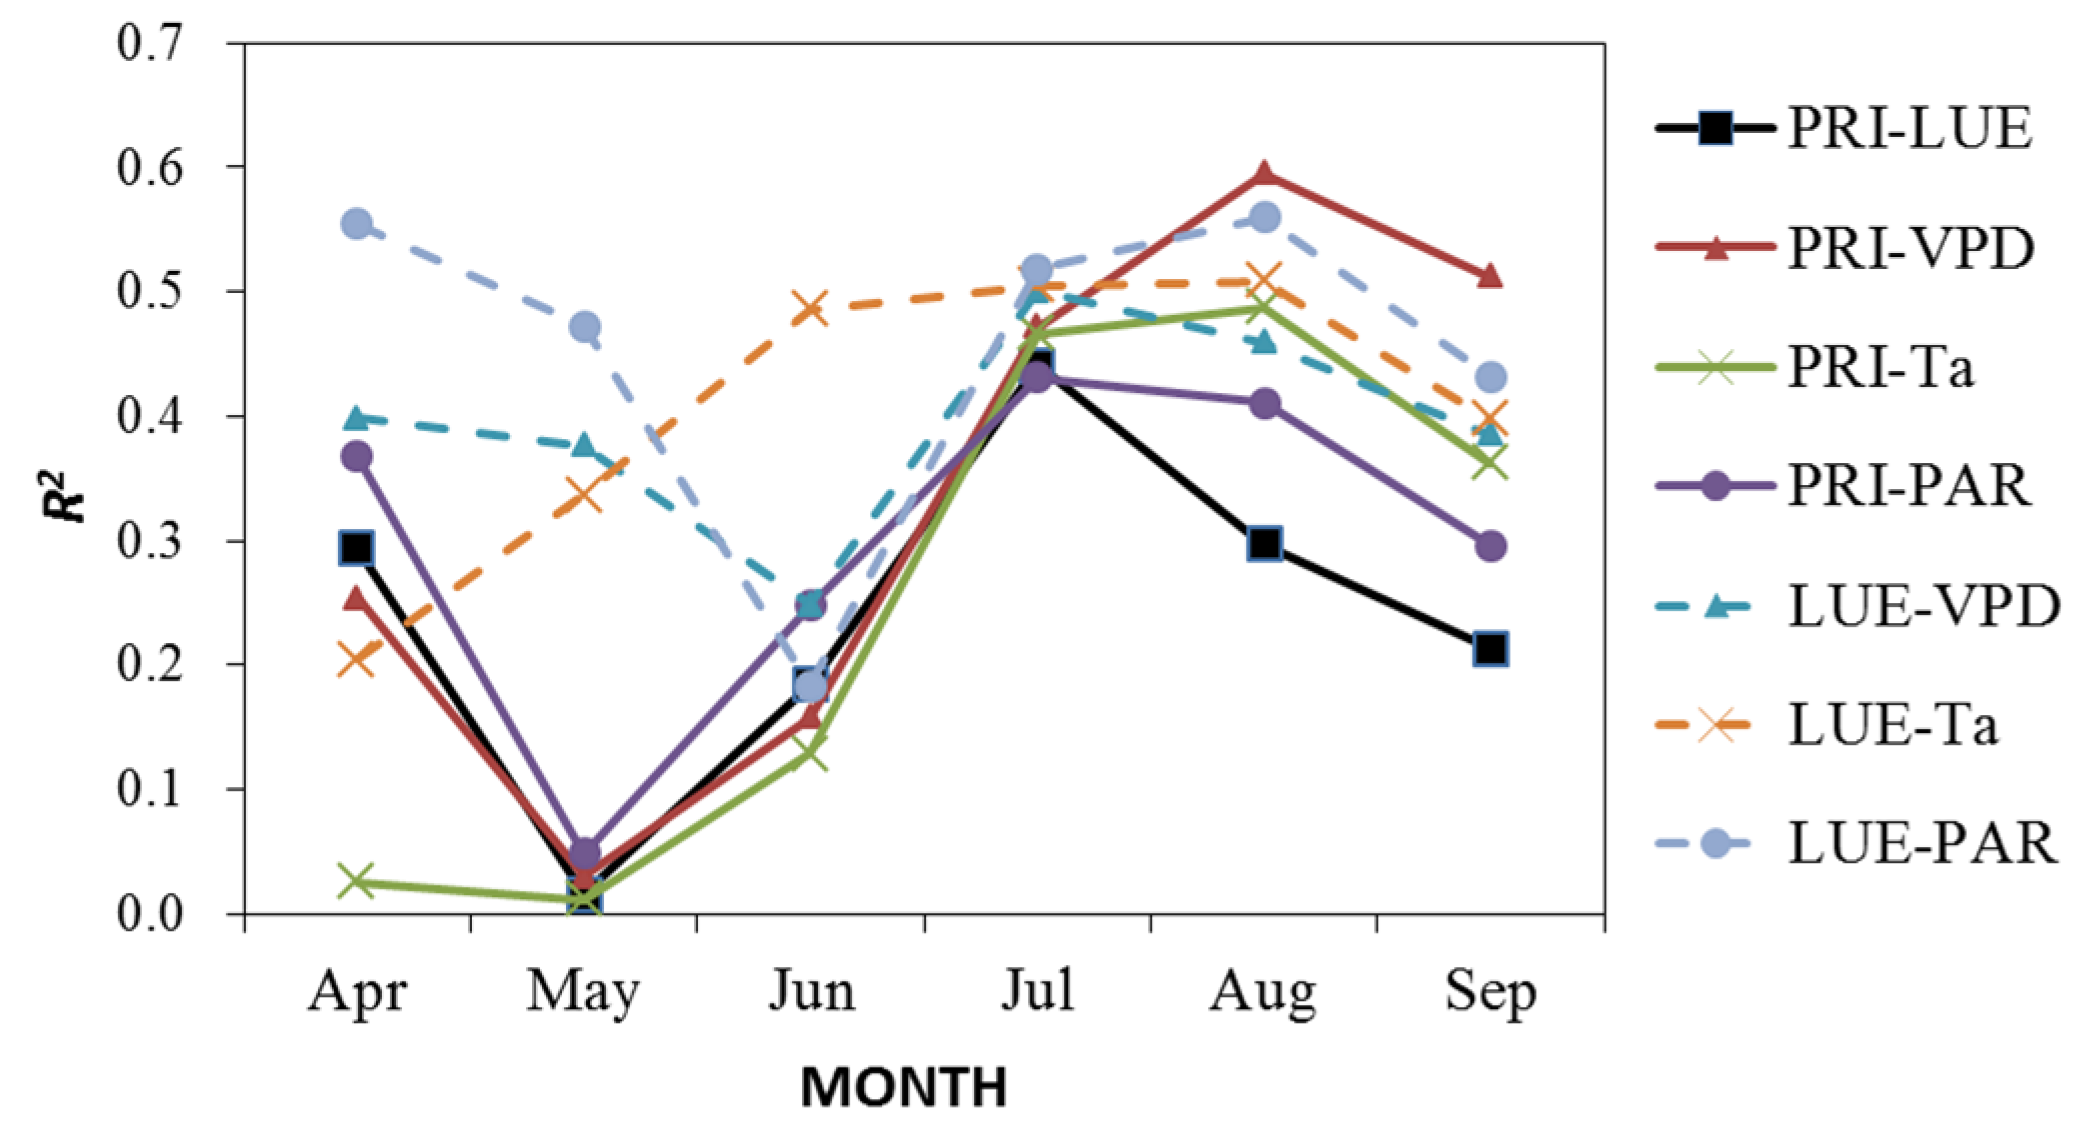
Significant logarithmic relationships were found between LUE and PRI at both half-hourly and daily scales across the study period. Correlations of PRI with LUE varied dramatically throughout the growing season. The correlation was the strongest (R2 = 0.6427, p < 0.001) in July and the poorest in May.
(3)
The ability of PRI to track LUE varied with bioclimatic factors. Generally, the effectiveness of PRI in indicating diurnal change of LUE increased with the increases of VPD, Ta, and PAR. As to the entire study period, PRI is more effective in detecting the changes of LUE under clear or partially cloudy skies (CI > 0.3) with moderate to high VPD (>20 hPa) and high temperatures (>31 °C).
(4)
Overall, we found that PRI is most sensitive to variations in LUE under stressed conditions, and the sensitivity decreases as the growing conditions become favorable when atmosphere water vapor, temperature and soil moisture are near the optimum conditions.

Acknowledgments

This work was supported by the National Natural Science Foundation of China (41271352 and 41371070), the Special Climate Change Fund under Grant (CCSF201412), Jiangsu Graduate Innovation Program (CXZZ12_0041), China Postdoctoral Science Foundation under Grant (2015T80148), National Science Foundation of China under Grant (41401418/D0106). We gratefully acknowledge the support from the Qianyanzhou station of Chinese Academy of Sciences for providing flux and meteorology datasets. We further acknowledge Yingping Wang (CSIRO, Australia) and Qiang Yu (University of Technology Sydney, Australia) for their valuable discussion on photosynthetic mechanism. Many thanks to three anonymous reviewers who provided helpful comments to the improvement of the manuscript.

Author Contributions

Qian Zhang, Weimin Ju, and Jing M. Chen designed the research. Qian Zhang, Huimin Wang, Fengting Yang, Weiliang Fan, Qing Huang, Ting Zheng, Yongkang Feng, Yanlian Zhou, Feng Qiu, Jun Wang, Shuren Chou processed spectral and flux observations, and data preparation. Qian Zhang, Weimin Ju, and Jing M. Chen mainly analyzed data and prepared the manuscript and figures. Mingzhu He, Xiaojie Wang, and Fangmin Zhang reviewed and polished the manuscript. All the authors contributed to the data analysis and paper-writing and shared equally in the editing of the manuscript.

Conflicts of Interest

The authors declare no conflict of interest.

Appendix

Appendix A. Description of iAMSPEC II

Figure A1. Schematic drawing of iAMSPEC II.
Remotesensing 07 15860 g010
Figure A2. Picture of outdoor part of iAMSPEC II on the tower.
Remotesensing 07 15860 g011

Appendix B. Two-Leaf Algorithm for LUE Calculation

This algorithm differentiates the transfers of diffuse and direct radiation within a canopy and separates leaves into sunlit and shaded portions. The total LAI can be separated into sunlit LAI (Lsun) and shaded LAI (Lsh). Sunlit leaves can absorb both direct and diffuse radiation, while shaded leaves can only absorb diffuse radiation. The APAR on per unit leaf area was calculated separately for sunlit (APARsun) and shaded leaves (APARsh) [21,59,60,61], and the total canopy APAR calculated using this algorithm was termed as TL_APAR:
TL_APAR = APARsun × Lsun + APARsh × Lsh
APAR on the per unit leaf area was calculated separately for sunlit (APARsun) and shaded leaves (APARsh), and sunlit LAI (Lsun) and shaded LAI (Lsh) were calculated as [21,59,60,61]:
Lsun = 2cos(1 − e−0.5Ω × LAI/cosθ)
Lsh = LAI − Lsun
APARsun = (1 − α) × (PARdir × cosβ/cosθ + APARsh)
APARsh = (1 − α) × (1 − δ) × ((PARdir − PARdif,u)/LAI + C)
C = 0.07Ω × PARdir × (1.1 − 0.1LAI)e−cosθ (A5)
PARdif,u = PARdif × e−0.5Ω × LAI/(0.537 + 0.025LAI)
δ = 0.2(1 − e−0.5Ω × LAI/(0.537 + 0.025LAI))
where α is the albedo related to vegetation types set as 0.15 for coniferous forest; PARdif and PARdir are the diffuse and direct components of incoming PAR, respectively, and they are calculated using equation A9; PARdif,u is the diffuse PAR under the canopy; (PARdif − PARdif,u)/LAI represents the diffuse PAR on per unit leaf area within the canopy; C quantifies the contribution of multiple scattering of the total PAR to the diffuse irradiance per unit leaf area within the canopy; β is the mean leaf-sun angle and is set as 60° for a canopy with spherical leaf angle distribution; δ is a correction for the nonlinear response of leaf photosynthesis to the vertical variation of diffuse radiation within the canopy; and θ is the solar zenith angle.
Diffuse and direct PAR were partitioned [21,59,60] with parameters calibrated using the daily clearness index (CI) and total incoming radiation as:
PARdif = PAR × (0.7702 + 3.6895CI − 15.4527CI2 + 16.9828CI3 − 5.7773CI4)
Half-hourly LUEc was calculated as:
LUEc = GPP/TL_APAR

Appendix C. Performance of LUEc Calculated Using Two-Leaf Algorithm

Considering the impact of varying irradiance and shadow fraction of canopy on temporal variation of LUE, we re-calculated canopy LUE (LUEc) on the basis of a two-leaf model, and Figure C1 showed the results. Figure C1A illustrated the difference between APAR calculated with FPAR and two-leaf APAR (TL_APAR) calculated using the two-leaf LUE model. APAR was totally higher than TL_APAR, which indicated that the FPAR algorithm might overestimate the part of absorbed PAR intercepted by non-photosynthetic parts of the canopy, especially when incident radiation was low (with more diffuse irradiance). The correlations between PRI and LUEc (Figure C1B and C1 Apr.–Sep.) were slightly stronger compared with the results shown before (Figure 5 and Figure 6). Even though the performance was still not good enough, this improvement revealed that the impact of the changing diffuse radiation fraction should not be neglected and the two-leaf approach could be an effective way to consider this issue.
Figure C1. (A) is the relationship between APAR calculated with FPAR and two-leaf APAR (TL_APAR) calculated using the two-leaf LUE model; Linear relationships between half-hourly mean PRI and LUE observed from 9 h to 16 h each day for the entire study period (B) and six months (Apr.–Sep.).
Remotesensing 07 15860 g012

References

  1. Kumar, M.; Monteith, J.L. Remote sensing of crop growth. In Plants and the Daylight Spectrum; Academic Press: London, UK, 1981; pp. 133–144. [Google Scholar]
  2. Monteith, J.L. Solar radiation and productivity in tropical ecosystems. J. Appl. Ecol. 1972, 9, 747–766. [Google Scholar] [CrossRef]
  3. Hilker, T.; Coops, N.C.; Hall, F.G.; Black, T.A.; Wulder, M.A.; Nesic, Z.; Krishnan, P. Separating physiologically and directionally induced changes in PRI using BRDF models. Remote Sens. Environ. 2008, 112, 2777–2788. [Google Scholar] [CrossRef]
  4. Monteith, J.L. Climate and the efficiency of crop production in Britain. R. Soc. Lond. Philos. Trans. Ser. B 1977, 281, 277–294. [Google Scholar] [CrossRef]
  5. Chen, J.M. Canopy architecture and remote sensing of the fraction of photosynthetically active radiation absorbed by boreal conifer forests. IEEE Trans. Geosci. Remote Sens. 1996, 34, 1353–1368. [Google Scholar] [CrossRef]
  6. Knyazikhin, Y.; Glassy, J.; Privette, J.L.; Tian, Y.; Lotsch, A.; Zhang, Y.; Wang, Y.; Morisette, J.T.; Votava, P.; Myneni, R.B. MODIS Leaf Area Index (LAI) and Fraction of Photosynthetically Active Radiation Absorbed by Vegetation (FPAR) Product (MOD15). Algorithm Theor. Basis Doc. 1999, 4, 1–14. [Google Scholar]
  7. Tian, Y.; Zhang, Y.; Knyazikhin, Y.; Myneni, R.B.; Glassy, J.M.; Dedieu, G.; Running, S.W. Prototyping of MODIS LAI and FPAR algorithm with Lasur and Landsat data. IEEE Trans. Geosci. Remote Sens. 2000, 38, 2387–2401. [Google Scholar] [CrossRef]
  8. Zhu, Z.; Pan, Y.; Ganguly, S.; Anav, A.; Xu, L.; Samanta, A.; Nemani, R.R.; Bi, J.; Piao, S.; Myneni, R.B. Global data sets of vegetation leaf area index (LAI)3g and fraction of photosynthetically active radiation (FPAR)3g derived from global inventory modeling and mapping studies (GIMMS) normalized difference vegetation index (NDVI3g) for the period 1981 to 2011. Remote Sens. 2013, 5, 927–948. [Google Scholar]
  9. Tan, K.P.; Kanniah, K.D.; Cracknell, A.P. A review of remote sensing based productivity models and their suitability for studying oil palm productivity in tropical regions. Prog. Phys. Geogr. 2012, 36, 655–679. [Google Scholar] [CrossRef]
  10. Hilker, T.; Coops, N.C.; Wulder, M.A.; Black, T.A.; Guy, R.D. The use of remote sensing in light use efficiency based models of gross primary production: A review of current status and future requirements. Sci. Total Environ. 2008, 404, 411–423. [Google Scholar] [CrossRef] [PubMed]
  11. Running, S.W.; Nemani, R.R.; Heinsch, F.A.; Zhao, M.; Reeves, M.; Hashimoto, H. A continuous satellite-derived measure of global terrestrial primary production. BioScience 2004, 54, 547–560. [Google Scholar] [CrossRef]
  12. Myneni, R.B.; Hall, F.G.; Sellers, P.J.; Marshak, A.L. The interpretation of spectral vegetation indexes. IEEE Trans. Geosci. Remote Sens. 1995, 33, 481–486. [Google Scholar] [CrossRef]
  13. Prince, S.D.; Goward, S.N. Global primary production: A remote sensing approach. J. Biogeogr. 1995, 22, 815–835. [Google Scholar] [CrossRef]
  14. Turner, D.P.; Ritts, W.D.; Cohen, W.B.; Gower, S.T.; Zhao, M.; Running, S.W.; Wofsy, S.C.; Urbanski, S.; Dunn, A.L.; Munger, J. Scaling gross primary production (GPP) over boreal and deciduous forest landscapes in support of MODIS GPP product validation. Remote Sens. Environ. 2003, 88, 256–270. [Google Scholar] [CrossRef]
  15. Heinsch, F.A.; Zhao, M.; Running, S.W.; Kimball, J.S.; Nemani, R.R.; Davis, K.J.; Bolstad, P.V.; Cook, B.D.; Desai, A.R.; Ricciuto, D.M. Evaluation of remote sensing based terrestrial productivity from MODIS using regional tower eddy flux network observations. IEEE Trans. Geosci. Remote Sens. 2006, 44, 1908–1925. [Google Scholar] [CrossRef]
  16. Zhao, M.; Running, S.W.; Nemani, R.R. Sensitivity of moderate resolution imaging spectroradiometer (MODIS) terrestrial primary production to the accuracy of meteorological reanalyses. J. Geophys. Res. Biogeosci. 2006, 111. [Google Scholar] [CrossRef]
  17. Potter, C.S.; Randerson, J.T.; Field, C.B.; Matson, P.A.; Vitousek, P.M.; Mooney, H.A.; Klooster, S.A. Terrestrial ecosystem production: A process model based on global satellite and surface data. Glob. Biogeochem. Cycles 1993, 7, 811–841. [Google Scholar] [CrossRef]
  18. Xiao, X.; Zhang, Q.; Braswell, B.; Urbanski, S.; Boles, S.; Wofsy, S.; Moore, B.; Ojima, D. Modeling gross primary production of temperate deciduous broadleaf forest using satellite images and climate data. Remote Sens. Environ. 2004, 91, 256–270. [Google Scholar] [CrossRef]
  19. Goetz, S.J.; Prince, S.D. Modelling terrestrial carbon exchange and storage: Evidence and implications of functional convergence in light-use efficiency. Adv. Ecol. Res. 1999, 28, 57–92. [Google Scholar]
  20. Lagergren, F.; Eklundh, L.; Grelle, A.; Lundblad, M.; Mölder, M.; Lankreijer, H.; Lindroth, A. Net primary production and light use efficiency in a mixed coniferous forest in Sweden. Plant Cell Environ. 2005, 28, 412–423. [Google Scholar] [CrossRef]
  21. He, M.; Ju, W.; Zhou, Y.; Chen, J.; He, H.; Wang, S.; Wang, H.; Guan, D.; Yan, J.; Li, Y. Development of a two-leaf light use efficiency model for improving the calculation of terrestrial gross primary productivity. Agric. For. Meteorol. 2013, 173, 28–39. [Google Scholar] [CrossRef]
  22. Oliphant, A.J.; Goni, D.; Deng, B.; Grimmond, C.S.B.; Schmid, H.P.; Scott, S.L. The role of sky conditions on gross primary production in a mixed deciduous forest. Agric. For. Meteorol. 2011, 151, 781–791. [Google Scholar] [CrossRef]
  23. Zhang, M.; Yu, G.R.; Zhuang, J.; Gentry, R.; Fu, Y.L.; Sun, X.M.; Zhang, L.M.; Wen, X.F.; Wang, Q.F.; Han, S.J. Effects of cloudiness change on net ecosystem exchange, light use efficiency, and water use efficiency in typical ecosystems of China. Agric. For. Meteorol. 2011, 151, 803–816. [Google Scholar] [CrossRef]
  24. Drolet, G.G.; Huemmrich, K.F.; Hall, F.G.; Middleton, E.M.; Black, T.A.; Barr, A.G.; Margolis, H.A. A MODIS-derived photochemical reflectance index to detect inter-annual variations in the photosynthetic light-use efficiency of a boreal deciduous forest. Remote Sens. Environ. 2005, 98, 212–224. [Google Scholar] [CrossRef]
  25. Drolet, G.G.; Middleton, E.M.; Huemmrich, K.F.; Hall, F.G.; Amiro, B.D.; Barr, A.G.; Black, T.A.; McCaughey, J.H.; Margolis, H.A. Regional mapping of gross light-use efficiency using MODIS spectral indices. Remote Sens. Environ. 2008, 112, 3064–3078. [Google Scholar] [CrossRef]
  26. Hall, F.G.; Hilker, T.; Coops, N.C.; Lyapustin, A.; Huemmrich, K.F.; Middleton, E.; Margolis, H.; Drolet, G.; Black, T.A. Multi-angle remote sensing of forest light use efficiency by observing PRI variation with canopy shadow fraction. Remote Sens. Environ. 2008, 112, 3201–3211. [Google Scholar] [CrossRef]
  27. Gamon, J.A.; Bond, B. Effects of irradiance and photosynthetic downregulation on the photochemical reflectance index in douglas-fir and ponderosa pine. Remote Sens. Environ. 2013, 135, 141–149. [Google Scholar] [CrossRef]
  28. Garbulsky, M.F.; Peñuelas, J.; Ogaya, R.; Filella, I. Leaf and stand-level carbon uptake of a Mediterranean forest estimated using the satellite-derived reflectance indices EVI and PRI. Int. J. Remote Sens. 2013, 34, 1282–1296. [Google Scholar] [CrossRef]
  29. Rossini, M.; Fava, F.; Cogliati, S.; Meroni, M.; Marchesi, A.; Panigada, C.; Giardino, C.; Busetto, L.; Migliavacca, M.; Amaducci, S. Assessing canopy PRI from airborne imagery to map water stress in maize. ISPRS J. Photogramm. Remote Sens. 2013, 86, 168–177. [Google Scholar] [CrossRef]
  30. Nakaji, T.; Kosugi, Y.; Takanashi, S.; Niiyama, K.; Noguchi, S.; Tani, M.; Oguma, H.; Nik, A.R.; Kassim, A.R. Estimation of light-use efficiency through a combinational use of the photochemical reflectance index and vapor pressure deficit in an evergreen tropical rainforest at Pasoh, Peninsular Malaysia. Remote Sens. Environ. 2014, 150, 82–92. [Google Scholar] [CrossRef]
  31. Stagakis, S.; Markos, N.; Sykioti, O.; Kyparissis, A. Tracking seasonal changes of leaf and canopy light use efficiency in a Phlomis fruticosa Mediterranean ecosystem using field measurements and multi-angular satellite hyperspectral imagery. ISPRS J. Photogramm. Remote Sens. 2014, 97, 138–151. [Google Scholar] [CrossRef]
  32. Soudani, K.; Hmimina, G.; Dufrêne, E.; Berveiller, D.; Delpierre, N.; Ourcival, J.-M.; Rambal, S.; Joffre, R. Relationships between photochemical reflectance index and light-use efficiency in deciduous and evergreen broadleaf forests. Remote Sens. Environ. 2014, 144, 73–84. [Google Scholar] [CrossRef]
  33. Gamon, J.A.; Penuelas, J.; Field, C. A narrow-waveband spectral index that tracks diurnal changes in photosynthetic efficiency. Remote Sens. Environ. 1992, 41, 35–44. [Google Scholar] [CrossRef]
  34. Gamon, J.A.; Surfus, J. Assessing leaf pigment content and activity with a reflectometer. New Phytol. 1999, 143, 105–117. [Google Scholar] [CrossRef]
  35. Peñuelas, J.; Filella, I.; Gamon, J.A. Assessment of photosynthetic radiation-use efficiency with spectral reflectance. New Phytol. 1995, 131, 291–296. [Google Scholar] [CrossRef]
  36. Peñuelas, J.; Garbulsky, M.F.; Filella, I. Photochemical reflectance index (PRI) and remote sensing of plant CO2 uptake. New Phytol. 2011, 191, 596–599. [Google Scholar] [CrossRef] [PubMed]
  37. Demmig-Adams, B.; Adams, W.W. The role of xanthophyll cycle carotenoids in the protection of photosynthesis. Trends Plant Sci. 1996, 1, 21–26. [Google Scholar] [CrossRef]
  38. Barton, C.V.M.; North, P.R.J. Remote sensing of canopy light use efficiency using the photochemical reflectance index model and sensitivity analysis. Remote Sens. Environ. 2001, 78, 264–273. [Google Scholar] [CrossRef]
  39. Hall, F.G.; Hilker, T.; Coops, N.C. Photosynsat, photosynthesis from space: Theoretical foundations of a satellite concept and validation from tower and spaceborne data. Remote Sens. Environ. 2011, 115, 1918–1925. [Google Scholar] [CrossRef]
  40. Hilker, T.; Leeuwen, M.; Coops, N.C.; Wulder, M.A.; Newnham, G.J.; Jupp, D.L.B.; Culvenor, D.S. Comparing canopy metrics derived from terrestrial and airborne laser scanning in a douglas-fir dominated forest stand. Trees 2010, 24, 819–832. [Google Scholar] [CrossRef]
  41. Hilker, T.; Coops, N.C.; Schwalm, C.R. Effects of mutual shading of tree crowns on prediction of photosynthetic light-use efficiency in a coastal douglas fir forest. Tree Physiol. 2008, 28, 825–834. [Google Scholar] [CrossRef] [PubMed]
  42. Mõttus, M.; Takala, T.L.; Stenberg, P.; Knyazikhin, Y.; Yang, B.; Nilson, T. Diffuse sky radiation influences the relationship between canopy PRI and shadow fraction. ISPRS J. Photogramm. Remote Sens. 2015, 105, 54–60. [Google Scholar] [CrossRef]
  43. Damm, A.; Guanter, L.; Verhoef, W.; Schläpfer, D.; Garbari, S.; Schaepman, M. Impact of varying irradiance on vegetation indices and chlorophyll fluorescence derived from spectroscopy data. Remote Sens. Environ. 2015, 156, 202–215. [Google Scholar] [CrossRef]
  44. Garbulsky, M.F.; Peñuelas, J.; Gamon, J.; Inoue, Y.; Filella, I. The photochemical reflectance index (PRI) and the remote sensing of leaf, canopy and ecosystem radiation use efficienciesa review and meta-analysis. Remote Sens. Environ. 2011, 115, 281–297. [Google Scholar] [CrossRef]
  45. Filella, I.; Penuelas, J.; Llorens, L.; Estiarte, M. Reflectance assessment of seasonal and annual changes in biomass and CO2 uptake of a Mediterranean shrubland submitted to experimental warming and drought. Remote Sens. Environ. 2004, 90, 308–318. [Google Scholar] [CrossRef]
  46. Filella, I.; Porcar-Castell, A.; Munné-Bosch, S.; Bäck, J.; Garbulsky, M.; Peñuelas, J. PRI assessment of long-term changes in carotenoids/chlorophyll ratio and short-term changes in de-epoxidation state of the xanthophyll cycle. Int. J. Remote Sens. 2009, 30, 4443–4455. [Google Scholar] [CrossRef]
  47. Stylinski, C.; Gamon, J.; Oechel, W. Seasonal patterns of reflectance indices, carotenoid pigments and photosynthesis of evergreen chaparral species. Oecologia 2002, 131, 366–374. [Google Scholar]
  48. Yu, G.; Chen, Z.; Piao, S.; Peng, C.; Ciais, P.; Wang, Q.; Li, X.; Zhu, X. High carbon dioxide uptake by subtropical forest ecosystems in the East Asian monsoon region. Proc. Natl. Acad. Sci. USA 2014, 111, 4910–4915. [Google Scholar] [CrossRef] [PubMed]
  49. Wen, X.; Yu, G.; Sun, X.; Liu, Y. Turbulence flux measurement above the overstory of a subtropical pinus plantation over the hilly region in southeastern China. Sci. China Ser. D Earth Sci. 2005, 48, 63–73. [Google Scholar]
  50. Wen, X.; Yu, G.-R.; Sun, X.-M.; Li, Q.-K.; Liu, Y.-F.; Zhang, L.-M.; Ren, C.-Y.; Fu, Y.-L.; Li, Z.-Q. Soil moisture effect on the temperature dependence of ecosystem respiration in a subtropical pinus plantation of southeastern China. Agric. For. Meteorol. 2006, 137, 166–175. [Google Scholar] [CrossRef]
  51. Chen, B.; Ge, Q.; Fu, D.; Yu, G.; Sun, X.; Wang, S.; Wang, H. A data-model fusion approach for upscaling gross ecosystem productivity to the landscape scale based on remote sensing and flux footprint modelling. Biogeosciences 2010, 7, 2943–2958. [Google Scholar] [CrossRef]
  52. Fleisher, D.H.; Timlin, D.J.; Reddy, V.R. Temperature influence on potato leaf and branch distribution and on canopy photosynthetic rate. Agron. J. 2006, 98, 1442–1452. [Google Scholar] [CrossRef]
  53. Nichol, C.J.; Huemmrich, K.F.; Black, T.A.; Jarvis, P.G.; Walthall, C.L.; Grace, J.; Hall, F.G. Remote sensing of photosynthetic-light-use efficiency of boreal forest. Agric. For. Meteorol. 2000, 101, 131–142. [Google Scholar] [CrossRef]
  54. Nichol, C.J.; Lloyd, J.; Shibistova, O.; Arneth, A.; Röser, C.; Knohl, A.; Matsubara, S.; Grace, J. Remote sensing of photosynthetic light use efficiency of a Siberian boreal forest. Tellus B 2002, 54, 677–687. [Google Scholar] [CrossRef]
  55. Coops, N.C.; Hilker, T.; Hall, F.G.; Nichol, C.J.; Drolet, G.G. Estimation of light-use efficiency of terrestrial ecosystems from space: A status report. BioScience 2010, 60, 788–797. [Google Scholar] [CrossRef]
  56. Gitelson, A.A.; Gamon, J.A. The need for a common basis for defining light-use efficiency: Implications for productivity estimation. Remote Sens. Environ. 2015, 156, 196–201. [Google Scholar] [CrossRef]
  57. Chen, J.M. Evaluation of vegetation indices and a modified simple ratio for boreal applications. Can. J. Remote Sens. 1996, 22, 229–242. [Google Scholar] [CrossRef]
  58. Chen, J.M.; Liu, J.; Leblanc, S.G.; Lacaze, R.; Roujean, J.-L. Multi-angular optical remote sensing for assessing vegetation structure and carbon absorption. Remote Sens. Environ. 2003, 84, 516–525. [Google Scholar] [CrossRef]
  59. Chen, J.M.; Mo, G.; Pisek, J.; Liu, J.; Deng, F.; Ishizawa, M.; Chan, D. Effects of foliage clumping on the estimation of global terrestrial gross primary productivity. Glob. Biogeochem. Cycles 2012, 26, 626–640. [Google Scholar] [CrossRef]
  60. Chen, J.M.; Liu, J.; Cihlar, J.; Goulden, M.L. Daily canopy photosynthesis model through temporal and spatial scaling for remote sensing applications. Ecol. Modell. 1999, 124, 99–119. [Google Scholar] [CrossRef]
  61. Wu, X.; Ju, W.; Zhou, Y.; He, M.; Law, B.E.; Black, T.A.; Margolis, H.A.; Cescatti, A.; Gu, L.; Montagnani, L. Performance of linear and nonlinear two-leaf light use efficiency models at different temporal scales. Remote Sens. 2015, 7, 2238–2278. [Google Scholar] [CrossRef] [Green Version]
  62. Kumar, R.; Umanand, L. Estimation of global radiation using clearness index model for sizing photovoltaic system. Renew. Energy 2005, 30, 2221–2233. [Google Scholar] [CrossRef]
  63. Hilker, T.; Nesic, Z.; Coops, N.C.; Lessard, D. A new, automated, multiangular radiometer instrument for tower-based observations of canopy reflectance (AMSPEC II). Instrum. Sci. Technol. 2010, 38, 319–340. [Google Scholar] [CrossRef]
  64. Sun, X.-M.; Wen, X.-F.; Yu, G.-R. Seasonal drought effects on carbon sequestration of a mid-subtropical planted forest of southeastern China. Sci. China Ser. D Earth Sci. 2006, 49, 110–118. [Google Scholar] [CrossRef]
  65. Liu, Y.-F.; Yu, G.-R.; Wen, X.-F. Seasonal dynamics of CO2 fluxes from subtropical plantation coniferous ecosystem. Sci. China Ser. D Earth Sci. 2006, 49, 99–109. [Google Scholar] [CrossRef]
  66. Wong, C.Y.; Gamon, J.A. The photochemical reflectance index provides an optical indicator of spring photosynthetic activation in evergreen conifers. New Phytol. 2015, 206, 196–208. [Google Scholar] [CrossRef] [PubMed]
  67. Demmig-Adams, B.; Adams, W.W., III; Winter, K.; Meyer, A.; Schreiber, U.; Pereira, J.S.; Krüger, A.; Czygan, F.-C.; Lange, O.L. Photochemical efficiency of photosystem II, photon yield of O2 evolution, photosynthetic capacity, and carotenoid composition during the midday depression of net CO2 uptake in arbutus unedo growing in portugal. Planta 1989, 177, 377–387. [Google Scholar] [CrossRef] [PubMed]
  68. Gamon, J.A.; Field, C.B.; Fredeen, A.L.; Thayer, S. Assessing photosynthetic downregulation in sunflower stands with an optically-based model. Photosynth. Res. 2001, 67, 113–125. [Google Scholar] [CrossRef] [PubMed]
  69. Hilker, T.; Gitelson, A.; Coops, N.C.; Hall, F.G.; Black, T.A. Tracking plant physiological properties from multi-angular tower-based remote sensing. Oecologia 2011, 165, 865–876. [Google Scholar] [CrossRef] [PubMed]
  70. Hilker, T.; Hall, F.G.; Tucker, C.J.; Coops, N.C.; Black, T.A.; Nichol, C.J.; Sellers, P.J.; Barr, A.; Hollinger, D.Y.; Munger, J.W. Data assimilation of photosynthetic light-use efficiency using multi-angular satellite data: II model implementation and validation. Remote Sens. Environ. 2012, 121, 287–300. [Google Scholar] [CrossRef]
  71. Sims, D.A.; Luo, H.; Hastings, S.; Oechel, W.; Rahman, A.; Gamon, J. Parallel adjustments in vegetation greenness and ecosystem CO2 exchange in response to drought in a southern california chaparral ecosystem. Remote Sens. Environ. 2006, 103, 289–303. [Google Scholar] [CrossRef]
  72. Cheng, Y.-B.; Middleton, E.M.; Zhang, Q.; Corp, L.A.; Dandois, J.; Kustas, W.P. The photochemical reflectance index from directional cornfield reflectances: Observations and simulations. Remote Sens. Environ. 2012, 124, 444–453. [Google Scholar] [CrossRef]
  73. Coops, N.C.; Hilker, T.; Wulder, M.A.; St-Onge, B.; Newnham, G.; Siggins, A.; Trofymow, J.A. Estimating canopy structure of douglas-fir forest stands from discrete-return LiDAR. Trees 2007, 21, 295–310. [Google Scholar] [CrossRef]
  74. Pisek, J.; Lang, M.; Kuusk, J. A note on suitable viewing configuration for retrieval of forest understory reflectance from multi-angle remote sensing data. Remote Sens. Environ. 2015, 156, 242–246. [Google Scholar] [CrossRef]
  75. Urban, O.; Klem, K.; Ac, A.; Havrankova, K.; Holisova, P.; Navratil, M.; Zitova, M.; Kozlova, K.; Pokorny, R.; Sprtova, M.; et al. Impact of clear and cloudy sky conditions on the vertical distribution of photosynthetic CO2 uptake within a spruce canopy. Funct. Ecol. 2012, 26, 46–55. [Google Scholar] [CrossRef]
  76. Cheng, S.J.; Bohrer, G.; Steiner, A.L.; Hollinger, D.Y.; Suyker, A.; Phillips, R.P.; Nadelhoffer, K.J. Variations in the influence of diffuse light on gross primary productivity in temperate ecosystems. Agric. For. Meteorol. 2015, 201, 98–110. [Google Scholar] [CrossRef]
  77. Wong, C.Y.; Gamon, J.A. Three causes of variation in the photochemical reflectance index (PRI) in evergreen conifers. New Phytol. 2015, 206, 187–195. [Google Scholar] [CrossRef] [PubMed]
  78. Rahman, A.F.; Gamon, J.A.; Fuentes, D.A.; Roberts, D.A.; Prentiss, D. Modeling spatially distributed ecosystem flux of boreal forest using hyperspectral indices from AVIRIS imagery. J. Geophys. Res. Atmos. 2001, 106, 33579–33591. [Google Scholar] [CrossRef]
  79. Cheng, Y.-B.; Middleton, E.M.; Hilker, T.; Coops, N.C.; Black, T.A.; Krishnan, P. Dynamics of spectral bio-indicators and their correlations with light use efficiency using directional observations at a douglas-fir forest. Meas. Sci. Technol. 2009, 20, 095107. [Google Scholar] [CrossRef]
  80. Sims, D.A.; Gamon, J.A. Relationships between leaf pigment content and spectral reflectance across a wide range of species, leaf structures and developmental stages. Remote Sens. Environ. 2002, 81, 337–354. [Google Scholar] [CrossRef]
  81. Hernández-Clemente, R.; Navarro-Cerrillo, R.M.; Suárez, L.; Morales, F.; Zarco-Tejada, P.J. Assessing structural effects on PRI for stress detection in conifer forests. Remote Sens. Environ. 2011, 115, 2360–2375. [Google Scholar] [CrossRef]
  82. Nakaji, T.; Ide, R.; Oguma, H.; Saigusa, N.; Fujinuma, Y. Utility of spectral vegetation index for estimation of gross CO2 flux under varied sky conditions. Remote Sens. Environ. 2007, 109, 274–284. [Google Scholar] [CrossRef]
  83. Nakaji, T.; Ide, R.; Takagi, K.; Kosugi, Y.; Ohkubo, S.; Nasahara, K.N.; Saigusa, N.; Oguma, H. Utility of spectral vegetation indices for estimation of light conversion efficiency in coniferous forests in Japan. Agric. For. Meteorol. 2008, 148, 776–787. [Google Scholar] [CrossRef]
  84. Ide, R.; Nakaji, T.; Oguma, H. Assessment of canopy photosynthetic capacity and estimation of GPP by using spectral vegetation indices and the light-response function in a larch forest. Agric. For. Meteorol. 2010, 150, 389–398. [Google Scholar] [CrossRef]
  85. Hilker, T.; Coops, N.C.; Hall, F.G.; Nichol, C.J.; Lyapustin, A.; Black, T.A.; Wulder, M.A.; Leuning, R.; Barr, A.; Hollinger, D.Y. Inferring terrestrial photosynthetic light use efficiency of temperate ecosystems from space. J. Geophys. Res. 2011, 116, 218–223. [Google Scholar] [CrossRef]
  86. Ustin, S.L.; Gitelson, A.A.; Jacquemoud, S.; Schaepman, M.; Asner, G.P.; Gamon, J.A.; Zarco-Tejada, P. Retrieval of foliar information about plant pigment systems from high resolution spectroscopy. Remote Sens. Environ. 2009, 113, S67–S77. [Google Scholar] [CrossRef] [Green Version]
  87. Goetz, S.J.; Nichol, C.; Disney, M.; Lewis, P.; Quaife, T.; Bowyer, P. Can we measure terrestrial photosynthesis from space directly, using spectral reflectance and fluorescence? Glob. Change Biol. 2007, 13, 1484–1497. [Google Scholar]
  88. Goerner, A.; Reichstein, M.; Rambal, S. Tracking seasonal drought effects on ecosystem light use efficiency with satellite-based PRI in a Mediterranean forest. Remote Sens. Environ. 2009, 113, 1101–1111. [Google Scholar] [CrossRef]
  89. Moreno, A.; Maselli, F.; Gilabert, M.A.; Chiesi, M.; Martínez, B.; Seufert, G. Assessment of MODIS imagery to track light-use efficiency in a water-limited Mediterranean pine forest. Remote Sens. Environ. 2012, 123, 359–367. [Google Scholar] [CrossRef]
  90. Suárez, L.; Zarco-Tejada, P.J.; Sepulcre-Cantó, G.; Pérez-Priego, O.; Miller, J.R.; Jiménez-Muñoz, J.C.; Sobrino, J. Assessing canopy PRI for water stress detection with diurnal airborne imagery. Remote Sens. Environ. 2008, 112, 560–575. [Google Scholar] [CrossRef]
  91. Serrano, L.; Peñuelas, J. Assessing forest structure and function from spectral transmittance measurements: A case study in a Mediterranean holm oak forest. Tree Physiol. 2005, 25, 67–74. [Google Scholar] [CrossRef] [PubMed]
  92. Weng, J.-H.; Lai, K.-M.; Liao, T.-S.; Hwang, M.-Y.; Chen, Y.-N. Relationships of photosynthetic capacity to psii efficiency and to photochemical reflectance index of Pinus taiwanensis through different seasons at high and low elevations of sub-tropical Taiwan. Trees 2008, 23, 347–356. [Google Scholar] [CrossRef]
  93. Peguero-Pina, J.J.; Morales, F.; Flexas, J.; Gil-Pelegrin, E.; Moya, I. Photochemistry, remotely sensed physiological reflectance index and de-epoxidation state of the xanthophyll cycle in Quercus coccifera under intense drought. Oecologia 2008, 156, 1–11. [Google Scholar] [CrossRef] [PubMed]
  94. Suárez, L.; Zarco-Tejada, P.J.; González-Dugo, V.; Berni, J.A.J.; Sagardoy, R.; Morales, F.; Fereres, E. Detecting water stress effects on fruit quality in orchards with time-series PRI airborne imagery. Remote Sens. Environ. 2010, 114, 286–298. [Google Scholar] [CrossRef]
  95. Zarco-Tejada, P.J.; González-Dugo, V.; Williams, L.; Suárez, L.; Berni, J.A.; Goldhamer, D.; Fereres, E. A PRI-based water stress index combining structural and chlorophyll effects: Assessment using diurnal narrow-band airborne imagery and the CWSI thermal index. Remote Sens. Environ. 2013, 138, 38–50. [Google Scholar] [CrossRef]

