1. Introduction
The ability to remotely detect and map chemical vapours in open air environments is a topic of significant interest to both defence and civilian communities. Increasing the capability of military personnel by remotely identifying situations whereupon protective equipment may be donned or alternate routes found is one relevant application. Likewise, this type of technology would also benefit emergency first responders or other civilian agencies for qualification of industrial exhaust emissions and air quality assessments prior to involvement in events or as part of rehabilitation.
Currently, standoff chemical detection for environmental, industrial and emergency response applications are attempted using technologies, such as multispectral imaging [
1,
2] or laser based systems, such as LIDAR [
3,
4] or laser absorption [
5]. Challenges with methodologies such as these relate to optical aberrations from the background environment. Atmospheric water, temperature gradients, and interferants, such as smoke or pollution, all impinge on the ability of optical methods to correctly identify chemicals, and their ability to measure low concentrations reliably. These methods are also generally expensive, have limited range, or may require mounting on expensive aircraft platforms.
An attractive solution for remote detection and mapping of chemical vapour clouds is the use of a micro unmanned aerial vehicle (UAV). Whilst no universally-agreed standard exists to describe UAV dimensions, micro-UAV have come to be described as those with a sub 5 kg mass and range of less than 10 km [
6]. Micro-UAV systems are considered to be low-risk to personnel, property, and other airspace users, and minimise the overheads to the operators in terms of logistics and airworthiness management. The UAV described in this paper falls into this category. When fitted with either real-time sensing functionality or passive dosimeters which may be exploited post-flight, this type of relatively low-cost system offers an intriguing alternative to fixed position detection systems and brings the possibility for retrieval of samples from the cloud. By providing a measurement capability that has direct physical access to the chemical vapour, the system should be capable of improved determination of chemical species with low false alarm rates and, if correctly calibrated, direct measurement of concentration.
Chemical sensing of a vapour cloud through direct access, aided by the use of unmanned aerial systems, has been accomplished to varying degrees across a range of applications with a detailed summary specifically focussing on the progress made in environmental science applications provided in [
7]. McGonigle
et al. [
8] provided an early demonstration using a small remotely piloted helicopter flying into gas plumes from an active volcano to measure the chemical concentrations of CO
2 and SO
2 as a part of geophysical research. Their study provides a description of the trade-offs made in air vehicles between fixed and rotary wing designs for the application. Their decision to select the rotary wing configuration was primarily taken due to the aim to hover within the plume generated from a fixed and known source location, coming at the expense of endurance and range when compared to fixed wing alternatives.
Further environmental science development has been reported under the description Gas Distribution Mapping (GDM) and Gas Source Localisation (GSL) in [
9,
10,
11,
12]. Neumann
et al. [
9,
10] demonstrated the first rotary wing micro-UAV-based GDM and GSL. These studies were conducted in relatively small (tens of square metres) outdoor environments using an autopilot-controlled air vehicle. Challenges in system performance were reported due to the effect of the drone rotors on the gas distribution during the long loiter time (20 s) required for the response time of the metal oxide (MOX)-based sensor to stabilise and the trade-off of aerial system endurance with search volume. Alternate system architectures are shown in [
11,
12], each of which present design details of separate rotary wing micro-UAV for gas detection however neither has included field test experimentation results for their systems. Of note within the domain, Hernandez
et al. [
13] specifically identifies the challenges created within the complexities of real-world gas dispersal in the open environment as opposed to the simplistic gas distribution models used in simulation and highly controlled indoor environment testing.
Malaver
et al. illustrates the efforts in greenhouse gas monitoring through the use of a fixed wing, solar-powered UAV system with an integrated MOX sensor to measure CO
2 and CH
4 [
14]. The study documents lab and field testing of an integrated electric-powered platform implementation but the aerial field test results were unable to demonstrate a sensor detection response to a controlled contaminant release.
Unmanned aerial chemical detection systems, to date, have predominantly used metal oxide (MOX)-based sensor technologies based on availability and size [
13]. The sensors also have properties that result in high power demands as well as slow response and recovery times. Based on this limitation, a range of adaptive search strategies were proposed to minimise the flight time required for GDM and GSL. At a system level, these strategies have an implicit assumption that the aircraft starts within or very nearby to the gas field or is cued to it, else the small movement step sizes will result in very small areas being searched within the flight endurance of the system. Any requirement to start very near the source will significantly limit stand-off distances of the UAV operator, creating risks to personnel in the event of dangerous chemical plumes. The study additionally discusses and demonstrates bio-mimetic schemes of plume tracking behaviour observed flying insects on a rotary wing vehicle, but goes on to suggest that the combination of MOX based sensors and rotary wing aerial platform currently being employed and the strategies needed to achieve reliable measurement are incompatible with the sensitivity modes and flight characteristics of the biological analogy. Faster sensors and more manoeuvrable aircraft are required to successfully use the reactive steering strategies.
Within the industrial and dangerous chemical sensing field, a report on a system design of an aerial chemical detection and mapping capability based on the AeroVironment Raven fixed wing UAV platform [
15]. While some algorithm and simulation results are provided, no description of the sensor or field experimentation assessment has been provided.
Development and successful field test of “low-cost” expendable rotary wing micro-UAVs to aid in the early warning for dangerous chemical detection in military applications is reported in [
16]. Limited data is presented on the micro-UAV carrying two types of loosely-integrated sensor payloads into controlled-release chemical plumes in an open field environment. Successful detection events using a colorimetric sensor are reported, however noted limitations of the system include low levels of system integration requiring position and sensor concentration measurement post-processing, as well as concentration values being sampled at rate of 15 s intervals, which is in line with those used for MOX sensors. No description of experimental process was provided for the field test, nor the performance characteristics of the sensor.
Johnson
et al. [
17] presents a proof of concept pairing of a colour reflectance chemical vapour detection sensor with two types of micro-UAV. In their work, a controlled conditions indoor test of the sensor performance when mounted to micro rotary and fixed wing platform implementations was demonstrated, but this did not progress to a real-time system level assessment in a representative outdoor environment. The authors noted significant challenges with successful chemical detection for the fixed wing aircraft based on the required air flow rates and sensor integration time.
In this paper we introduce a fast reacting, highly-sensitive, colorimetric-based, chemical detection system applied in the aerial domain through in depth aerodynamic and electrical integration with a low-cost, developmental, fixed wing micro-UAV for use in the detection of chemical plumes in an open environment at realistic standoff range requirements for dangerous substances. The system ,as reported here, is shown to be suitable for extension into the GDM and GSL operations, and includes improved detection response time characteristics when compared to previously-published aerial detectors. Further, the higher speed sensor which enables dynamic flight manoeuvres may better suit the adoption of biological approaches to GSL, as noted earlier. We present details of the outdoor experimental design and results of the fixed wing micro-UAV chemical detection capability for a representative methyl salicylate (MeS) controlled-release plume. The use of MeS as a model plume yields a low toxicity, low environmental impact vapour cloud suitable for initial experimentation while minimising the risk to personnel or the environment. Whilst designed for MeS, the sensor can be readily adapted to a very wide range of other chemical vapours by virtue of alternate colour chemistry.
2. Experimental Section
In order to demonstrate and assess real-time chemical vapour sensing on an autonomous micro-UAV fixed wing platform, supporting apparatus has been developed. The apparatus section of this paper describes the aircraft, sensor technology, and integration approach, as well as briefly describing the test site. The experimental methodology used to demonstrate performance of the chemical vapour detection micro-UAV is described in the experimental method section.
2.1. Apparatus
Desirable selection criteria suitable for a micro-UAV for chemical detection application are (i) low cost; (ii) low mass; and (iii) the ability to be cleaned of chemical residue following tests. All of these properties facilitate a disposable system in the event of catastrophic failure or the inability to successfully decontaminate following chemical exposure. A Zeta Science Phantom [
18] FX-61 and a Zeta Science Wing Wing [
19] Z-84 fixed wing airframe were both chosen as appropriate for the apparatus as they met the selection criteria and, hence, were configured for, and flown in, the experiments documented in this paper. These airframes are electrically-powered flying wing constructions that provided a near seamless expanded polyolefin foam construction, well-suited to decontamination after exposure. The flying wing configuration has no defined fuselage, but has an internal cavity within the aerofoil suited to the carriage of batteries, avionics, and sensor payload. Both aircraft as configured were capable of the flight endurance required for the experiment while carrying the chemical vapour detector payload (described later). The specifications of the two aircraft as configured for flight in the study are shown in
Table 1.
Table 1.
Test aircraft specifications.
Table 1.
Test aircraft specifications.
| Airframe | Mass | Wingspan | Endurance | Autopilot |
|---|
| (g) | (mm) | (min) |
|---|
| Wing Wing Z-84 | 335 | 845 | 25 | Hobby King HK MegaMini (Miniaturised Ardupilot 2.7 compatible) |
| Phantom FX-61 | 1415 | 1550 | 50 | 3d Robotics Ardupilot 2.7 |
2.2. Autonomy
The selected air-vehicles were fitted with an open-source autopilot [
20] that was re-programmed to interface with the chemical vapour sensor. As configured, the micro-UAV had the ability to perform an autonomous mission including hand-launch, GPS way-pointing throughout the flight, and skid landing recovery. For the purpose of the chemical vapour detection, the aircraft was able to fly low-altitude trajectories under the control of the GPS way-pointing system. Under the test conditions used, navigation at an altitude above ground level of approximately 10 m was both safe and readily achievable.
2.3. Vapour Detection
Defence Science and Technology Group (DST Group) has developed a sensor that detects trace quantities (low parts per billion in air) of methyl salicylate (MeS) [
21] which is briefly described here. Also known as oil of wintergreen, MeS is the active ingredient in topical sports rubs and is widely used in applications, such as chewing gum and other food stuffs. MeS is also internationally recognised as the chemical of choice for safe assessment of vapour permeation through chemical protective suits and fabrics [
22] whereupon it accurately matches the permeation characteristics of the CWA sulfur mustard with none of the inherent toxicity. A slight variation on the sensor described in [
23], the MeS vapour sensor employed in this study functions as a miniaturised single-channel optical colorimetric spectrometer, utilising a calibrated, wavelength-tuned light emitting diode (LED) to illuminate twin slot mounted reactive chemical substrates. The developments from [
23] have increased the laboratory sensitivity by an order of magnitude, to very low ppb.
The twin substrates, which consist of commercially available specialised glass-backed silica thin layer chromatography plates impregnated with Iron (III) nitrate, are commercial items modified to suit by the authors. When exposed to MeS, the substrates change colour from yellow to purple resulting in a reduction in reflected light at 540 nm. Output is realised through a TAOS light-to-voltage converter where a MeS exposure event causes a voltage reduction within the 0–5 V range of the device, commensurate to the reduced light levels. The reaction on the surface of the substrates is fast, reversible, and directly proportional to the challenge concentration present. As such, changes in MeS concentrations may be followed in real-time. A level of hysteresis is apparent upon prolonged exposure to very high concentrations of MeS vapour and, thus, reactive substrates are replaced after each experiment in the interests of repeatability.
High-precision optical detection technologies are prone to changes in baseline output due to ambient light, temperature, and humidity fluctuations. Such environmental effects have been mitigated through the use of a reflectance independent internalised feedback loop to control temperature fluctuations and surface treatment of optical components to eliminate fogging. Temperature related optical effects have been nulled by virtue of a secondary light to voltage converter specifically placed to measure output from the illuminating LED. Minute variations in the optical output are controlled on a millisecond scale by varying the current to the LED. Modification of the surface characteristics of the optical components using plasma discharge has greatly reduced their surface tension and stopped the formation of light scattering micro-droplets on their surfaces. These mechanisms have been developed in combination with other applications of the sensor technology and are subject to the claims of a pending patent application [
24]. The surface of the reactive substrates is also a C
18 chain silanised over 50% of its surface area to protect against wetting. The ratio of silanised to non-silanised surface was determined experimentally in order to allow water vapour to the surface to allow the reaction to proceed but to resist macro-scale water beading on the surface which caused light scattering.
Although the original design purpose of the sensor was to passively detect MeS breakthrough during chemical protective suit permeation testing, it was well-suited for integration into a proof of concept real-time chemical vapour detection micro-UAV. Desirable aspects of the payload sensor include:
Small size and weight (66 × 20 × 7 mm and < 7 g) for lowering payload burden
Selective detection of a relatively benign chemical compound enabling safe generation of a test chemical vapour cloud
Extendibility to other chemical vapours by virtue of alternate colour chemistry
Capability to map a changing challenge level providing future potential in cloud mapping
Fast chemical response time to exposure (1–2 s)
Real-time output available at 1 Hz
Stable output under expected environmental conditions (highly stable output 15–35 °C and 30%–90% RH
Very low peak (20 mW) and average power (2 mW) requirement during measurement
The sensors have been developed over the past few years and have been subjected to rigorous laboratory testing. The chemistry is highly reactive to MeS. In laboratory conditions it has been shown that a non-UAV integrated sensor can detect (to normal analytical accuracy of 10× baseline noise), 10 parts per billion in air. In use, its normal working range would be expected to be 50 ppb–1 ppm dependent upon the type of test undertaken. Reproducibility errors have been measured below 5% across a batch of ten sensors. Very few colorimetric sensors are 100% specific. The iron nitrate reaction used in this system was designed to react quickly and specifically to MeS with almost 100% rectification upon return to clean air. The system has been exposed to solvents such as ethanol and n-hexane in the laboratory and no colour change was measured apart from where direct wetting occurred. Given the remote, clean desert environment in which the testing of the UAV-mounted sensor took place it was thought highly unlikely that the sensor would respond to any other material in the atmosphere. This was further tested by long-term exposure to laboratory air and no exposure ground testing and flights which revealed no baseline changes.
The sensor has previously been shown to respond within a very short time (1–2 s) to a low ppm challenge. For their intended purpose under chemical protective suits a 1 Hz data capture rate was more than sufficient and the firmware programmed to meet this need. It was not possible to revise this rate for the new application, however, given the flight characteristics and intended test cloud models, the rate was deemed suitable.
Further detail on the analytical characteristics of this sensor type is given in [
21,
23]. Modification of these systems from the initial published concepts with the new moisture protected substrates has been tested and shown to not alter the response of the sensor to MeS.
2.4. Integration
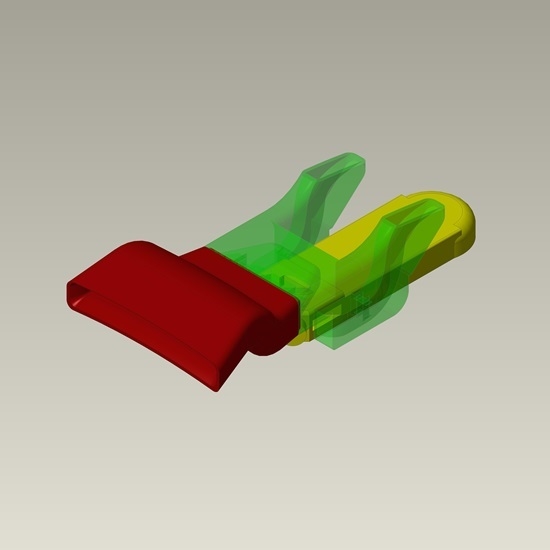
The chemical vapour sensor was both physically and electronically integrated into the micro-UAV platform. The original sensor assembly, shown in
Figure 1a, has a triangular cavity on the top face. The twin reactive chemical substrate slots are labelled in the image. The cavity of the triangular opening provides a path through to the substrate faces such that the reactive face is exposed to vapour that flows into the cavity. Vent slots are provided on the sides of the original sensor as an egress path for airflow to escape.
Figure 1.
(a) Chemical vapour sensor; (b) design of the air scoop duct assembly with integrated sensor; and (c) side view of assembly integrated into the micro-UAV cover hatch.
Figure 1.
(a) Chemical vapour sensor; (b) design of the air scoop duct assembly with integrated sensor; and (c) side view of assembly integrated into the micro-UAV cover hatch.
To adapt the original sensor assembly for the micro-UAV application, the sensor was mounted face side up into a custom air duct that was designed, manufactured, and incorporated into the aircraft specifically for the test as seen in
Figure 1b. The duct component includes an air scoop inlet that provides a path into the triangular cavity. Additionally, it plumbs an outgoing air path from the vent slots on the sensor assembly to the exhaust outlet. When the assembled duct and sensor are mounted in the fuselage cover hatch of the airframe (shown in
Figure 1c), the air scoop is presented to the in-flight airflow and directs rammed air into the sensor’s triangular cavity, exposing any vapours ingested to the substrates. The airflow path runs though the sensor vent to the assembly exhaust towards the rear of the airframe. The complete assembly of sensor and scoop weighed less than 30 g. The airflow described resulted in the active parts of the sensor being stimulated, thus allowing detection in flight.
The sensor requires constant ambient light conditions to operate within its calibration range. Given the aircraft moves and rotates to meet the programmed flight trajectory, and sun position was not a controlled variable for the test plan, the design of the custom air duct was made such that all stray light from outside of the fuselage was baffled, minimising sensor disturbance during flight.
The sensor was electrically-modified to provide an electrical wiring harness connection for interfacing to the autopilot avionics. The sensor modifications provided access to its on-board measurement timing control signals and a voltage-scaled analogue signal response from the photo-detector specifically tailored to maximise dynamic range of the subsequent digitization. The built-in reflectance independent internalised feedback loop (described previously) of the sensor remained in a working state in this implementation along with the 1 Hz sample timing control. Power for the sensor is provided via this interface from the primary UAV battery. Given the electrical power required to operate the air vehicle is in the order of 10 W, the sensor power draw has a negligible impact on UAV endurance.
The autopilot was re-programmed with a modified version of the ArduPilot ArduPlane fixed wing flight controller open-source autopilot. Additional software was integrated within the flight controller to monitor and control the electrical interface with the chemical vapour sensor via the general purpose digital ports and a 10-bit analogue to digital converter for sensor sampling timing control and the digitisation process. The calibrated photo-detector response value was sampled resulting in quantisation noise less than the measured signal for a 1 ppm exposure. Chemical vapour response measurement data was able to be directly read over this interface at a rate of 1 Hz, which was limited by the sensor firmware.
Prior to deep integration with the airframe, the electrically-modified sensors were laboratory tested using a custom-built flight speed air handling system designed to pass MeS-doped air over the sensor. During this confirmation test process, response signals were taken from the sensor by the flight control software and the original sensor on-board Wi-Fi telemetry link (which was disabled for the flight tests). Tests utilising a calibrated 10 ppm MeS-doped airstream revealed identical responses from both data streams giving confidence that the sensor performance characteristics as previously analysed and reports were not compromised.
The modified autopilot software used in the system retained all normally-available ArduPlane flight management capabilities including autonomous take-off, reliable GPS based mission way-pointing and autonomous landing during the experiments. Additional software was developed and incorporated into the real-time autopilot to synchronise the measurement from the chemical vapour detection sensor interface to the GPS time and position information. These measurement sets were logged on board the autopilot and also telemetered to a customised ground control station (GCS).
The GCS was a laptop computer connected to a 3DR 900 MHz ISM band telemetry datalink. The open-source GCS application [
25] was installed on the laptop, and was enhanced with additional functionality for the trial. The added functionality enabled the display of the real-time airborne chemical vapour measurement along with synchronised position information to the human operator. The telemetry range of the datalink used has previously been observed to be in excess of 2.5 km which is a reasonable standoff range for operator safety in realistic emergency response scenarios. Further range extension can be readily achieved using a directional antenna located at the GCS or replacing the datalink with a higher power variant. For this testing, standoff ranges of around 1 km were used with no communication issues observed. Real-time plotting of the sensor response was monitored by the operator to identify detection events, while GPS map overlays of paths and previous measurements were also available.
2.5. Test Site
For the purpose of an aerial chemical vapour detection test, an accelerated evaporation method was employed to generate a vapour cloud of MeS (which is a liquid at room temperature). Cloud generation was performed under highly-controlled conditions in a remote open air environment. The test site was flat with no hills for many kilometres with a surface of dirt and low scrub. Ambient winds carried and distributed the MeS vapour from the source to form the challenge cloud. Having been developed in the laboratory, this experimental program was completed in a remote location with only rudimentary workshop facilities available.
2.6. Experimental Method
To qualify the performance of the chemical vapour detection micro-UAV, several tests were conducted as described here. The Static Exposure Test (SET) was conducted on the ground. This test involved the aircraft being mounted stationary on a bench with forced air being passed over the micro-UAV nose inlet scoop via a laboratory-built rig at the approximate flight speed (~10 ms
−1), representing an approximation of the in-flight airflow conditions. At a defined time, the airflow was doped with predetermined concentrations of MeS vapour. The response of the sensor as measured by the micro-UAV was recorded prior to and throughout the exposure. Additionally, the MeS challenge concentration was independently measured using a complimentary technology detector (photo ionisation) at the duct exhaust port on fuselage using a hand held ppbRAE instrument (RAE systems, San Jose, CA, USA) [
26]. The test confirmed that the on-board chemical vapour detector responded to a presence of MeS in the airstream. Additionally, a comparison between the ppbRAE measurements and the sensor voltage output provided the ability to directly compare the MeS concentration represented by the magnitude of the sensor response.
The Exposure Flight Test (EFT) involved the conduct of a micro-UAV flight on a pre-planned mission through the area in which vapour was expected to have formed. A summary of the field layout of EFT is shown in
Figure 2. The flight path was mission planned based on the layout of the field site and prevailing wind conditions. The mission plan included a flight trajectory segment that intentionally attempted to achieve detection. This trajectory segment was defined so that the aircraft would fly up-wind towards the chemical source and cross the anticipated down-wind vapour cloud at an incident angle of approximately 20 degrees. This detection flight path was selected as it provided satisfactory margin in ensuring that the vapour cloud would be entered under time-varying ambient wind conditions. During the detection attempt, the aircraft flight plan commanded an altitude of the aircraft to the desired detection altitude.
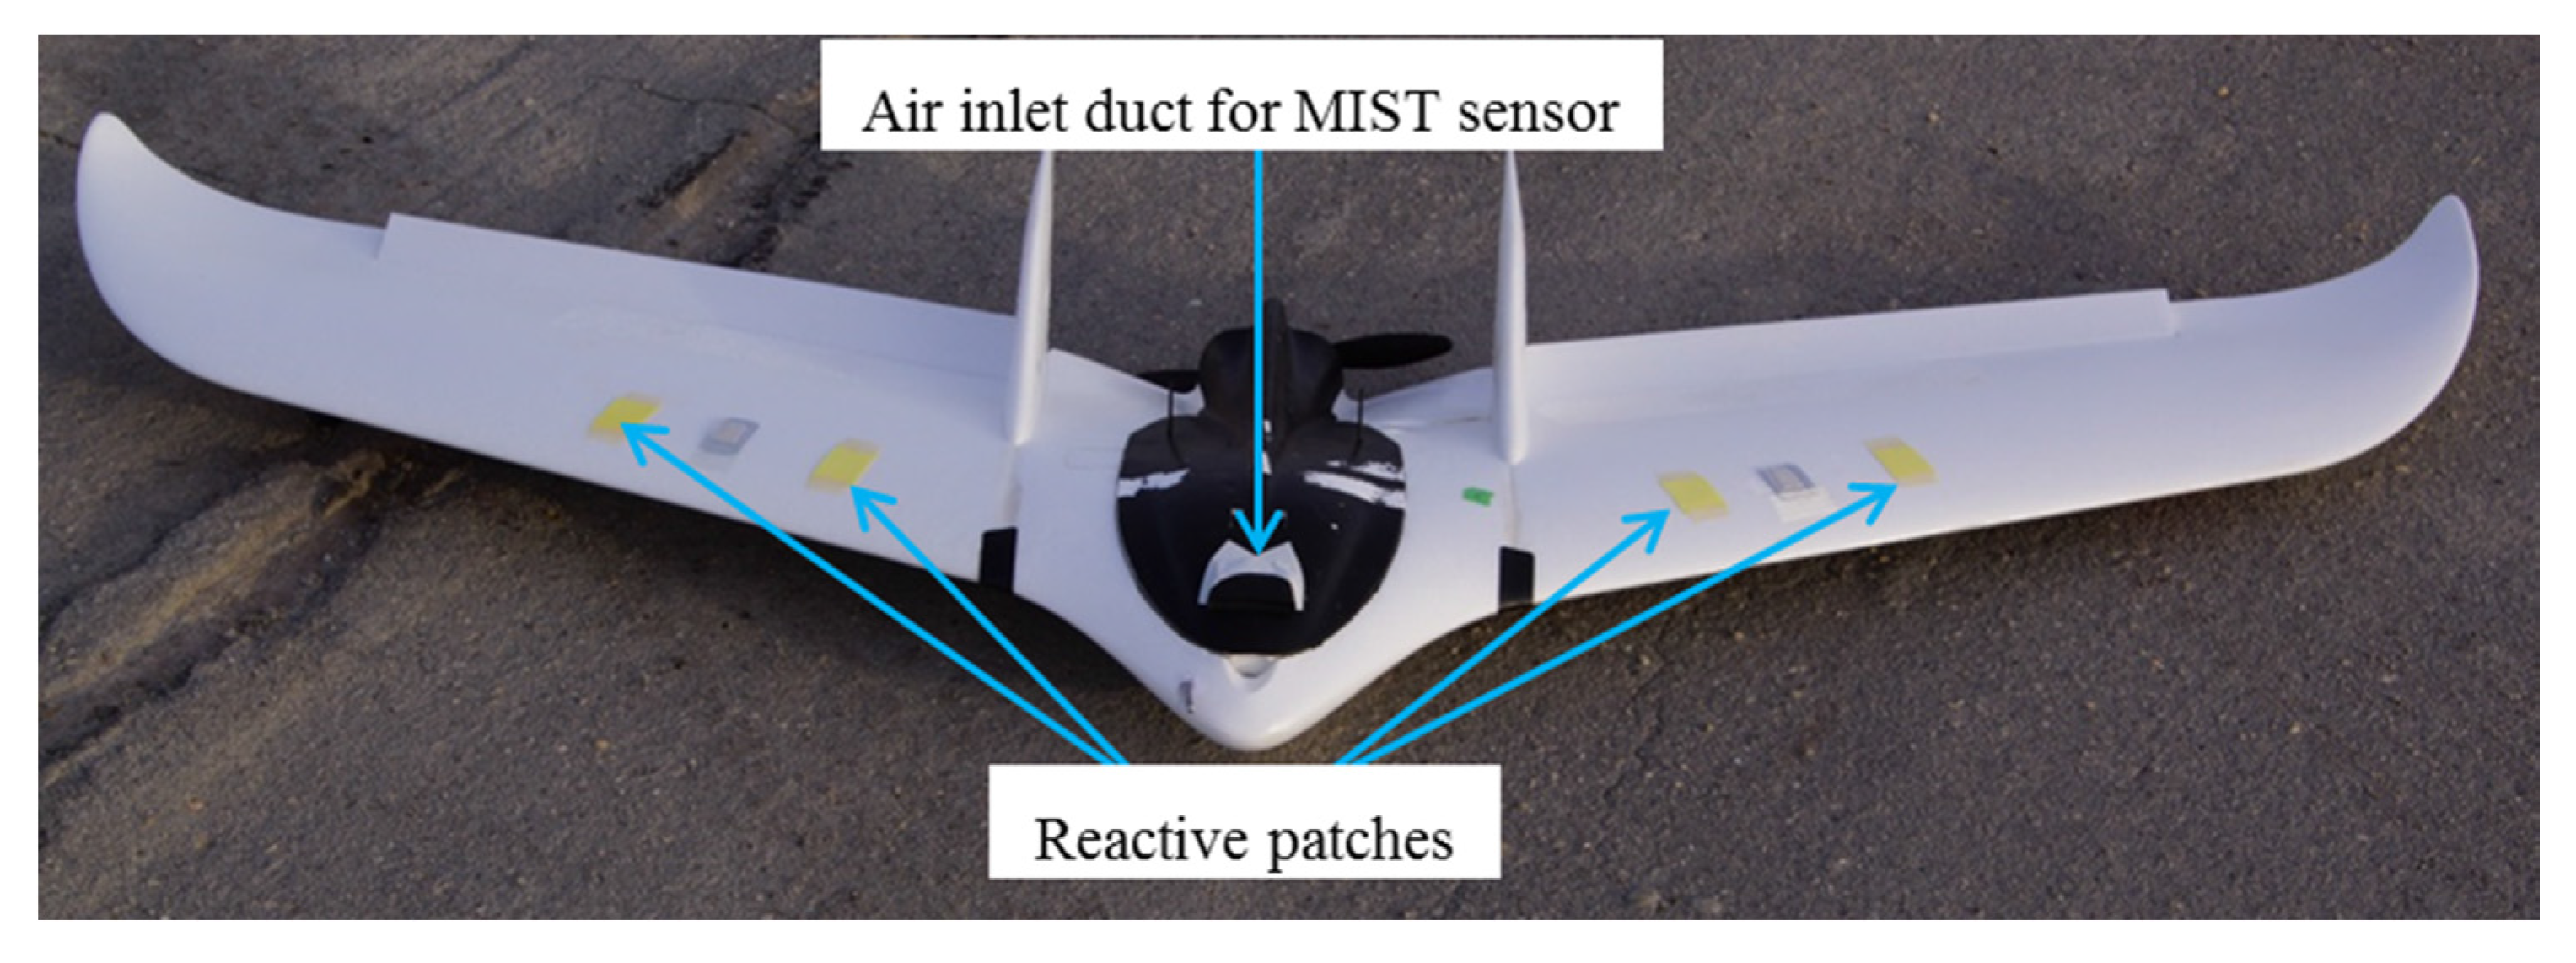
For the EFT flight test, the micro-UAV was configured as shown in
Figure 3 with the sensor embedded in the fuselage and with additional chemical detection patches on the leading edge of the wings. The chemical detection patches use the same reactive chemistry deposition as employed inside the real-time sensor substrates, but their ultraviolet and visible (UV-VIS) spectral reflectances were measured using a ASD Inc, Fieldspec-PRO (Boulder, CO, USA) portable spectro radiometer [
27] both before and after each flight. Comparison of before and after flight spectra taken from the patches allows independent physical confirmation of exposure or non-exposure to a MeS vapour cloud. Exposure of the detection papers was, in most cases, also visible to the eye (yellow to purple) which allowed for visual exposure assessments at the test site before spectral measurements were carried out. The visual inspection is illustrated in
Figure 4 showing no, minor, moderate, and major exposure examples.
Figure 2.
EFT Site layout.
Figure 2.
EFT Site layout.
Figure 3.
Phantom Fx61 UAS ready for NEFT/EFT with payload sensor and reactive patches applied.
Figure 3.
Phantom Fx61 UAS ready for NEFT/EFT with payload sensor and reactive patches applied.
Figure 4.
Reactive Papers visual inspection test examples. Change of colour to blue from yellow occurs on exposure. Amount of colour change used for visual inspection. (a) No Exposure; (b) Minor Exposure; (c) Moderate Exposure; and (d) Major Exposure.
Figure 4.
Reactive Papers visual inspection test examples. Change of colour to blue from yellow occurs on exposure. Amount of colour change used for visual inspection. (a) No Exposure; (b) Minor Exposure; (c) Moderate Exposure; and (d) Major Exposure.
During the EFT run, measurements were made at ground level with chemical detection patches (identical to those on the aircraft) mounted on poles at elevation 1 m above the ground. The patches were located in the downwind direction of the cloud source, arranged in two lines of seven patches oriented perpendicular to the wind direction as shown in
Figure 2. Each of the patches were used to determine the presence or absence of vapour exposure from the cloud and together provided an estimate of the width of the cloud at a given range and elevation. These patches were interrogated using the visual inspection method following the test. Additionally, to further verify the presence or absence of MeS vapour in the atmosphere through which the micro-UAV was flying, the ppbRAE instrument was mounted at a range of 100 m downwind and recorded MeS concentration in real-time.
During an EFT run, the micro-UAV recorded and telemetered the chemical vapour detection sensor. The ground station operator was tasked to identify the detection based on the real-time concentration measurement from the on-board sensor and immediately command the termination of the mission and recovery of the airframe to minimise evaporation and hence colour change from the vehicle mounted patches. UV-VIS measurements were taken from the patches within 5 min of the detection event. Several EFT experiments were conducted throughout the trial period with process improvements to mission planning being included to ensure exposure to the cloud reliably. Given the non-laboratory, “real-life” conditions of the working environment, exact repetition of the cloud dimensions and point concentrations is unrealistic between individual runs.
A No Exposure Flight Test (NEFT) was conducted as per the EFT with the exception that no MeS vapour cloud was released. All on-board sensor measurements and locations data were recorded for review. The wing-mounted chemical detection patches were also used and measured prior to and after flight to determine the effect of clean air flight under ambient conditions on the patches.
Following positive results of the EFT (discussed in
Section 3), the experimentation plan included a Multiple Exposure Flight Test (MEFT) in which the aircraft operated as for the EFT but instead of landing following the initial detection, the aircraft would circle around outside of the plume and return on the same vector to re-intersect with the cloud. The approach assessed the sensor ability to meet the challenge and then sufficiently recover in clean air following exposure, as well gaining repeatability data on the detection system while keeping weather conditions as stable of possible through minimising the time between passes. These results are important for determining suitability for future GDM and GSL roles of this system configuration.
During all flight testing, weather information including wind speed and direction and temperature were logged using a Davis Instruments Vantage Pro 2 weather station (Davis Instruments, San Francisco, CA, USA) [
28].
3. Results
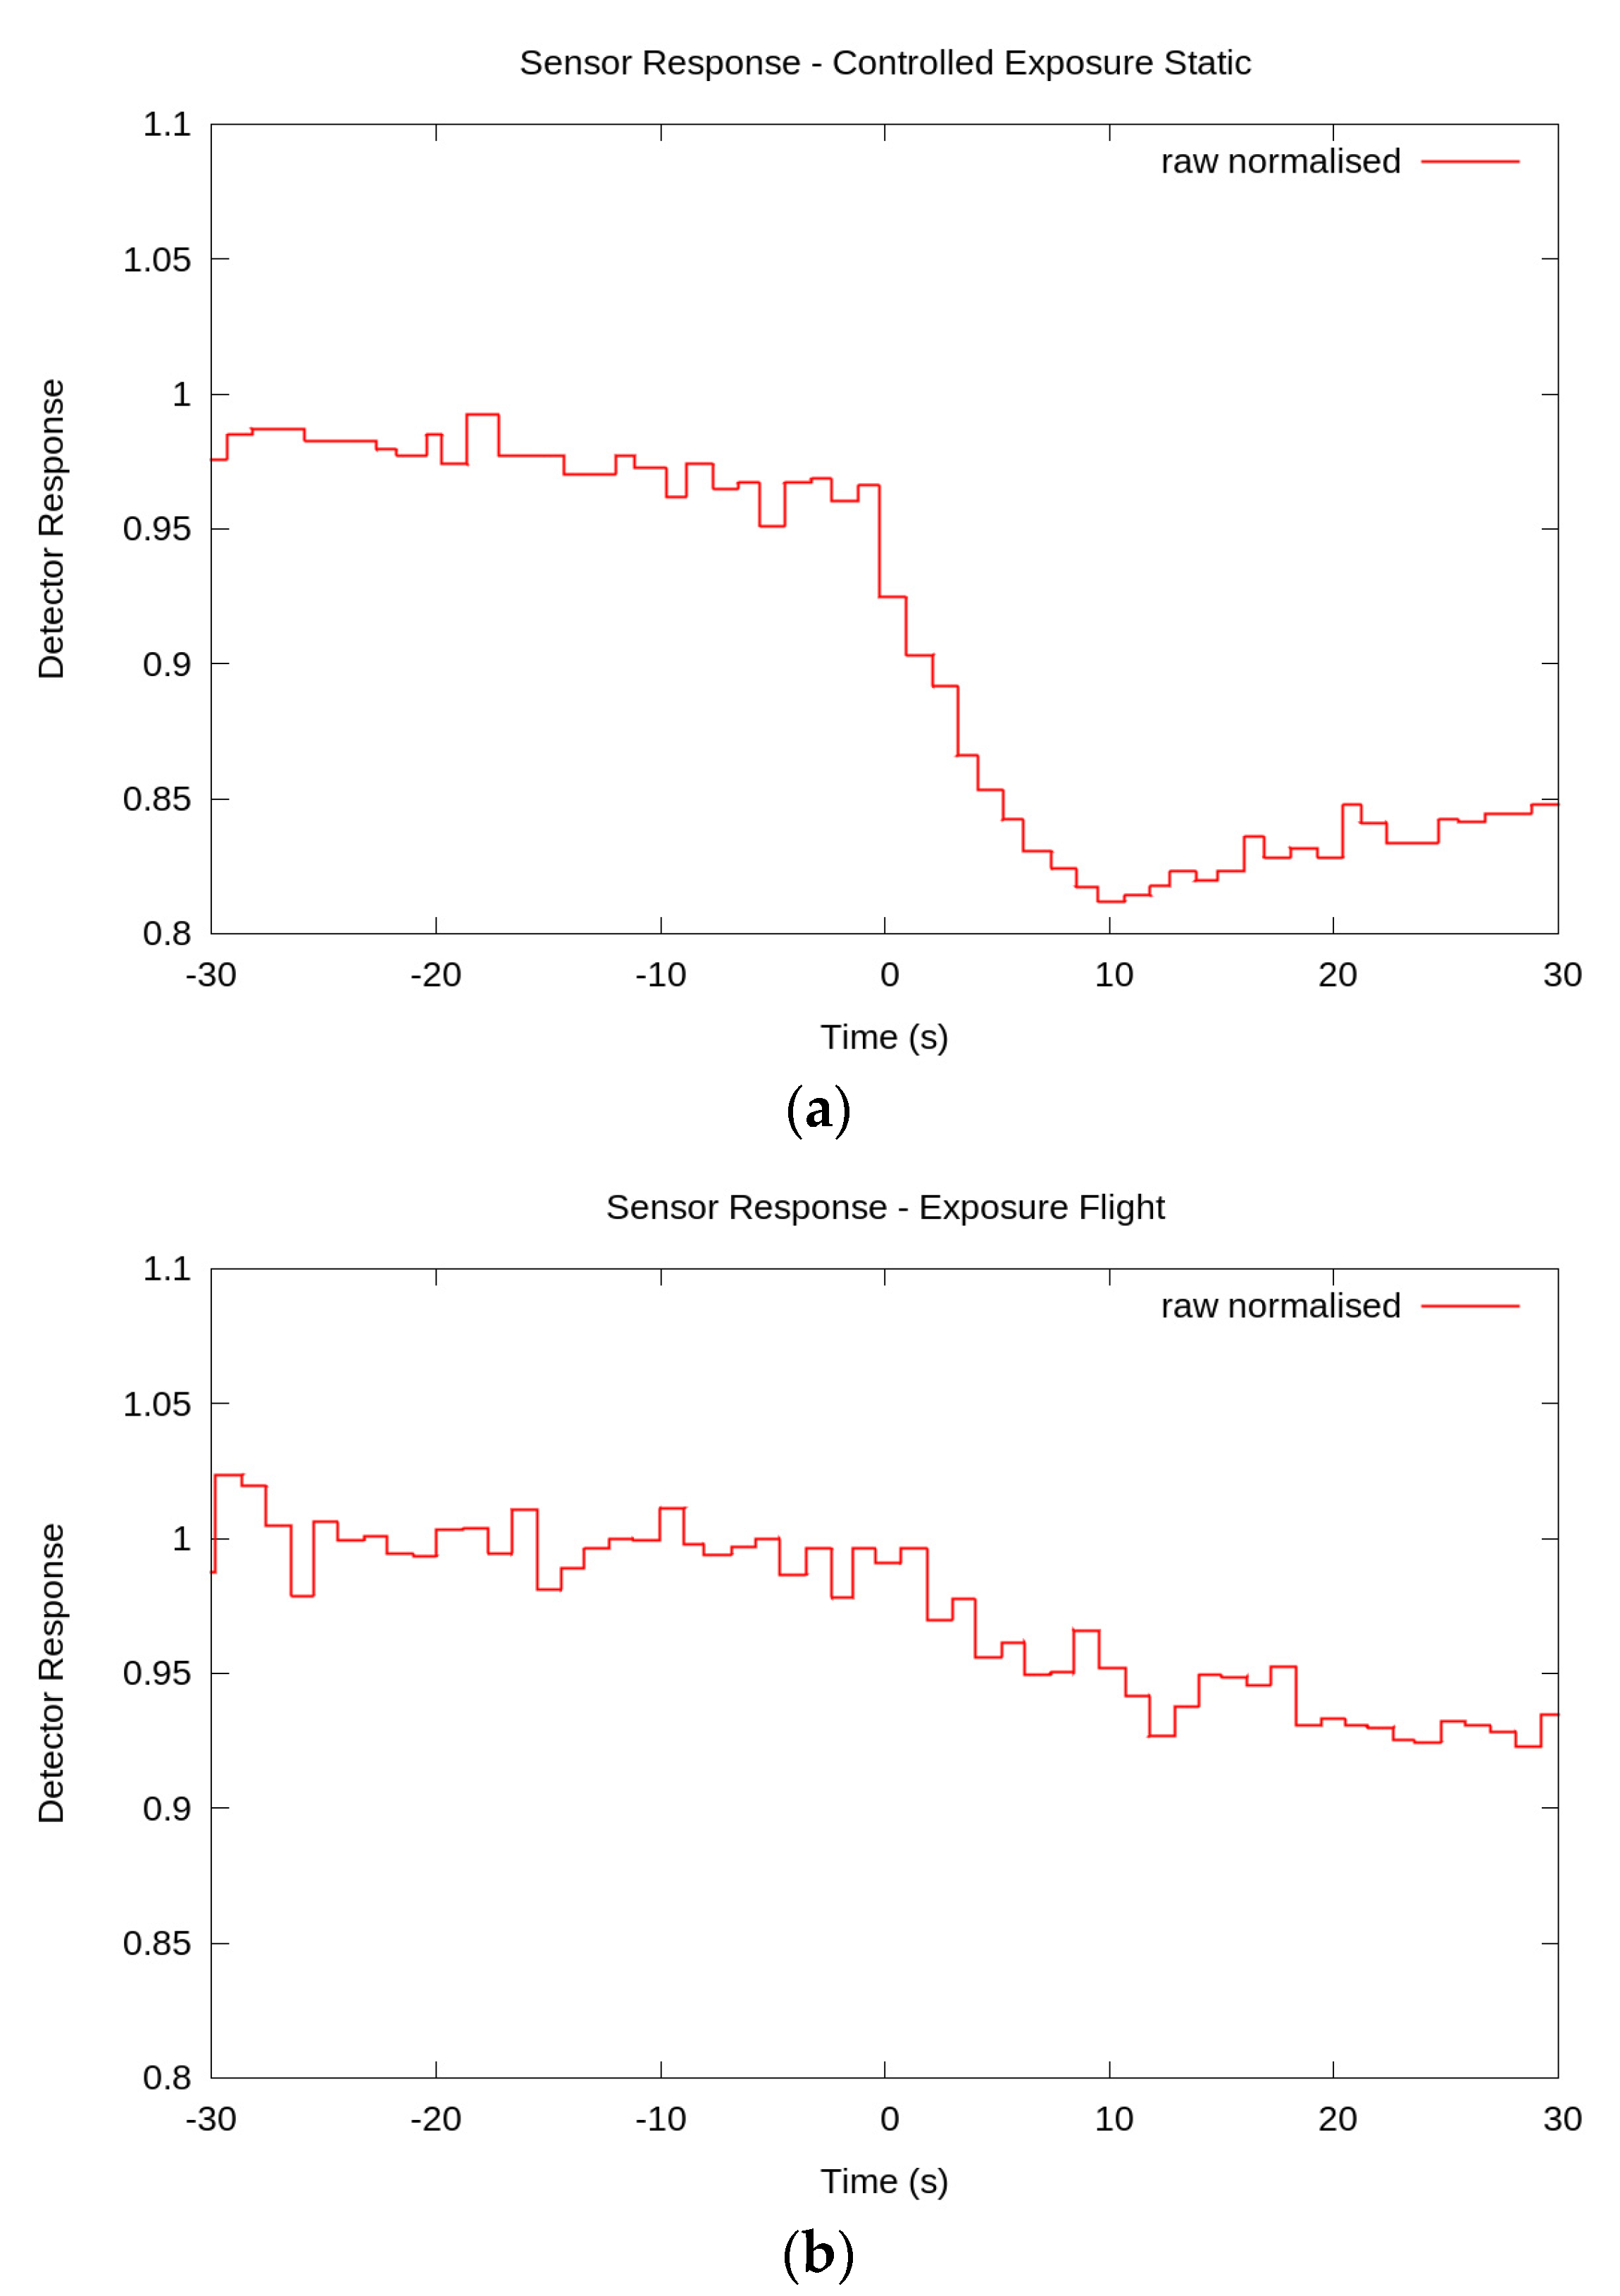
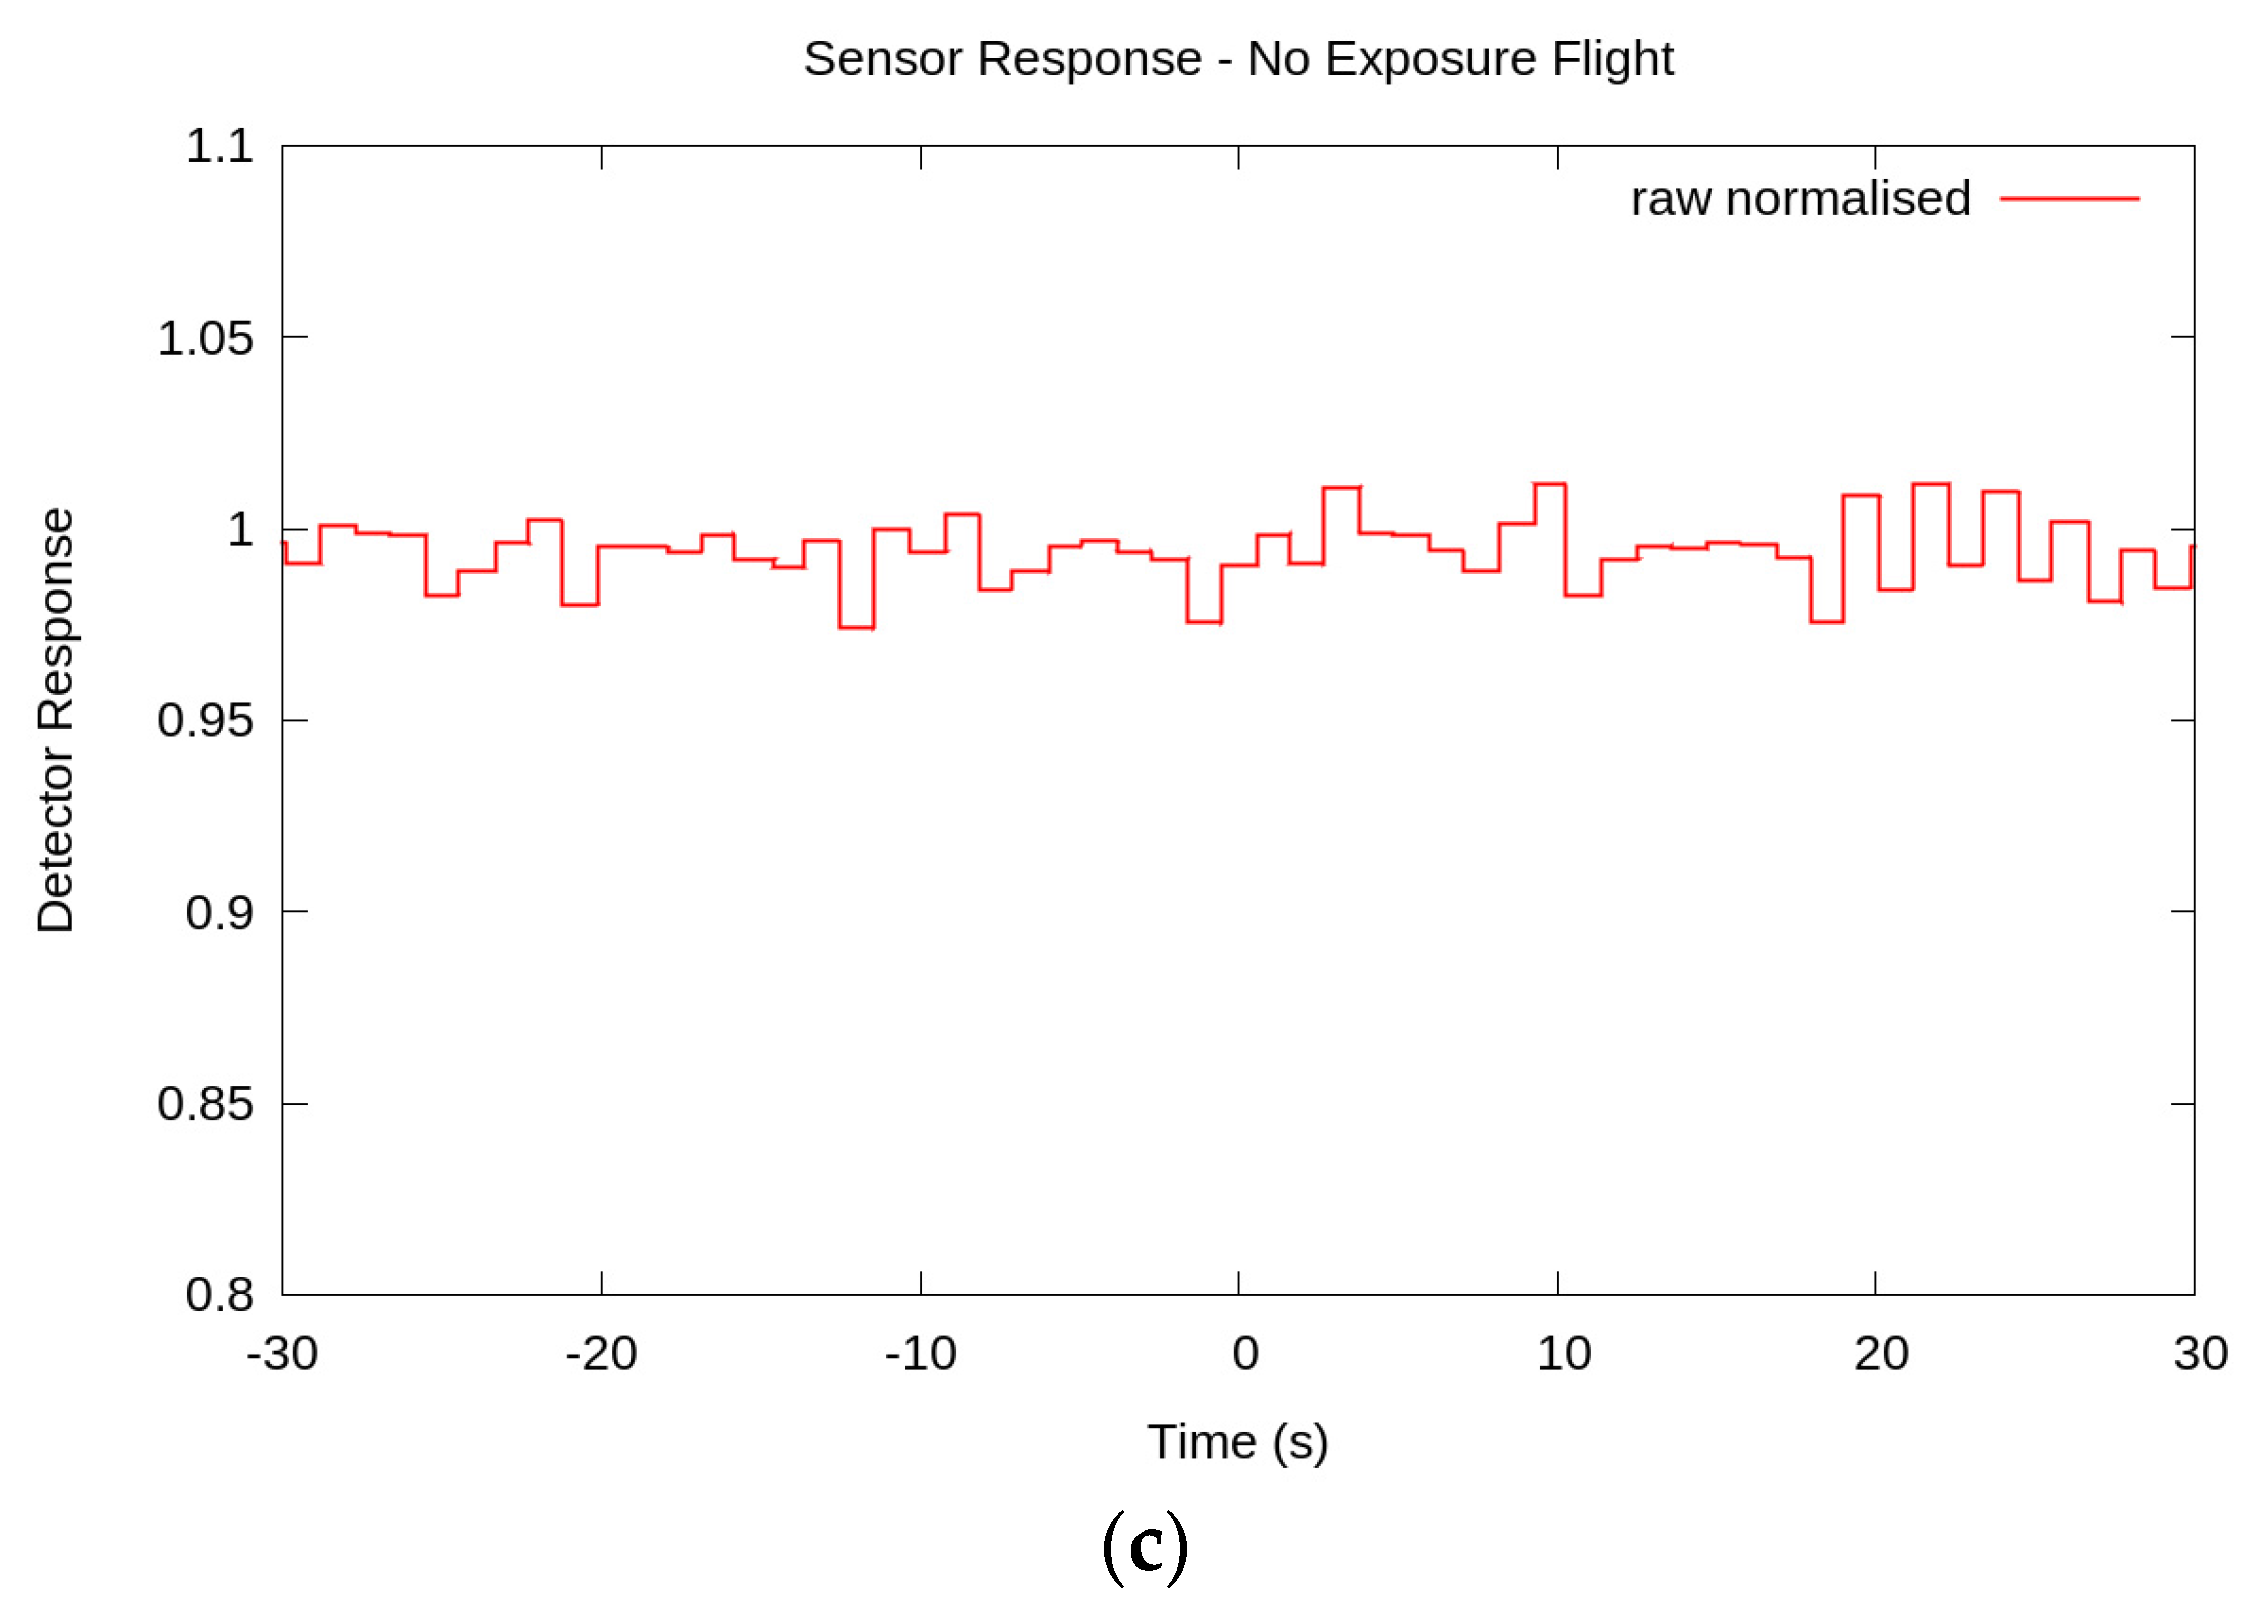
The normalised on-board sensor measurement results
versus time for three initial tests (SET, EFT and NEFT) are shown in
Figure 5. The time axis represents the 60 s of sensor response. For the EFT and SET,
t = 0 is assigned to the detection instant when the response crosses a defined threshold. NEFT has no detection instant, and
t = 0 is assigned to an arbitrary point within the stable flight portion of the NEFT to allow for comparison. The plots include 30 s prior and 30 s following the detection instant.
The EFT, NEFT, and SET micro-UAV chemical detector response plots in
Figure 5 have been analysed for mean and standard deviation for the 30 s period prior and after the detection instant. These results are summarised in
Table 2.
Table 2.
Micro-UAV sensor response statistics before and after the detection instant.
Table 2.
Micro-UAV sensor response statistics before and after the detection instant.
| | 30 s Prior to Detection Instant | 30 s Post Detection Instant |
|---|
| Mean | SD | Mean | SD |
|---|
| EFT | 1.00 | 0.009 | 0.94 | 0.017 |
| NEFT | 0.99 | 0.009 | 1.00 | 0.009 |
| SET | 0.98 | 0.009 | 0.84 | 0.026 |
Figure 5.
(a) On-board normalised chemical vapour detector response for SET; (b) EFT; (c) NEFT. Time axis t = 0 is the detection instant in the SET and EFT results.
Figure 5.
(a) On-board normalised chemical vapour detector response for SET; (b) EFT; (c) NEFT. Time axis t = 0 is the detection instant in the SET and EFT results.
During the SET, the captured ppbRAE measurement of the concentration of MeS in the forced airstream shows that the maximum chemical vapour detection sensor response shown in
Figure 5a corresponded to a MeS concentration of approximately 10 ppm.
UV-VIS measurements before and after the EFT and NEFT of the airframe mounted patches are shown in
Figure 6. Error bars showing the standard deviation across the set of four measurements at each wavelength are shown.
Figure 6.
UV-VIS spectroscopy results from reactive chemistry patches. (a) EFT before (Red) and after (Blue); and (b) NEFT before (Red) and after (Blue).
Figure 6.
UV-VIS spectroscopy results from reactive chemistry patches. (a) EFT before (Red) and after (Blue); and (b) NEFT before (Red) and after (Blue).
Within the EFT results, the pole mounted patches were qualitatively inspected for exposure with results shown in
Table 3.
Table 3.
Ground measurement patch inspection rating for exposure at each monitoring location during EFT.
Table 3.
Ground measurement patch inspection rating for exposure at each monitoring location during EFT.
| | −18 m | −12 m | −6 m | 0 | 6 | 12 | 18 |
|---|
| 30 m | Moderate | Major | Major | Moderate | Minor | None | None |
| 60 m | Moderate | Moderate | Moderate | Minor | Minor | None | None |
Within the EFT, the ppbRAE mounted in the downwind position measured the vapour cloud concentration. Peak MeS vapour cloud concentration of 3.7 ppm was detected at the 100 m range.
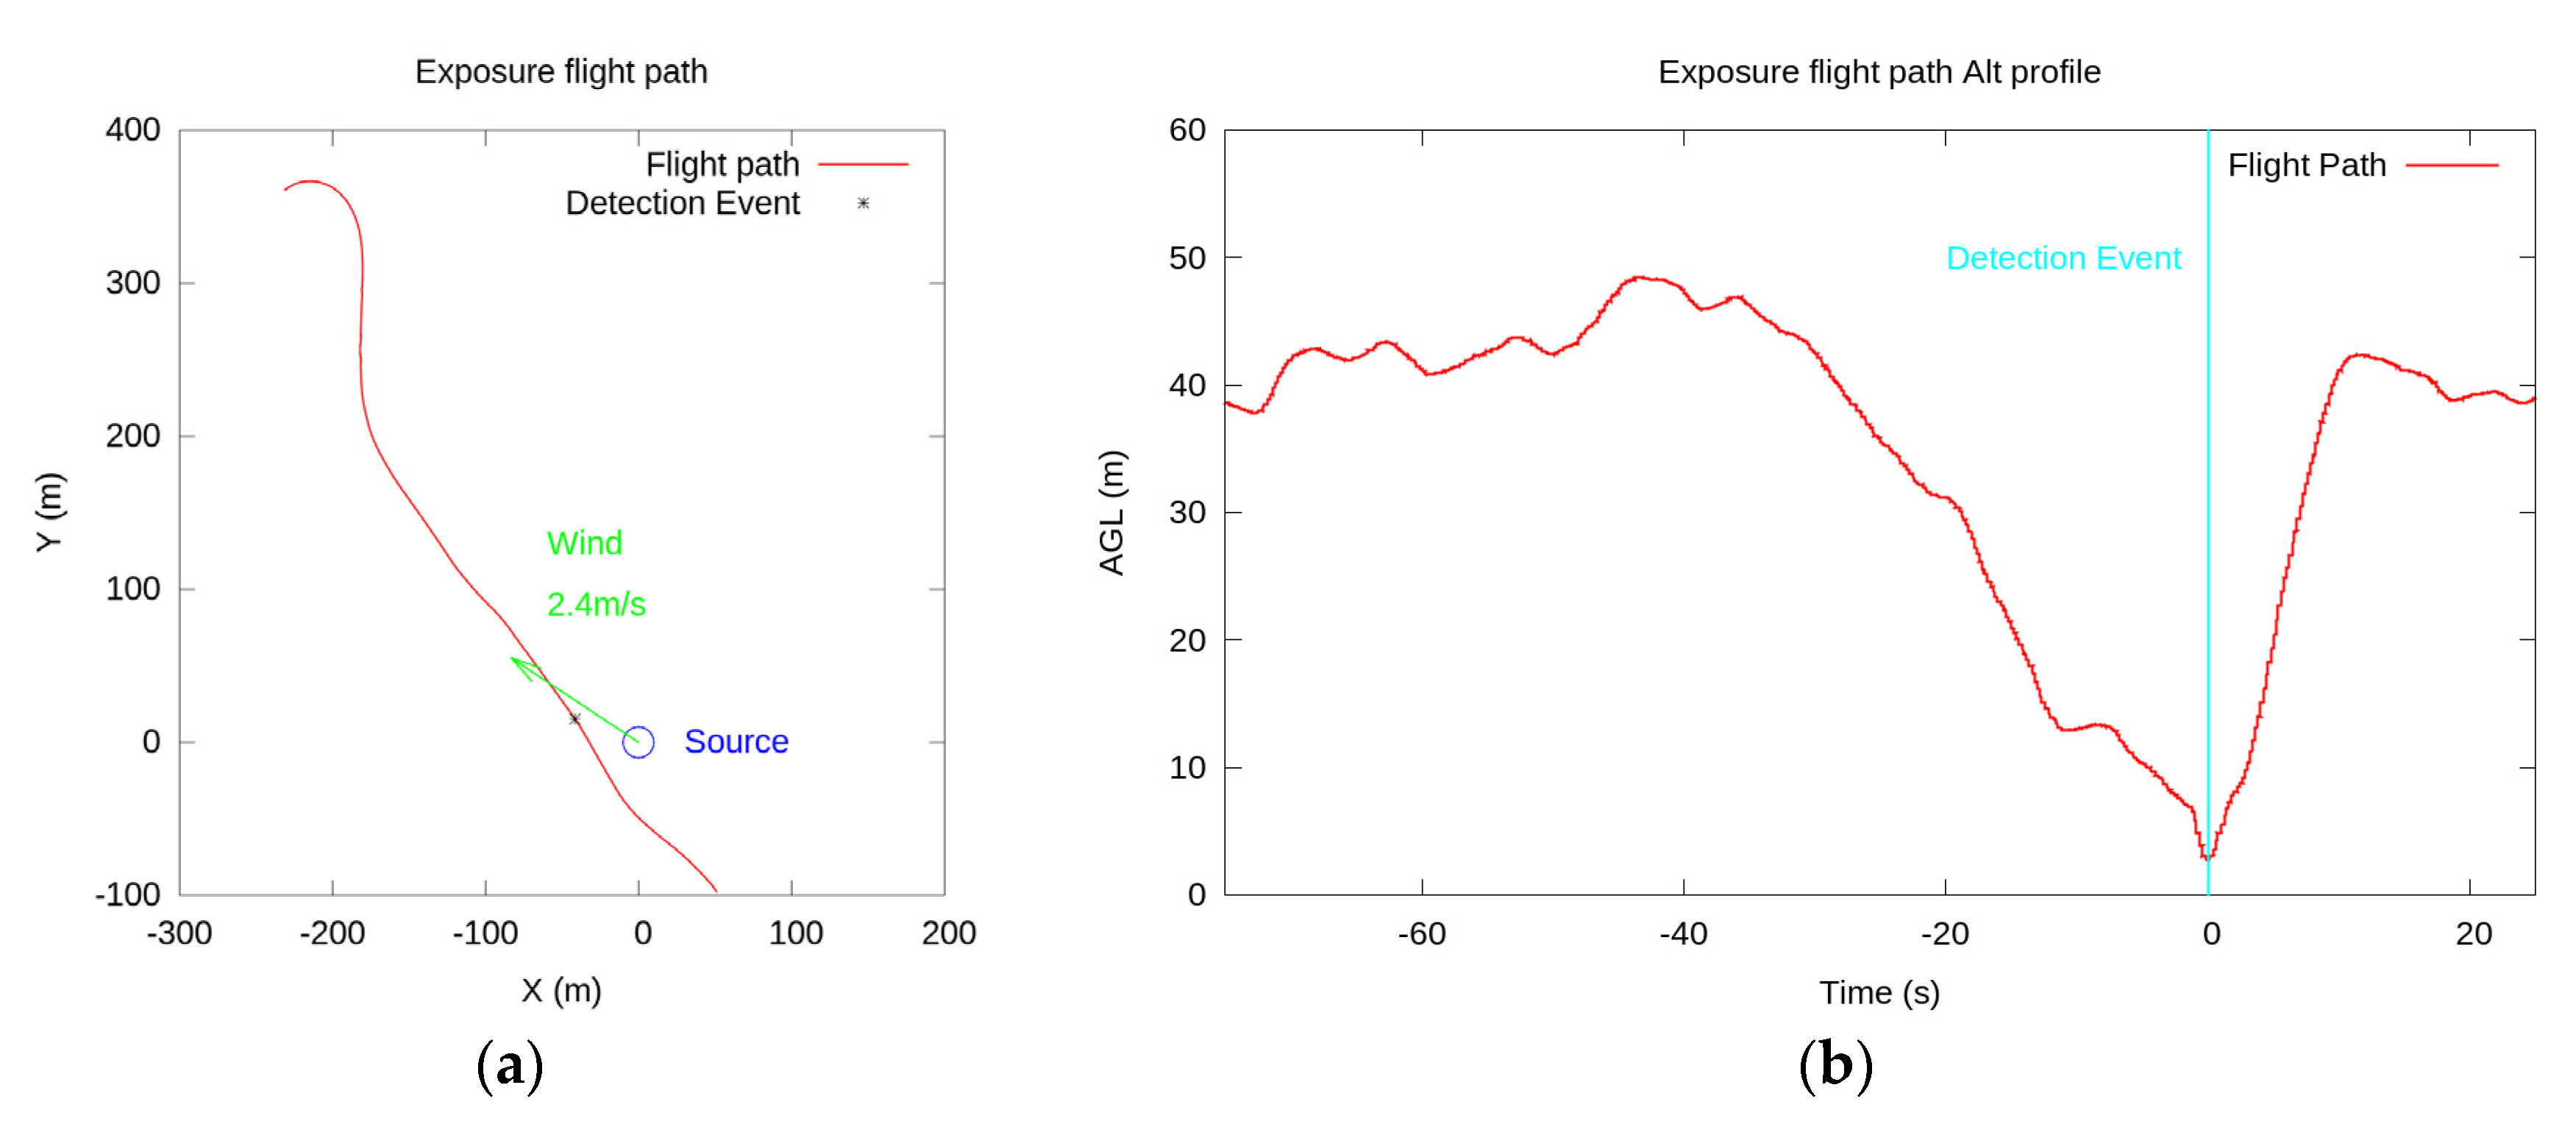
During the EFT and NEFT, the flight trajectory and detector response was recorded.
Figure 7 shows the trajectory of the detection segment of the EFT in XY plane and also
versus altitude. The detection instant is highlighted in both plots and has been identified in post processing as the point where sensor deflection is larger than the unstimulated sensor’s signal noise.
Weather station data during the EFT indicated an average wind direction to the NW (−45 °C) at an average wind speed of 2.4 m/s. This wind vector is shown in the XY plot of
Figure 7. Outdoor temperature was recorded at 15.6 degrees Celsius and a humidity of 58%.
Figure 7.
UAV flight trajectory during EFT. (a) Aircraft travelling southeast upwind into the vapour cloud; and (b) Aircraft altitude profile during approach. Detection event marked
Figure 7.
UAV flight trajectory during EFT. (a) Aircraft travelling southeast upwind into the vapour cloud; and (b) Aircraft altitude profile during approach. Detection event marked
The MEFT was conducted and the normalised low pass filtered sensor response is shown in
Figure 8a along with UAV instantaneous flight path elevation profile. As per the experimental design, each attempted detection pass executed a predetermined reduction in altitude to the detection level required to enter the cloud (as found in the EFT) to reveal a four-dimensional real-time assay of the airspace. This was followed by a climb to altitude above the plume to ensure clean air exposure in between transects. The MEFT response plot includes one descending path which is labelled as “excluded” as it was aborted above the detection altitude for unrelated mission planning reasons. Detection instants as defined by the transition of the response are marked on the figure.
Figure 8b shows the North oriented two dimensional ground course taken by the aircraft towards and through the plume and the matched detection locations as identified in
Figure 8a. Approach vectors for the first four attempts from the northwest to create a glancing angle to the expected plume direction based on wind conditions. The final three detection events were changed to vector in from the north to intersect the plume at the same approximate location but broadside to the wind to reduce the apparent width and therefore exposure time of the plume to the sensor as the aircraft moves through plume into clear air on the other side.
Weather station recordings show that the MEFT was conducted under winds to the west-northwest of 3 m/s. Temperature was 16.6 degrees Celsius and humidity of 55%. The wind vector is plotted on the
Figure 8 for reference.
Figure 8.
MEFT results (a) the time domain sensor response and elevation profile of the UAV; and (b) UAV flight trajectory during seven detection passes of the MEFT.
Figure 8.
MEFT results (a) the time domain sensor response and elevation profile of the UAV; and (b) UAV flight trajectory during seven detection passes of the MEFT.
5. Conclusions
From the data presented in this paper, we have demonstrated standoff detection of model MeS vapour cloud at concentrations commensurate with the permissible exposure level for many chemicals for humans, in-flight, in real-time, using a customised fixed wing micro-UAV. Confirmation by traditional techniques, both in the air and on the ground supports the on-board chemical vapour detection measurement data gathered in these tests.
Ongoing development of small, light, and fast-responding sensors for the application at hand is likely to be the biggest hurdle to adoption of the method. Few sensors in the current chemical vapour detection market have the ability to cope with air passage at the speeds expected from even modest UAVs available today. Most that are available are greatly in excess of the load capacity of current micro-UAVs. Rate of reaction and data gathering are areas of further development that will be required in the future. The sensor developed and demonstrated is appropriately scaled for the micro-UAV platform. Future work will focus on integrating a range of new colorimetry developed under a related program for chemical vapours such as NO, SO2, and H2S, with the option of carrying an array of such sensors to detect the multitude of threats to which first responders may be exposed.
The integration between the sensor and the autopilot is far from complete. The autopilot had access to the signals from the sensor and we have shown, could have been programmed to detect the plume independently. The autopilot could then signal the operator only upon detection, rather than requiring continuous review, thus reducing workload, which would be helpful when responding to an emergency situation or performing routine follow on behaviours, such as source localisation and plume mapping. Further integration could allow the autopilot to exhibit behaviour when it detects the plume so that high-resolution aerial mosaics of the region are captured to aid emergency crews on the ground.
Many engineering refinements can be made to the air intake system that would significantly increase the volume of air exposed to the chemical vapour detection sensor with expected improvements to sensitivity. Issues with the sensor implementation that required all ambient light to be trapped caused difficult decisions in integration such as long venting paths for the air intake. Future variants will be designed with improved fluid dynamics for air capture and improved optical design.


