Review

Snow Water Equivalent Monitoring—A Review of Large-Scale Remote Sensing Applications

by
Samuel Schilling
1,*,
Andreas Dietz
1 and
Claudia Kuenzer
1,2
1
German Remote Sensing Data Center, Earth Observation Center, EOC of the German Aerospace Center, DLR, 82234 Weßling, Germany
2
Institute for Geography and Geology, University of Wuerzburg, 97074 Wuerzburg, Germany
*
Author to whom correspondence should be addressed.
Remote Sens. 2024, 16(6), 1085; https://doi.org/10.3390/rs16061085
Submission received: 7 February 2024 / Revised: 14 March 2024 / Accepted: 18 March 2024 / Published: 20 March 2024
(This article belongs to the Special Issue Satellite and Airborne Remote Sensing for Snow Observation)

Abstract

:
Snow plays a crucial role in the global water cycle, providing water to over 20% of the world’s population and serving as a vital component for flora, fauna, and climate regulation. Changes in snow patterns due to global warming have far-reaching impacts on water management, agriculture, and other economic sectors such as winter tourism. Additionally, they have implications for environmental stability, prompting migration and cultural shifts in snow-dependent communities. Accurate information on snow and its variables is, thus, essential for both scientific understanding and societal planning. This review explores the potential of remote sensing in monitoring snow water equivalent (SWE) on a large scale, analyzing 164 selected publications from 2000 to 2023. Categorized by methodology and content, the analysis reveals a growing interest in the topic, with a concentration of research in North America and China. Methodologically, there is a shift from passive microwave (PMW) inversion algorithms to artificial intelligence (AI), particularly the Random Forest (RF) and neural network (NN) approaches. A majority of studies integrate PMW data with auxiliary information, focusing thematically on remote sensing and snow research, with limited incorporation into broader environmental contexts. Long-term studies (>30 years) suggest a general decrease in SWE in the Northern Hemisphere, though regional and seasonal variations exist. Finally, the review suggests potential future SWE research directions such as addressing PMW data issues, downsampling for detailed analyses, conducting interdisciplinary studies, and incorporating forecasting to enable more widespread applications.

1. Introduction

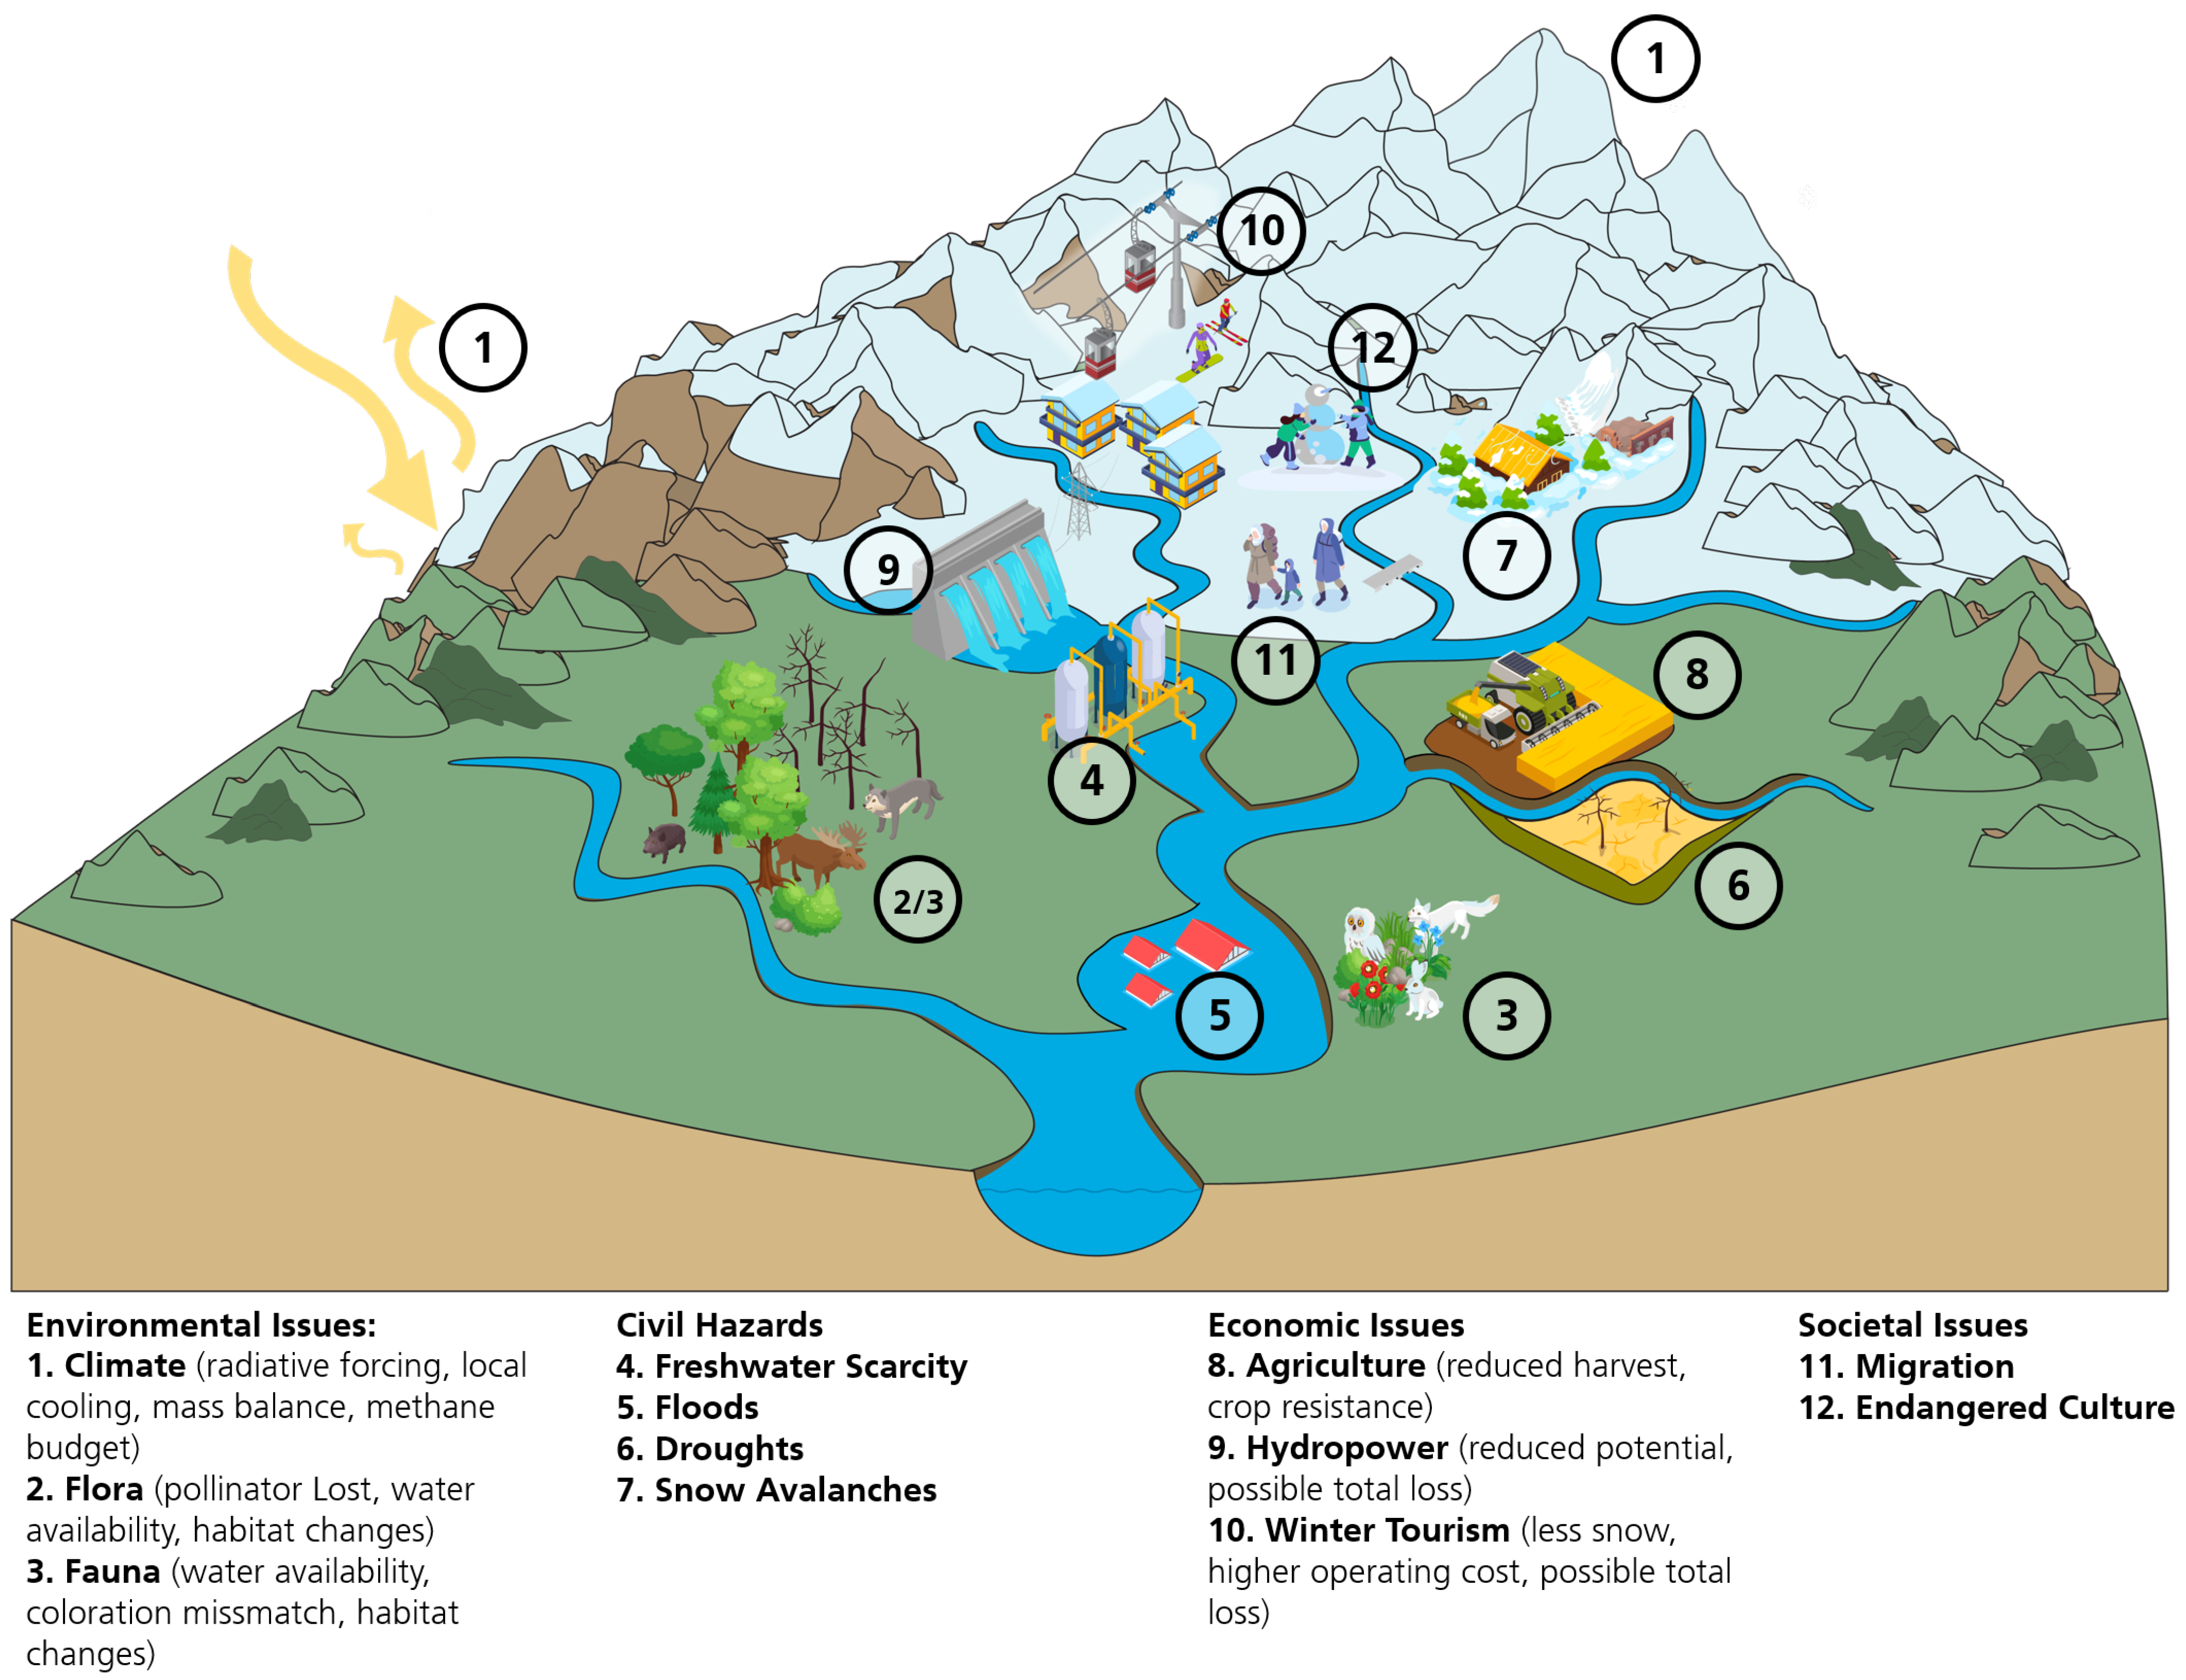
1.1. Contextualized Impacts of a Changing Snowpack

Snow plays a crucial role in the global water cycle, serving as the primary water source for over 20% of the world’s population [1,2,3]. It furthermore influences various environmental and societal aspects, as depicted in Figure 1. Snow is also foundational to the life of flora [4,5] and fauna [6,7] in diverse global regions. Not only that, snow also affects climate regulation including local cooling and radiative forcing [8], as well as Earth’s mass balance [9] and its methane budget [10]. A comprehensive understanding of the world’s snowpack is, thus, vital and achieved by assessing several variables. Besides snow extent and snow depth (SD), snow water equivalent (SWE) is often employed to do so. SWE is defined as the vertical depth of water that would result if all snow over a certain area would melt [11]. SWE depends largely on snow composition and, thus, on snow density and snow crystal size [12].
With global warming changes in the global snowpack are induced, generating challenges for human livelihood, ranging from water availability over economic factors up to societal transformations [13]. For instance, regions reliant on snow for drinking water, such as the Colorado River Basin (USA) and downstream of the Himalayas (Asia), face increasingly complex resource management issues [14,15]. Declining snow as a freshwater resource impacts agriculture, leading to snow-related droughts, which can severely hinder harvests and even result in complete crop failures [16]. Farmers are compelled to adapt traditional planting schemes by seeking resilient alternative crops to mitigate these risks [17]. Furthermore, the absence of snow and the resulting water scarcity increase the demand for irrigation, but reduced water availability complicates meeting this need [18]. In addition to water scarcity, the changing climate and snowpack affect snowmelt patterns, heightening the risk of flooding [19,20,21]. Increased rain-on-snow events further intensify this risk [22]. Floods pose a threat primarily to agriculture, but also endanger civil infrastructure and residential areas [23]. Additionally, these areas are getting more threatened by the increase in the frequency, as well as the decreased predictability of snow avalanches [24,25].
The increased physical and economic risks are driving people in various regions to abandon their homes and seek refuge in safer areas [26,27,28]. But, also, for humans who are not forced to migrate yet, the changing snowpack rises additional challenges to their living circumstances, besides the already mentioned ones. For instance, communities relying on snow-fed rivers for hydropower face reduced power reliability and diminishing energy potential [29,30]. In addition, various regions rely on snow as an economic factor, primarily for winter tourism. Decreasing snowfall and an increasing snowline, especially at medium altitudes, is making operations in this sector more expensive and difficult to sustain [31]. This leads to situations in which a strong economic sector in otherwise traditionally economically weak mountain regions weakens and might disappear completely [32,33]. Finally, evolving snow conditions affect not just physical and economic aspects, but also social factors. Snow serves as a vital identifier in many communities, influencing local culture through art, music, and various events [34]. The decline in snow jeopardizes this cultural aspect, with uncertain consequences for these communities [35].
But, changes in terrestrial snow not only influence human livelihood, but also flora and fauna [36]. Beyond the concern of freshwater scarcity, various challenges, such as forced new wandering behavior, forage issues, constantly changing habitat balances, or coloration mismatches complicate the survival dynamics of various animal species [37,38,39,40]. In addition, changing snow pack affects certain pollinator species, with significant implications for flora, particularly in mountainous regions [41]. The flora additionally faces challenges from disrupted seasonality and the inconsistent duration of the snow season [42]. Moreover, the absence of snow leads to drought and reduced water availability, impacting plant growth [43,44]. However, the absence of snow not only has negative impacts on the flora, but also opens up new habitats in areas that previously offered hardly any living space for plants [45].

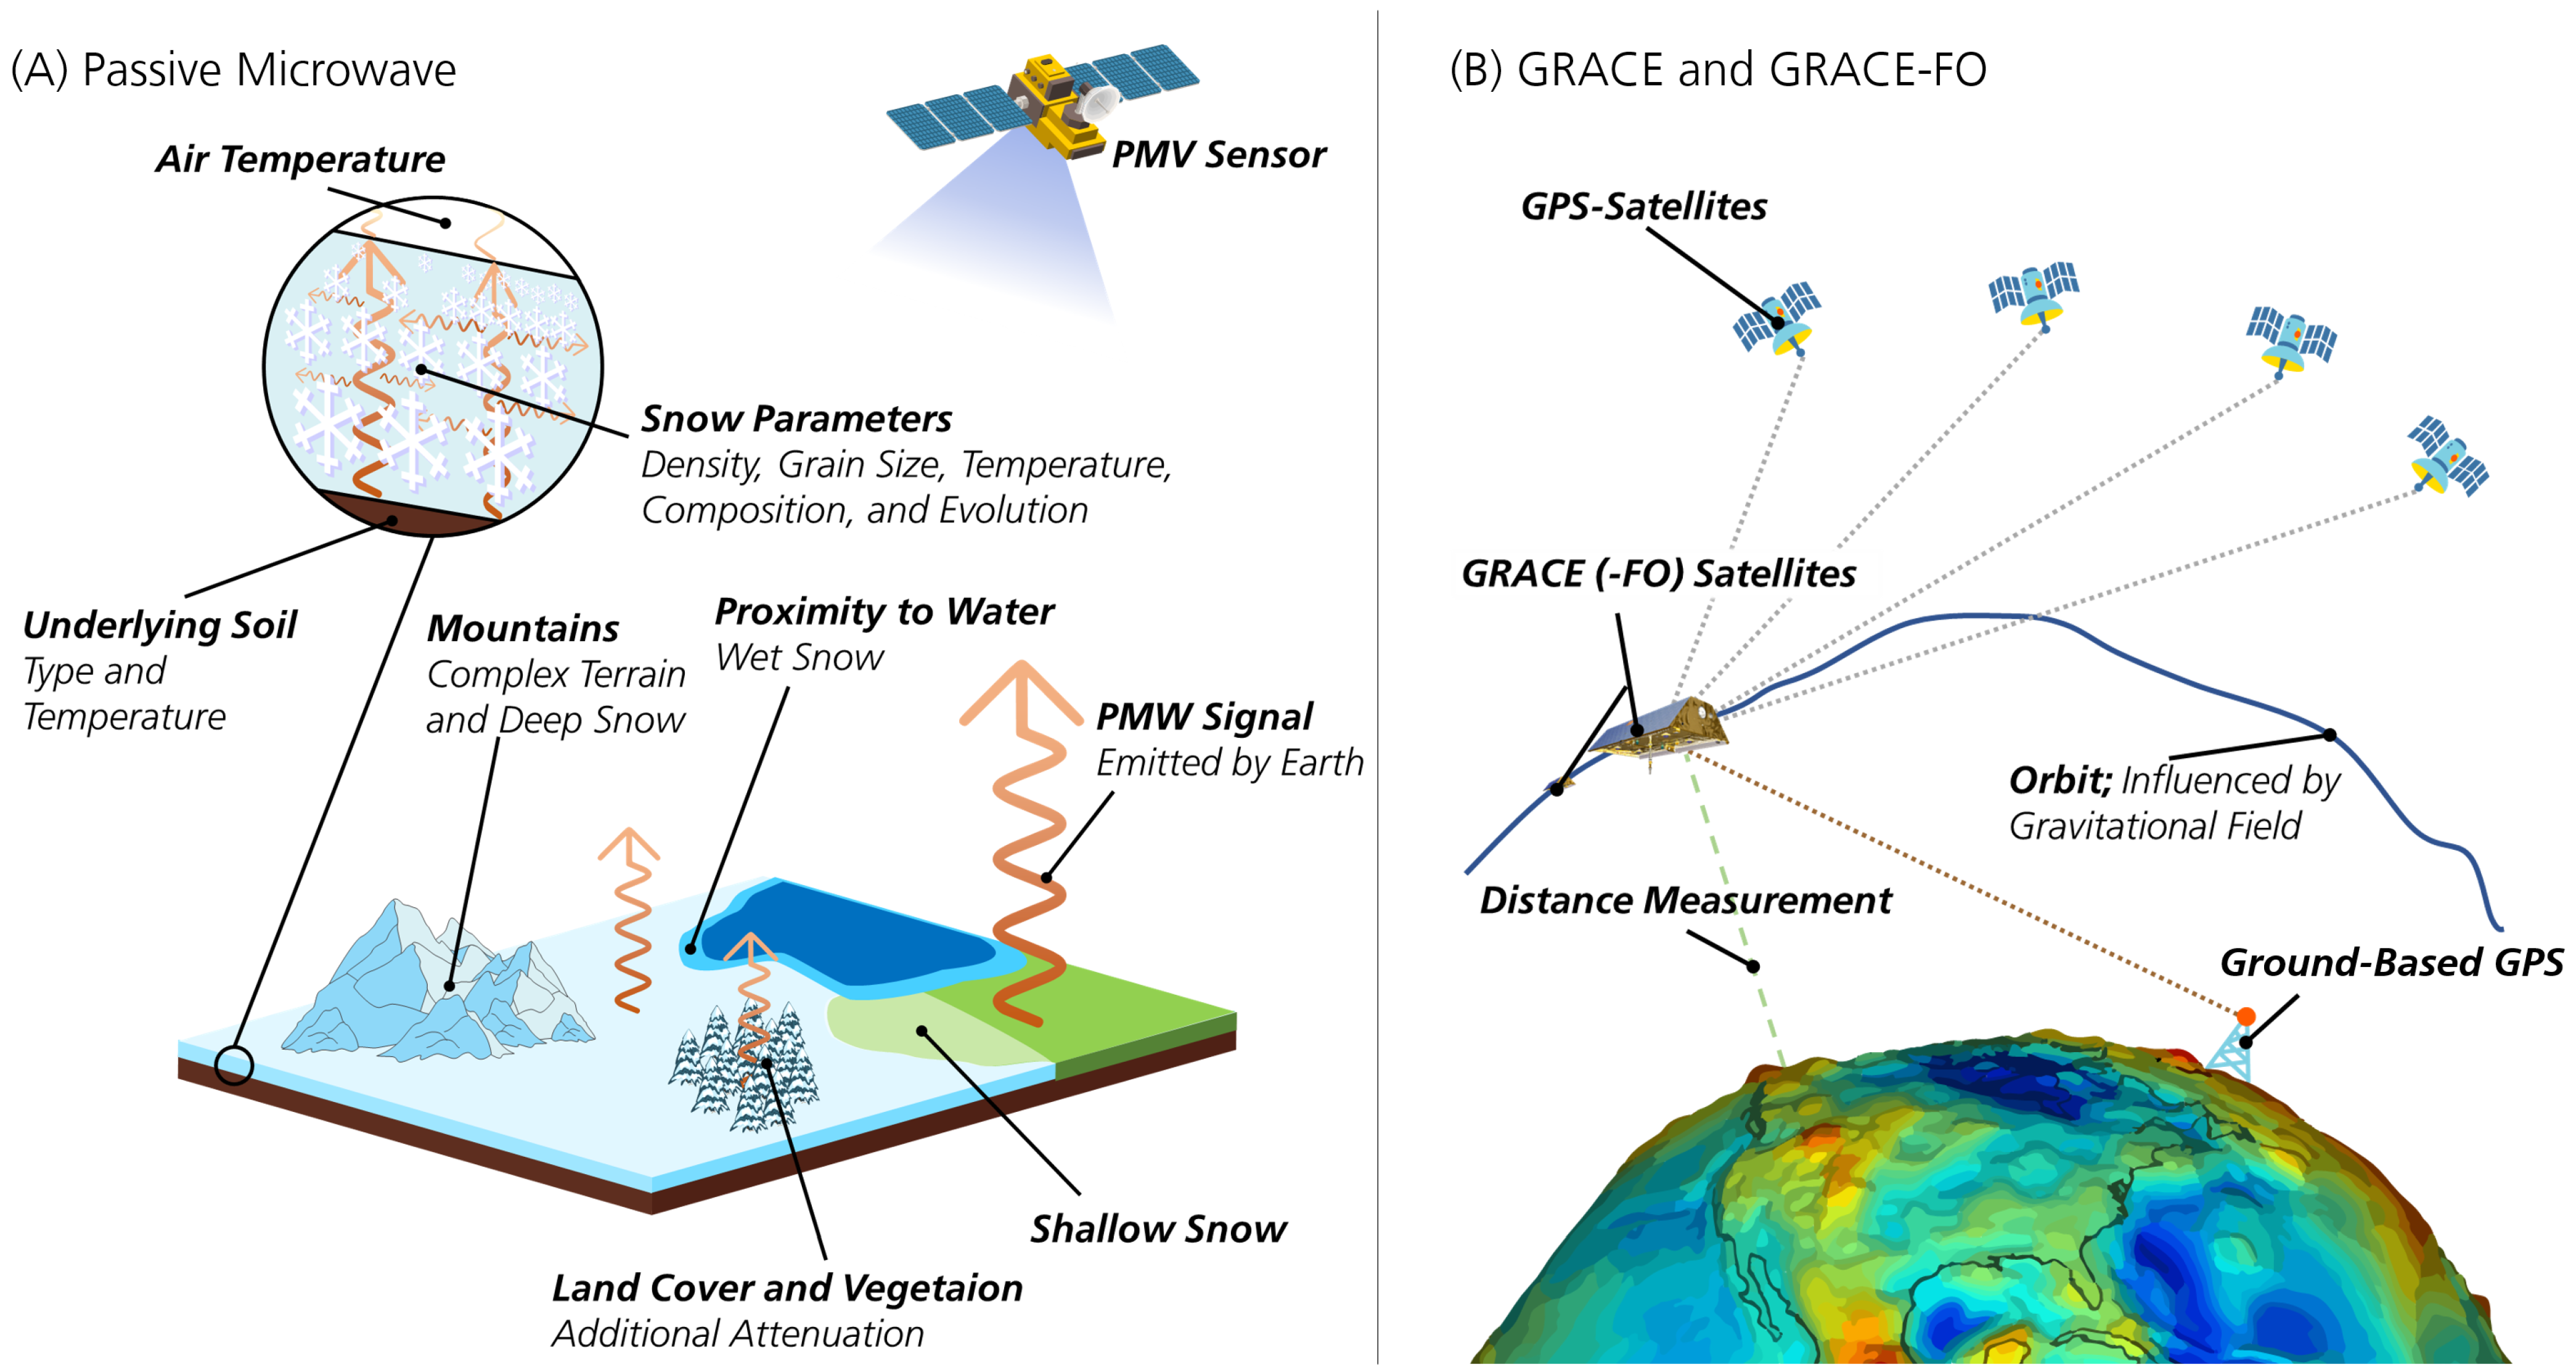
1.2. Measuring Snow Water Equivalent

As summarized in the previous section, snow is a crucial aspect for numerous fields. Therefore, it is essential to have exact estimates of how much snow can be found at which location. Snow can be measured using different means. A widely established method is in situ using measuring poles or ultrasound for SD and gauges for SWE [46,47]. Since the appearance of satellite remote sensing, snow can also be measured from space, with snow cover extent (SCE) being one of the first and most commonly derived parameters. While SCE can be determined as a binary variable (yes/no) from optical or synthetic aperture radar (SAR) data, for the determination of SD and especially SWE, various factors have to be considered [1,13,48]. For the estimation of SWE, there are three main spaceborne methods: passive microwave (PMW), gravimetric data, and SAR. There are also other, at least partly, spaceborne methods for SWE assessment such as Light Detection and Ranging (LiDAR) or the use of the Global Navigation Satellite System (GNSS). However, these methods are mainly employed airborne (LiDAR) [49,50] or use physical receivers on the ground (GNSS) [51,52] and are, therefore, not suited for the scope of this review and were not further considered. Within SAR, there are two different methods. Firstly, there is differential interferometry, using phase differences. This method, however, is still in a development stage, and there are no global or large-scale studies or products published to date [53,54,55]. The second SAR method uses radiative transfer models and backscatter (X- and Ku-band), is more advanced in its development, and delivers satisfactory results on small scales (e.g., catchment level), but has also yet to be proven suitable for hemispheric or global applications [56]. There is only one study that applied a variation of the backscatter method on C-band data to generate information on a global scale [57]. This method, however, has not seen widespread replication yet and is met with some reservation in certain other studies [58]. Based on the fact that barely any large-scale studies are published and also that SAR data from older missions are not employed in current SWE studies, we decided to exclude them from the review [59].
Secondly, SWE can be estimated using gravimetric data, mainly from the Gravity Recovery and Climate Experiment (GRACE) by the German Aerospace Center (DLR). GRACE measures the Earth’s gravity field by measuring the change of the position of satellites caused by gravity using the differential Global Positioning System (dGPS) [60]. As terrestrial water storage (TWS) and, thus, the accumulation of snow can change Earth’s gravitational field, these data can be used for TWS/SWE determination. Therefore, GRACE data are often combined with other datasets and used for modeling [61,62,63,64]. GRACE delivers data with a very low spatial resolution (300 km pixel), but due do its global coverage, it still offers possibilities for applications such as the estimation of drought or flood severity [20,65,66]. Even though data from GRACE are only available from 2000 [67], due to its global and large-scale applicability, we decided to include SWE-related studies that used GRACE or its successor GRACE-Follow On (FO) in this review.
Finally, the most common sensor type used for SD/SWE studies is PMW. Here, the difference in brightness temperature (Tb) between two frequencies, normally one around 18 GHz and one around 37 GHz, are compared to measure the attenuation of the snowpack to the microwave emitted by Earth [68]. From this, SD can be derived. To determine SWE, however, various snowpack variables, such as snow density or grain size, have to be considered [69]. To include these variables, various inversion algorithms are applied. Static algorithms use fixed values for snow density and grain size [68,70,71]. On the other hand, there are dynamic algorithms, which rely on additional information regarding these variables and adapt themselves locally [72,73,74]. In between the two are studies that use different parameters in a certain static algorithm based on a land-cover classification [75]. In addition to snow density and grain size, which have to be taken in to account, there are numerous factors that influence the accuracy of SWE estimates and have to be considered when using PMW data such as the saturation of Tb measurements in deep snow, complex terrain, land-cover classes, wet and shallow snow, or proximity to water bodies. A complete list of the factors and their implications based on our review is provided in Section 3.8. One main advantage of PMW as an SWE estimation method, also compared to SAR and GRACE, is the temporal data coverage. Since the launch of the Scanning Multichannel Microwave Radiometer (SMMR) by the National Air and Space Administration (NASA) in 1978, there has been continuous daily global coverage with PMW data. This means that PMW is currently the only spaceborne SWE estimation method that offers the possibility of long-term studies (>40 years) relying on daily observations, which might allow capturing snowpack changes induced by global warming. An overview of the SWE estimation methods, included in this review, is provided in Figure 2.
By including gravimetric and PMW studies, but excluding SAR, we wanted this review to focus on the large-scale examination of SWE to determine the influence of global warming on the worldwide snowpack. Unlike other recently published reviews [76,77], which mainly focused on the state of the PMW methodology, we, therefore, wanted to primarily focus on the application aspect of SWE estimation to mark the current state of research and identify potential research gaps, as well as potential new possibilities building on existing research and data.

2. Materials and Methods

For this review, we analyzed 168 peer-reviewed publications by classifying them according to 15 different variables. An overview of this methodological process is provided in Figure 3. The selection of the analyzed publications was based on a search for Science Citation Index (SCI) papers on the Web of Science (WoS) database using the criteria displayed in Table 1. The search string, which was applied to the title, abstract, and keywords, consisted of three main elements. Firstly, as we looked only for large-scale studies, the first element was concerned with geographical terms. Secondly, our interest was in SWE; thus, the search string was designed to only find studies concerned with SWE (or SD), but if possible, leaving out other snow variables as, for instance, SCE. Thirdly, we were only looking for studies that incorporated spaceborne data acquisition. Thus, the third element focused on looking for particular sensors and technologies (PMW and GRACE). Finally, to ensure an expedient and coherent search, we filtered by language, article type, impact factor, and date.
The initial search yielded 316 publications. To ensure that only publications complying with the above criteria were included in the review, we then manually filtered the search results. The filtering was based on four main criteria:
  • Study area size: Only studies conducted over an area of at least 500,000 km2 were included to comply with the large-scale character of this review. This limit was chosen as it frequently serves as a threshold for the classification of major river basins [78,79].
  • Data acquisition: Only studies that used data acquired by operational satellite missions were selected. Thus, all studies with solely experimental satellite data or airborne data were excluded.
  • Sea ice: Publications concerned with snow on sea ice were excluded.
  • Main focus: Only studies that examined either SWE or SD were included.
After the manual filtering, 151 publications remained in the review pool. To ensure the comprehensive character of the review, we conducted an additional overarching search using the literature research tool litmaps (litmaps.com, Wellington, New Zealand). We fed the initial search results into the litmaps algorithm, which searches for similar publications based on connectivity (references and citations of the provided publications). With this search, we found another 17 publications that complied with the previously defined criteria and were added to the review pool. Furthermore, we analyzed why these publications did not show up in the WoS search. This was mainly because the sensors were not mentioned in either the title, abstract, or keywords, but the final product that was used (e.g., [13]), or the article type did not match the initial search (e.g., [80]). Studies appearing in the overarching literature search, but published in a journal with an impact factor below 2.0 were not included in the review pool (e.g., [72]).
The 168 publications that were finally deemed relevant for this review were then studied and screened for information according to 15 categories: first author (and his/her affiliation), year published, journal, used sensors, used products/datasets, spatial extent and resolution, years and duration of analysis, temporal resolution, variables analyzed, main focus, methodology, and findings. The dataset resulting from this process provided a comprehensive picture of the ongoing research in the field of large-scale SWE monitoring, which is presented and discussed in the next sections.

3. Results

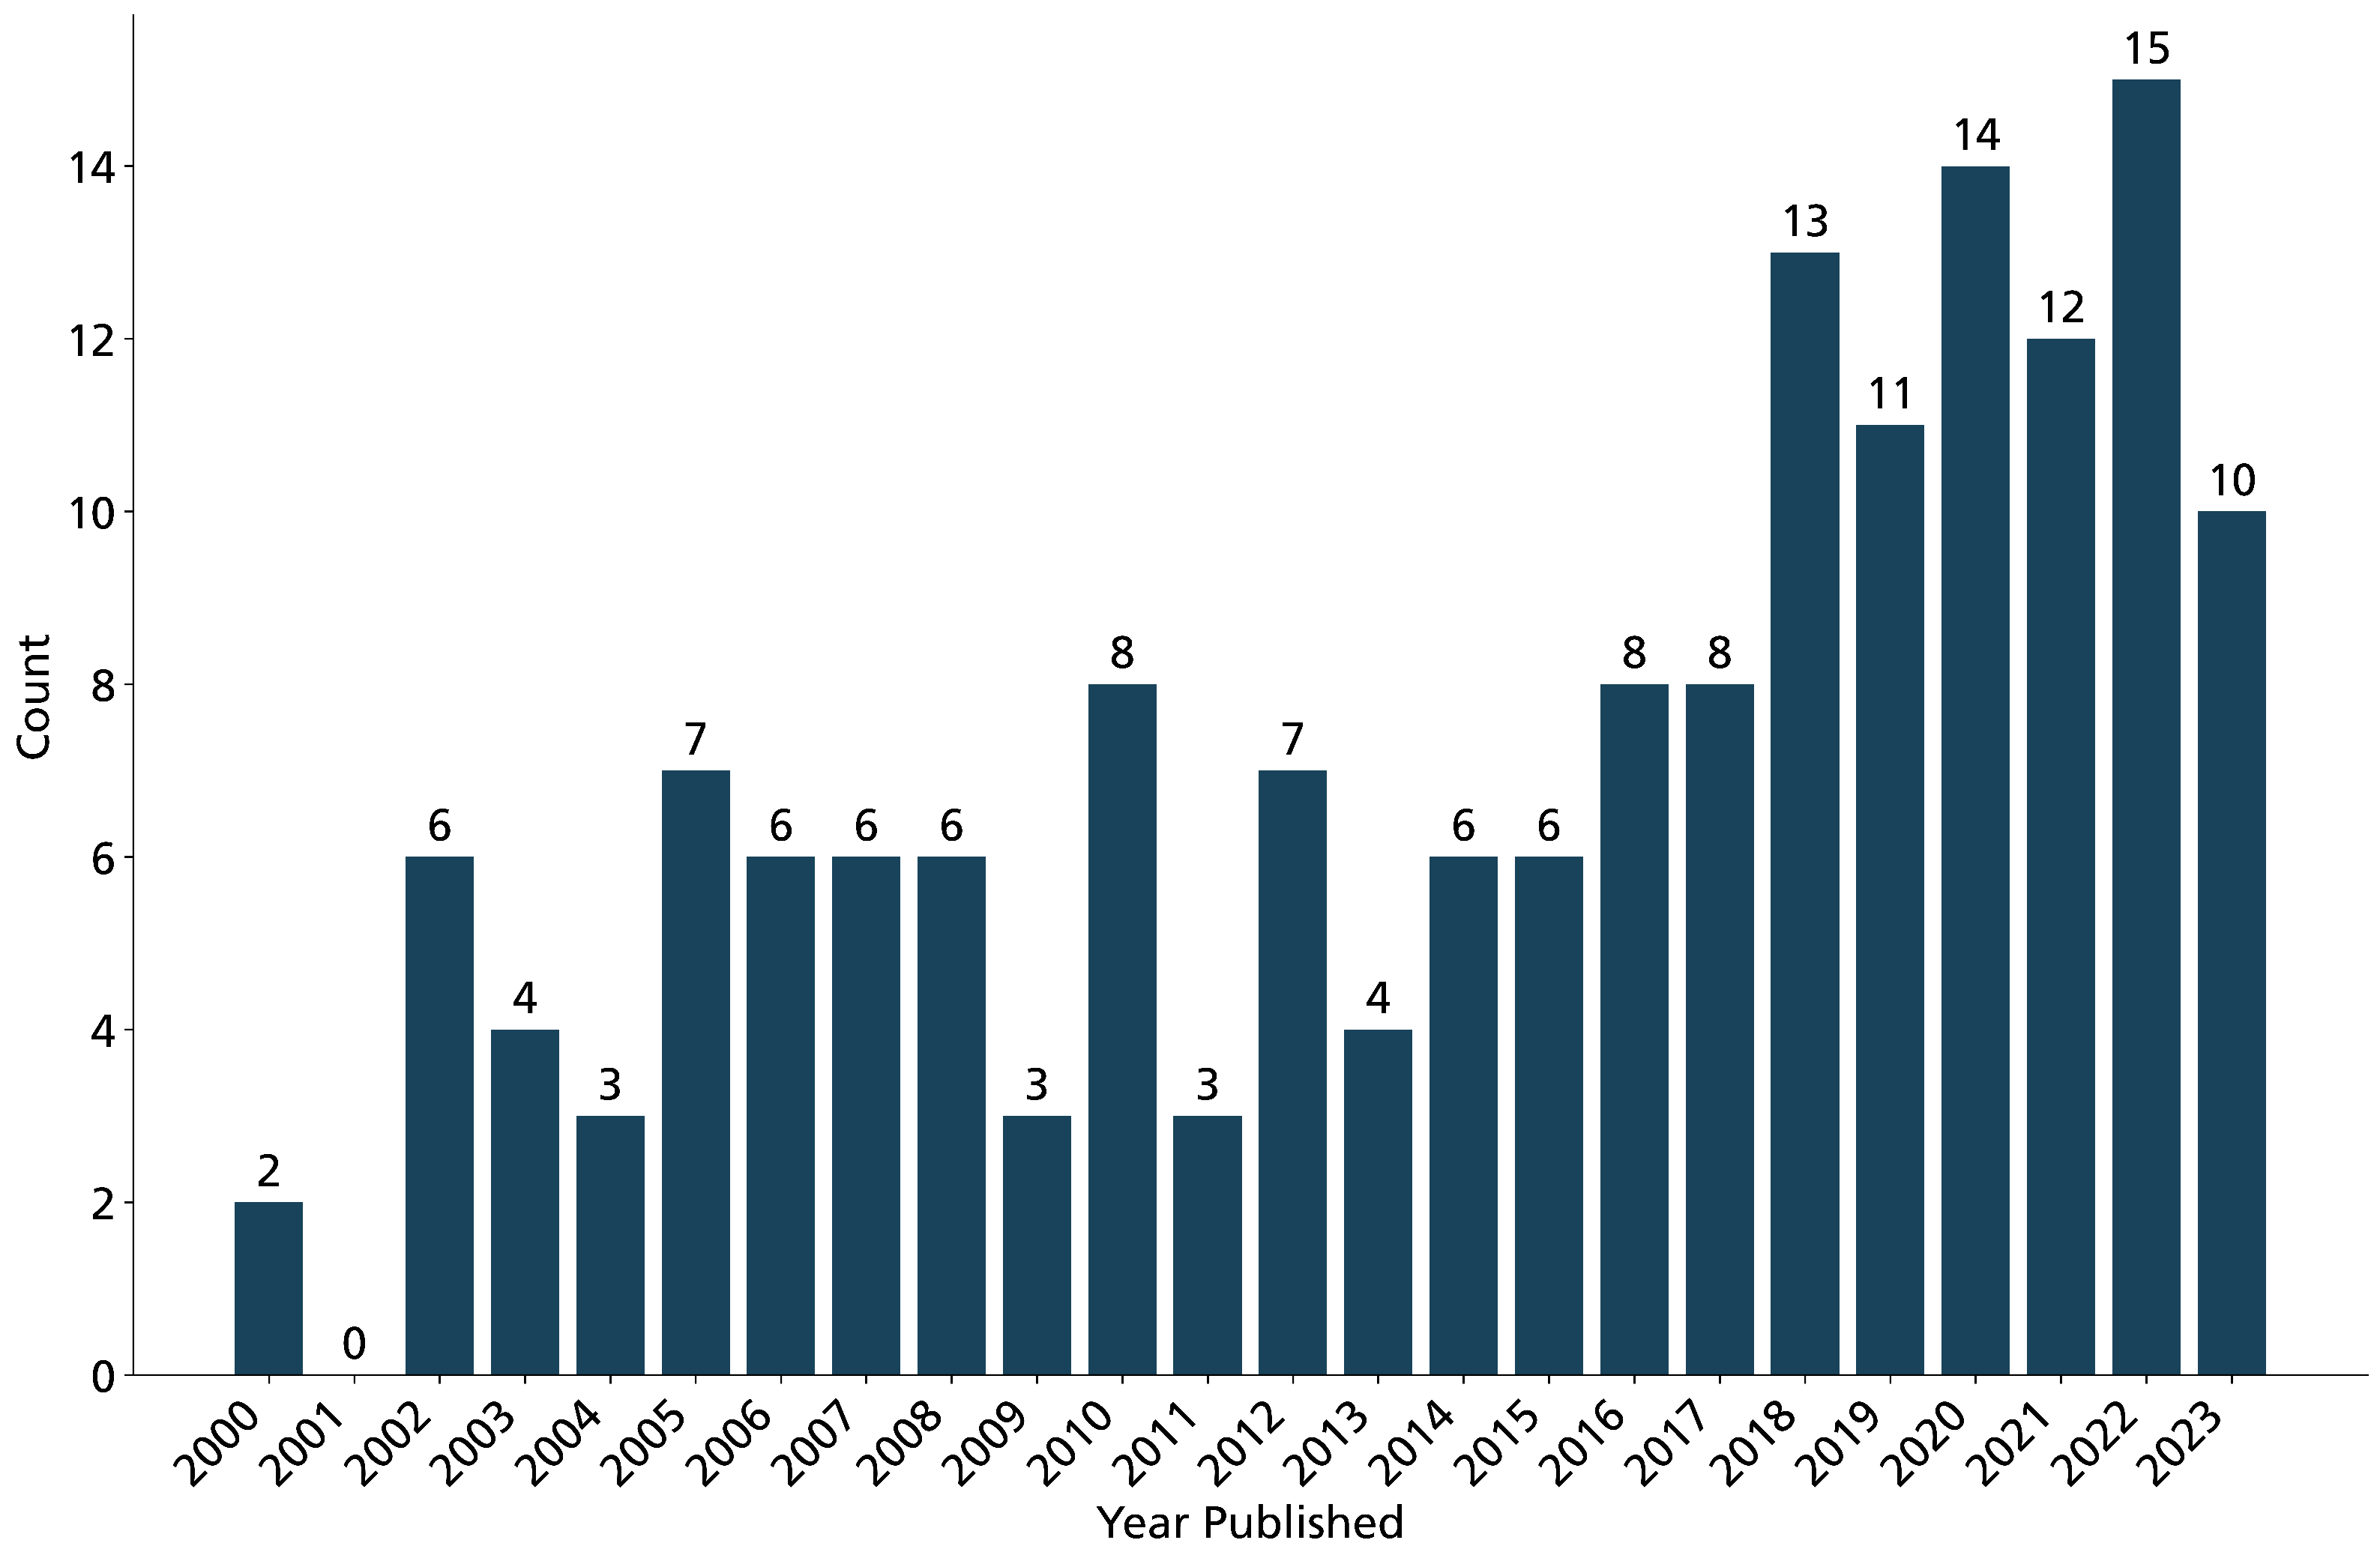
3.1. Quantitative Analysis of Publication Metrics: Temporal Distribution, Journals, and Author Affiliations

Research on spaceborne SWE measurement, particularly using PMW, has been ongoing for over 40 years [68,81]. Notably, the field, as defined for this review, has experienced significant acceleration in recent years. Figure 4 illustrates this trend, with half of the reviewed articles published from 2016 onwards, and a notable increase since 2018 (n = 74, 45%).
Concerning first author affiliation, as shown in Table 2, most publications were published by authors either affiliated in China (n = 59) or the USA (n = 58), followed by Canada (n = 20). European institutions contributed 27 articles, led by authors affiliated in France (n = 10) and Finland (n = 9). Asian countries outside China contributed three articles.
Regarding publishing journals, (see Table 3), Remote Sensing of Environment (n = 31) and Remote Sensing (n = 28) stand out as primary contributors, with over a third of the articles published in these journals. Additionally, 18 articles were published in remote sensing-focused journals, 36 in hydrology-focused journals, 15 in cryosphere research journals, and 5 in climate change-focused journals. One article [13] was published in Nature.

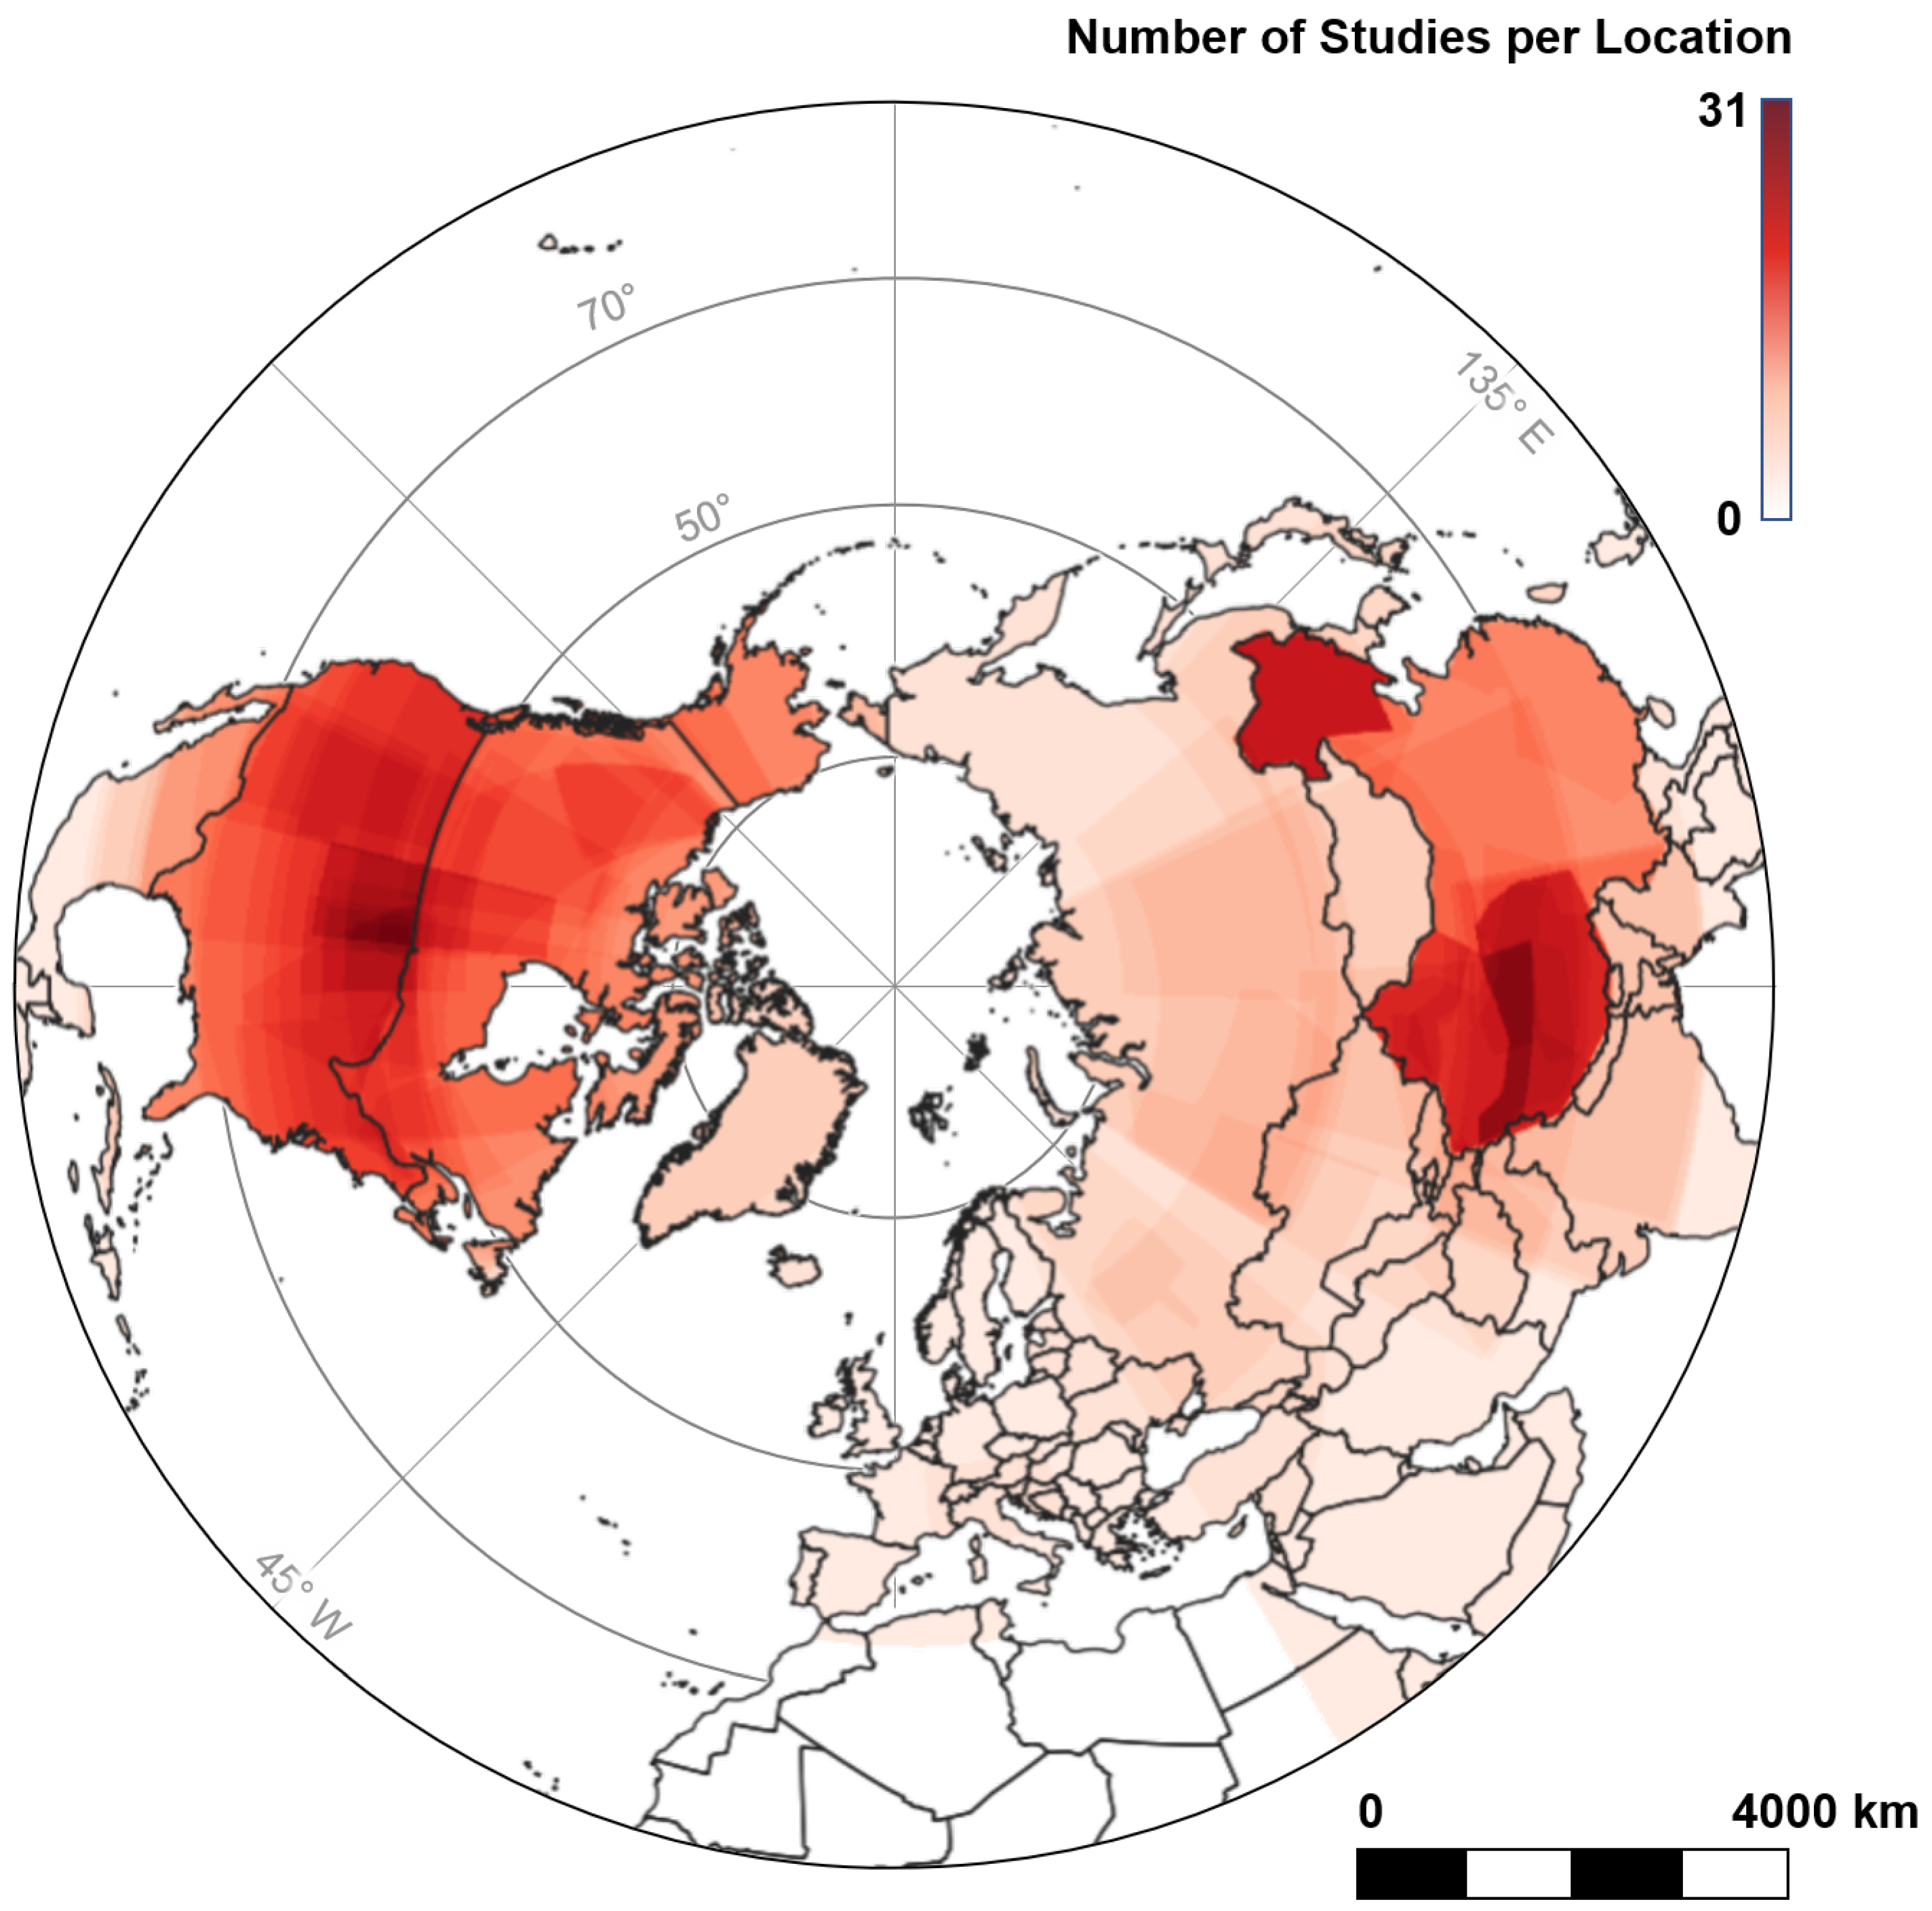
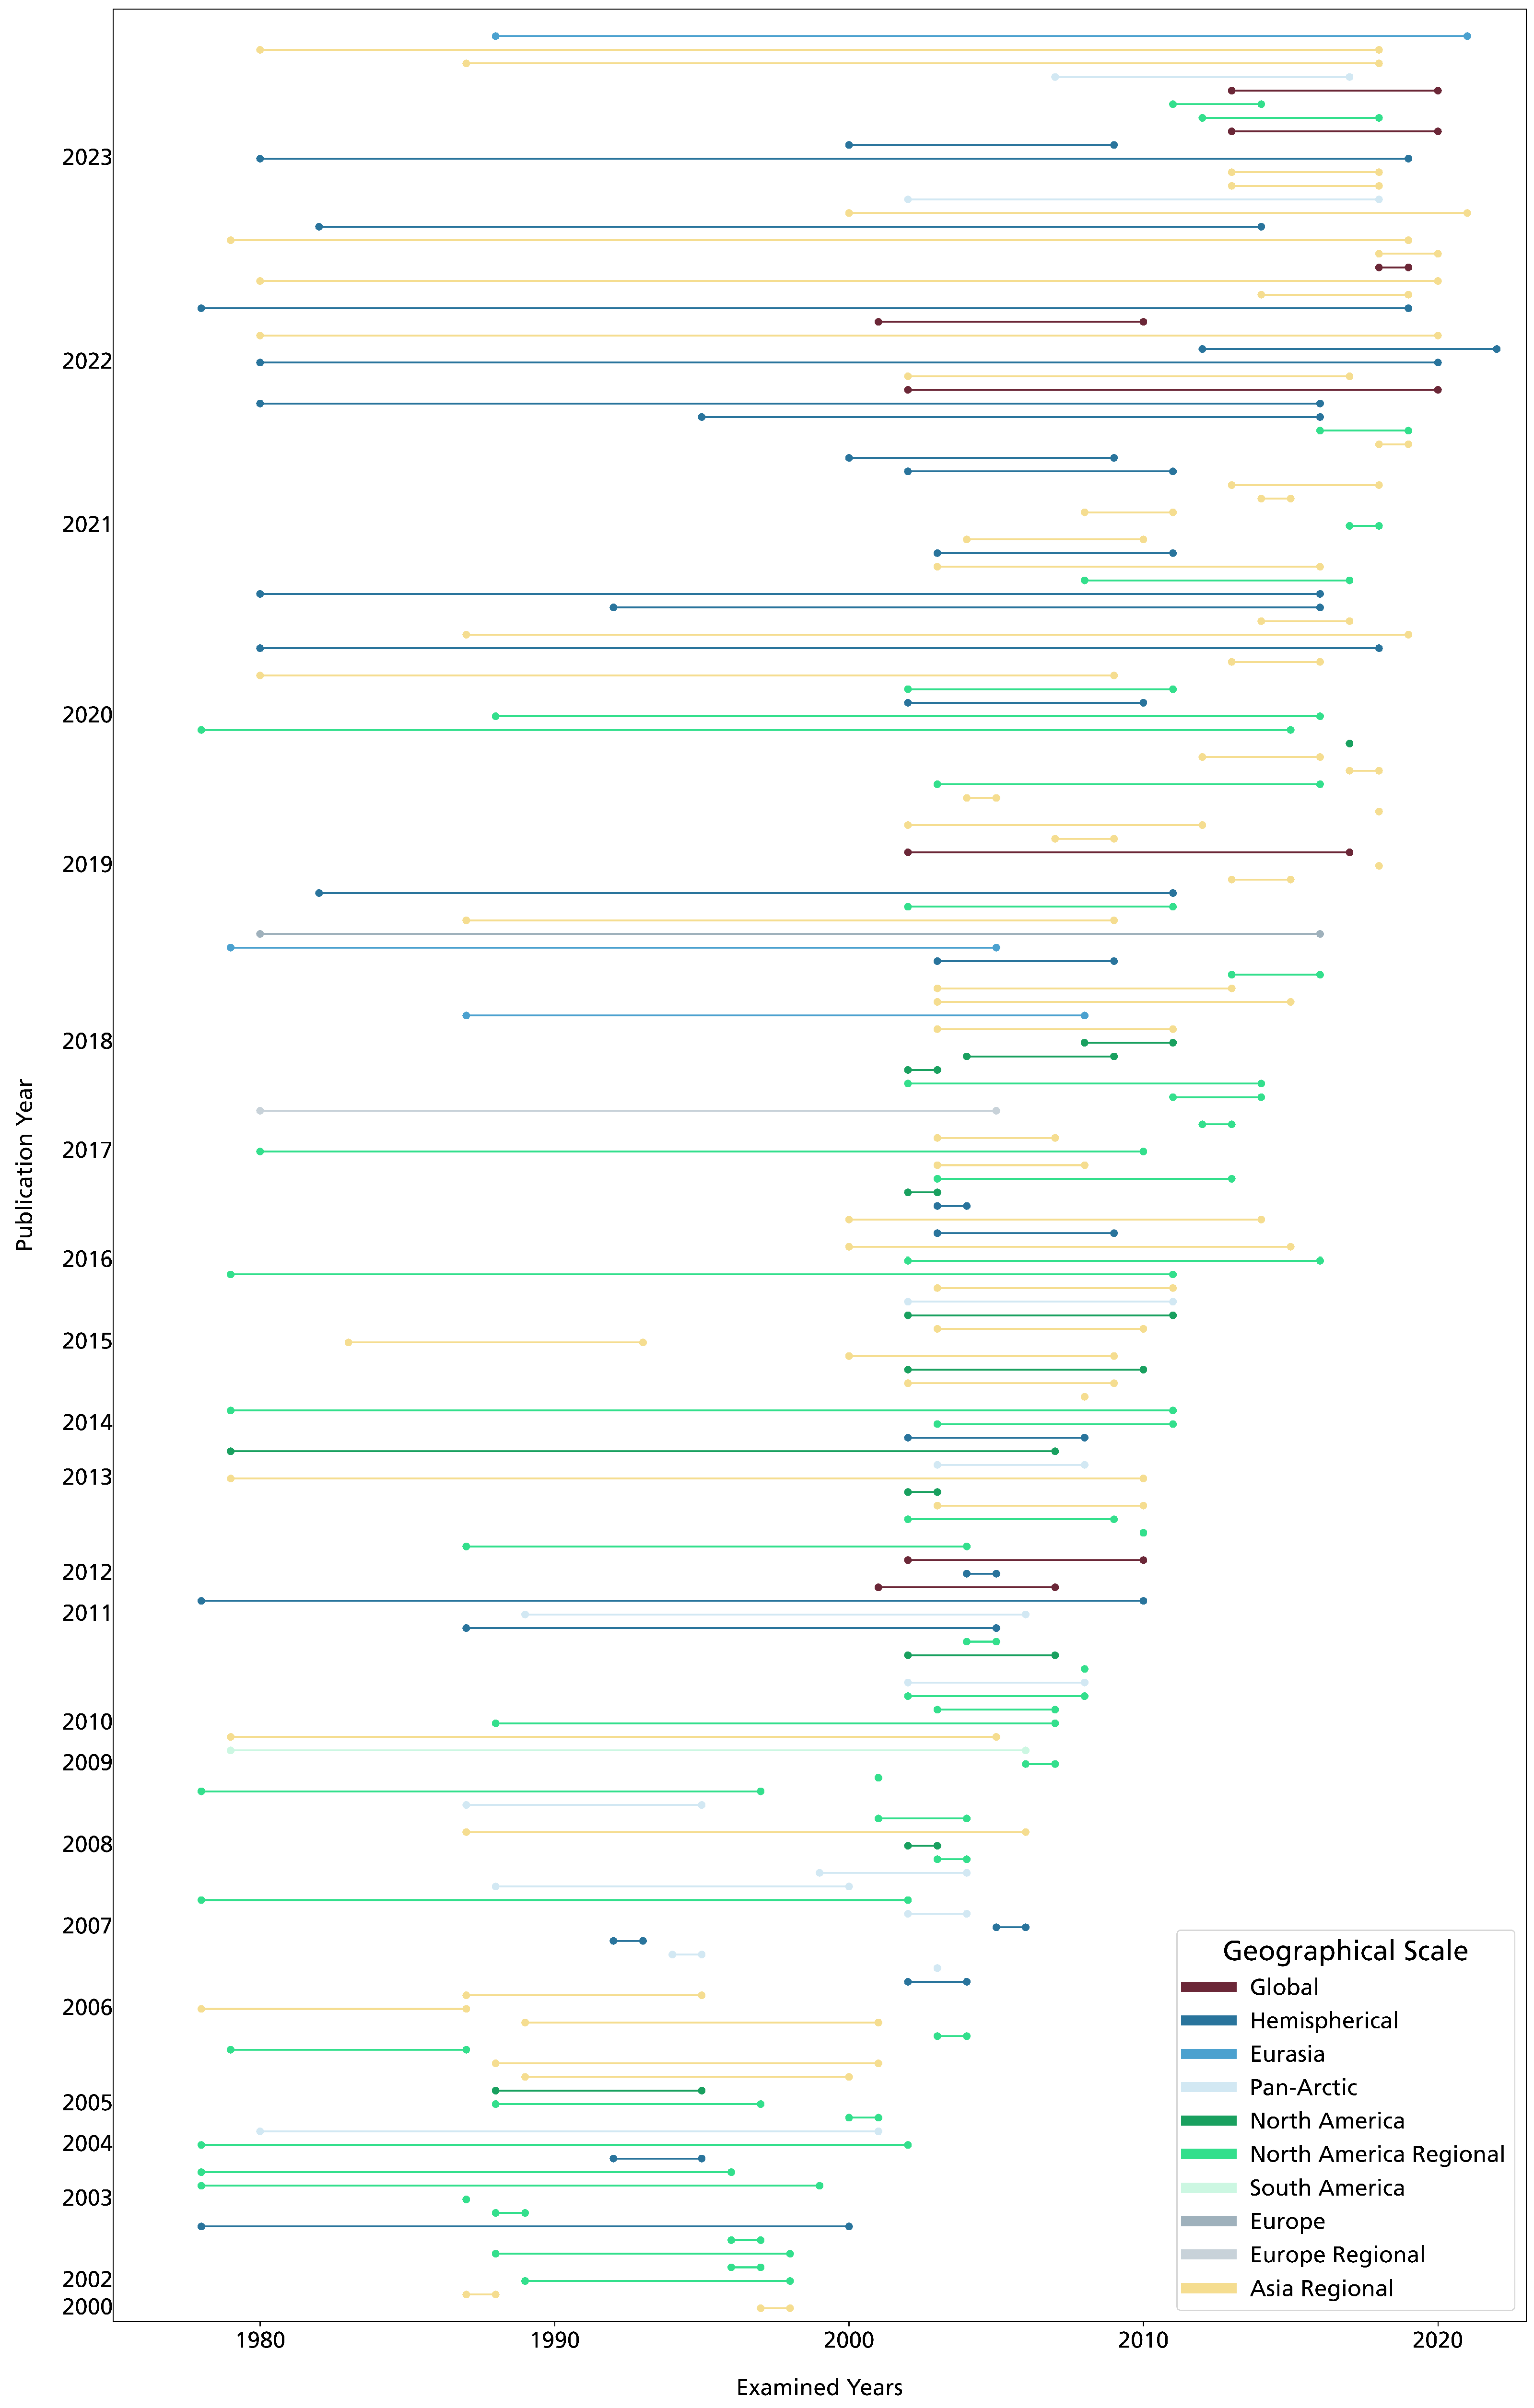
3.2. Spatial and Temporal Distribution of the Examined Studies

Figure 5 and Table 4 show which geographical regions were subject to the examined studies. It can be seen that certain regions are examined more often than others. Such frequently examined areas, which are not only covered as part of large-scale studies, but examined specifically, are for instance the Great Plains in North America [73,82,83,84,85,86,87], sometimes as part of studies covering Central North America [46,75,88,89,90,91,92], or the USA [93,94,95,96,97,98,99]. Another often-applied study area is the Tibetan Plateau in Asia [100,101,102,103,104,105], also sometimes as part of studies conducted over High-Mountain Asia (HMA) [106,107,108,109]. Also often examined is the Mackenzie-Basin in Canada [110,111,112,113,114] or Northwestern China [63,115,116,117,118,119,120]. Overall, the most often-applied study area is the Northern Hemisphere [13,44,121,122,123,124,125,126,127,128,129,130,131,132,133,134,135,136,137,138,139,140,141,142,143,144,145]. Other multi-continental studies covered the entire globe [146,147,148,149,150,151,152,153], Pan-Arctic regions [62,154,155,156,157,158,159,160,161,162,163,164,165], or Eurasia [166,167]. While one continental-scale study was conducted over Europe [168], most of them covered North America [74,169,170,171,172,173,174,175,176,177,178,179]. In addition to various regional studies in North America and Asia, one regional study in Europe (Alps) [180] and one in Greenland [181] and in South America (Andes) [182] also met the requirements of the review.
Looking at the geographical distribution of authors conducting research in different regions (Table 4), it is evident that the majority of authors conduct studies in their home regions. Asian-affiliated researchers primarily focus on research in Asia, while North American-affiliated researchers predominantly concentrate on North America. However, there are exceptions to this trend. For example, European-affiliated researchers have conducted studies in Asia [108,109,183,184,185,186]; American-affiliated researchers have explored regions in Asia [106,107,187,188,189]; Chinese researchers have examined study areas in North America [190,191]. Affiliation at the time of publication was considered for this analysis.
With the analysis of the spatial distribution displayed in Figure 5, it also becomes evident that some regions that have expectedly high volumes of snow [13,125,132] are underrepresented. Such areas, for example, are Europe (n = 2) [168,180], Afghanistan (n = 1) [187], or Central Asia (including Pakistan, Iran, Turkmenistan, Azerbaijan, Tajikistan, Kyrgyzstan, or Kazakhstan), which, while sometimes partly covered in studies covering the HMA (e.g., [106,107,109], also features only one dedicated study [189].
Finally, Figure 6 shows the temporal coverage of the examined studies. Thereby, it can be seen that the earliest coverage started in 1978, the year when the SMMR sensor was launched [46,47,75,90,94,123,139,145,192,193]. Moreover, it becomes apparent that the commencement of coverage frequently coincides with the launch of specific sensors. In addition to the aforementioned SMMR in 1978 (n = 10), this mainly applies to the Special Sensor Microwave/Imager (SSM/I, n = 10) in 1987 [91,109,140,159,167,185,188,189,194,195,196,197], the Advanced Microwave Scanning Radiometer for Earth Observation (AMSR-E, n = 27) [61,82,88,101,107,110,111,129,131,137,142,150,151,152,155,156,158,162,172,173,174,175,177,179,198,199], and the Advanced Microwave Scanning Radiometer 2 (AMSR-2, n = 4) [103,126,200,201]. The average coverage duration is just under 9.5 years with the longest study covering 41 years (1978–2019) [123], while some studies only examine a few months or one winter season [91,164,169,202,203,204,205,206,207].

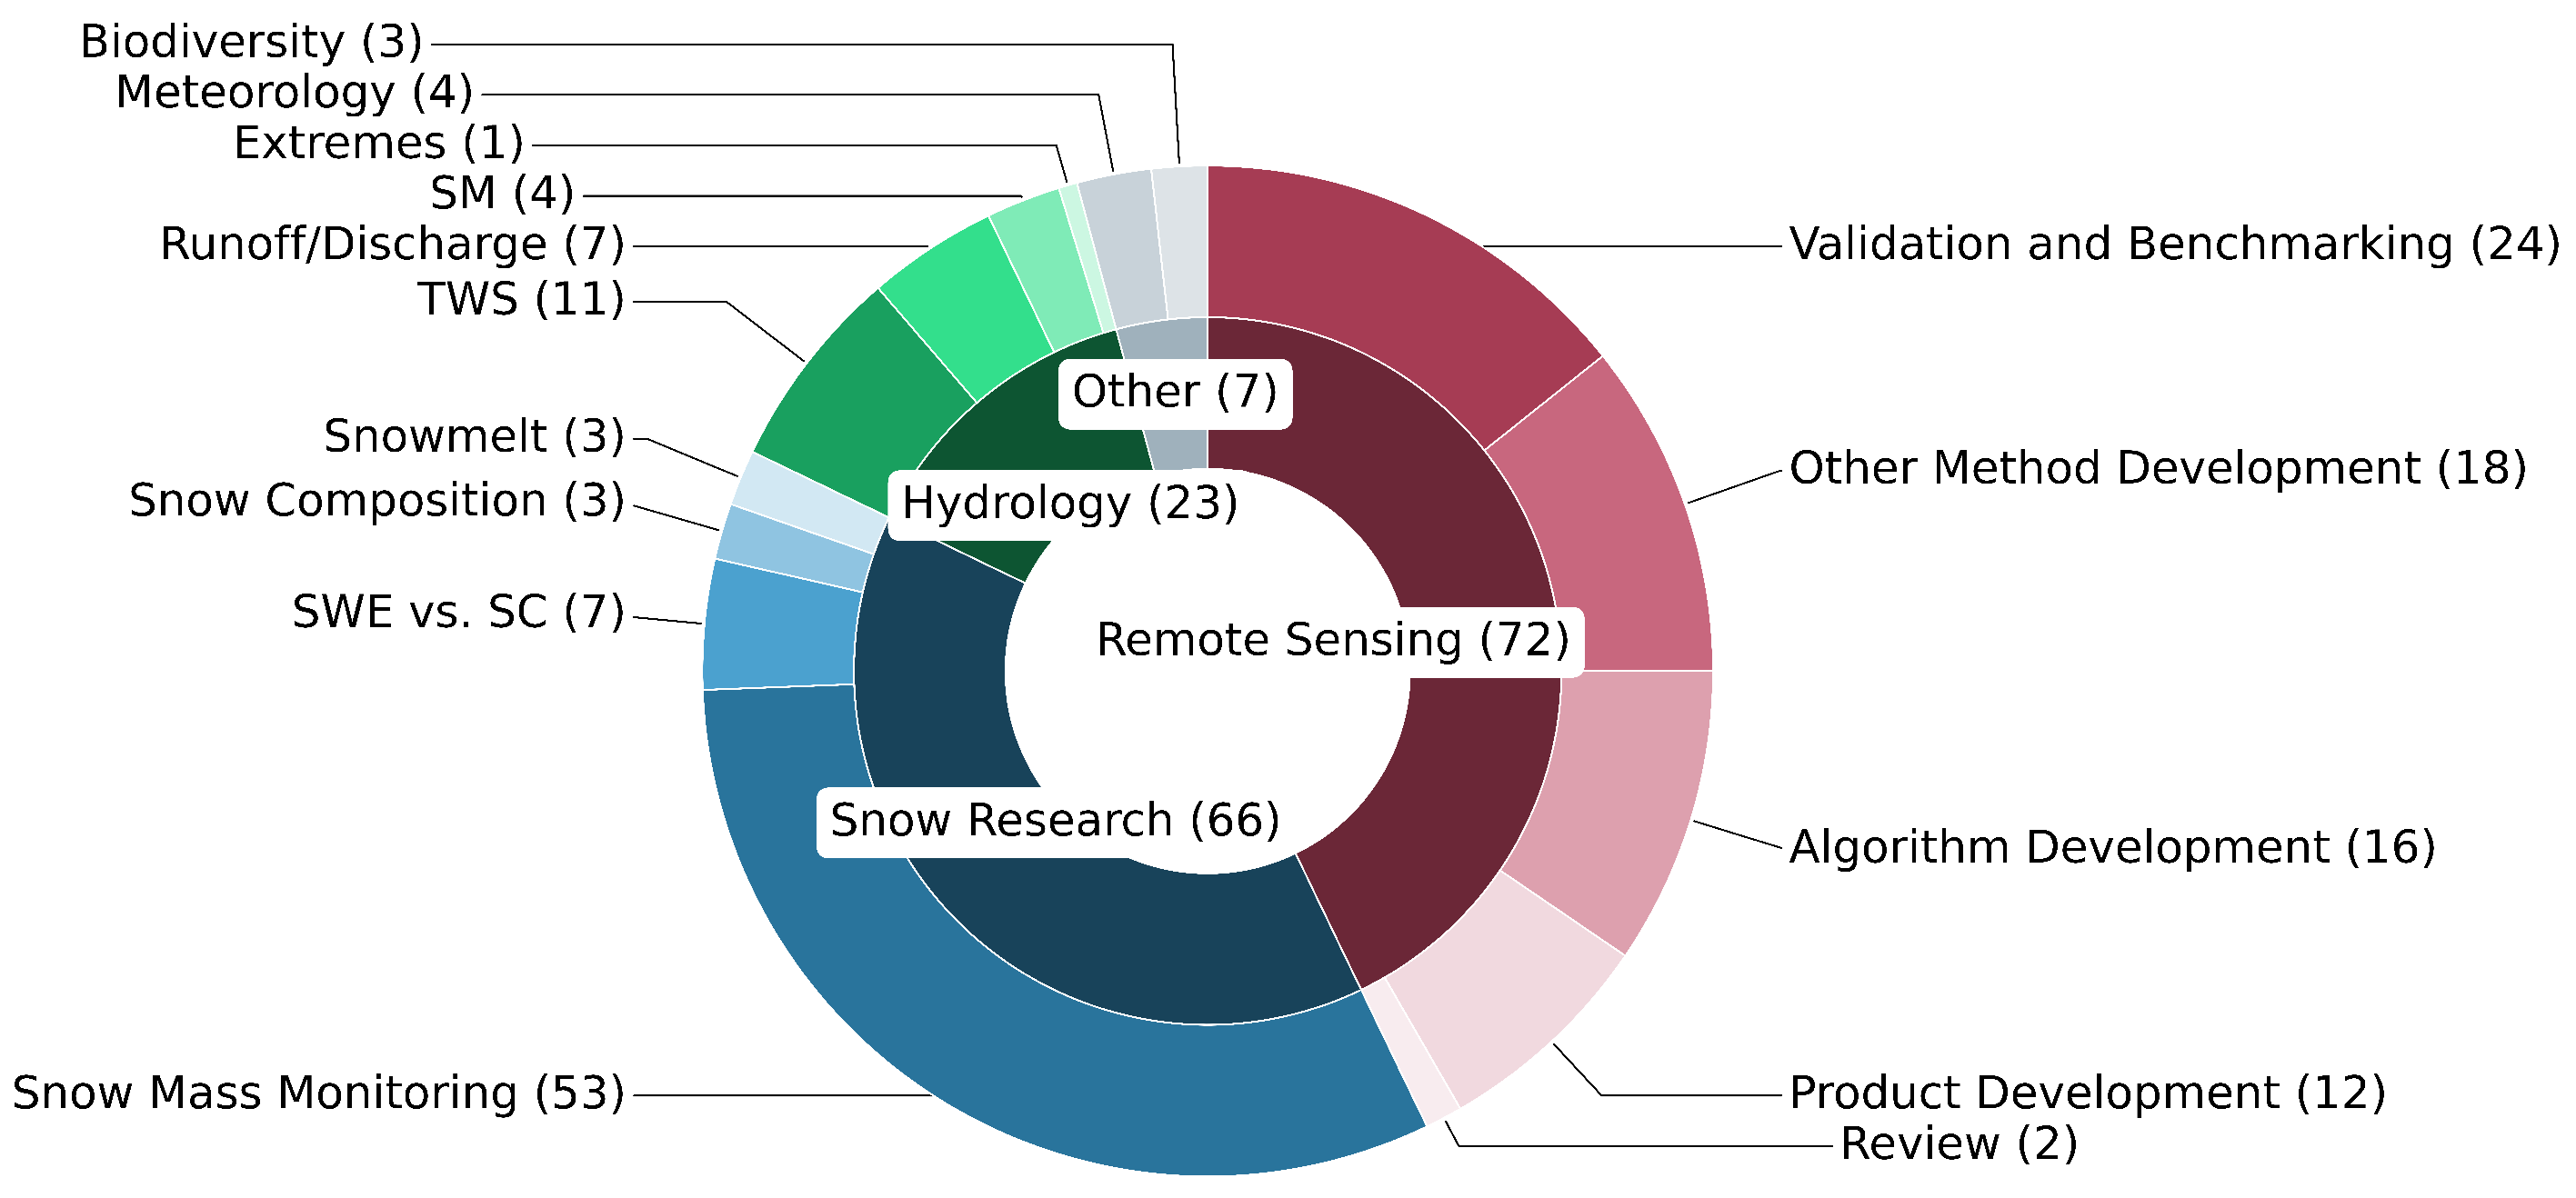
3.3. Examined Topics

Analyzing the main foci of the reviewed studies and, thus, the topics that were examined, it was found that nearly one-third of the studies (n = 53) were concerned with some form of snow mass (SWE/SD) monitoring. Additionally, a series of publications is concerned with methodological development such as the development of new products (n = 12) or algorithms (n = 16), as well as the validation of those new developments and existing methods (n = 24). Otherwise, the studies were spread over various topics in the areas of hydrology (n = 23), meteorology (n = 4), or biodiversity (n = 3). An overview of this analysis is shown in Figure 7. In this figure, the categories review (n = 2) and other method development (n = 16) are included as well. The applied search string and the subsequent selection of publications for this review (see Section 2) were not designed to include review papers. However, the two reviews, featured in Figure 7, specifically focused on the applicability of PMW for SWE in a global context [140] or available data on a global scale [138] and were retained in the review. Publications categorized as other method development are normally concerned with the further development and improvement of existing methods. In doing so, they focus on a wide range of issues such as the influence of snow characteristics [143,164], forests [171,208], weather [130], or reflectance [118] on SWE estimation, as well as inter-calibration of sensor data [207,209].
Even though SWE monitoring enables hydrological investigations based on snow, studies with a hydrological focus make up only about 14% (n = 23) within the reviewed studies. Within the hydrology portion of the reviewed studies, TWS studies make up the largest portion (n = 11). These studies are all studies using GRACE/GRACE-FO data, serving one of the main purposes of these sensors [60]. All these studies, except one [63], which uses a neural network (NN), follow a modeling approach in the manner of Yin (2022) [67], where multiple datasets (e.g., GRACE, reanalysis data) are fed into a model and, then, the different TWS components such as SWE, soil moisture (SM), or ground water storage (GWS) are calculated. Although the TWS studies vary in spatial and temporal coverage and study design, they all agree on general trends, mainly on the shift to earlier snowmelt and, thus, changed requirements for water resource management. A smaller portion of the hydrology-focused studies (n = 7) looked at snowmelt runoff and river discharge related to SWE. There are also three studies classified as snow research that focused on snowmelt. We distinguished these from the hydrological studies as they did not use any kind of hydrological station data (river discharge measurements or similar) [168,210,211]. Most of the seven hydrological discharge studies are similarly designed, comparing SWE data with discharge data to gain information on how SWE translates to water in a river basin [110,113,161,212,213]. There are also exceptions such as [94], where a data-assimilation system was developed as a part of a climate assessment, or [62], which uniquely among the reviewed studies also looked at the contribution of SWE and snowmelt to sea level rise; however, it found no statistically significant contribution. Generally, however, all runoff studies confirm the trends of earlier snowmelt and the implicit alterations in peak streamflow. Other hydrological studies are focused on SM (n = 4) [134,152,165,214]. All these studies modeled SM as part of TWS and looked at the influence of the snowpack on SM. Besides acknowledging the general relationship of SWE and SM, as well as the complex interactions between those parameters and also soil temperature, the studies differ largely in design and time, hindering further overall conclusions.
Also, one hydrological study that used SWE in connection to a drought [97] was classified in the subcategory extremes.
Finally, there are seven studies that were not classifiable in the three large categories and, thus, classified as other. There were four studies focusing on meteorology, among which two were focused on snowstorms [204,205], one on temperature prediction [136], and one on snow precipitation as a part of TWS [215]. As the meteorological studies vary considerably in study design, no general statements can be derived. The three remaining studies examined biodiversity, all of them investigating the role of snow in vegetation growth mechanisms in arctic regions [44,157,186]. All these studies found significant associations between snow parameters (such as SWE, SD, or snowmelt timing) and vegetation activity (measured by indices like the NDVI and vegetation greenness). They observed that variations in snow dynamics influence the timing and vigor of vegetation growth, suggesting that snow plays a crucial role in regulating ecosystem processes. They, however, also agreed on the high spatial heterogeneity of these relationships and, thus, the need for locally adapted research.

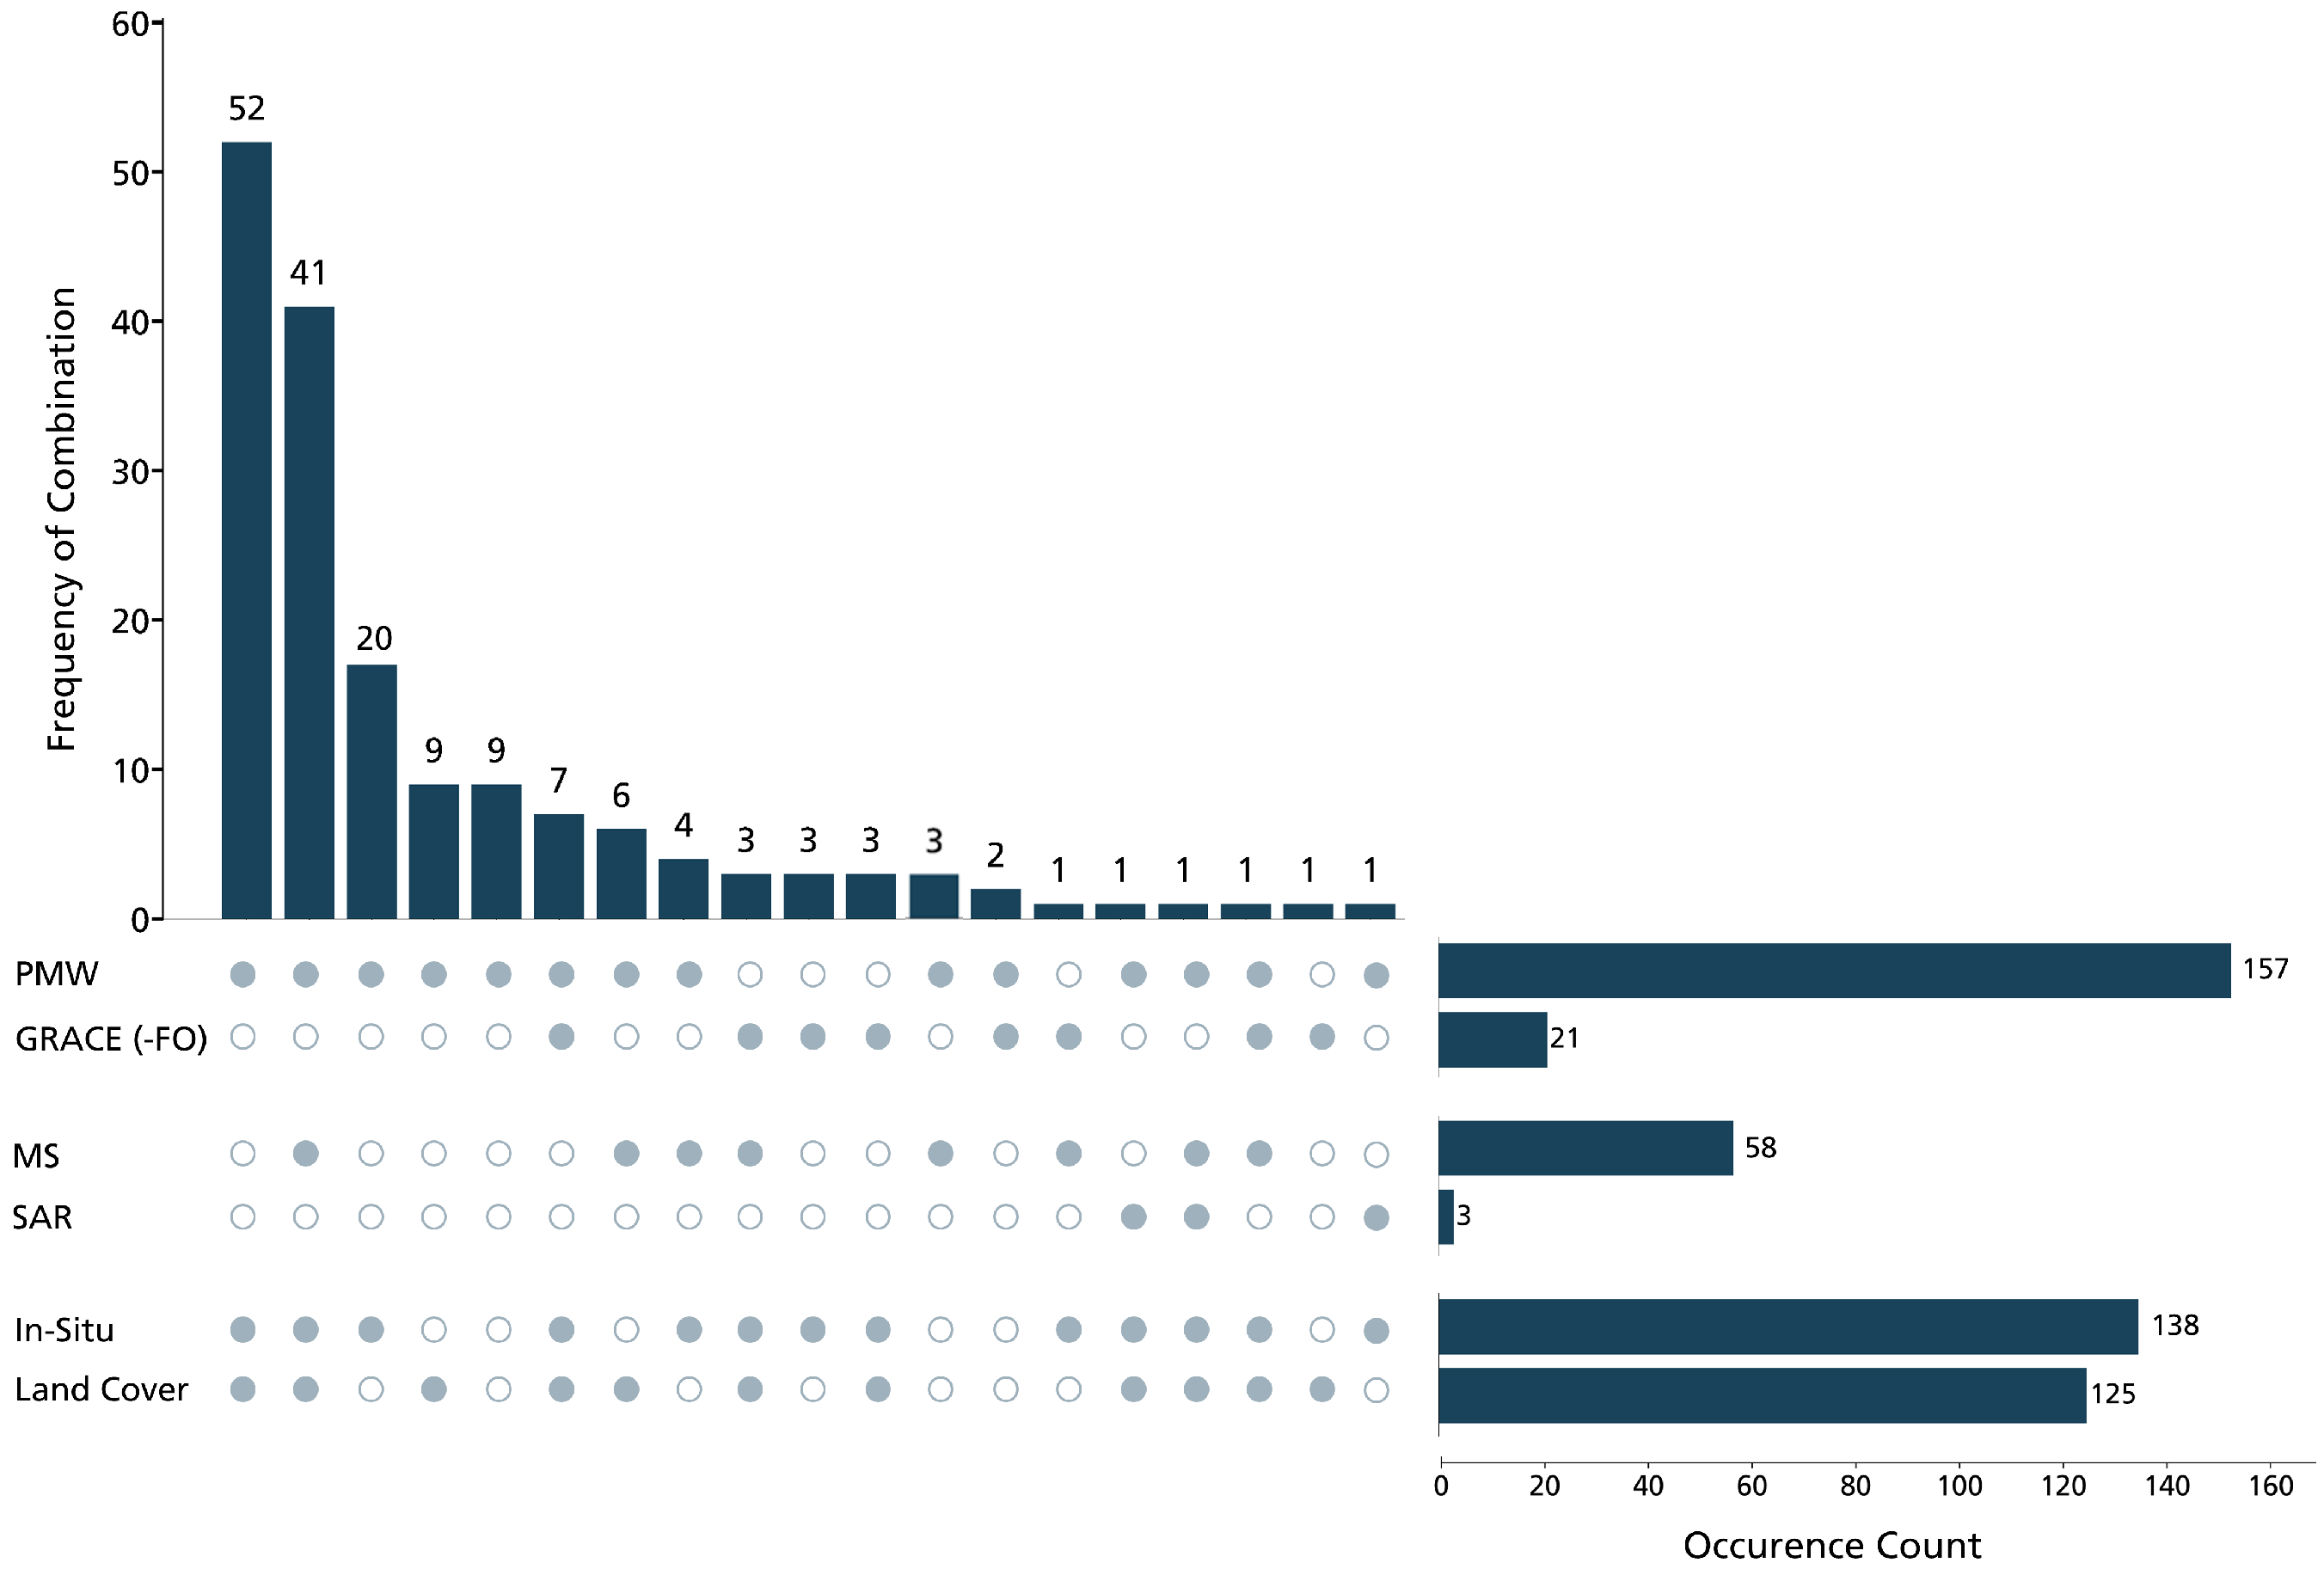
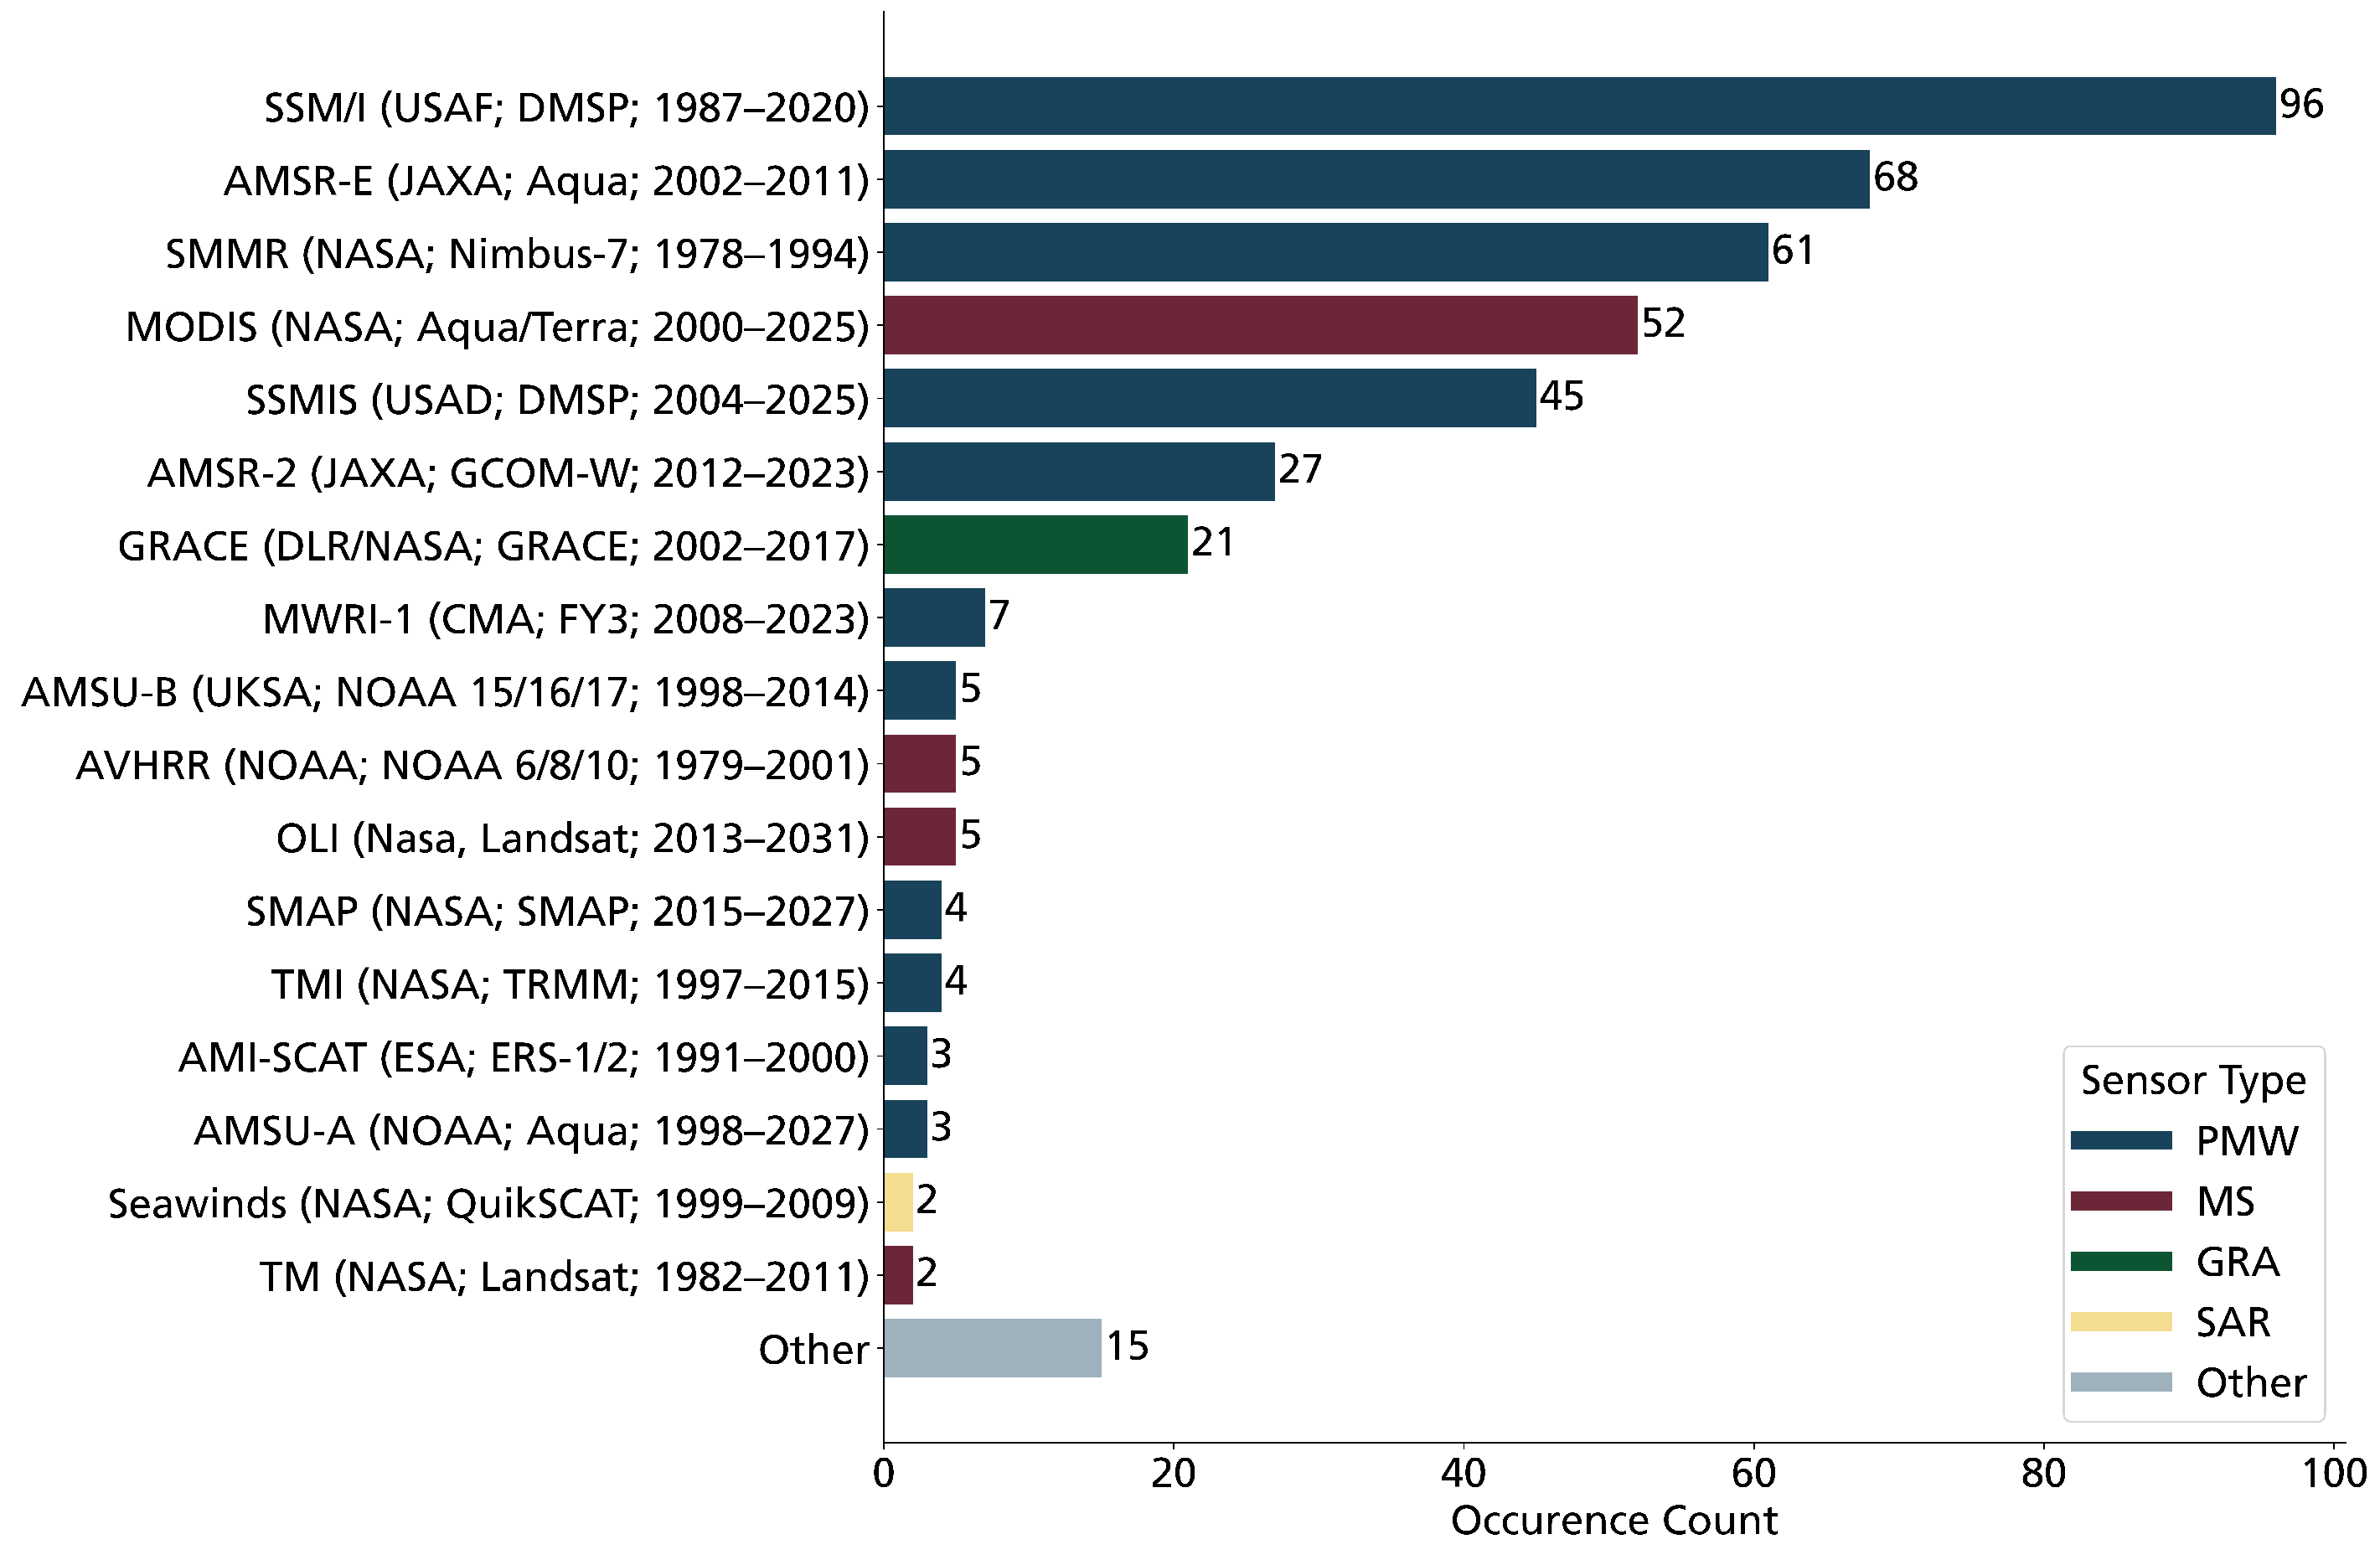
3.4. Utilized Sensors and Data

Although we used a search string to limit the sensor types to enable a targeted search, a variety of sensors and auxiliary data were used in the examined studies. An overview of these applied sensors and data can be found in Figure 8 (data types) and Figure 9 (sensors). We found that a majority of the reviewed studies employed PMW data with some kind of land-cover data and in situ data (n = 93). In addition, there are studies that combined PMW solely with in situ data (n = 20) or solely with land cover data (n = 9). Counting the studies that combine PMW with other auxiliary data (n = 16), there are 148 studies that employ PMW data with some kind of auxiliary data, whereas only 9 studies rely on PMW data exclusively. Besides the three most frequently employed spaceborne data sources (PMW, multispectral (MS), and gravimetric), there are three that employ SAR data. Two of them used data collected by the Quick Scatterometer Mission (Seawinds) by NASA [153,160], and one study used data collected by the synthetic aperture radar (C-band), also known as SAR-C, by the European Space Agency (ESA) [216]. Looking at the utilized sensors overall, the majority of the employed sensors are PMW sensors. It also becomes evident that the most frequently employed senor is not the one that was operational first (SMMR, 1978), but rather the SSM/I, which was launched nine years later. At second position ranks the 2002-launched AMSR-E. The most used sensor that is not a PMW-sensor is the Moderate-resolution Imaging Spectro-radiometer (MODIS), which is an MS sensor launched by NASA in 2000. MODIS-derived land-cover products were used in 30 of the reviewed studies (e.g., [137,217]). GRACE was used in 21 studies; however, its successor mission, GRACE-FO, launched in 2018, was only used in one study during our review period [150]. Besides the most frequently used PMV sensors (SSM/I, AMSR-E, SMMR, SSMIS, AMSR-2), also, multiple other PMW senors were occasionally employed. However, these data are usually used in combination with data from the main sensors just mentioned. There are only two studies that rely entirely on data not collected by the aforementioned main sensors or GRACE. Both of these studies rely on the Advanced Microwave Sounding Units A and B (AMSU-A and AMSU-B) [141,202].

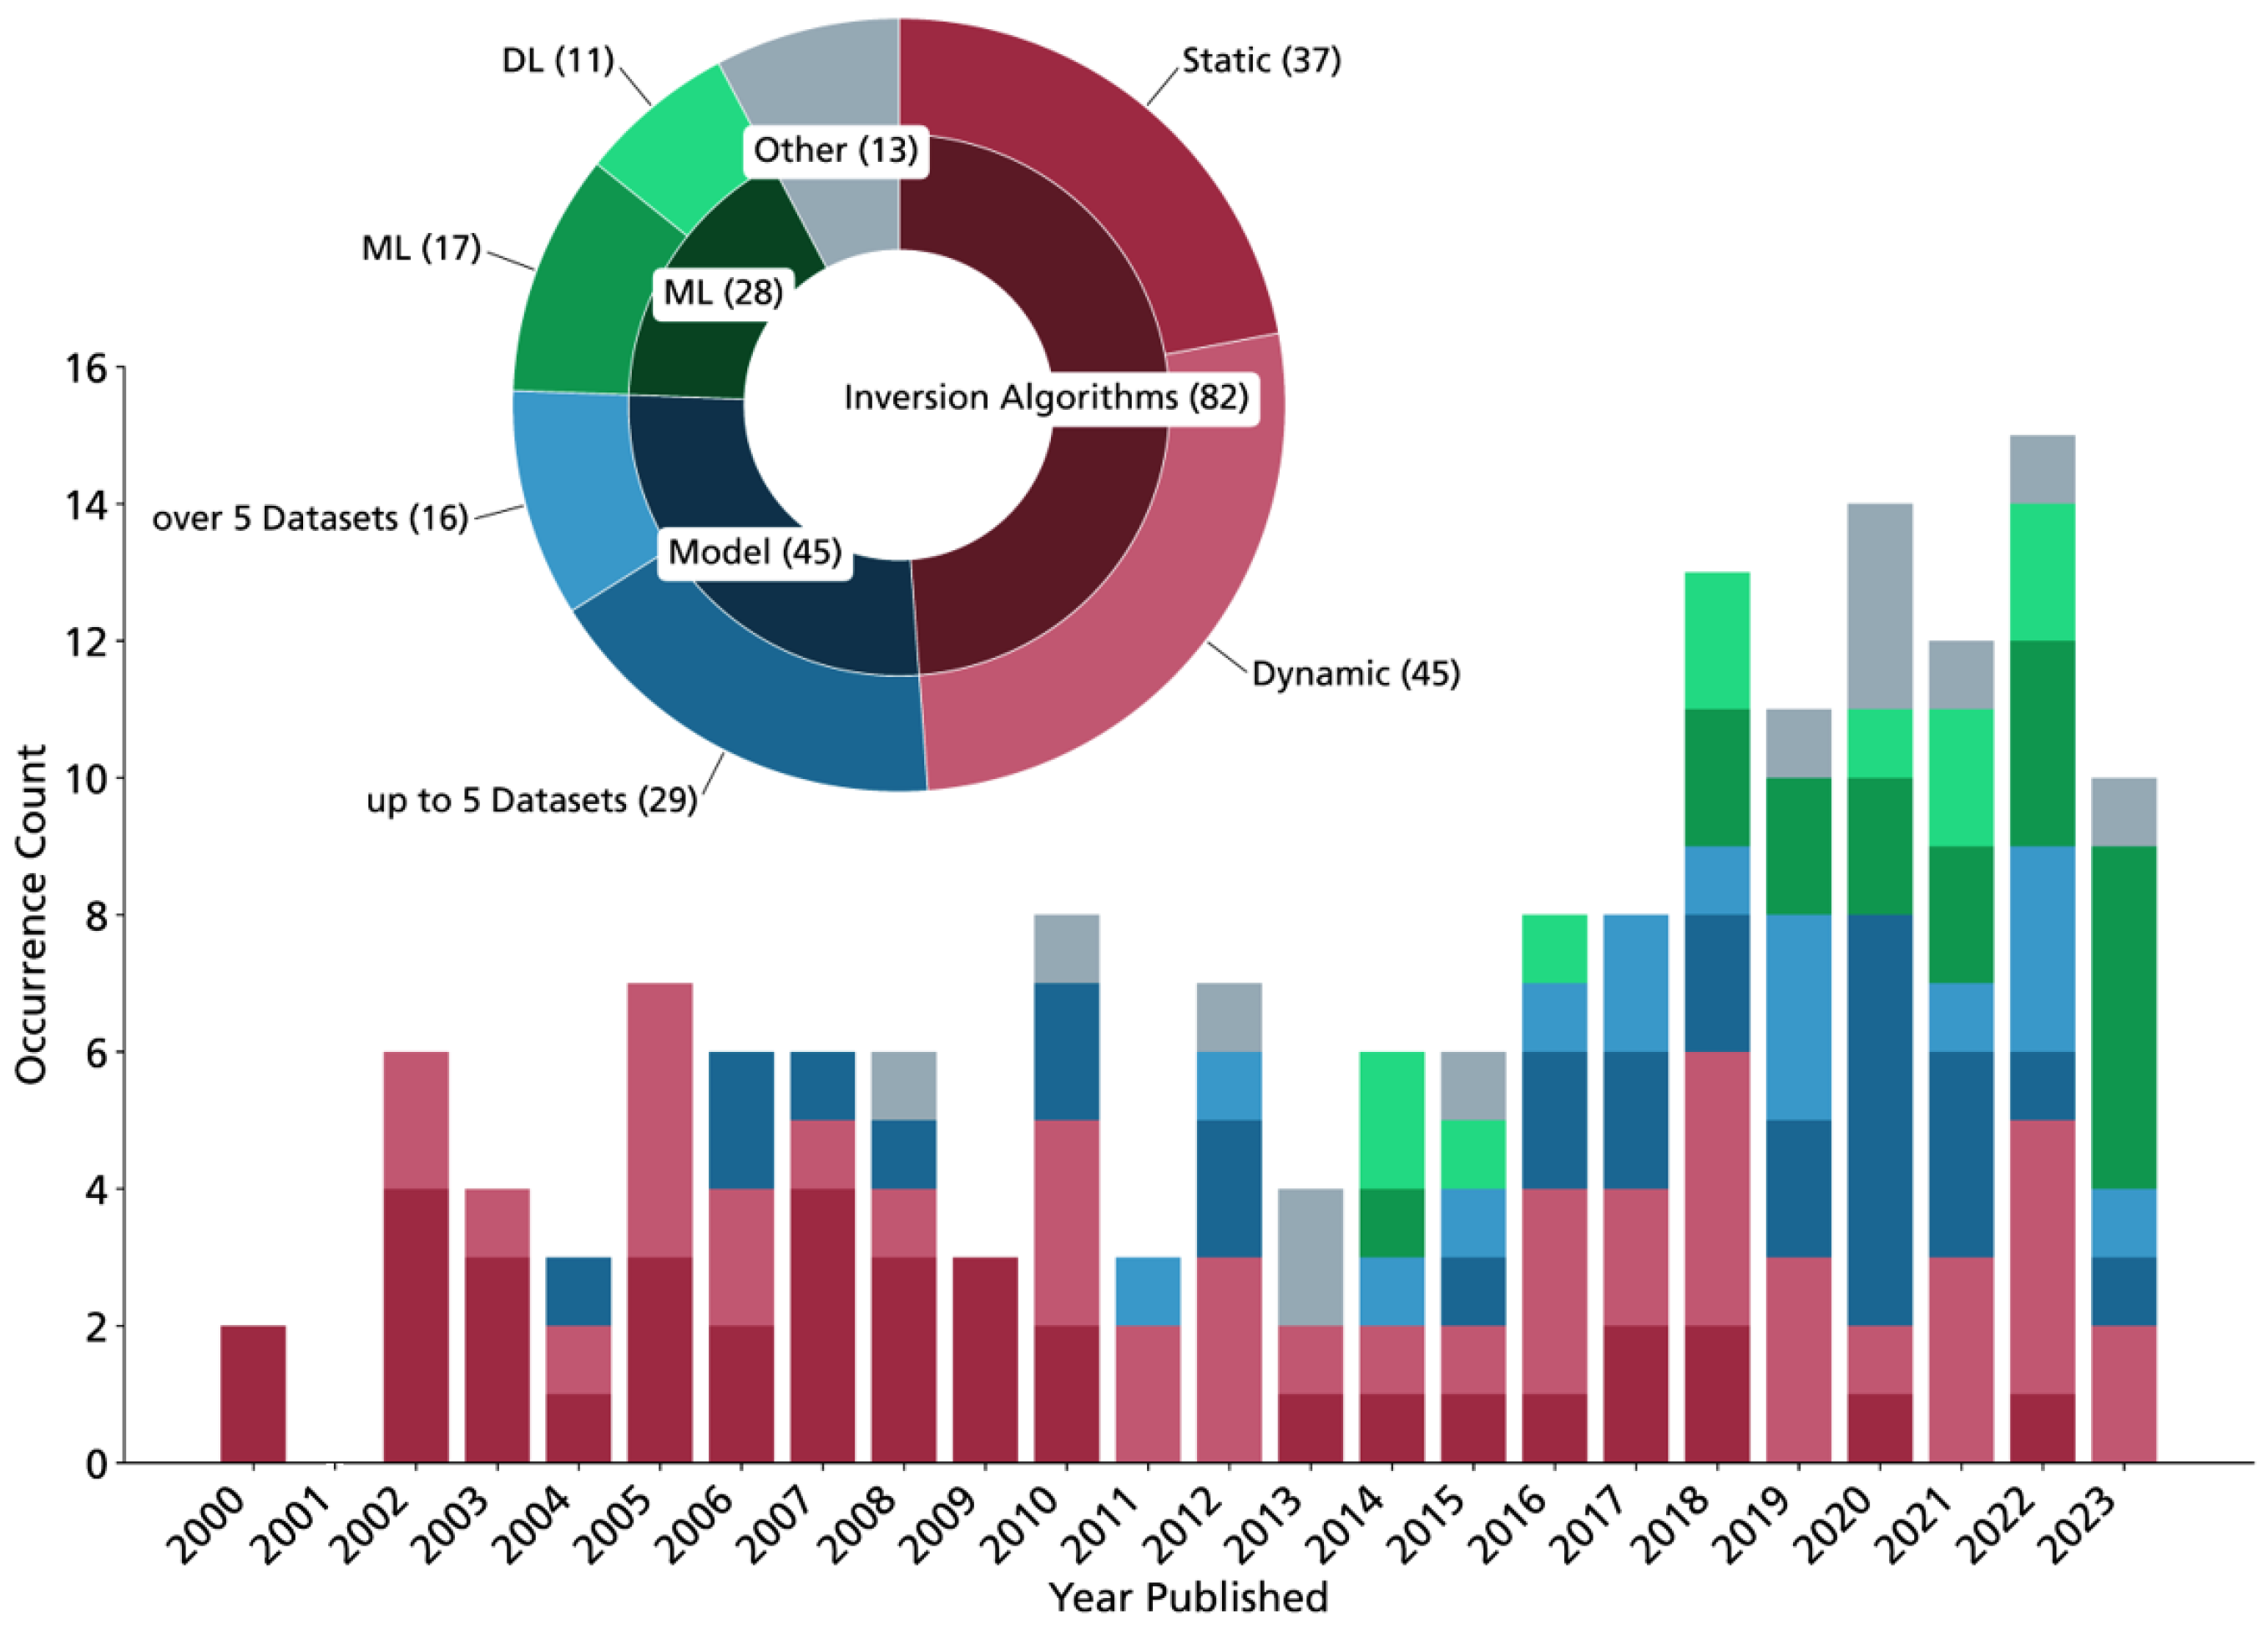
3.5. Applied Methods

For the analysis of the applied methodologies, we classified the studies according to three overarching method categories with two subcategories each:
  • Inversion algorithms, static and dynamic: If a study applied an algorithm that uses fixed values for snow density and/or crystal size, such as the Chang algorithm [68], they were classified as static; if they applied an algorithm using variable snow density and/or crystal size, for instance the Kelly algorithm [72], they were considered dynamic.
  • Model, up to 5 and over 5 datasets: Studies that used some kind of model to estimate SWE or SD (e.g., the Global Data Assimilation System (GLDAS) [218]) were classified into the model category. Thereby, we distinguished by the complexity of a model, using the number of employed datasets (up to or over five) as a threshold and considered all employed datasets, not only SWE datasets, but also, for example, land-cover, weather, climate, or topographical datasets.
  • Artificial intelligence (AI), Machine Learning (ML) and Deep Learning (DL): All studies that applied some kind of AI were classified into this category. Here, we differentiated between ML such as Random Forest (RF) or Support Vector Machine (SVM) and DL, for instance, some kind of NN.
If multiple methods were combined, the method used for classification was the one that was deemed more recent. Consequently, inversion algorithms were regarded as less recent, while AI or, more specifically, DL was seen as most recent. Studies that were not applying any of the mentioned methods, for instance review papers, were classified as other. An overview of which methodologies were used in which years is shown in Figure 10.
Figure 10 shows an overview of the methods used in the examined publications. The most frequently applied method among the reviewed articles was inversion algorithms (n = 82), whereby dynamic algorithms were the most dominant method (n = 45). Especially in the early years of the review period, these algorithms were the dominant method, being applied in 49 out of 65 studies until 2013. But, even though other methods were applied more frequently after that, inversion algorithms still make up a considerable share of the studies in recent years. For instance, in 2022, a third of the reviewed studies (n = 5) used this method. The analysis of the applied algorithms also shows, between 2000 and 2023, dynamic algorithms such as the ones developed by Kelly [72], Josberger [73], Foster [74], Pulliainen [219], or Che [194] have steadily replaced the static algorithms, which were, for instance, developed by Kunzi et al. [220], Chang [68], Foster [70,221], Goodison and Walker [222], or Grody and Basist [223]. While in the first ten years of the review period, static algorithms were predominant (n = 27) versus dynamic algorithms (n = 15), in recent years (since 2020), only a few studies with static algorithms have been published (n = 2) [148,210]. The difference between the two types of algorithms is how they deal with snow density and the crystal size. Static algorithms assume an averaged and permanent, thus static, value for these parameters and calculate the SD or SWE based on the Tb uniformly over the entire study area [68,74]. Dynamic algorithms use secondary information on snow density and crystal size, individually or collectively. These data are often taken from snow models as, for instance, the model of the Helsinki University of Technology (HUT) [12] and adjust the SWE/SD estimation locally [219]. In certain studies, researchers incorporate various values for snow density or crystal size, averaging them across sub-regions within their study area to accurately capture local conditions (e.g., [224,225]). However, the algorithms employed in these studies are deemed static in this review, as they lack dynamic adjustments to local conditions and rely solely on predetermined values.
Models are the second most often-applied method. While models were applied only occasionally in the early years of the review period (n = 5, 2000–2009), their share increased continuously until 2020, when six studies following this approach were published. The differentiation based on the number of employed datasets (up to or over five datasets) within the modeling process was made to introduce a proxy for the complexity of the models. It was found that models with up to five datasets are used more frequently (n = 29) than models with more than five datasets (n = 16). However, no tendency can be derived from this as to whether the number of datasets used has an influence on what the models are used for. What can be said, however, is that models tend to be used for a wider range of applications than static and dynamic algorithms. These include applications that are similar to snow monitoring using inversion algorithms [101,226], but also applications that combine SWE/SD with other fields such as meteorology by looking at snowstorms [215], or temperature prediction [155], or geophysics by analyzing droughts [97]. In addition, there were some studies that looked at the role that snow crystal size plays in the estimation of SWE/SD [177,227]. As the inversion algorithms are designed for data collected by PMW sensors, they are not applicable for GRACE/GRACE-FO data. Therefore, studies using GRACE/GRACE-FO data make up a considerable share of the model method count (n = 17/up to 5; n = 10/over 5; n = 7). These data serve various purposes across different applications. They are not only utilized in meteorology studies, as mentioned earlier, but also find application in snow monitoring [162,178] and river-runoff studies [110,213]. However, the majority of studies employing models with GRACE/GRACE-FO data inputs (n = 9) focus on Total Water Storage (TWS), as demonstrated in studies such as [67,150,151].
The third method category, AI, makes up only a minority of the reviewed studies, but follows an increasing trend. In the reviewed part of 2023 (January–September), 6 out of 9 studies used one type of this method, making it the most dominant method in this time period. AI was first introduced in our review period in 2014, as evidenced by studies such as [118,175,205]. Notably, a study in 2004 had previously explored the applicability of AI in estimating SWE [228]. However, this particular study was excluded from our review due to its limited spatial extent. Within the AI method portion of the reviewed studies, the most frequently applied methods are SVM (n = 9), NN’s (n = 7), and RF (n = 6). Regardless of the individual intentions and methods of the studies, most AI studies can be grouped together as they all use AI to uncover relationships between the Tb signal and other variables (such as, but not exclusively, hillslope, temperature, or precipitation) to improve SWE data [63,106,107,115,118,135,146,147,149,170,174,175,187,190,197,201,205,229,230,231,232,233]. The remainder of the AI studies attempted to fuse existing datasets to fill data gaps and generate more robust data [121,125,133]. Considering where in our topic classification the AI studies can be located, most of them were classified as snow monitoring (n = 16), but AI is also used, for instance, for the development of new products (n = 4) [121,125,133,197] or for the analysis of a snow storm (n = 1) [205]. The individual tasks for which AI is used are diverse. For example, AI is employed to generate higher resolution [125,187,201,229,230], better depict SWE in mountain areas [187], or optimize existing methods [135,174,175].
Looking at which methodologies (using the classification from this section; compare Figure 10) were used to study which focus (classification from Section 3.3), a diversified picture is shown, as seen in Figure 11. For instance, studies focused on snow monitoring, which is the largest portion of the reviewed articles, used all six methodologies introduced in Section 3.5. Also, the most frequently applied method (dynamic inversion algorithms) was used in 11 out of the 15 topic categories. A big share of the studies whose methods were classified as other were focused on validation and benchmarking (n = 9). Most of theses studies were designed to compare or validate specific datasets and, thus, used a specially designed methodology, which could not be classified within our methodology categories.

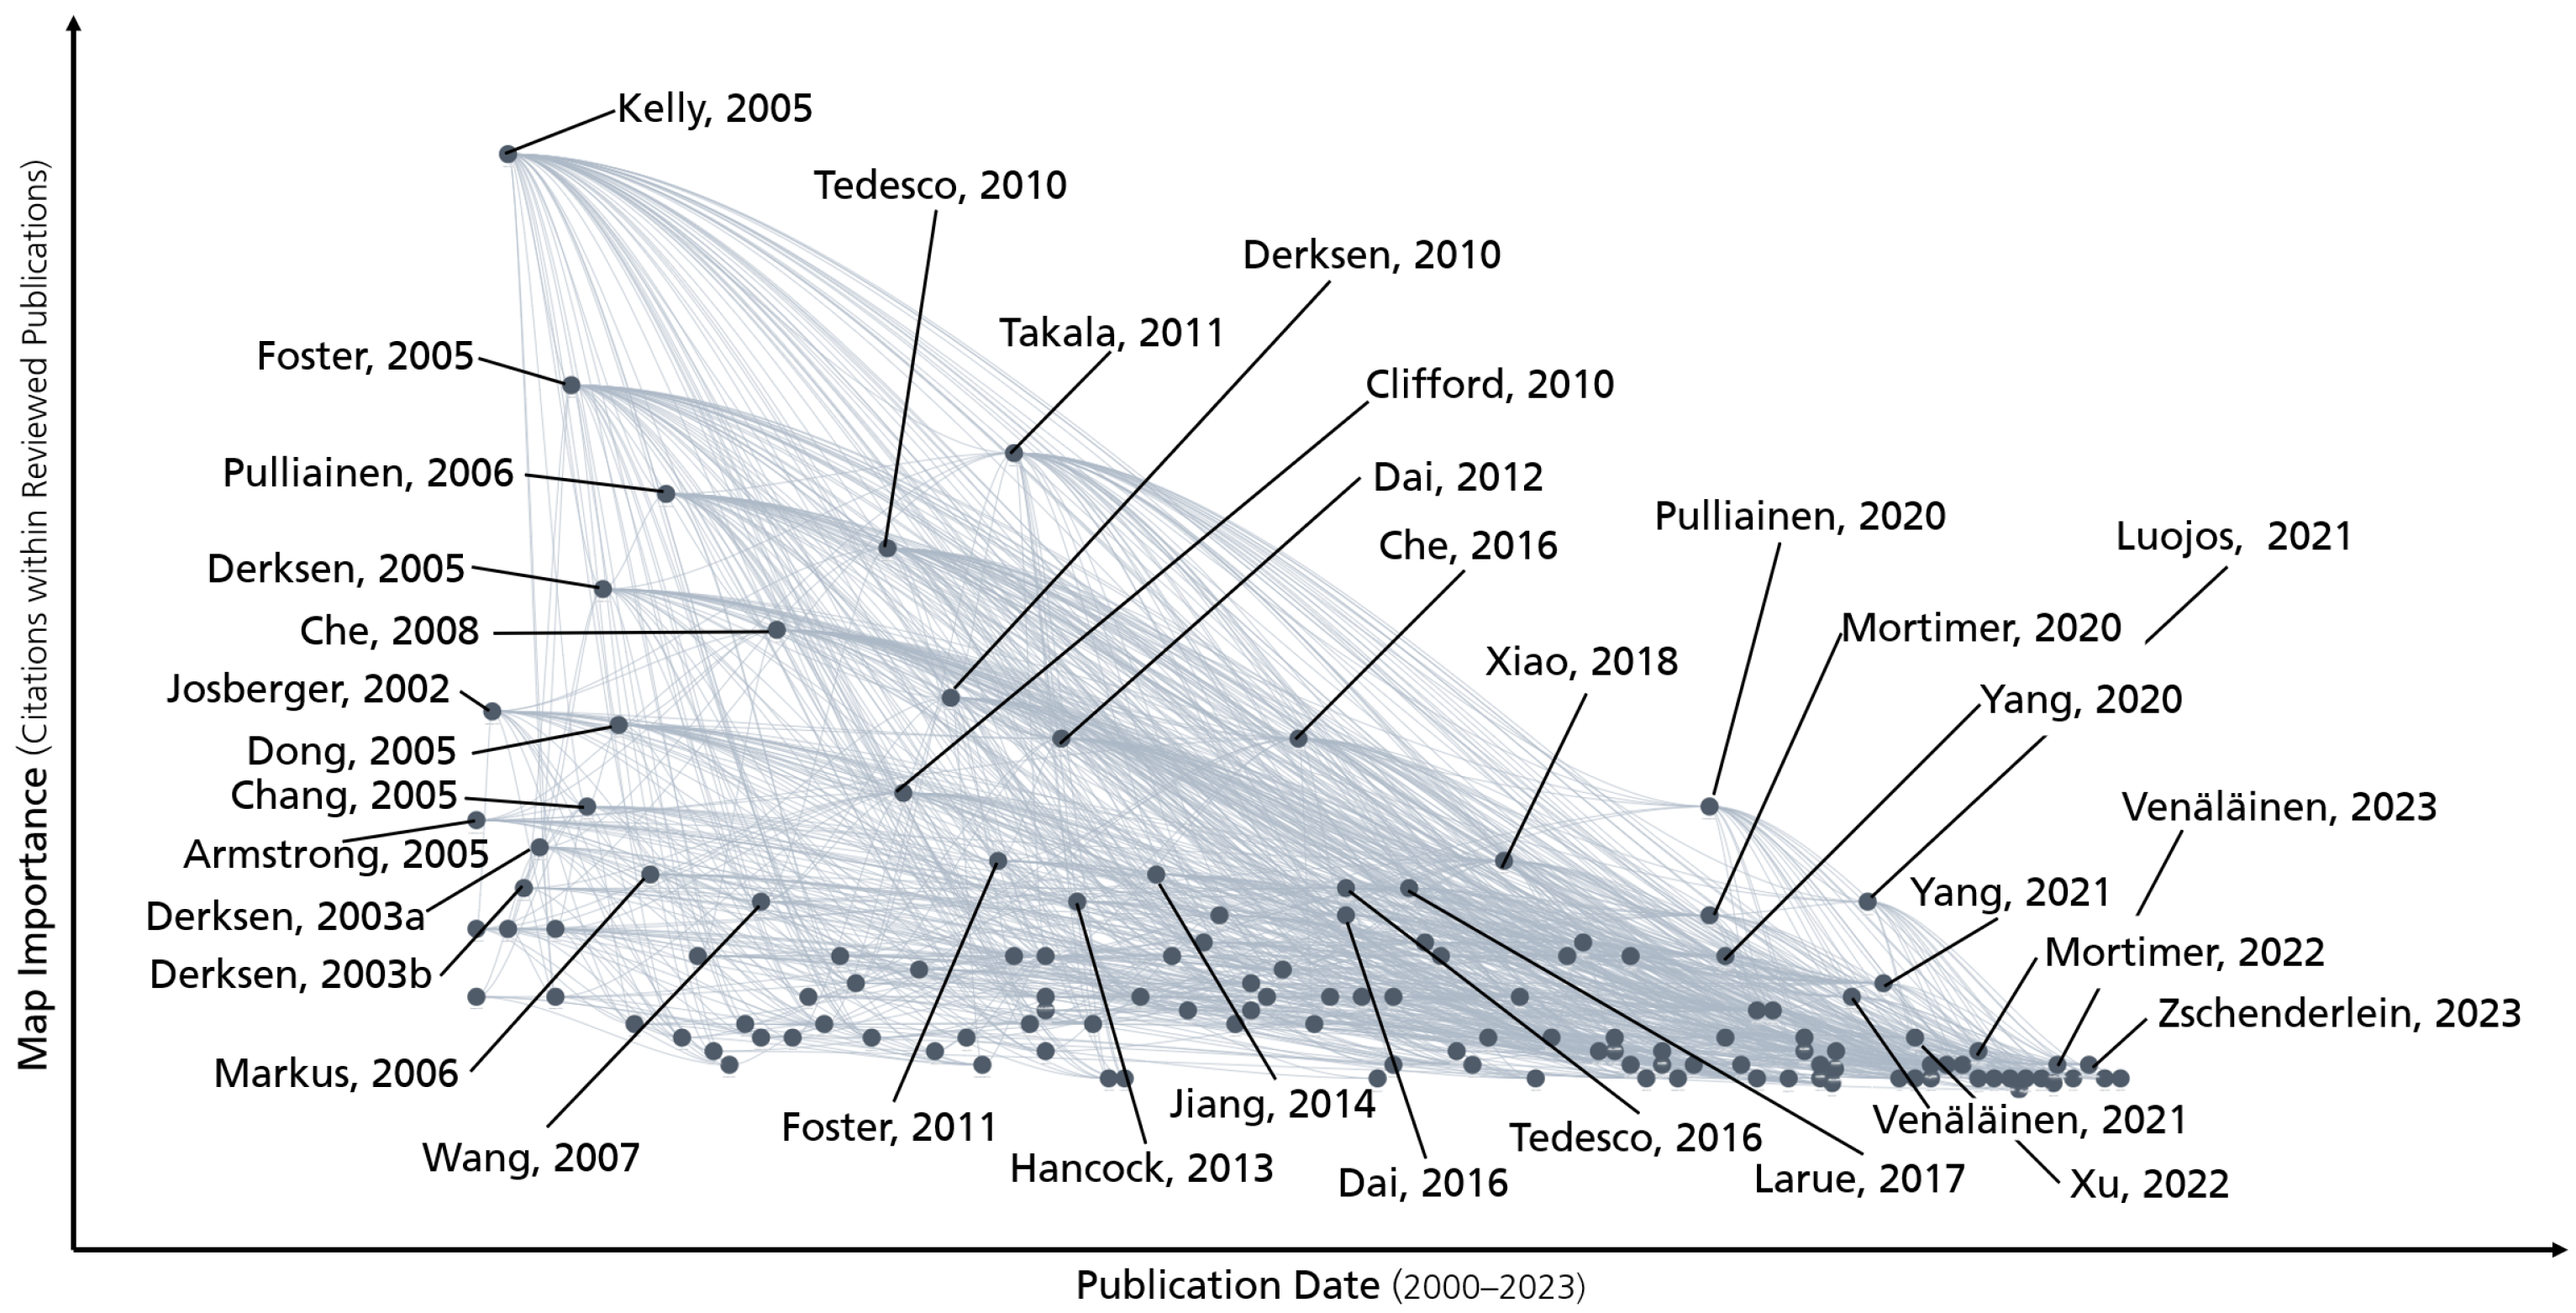
3.6. Influential Publications

To gain a more comprehensive overview of the reviewed articles, we attempted to identify the most influential publications among them. Therefore, we used the online tool litmaps.com, which analyzes the citations of a provided literature collection. The result of this analysis can be seen in Figure 12. In this figure, two variables are displayed. On the y-axis, the map importance is shown, which indicates how often a publication is cited within the provided collection, in our case, the 164 reviewed articles. On the x-axis, the publication date is represented. The lines between the points represent a citation. For illustration purposes, we left out all publications that had five or fewer connections within the map and also only labeled 36 publications, which based on the analysis of the two mentioned variables, seem to have had a considerable influence on the reviewed field.
The most influential publication according to our litmap analysis was published by Kelly in 2003 [144], where a new algorithm for AMSR-E data was introduced. Generally, in the first ten years of the review period, publications concerned with some kind of method development were predominant among the selected influential publications (n = 9). Besides Kelly 2005, this includes Josberger 2002 [73], Foster 2005 [74], and Derksen 2010 [198], developing new algorithms, as well as Derksen 2003a [91], Dong 2005 [69], Markus 2006 [164], and Wang 2007 [83], who were looking at different factors that influence SWE estimates. In addition, Tedesco 2010 [99] validated the NASA AMSR-E product. Nevertheless, there are also influential studies that were mainly concerned with snow monitoring, namely Derksen 2003b [192], Chang 2005 [84], and Derksen 2005 [234], who conducted their studies in North America, Che 2008 [194], who examined snow depth in China, as well as Armstrong 2002 [145] and Pulliainen 2006 [163], who conducted their studies covering multiple continents. The first ten years of the reviewed studies conclude with Clifford’s 2010 review [140], which stands as the most influential review article among our reviewed articles.
Also, in the phase between 2011 and 2020, methodological publications were predominant among the most influential publications according to the litmaps analysis. Another four publications, in particular Dai 2012 [120], Jiang 2014 [199], Tedesco 2016 [135], and Xiao 2018 [167], are concerned with the development of new algorithms. There are also two publications on newly developed SWE products, namely Che 2016 [235], who developed a product for Northeast China, and Foster 2011 [204], whose product extends globally. In comparison to the first ten years of the reviewed papers, however, no publications were concerned with the factors affecting SWE estimates, but rather the validation of existing products, as was performed in Hancock 2013 [137], Larue [236], Yang 2020 [237], and Mortimer 2020 [131]. During the 2010–2020 period, two snow-monitoring studies were published, which can be considered influential according to the litmap analysis. Both of them, Takala 2011 [139] and Pulliainen 2020 [13], looked at the changes of the snow pack in the Northern Hemisphere over 32 and 38 years, respectively.
In the most recent phase of the review period (2021–2023), the publications had fewer citations than in the preceding periods, as time for accumulation was shorter. Nevertheless, seven publications were considered influential. The most influential one out of these seven is Luojos 2021 [238], which describes the development of the GlobSnow 3.0 product. The publications of Venäläinen 2021 [128] and 2023 [122] are concerned with the same development, as they look at the importance of snow density within the GlobSnow product. The publications of Mortimer 2022 [123] and Zschenderlein 2023 [154] are focused on evaluating existing algorithms. Finally, Yang 2021 [231] and Xu 2022 [149] are snow monitoring studies; however, both of them introduced their own alterations to existing methods using AI.

3.7. Results of Long-Term Studies

Twelve out of the thirteen studies that examined a study period of 30 years or more and derived trends for SWE or SD observed a general decrease of SWE/SD. Thirty years is the minimum period required for deriving climate trends according to the World Meteorological Organization (WMO) [239]. An overview of the 13 studies within this review that fulfilled this criterion is provided in Table 5. Among the reviewed publications, there were eight additional studies that were conducted over a study period longer than 30 years; they, however, were not suited for this kind of trend analysis for various reasons. Mortimer 2022 [123], Luojos 2021 [238], and Zhou 2013 [119] were all solely focused on methodological development and, thus, did not derive any trends. Takala 2011 [139] and Larue 2017 [236] used data for more than 30 years; however, the work did not derive trends for a period that long. Finally, the publications of Kumar [94,96,97] were focused on snow runoff and droughts and used drought duration and intensity as trend variables; thus, they did not fit into the analysis of the other studies, which all directly used snow-related variables for the derivation of their trends. Note that the study results displayed in Table 5 were averaged spatially and temporally and over the used products, as well as simplified for the purpose of overview. To compare the strength of the trends across all studies, we analyzed the observed developments in percent, rather than the applied units.
While the study of Wei 2023 [197] found an increasing trend for Northeastern China, all other studies displayed in Table 5 show a coherent pattern of decreasing SWE/SD. Even though there are differences to be seen between the studies spatially, in strength and significance, as well depending on the employed products, some general tendencies can be observed. For instance, the decline in SWE/SD is stronger in North America than in Eurasia [13,121,124,125,132]. In addition, many studies observe a stronger decrease in spring than in winter [13,100,124,240]. In addition, remote sensing-based products show a greater decrease than other products (models or in situ) [100,125,132,241].
Leaving the hemispherical scale, various commonalities emerge between the study results. For instance, various studies agree that there has been a significant decrease in SWE/SD in Canada around Hudson Bay and generally on Canada’s mainland Arctic coast.
Such a significant decrease was also observed in Finland and Sweden around the Baltic Sea. However, there are also regions, such as Siberia between the Lena and Kolyma Rivers or the American Rocky Mountains, where a significant increase in SWE/SD has been observed [13,121,124]. Looking at China, where more studies have been conducted, no coherent pattern is apparent. There is a consensus among the studies for some regions. For instance, in the Greater Khingan Mountains, an increase of SWE/SD and, for the Hengduan, Kunlun, and the Chinese part of the Himalayan Mountains, a decrease in SWE/SD was observed. However, for other regions such as the Changbai, Lesser Khingan, and Tianshan Mountains, the studies partly show conflicting results, which, however, can be attributed to varying input data, the experimental design, as well as the study domain [80,100,196,197,211,241]. For most other regions in the Northern Hemisphere, the studies are not in agreement or the observed changes are not significant.

3.8. Challenges in SWE Estimation

Due to continuous coverage by PMW sensors, spaceborne research on SWE has been possible for over 40 years [13,68,75]. Nevertheless, PMW-based SWE estimation is challenged by a series of uncertainty factors. These challenges were thoroughly covered in the scientific literature over the years, be it in dedicated publications (e.g., Dong 2005 [69], Foster 2005 [74]), reviews (e.g., Clifford 2010 [140], Tanniru 2023 [76]), methodological publications (e.g., Kelly 2003 [144], Lujous 2021 [238]), benchmarking studies (e.g., Mortimer [131], Tong 2010 [112]), as well as case studies (e.g., Derksen 2003 [192], Dai 2017 [105]). Therefore, and as this review is rather focused on large-scale applications of SWE estimations than on methodological development, we refrained from a more detailed discussion of the challenges, but focused on how the challenges were addressed in the reviewed articles. Thus, in this section, we present a concise all-round view of the developments and newest approaches that were employed in the reviewed articles to mitigate the challenges of spaceborne SWE estimation.

3.8.1. Vegetation

Vegetation cover plays a significant role in estimating SWE from PMW data in several ways. Primarily, vegetation, particularly forests, intercepts snow precipitation before it reaches the ground [242]. Secondly, vegetation additionally attenuates the PMW emitted by Earth [70,233], and finally, the underlying ground and its temperature influence snow metamorphism and, thus, snow grain size [146]. Combined, these factors tend to lead to an underestimation of the SWE [76]. Accordingly, as mentioned in Section 3.5, a majority of the reviewed studies (n = 125) rely on some form of land-cover information. Thereby, the studies published early in the review period employ land cover classes based on Sturm 1995 [243] (e.g., Biancamaria 2008 [159], Tedesco 2007 [160]), or the Land Use and Cover Change Map of the International Geosphere-Biosphere Programme [244] (IGBP, e.g Walker 2002 [114], Ge 2008 [114]), as well as the Land Use/Land Cover Map (LULC) of the Chinese Data Center for Resources and Environmental Sciences (RESDC) [245]. Studies published later in the study period used MODIS-based land cover products. Thereby, studies attempt, for instance, to take into account the land cover or, rather, vegetation causing different snow types [234], as well as the influence of forests [107].

3.8.2. Snow Characteristics

Metamorphism: This issue is closely connected to the vegetation issue. The land cover and vegetation often determine the snow type and, subsequently, snow grain size, density, and layering [69,76,146]. As described in Section 3.5, a majority of publications of the studies published early in the review period used static algorithms. The snow type issue is not addressed in their calculations, as they use fixed values for the snow density [68,70]. Some studies then used algorithms that used a snow density based on land-cover classes, such as the Meteorological Service of Canada (MSC) algorithm [222], as in Derksen 2002 [92]. Most of the reviewed studies, however, used dynamic algorithms, which rely on some kind of secondary information regarding snow density and grain size based on station data, such as the HUT model [12]. The dynamic algorithms utilize spatiotemporal snow information on a per-pixel basis to convert the Tb signal [72,74,163]. One issue, thereby, is that several snow models do not depict all snow types correctly [246]. In more recent studies, researchers also used AI to address the snow grain size issue, especially by focusing on the sensitivity of the Tb signal using RF [231] or extremely randomized forests (ERFs) [201].
Deep snowpack: The microwave scattering response to snow is saturated at an SWE of around 150 mm, meaning that a huge snowpack is systematically underestimated [69,76,238]. The most common solution to this issue is that studies and also products, such as GlobSnow, mask out mountainous regions [13,76,238]. However, there were also attempts to counteract the problem mainly by, for instance, post-calibrating the Tb data [195] or introducing dynamic masking out of saturated pixels [109,139]. Some studies also base their analysis not solely on remote sensing data, but also analyze meteorological models or reanalysis data [180,200]. In addition, there were attempts to use a wider range of frequencies and polarizations to gain a more comprehensive insight using the Tb signal [102,169]. Several studies followed the approach of using some other kind of data, predominantly in situ data, to fill in masked out areas or to improve the estimation if these areas that were not masked out [130,216]. Also, some studies used models that incorporated visible data indicating snow-covered area (SCA), which has higher resolution, to support the PMV measurements [101]. Various studies such as, for instance, Bair 2018 [187] or Hu 2022 [129] also used AI to fuse PMW datasets with other datasets (meteorological or in situ) to counteract issues posed by mountainous regions.
Shallow snow: Estimating SWE based on PMW sensors is based on the comparison of two frequencies in the Tb signal. Therefore, a frequency in the K- or Ku-band (normally around 18 GHz) is compared to a frequency in the Ka-band (normally around 36 GHz) [68]. However, shallow snow (<5 cm) is not detectable for frequencies under 25 GHz; thus, it cannot be depicted using this method [74,238]. One approach to counteract this issue is to employ frequencies in the W-band (around 89 GHz), which are more sensitive to shallow snowpack. However, these frequencies are also more sensitive to atmospheric influences than lower frequencies and, thus, must be corrected, most often using radiative transfer models or atmospheric sounding data [83,195,199]. As for other issues described above, some studies also relied on other data to depict shallow snow more accurately. If remote sensing data are employed, studies normally use visible data to support PMW data, as visible data are used to estimate SCA and, thus, can indicate where snow lies if its not indicated in PMW data [210,247]. Also, the combination with station data has been performed, thereby supporting information lacking from PMW datasets with in situ-measured SD information [98,195].
Liquid water content: Close to large water bodies, particularly oceans, snow has a higher liquid water content. This increased water content causes the snow to absorb microwaves more efficiently, leading to faster signal saturation. As a result, many inversion algorithms are specifically tailored to dry snow conditions [69,74]. The most frequently used countermeasures widely resemble the ones used for mountainous regions, as water bodies are often masked out [69,154]; some studies also use additional wet snow masks [238]. Another approach to mitigate the issues posed by water bodies that resembles the mitigation of mountain issues is support with other data. For instance, some studies use reanalysis data such as European Reanalysis Data 5 (ERA5), or the Modern-Era Retrospective analysis for Research and Applications, Version 2 (MERRA-2) [129], or in situ data [198] to gain more information on snow close to water bodies. Finally, an approach specifically designed to counteract wet snow is only to use data collected in the morning [194] or during the night [120] to avoid capturing meltwater effects in the snow.

3.8.3. Spatial Resolution

The most frequently employed PMW sensors (SSM/I, AMSR-E, SMMR, SSMIS) all have a resolution of 25 × 25 km. This poses an array of issues. Firstly, in mountainous regions, it is not possible to depict complex terrain such as slopes or valleys. Also, being close to water bodies, which influence the Tb signal reception, can lead to mixed pixel effects [76,154]. Besides that, the coarse resolution of PMW sensors also poses challenges, not in processing of the data, but in advanced examination, as it prevents the possibility of more detailed and nuanced analyses [125,248]. However, among the reviewed articles, there were several studies that attempted the downsampling of SWE products.
For a better overview, we grouped these studies into AI and AI-free approaches. The first AI-free approach is to use newer PMW sensors, which have higher resolutions (MWRI, AMSR-2) [169,235]. Other studies combined PMW data with other satellite data to increase the resolution, such as MODIS [101], AMSU [85], or AVHRR [143]. In addition, certain studies used radiative transfer models [226] or microwave emission models [203] for increased resolution. Concluding this AI-free group are studies employing the MEaSUREs product, a high-resolution PMW-SWE product for North America. This product utilizes advanced geolocation features for higher resolutions and incorporates specific techniques, such as overlapping Tb antennas [210] and Eigenvector filtering [235].
Within the group of studies that uses AI, RF is the predominant method (n = 6/7), be it applied on the the Ku–Ka combination [152], or ERF [201]. Wei published three studies comparing RF to other AI methods (SVR, XGBoost, and multiple linear regressions) [197,229,230]. The comparisons extended beyond Tb frequencies to include variables like snow density, forest fraction, slope, and roughness. Finally, Bair 2018 used bagged trees in combination with an NN. The only AI study not using RF within the AI group is Shao 2022, where a Ridge Regression Model (RRM) was used to combine various datasets including models such as GLDAS, reanalysis such as ERA5, or PMW data such as GlobSnow [125].

3.8.4. Other Challenges

Besides the mentioned challenges, there is a set of challenges that we would like to mention; however, they are not always treated as their own issue or do not apply to all studies.
Air temperature is sometimes treated as part of the snow crystal issue (see Section 3.8.2) as it influences snow composition [120]. Additionally, the air temperature influences the liquid water content in the snow precipitation and, thus, the wetness of the snow [113]. This issue is normally, if treated as its own issue, resolved using meteorological data or models [137,159].
Atmospheric disturbances do not apply to most of the reviewed studies, as the widely used 18 and 36 GHz frequencies are not susceptible to atmospheric influences [170]. However, as seen in Section 3.8.2, some studies used additional frequencies (mainly 89 GHz) to depict the snowpack better and, thus, had to deal with atmospheric influences. The methods to counteract this issues, however, diverge. There are studies that use atmospheric decoupling [171], atmospheric modeling [176], atmospheric correction [105], or moving averages [198].
Hillslope significantly impacts the estimation of SWE, as it plays a direct role in the accumulation and melting behavior of SWE, influenced by factors such as slope and facing direction. Additionally, hillslope affects the distribution of microwave radiation emission based on the incidence angle [103,151]. However, the commonly used data lack the resolution needed to capture the intricacies of hillslope, potentially leading to underrepresentation. Therefore, to consider hillslope as an influencing variable, downsampling of the data is necessary [101,103,108,151].

4. Discussion

4.1. Limitations of the Review

In our review, we set various limitations, be it on impact factor, language, or publication date. The main limitations, however, were that we only included studies with a study area over 500,000 km2 and that we used the search string to focus on certain sensor types (PMW and GRACE). With these limitations, we might have missed some methodological developments that often occur on smaller scales before being applied to larger study areas, as well as studies that solely use PMW or GRACE data as auxiliary. This might include studies with other main foci than snow itself. These limitations, however, were crucial for striking a balance between presenting a comprehensive overview and avoiding the review from becoming overly exhaustive, while maintaining the intended large-scale character of the review. Also, we did not include the name of ready-to-use SWE products (e.g., GlobSnow) in the search string. It is possible that some publications were not included in the search results, even though we attempted to mitigate this circumstance by conducting an overarching search on litmaps. Nevertheless, also, this decision was made on purpose as the explicit naming of snow products would have made the search string and, thus, the search results potentially extensive and unnecessarily complex. Furthermore, the depiction presented in this review could be slightly distorted, as all classifications (methodology, topics) were conducted manually and are susceptible to inherent subjectivity. As the line between some categories was difficult to draw, a certain range of uncertainty arose. In spite of the limitations and classifications in place, we have formulated them to align with our best knowledge. While recognizing the review’s partial limitations, it consistently presents a comprehensive overview of large-scale SWE estimation.
Finally, deeper comparative analyses, particularly in Section 3.3 and Section 3.5, could enhance the understanding of the reviewed publications, their methodologies, and their results. However, achieving a comprehensive comparison that respects each publication’s nuances, such as spatial, temporal, and methodological setting, and integrates the authors’ viewpoints is not feasible within the confines of a review article. Also, in our opinion, such a comparison is always subject to the authors’ individual opinion and, thus, would not reflect the investigated studies adequately. For these reasons, we refrained widely from such summations.

4.2. Spatial, Temporal, Thematic, and Data Coverage

Generally, there is comprehensive spatial and temporal coverage, along with ample data availability. Focusing on the spatial distribution, however, it also shows that the study situation varies from region to region. While 34 studies were conducted on a global or hemispherical scale, 59 studies focused on North America (USA and/or Canada) and 46 on China. This also shows that certain regions with expectantly large snowpacks are not represented or underrepresented. These regions include Europe as a whole, but especially high latitudes, the Middle East, and Central Asia, as well as Russia. Due to the limitation regarding the study area size that was made for this review, it is possible that the coverage of certain regions is underestimated by means of small-scale studies. However, even regions with significant potential for large-scale studies in terms of size, such as Scandinavia, have rarely undergone thorough investigation. Concerning the Southern Hemisphere, no statement can be made, as it was not part of the search string, even though studies that appeared in the results were not excluded.
As far as temporal coverage is concerned, it can be seen that, although 93 studies started after 2002 (launch of AMSR-E), there are also several studies that exploit the full range of available observations (n = 33 with study start before 1980). What is striking, however, is that, apart from one study on the Alps [180] and one in South America [182], all these studies, which take advantage of the early years of PMW sensors, were all carried out mainly in the already mentioned frequently examined study areas (North America and China). This means that the already spatially underrepresented areas also lack temporal representation and examination.
Based on the reviewed studies, it is also possible to draw a picture of which datasets are often used and which analyses they enable. As seen in Section 3.8, PMW-based SWE estimation is subject to various shortcomings and challenges. Therefore, a vast majority of the reviewed studies (n = 159/168) rely on some auxiliary data, mainly in situ and/or land-cover data, which are often already incorporated into some datasets (e.g., GlobSnow, Snow ESA Climate Initiative [Snow CCI]). Hence, in the later years of our review period, studies increasingly relied on specially prepared snow datasets like GlobSnow, Snow CCI, or the AMSR-E product, rather than direct satellite data. Notably, only the AMSR-E (V1) was exclusively based on PMW data. Although these products also have certain limitations and are sometimes used with other products (models or reanalysis) to mitigate these shortcomings, it is apparent that there is a comprehensive and accepted SWE data situation for the Northern Hemisphere based on PMW, but also with auxiliary data.
Finally, we also examined what topics were covered in the reviewed studies. It is evident that a vast majority of the reviewed studies were either concerned with methodological development in the field of remote sensing (n = 72) or in the monitoring the snowpack (n = 53). Given the limitations of our literature search, the emphasis was placed on remote sensing and snow monitoring. However, efforts were made to broaden the review’s scope by incorporating studies that utilized SWE data for diverse topics, such as those involving GRACE(-FO) sensors. Although all the reviewed studies, without exception, emphasized the importance of snow and its accurate estimation in larger environmental and anthropogenic contexts in their introductions, besides some other mainly snow-focused publications (n = 10) and two reviews, there are only 30 studies (17.8%) that look at snow and its role in a wider context, be it as part of the TWS, in runoff studies, or as part of meteorological studies. As these publications are split between different fields, no pattern can be identified as to which topics are increasingly being investigated. Relatively speaking, no trends can be formulated as to the direction in which research will use the SWE information that has been enhanced over the review period.

4.3. Findings of the Review and Observed Developments

While declining SWE is commonly associated with climate change, our analysis of climate-relevant trends (see Section 3.7) indicates that only three studies identified significant decreasing trends for the Northern Hemisphere. Nonetheless, upon comparing the results of all reviewed studies, a consensus emerges regarding the overall decline in SWE across the Northern Hemisphere. Although variations exist in the strength, significance, and regional patterns of these trends, an overarching agreement is evident.
Focusing on the methodological development within the reviewed studies, a shift form static and dynamic inversion algorithms towards AI-based approaches becomes apparent. Note, however, that these models and AI-based approaches often build on or incorporate static and dynamic algorithms. Also, among the inversion algorithms, a general agreement on the procedure can be observed, while the modeling and, especially, the AI studies more often follow an experimental or developmental approach; thus, no widespread commonalities can be observed.
Apparent throughout all studies is that the general issues with remote sensing SWE retrieval remained the same during the study period. Studies from the beginning of the study period [72,145], approximately the middle of the study period [138,140], but also towards the end [13,238] show that challenges posed by deep snowpack, wet and shallow snow, as well as coarse resolution and vegetation could not be resolved on a mere PMW data level. However, it can also be seen that considerable progress was made working around those issues by employing additional data and combining various methods [76,77]. Therefore, studies published towards the end of our study period are more effective at addressing challenges associated with the Tb inversion method, which is the foundation of all PMW SWE estimation methods.

4.4. Outlook

The future direction of SWE estimation research may take diverse methodological and content-focused paths. Methodologically, it could address the challenge mitigation of PMW data and explore downscaling possibilities. Mitigation might involve addressing PMW sensor data issues through methods like integrating additional data sources (e.g., precipitation or snow data from other sensors) and using advanced models. Downscaling aims to refine PMW data by potentially leveraging newer sensors, combining them with higher-resolution auxiliary data, or employing advanced computing methods and AI. AI also might play a central role in potentially bridging the mitigation and downscaling approaches. Analyzing SWE trends in various Northern Hemisphere regions could potentially benefit from these combined methods. While current SWE data allow for extensive analyses, large-scale and long-term studies have yet to fully connect with research fields beyond the cryospheric context, which could potentially be crucial for areas like water management, biodiversity, and natural hazard assessment. These areas could also benefit from the combination of PMW data with gravimetric measurements, as these data offer a unique possibility for hydrological and also snow studies. Also, as for both types of sensors (PMW and gravimetric), future missions are planned [249,250], and the data can be combined for longer time periods in the future. Additionally integrating forecasting into SWE studies, facilitated by AI, might be increasingly important for data fusion and advanced forecasting. In summary, the future of SWE estimation research may involve converging methodologies, broadening application areas, and relying more on AI for enhanced insights and predictions.

5. Conclusions

This review evaluates 168 SCI publications from 2000 to 2023, exploring the potential of remote sensing for large-scale snow water equivalent (SWE) monitoring. The search criteria included English publications with an impact factor over 2.0, utilizing spaceborne data, and excluding studies below 500,000 km2 or conducted over sea ice. After thorough sorting and a comprehensive literature search, we categorized papers based on methodological and content aspects. This allowed for insightful analyses, offering insights into the current landscape of large-scale SWE estimation research.
Analyzing the 168 studies, a growing interest in the review topic is evident, with 75 publications emerging since 2018. The geographical scope varies, encompassing global (n = 8) and hemispherical (n = 28) studies, but a significant emphasis is observed in North America (n = 59) and China (n = 46), where, also, the majority of authors are affiliated. Moreover, our analysis unveiled the subsequent findings:
  • Methodology shift:
    -
    A shift from static and dynamic inversion algorithms over modeling approaches to especially artificial intelligence (AI) is observed.
    -
    Inversion algorithms dominated the early reviewed years (n = 81 until 2013), with dynamic algorithms prevailing overall (n = 45).
    -
    Models increased steadily (n = 51), peaking in 2020 (n = 6).
    -
    AI has been rising since 2014, with 6 out of 9 studies in 2023.
    -
    Commonly used AI methods: Support Vector Machine (n = 9), neural networks (n = 7), and Random Forest (n = 6).
    -
    Inversion algorithms still constituted a third of studies in 2022 (n = 5).
  • Data usage:
    -
    There were 157 out of the 168 studies that used passive microwave (PMW) data
    -
    Nine studies relied solely on PMW data.
    -
    Most studies used PMW data in conjunction with auxiliary data (in situ data (n = 128), land-cover information (n = 118)).
    -
    Gravimetric GRACE/GRACE-FO data were used in 20 studies.
    -
    Multispectral data were used in 58 studies and synthetic aptitude radar (SAR) in 3.
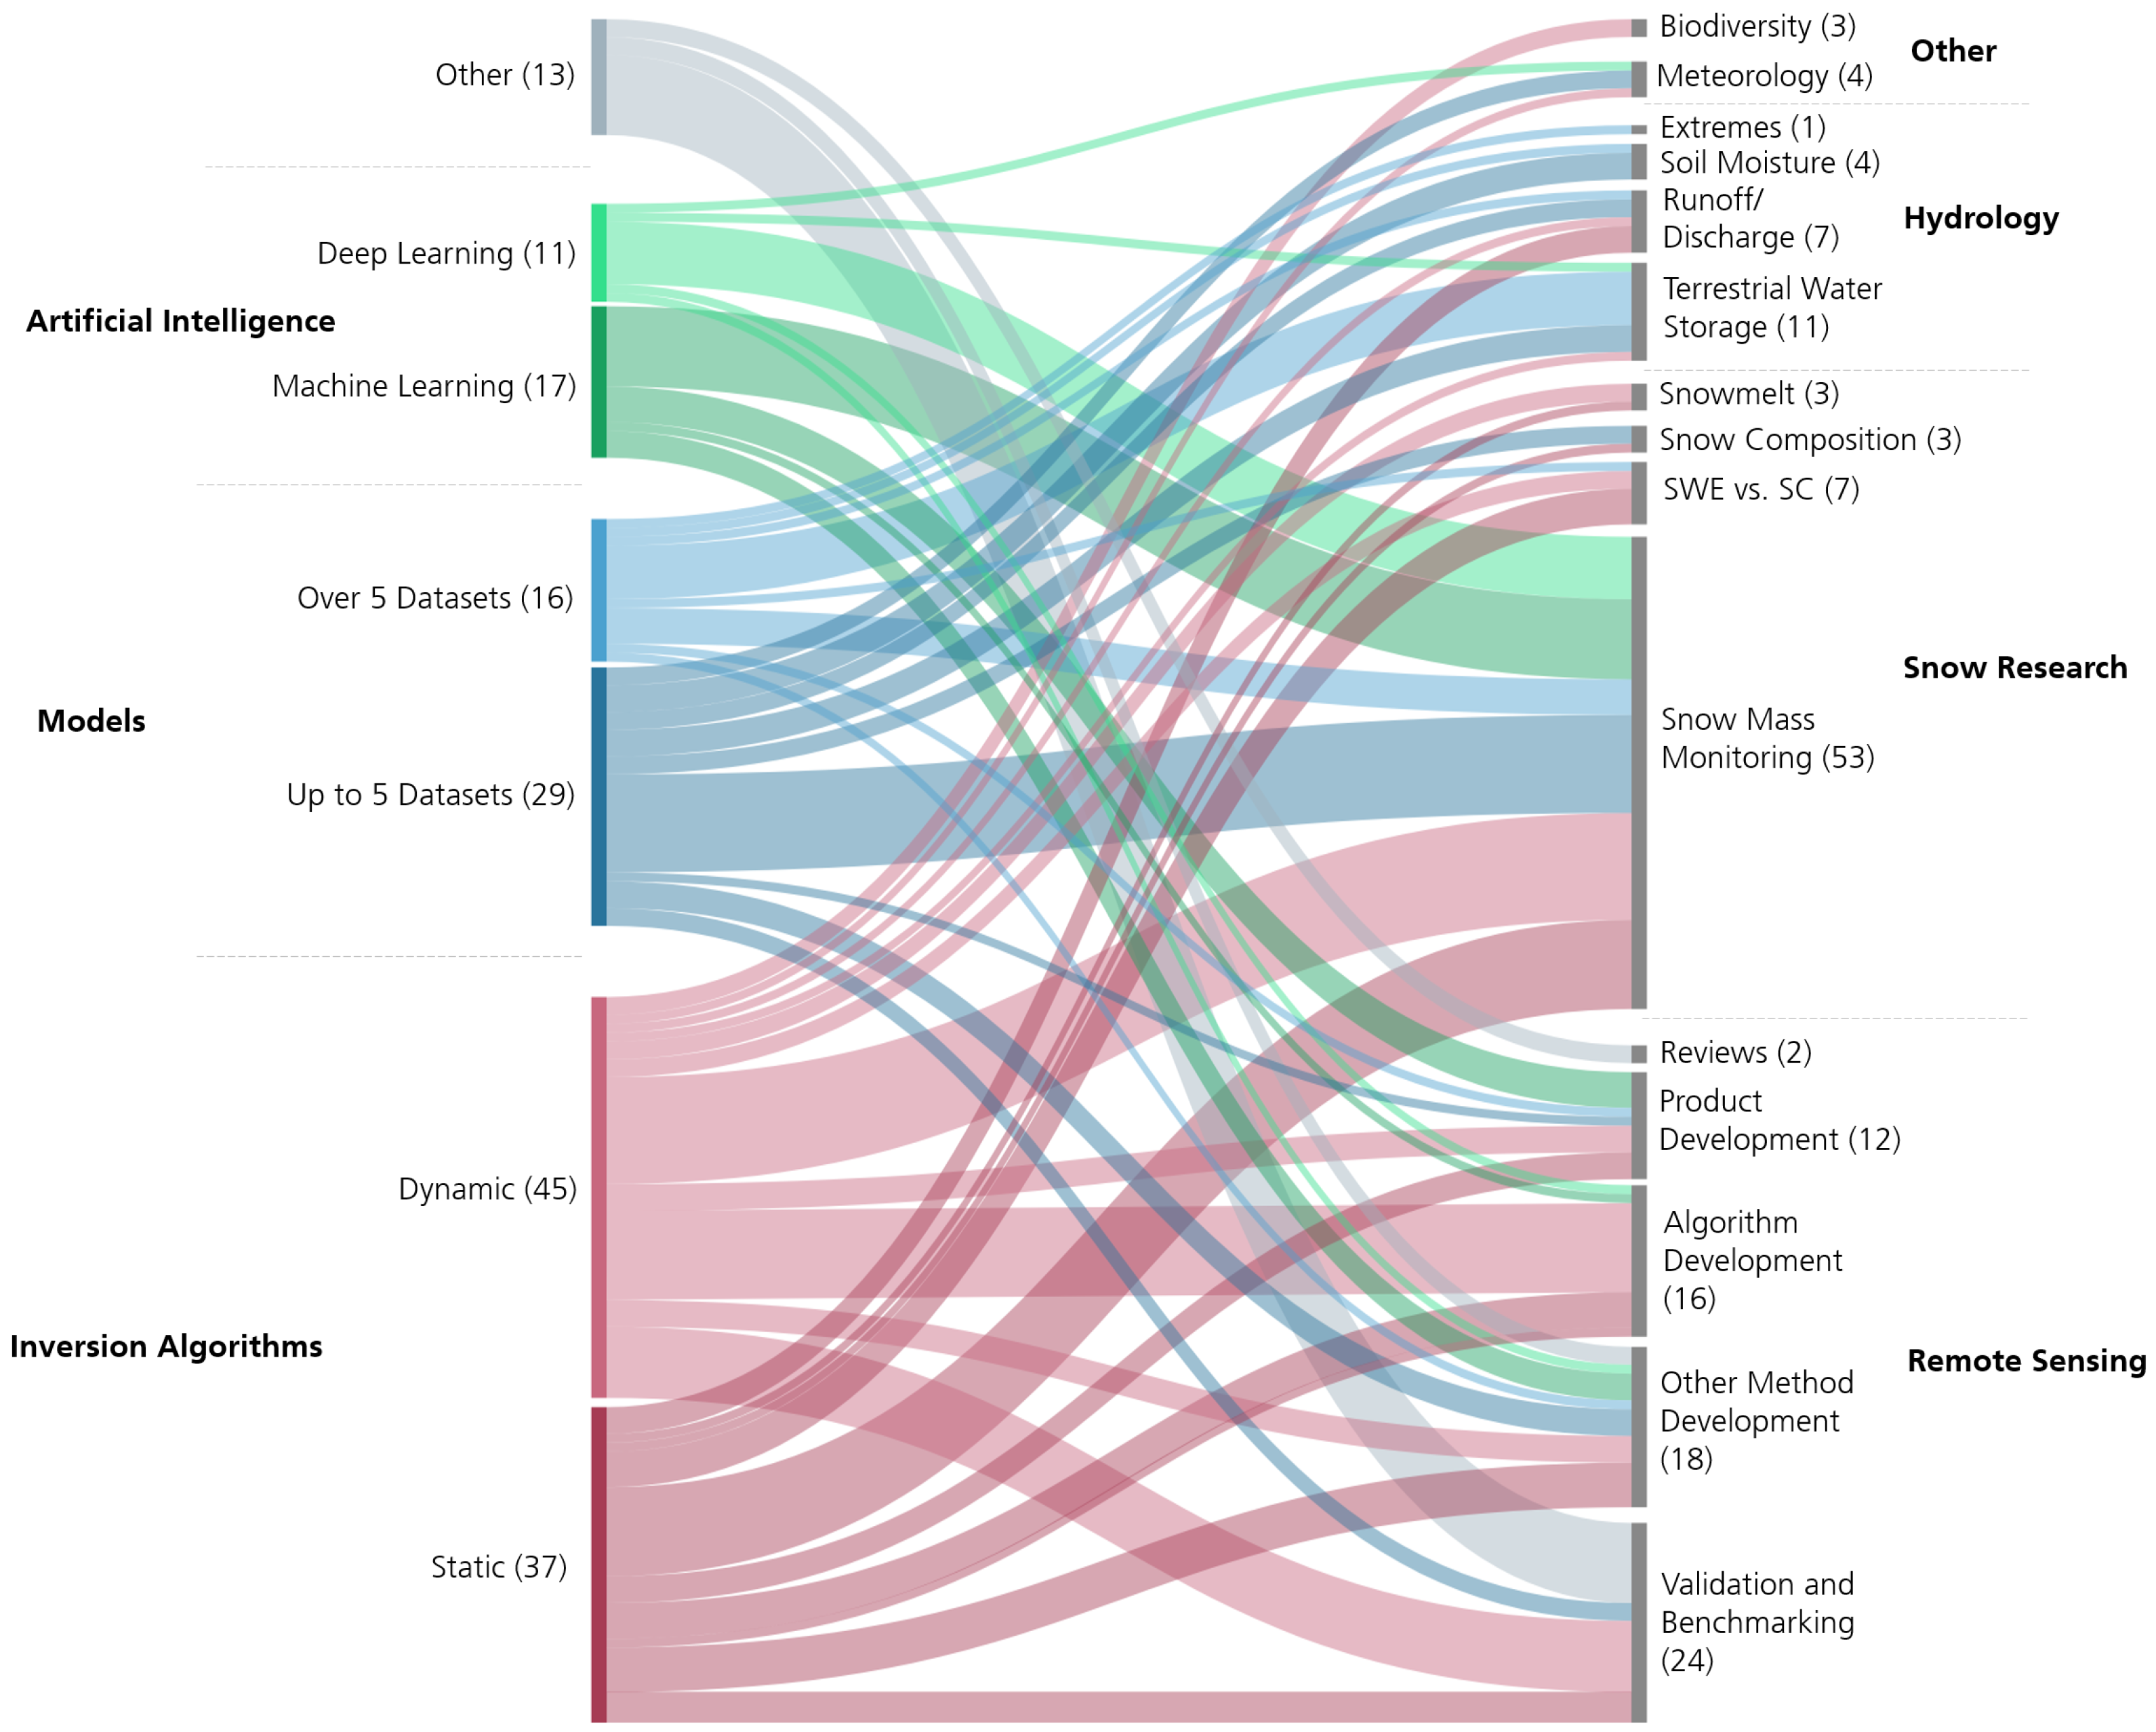
  • Thematic focus:
    -
    Primarily focused on remote sensing (n = 72) and snow research (n = 53).
    -
    There were 30 studies outside these areas, with 23 focused on hydrological topics, mainly terrestrial water storage.
  • Long-term studies:
    -
    Consensus on a general decrease in SWE across the Northern Hemisphere in studies >30 years.
    -
    Variations in regional, seasonal, and strength of trends, as well as differences in significance observed.
  • Main challenges:
    -
    PMW is not suited for mountainous regions, as deep snow and complex terrain cannot be depicted accurately.
    -
    Various snow parameters such as density, grain size, or liquid water content impede the PMW-based SWE estimation.
    -
    Land cover features such as forests or water bodies influence how the PMW signal is attenuated and, thus, have to be addressed in the study design.
In summary, our analysis highlights the dynamic evolution of SWE estimation studies. Despite limitations in our search scope, especially at smaller scales and in specific fields, a focus on remote sensing and snow research becomes evident. Few studies integrate existing SWE data with other topics, and none forecast future SWE evolution. Future research is anticipated to address PMW data challenges and explore downscaling with advanced models, newer sensors, and higher resolution auxiliary data, potentially employing AI. The potential of current SWE data for broader analyses currently remains largely untapped. Thus, expanding research focus and integrating forecasting, also possibly utilizing AI, or combining PMW with other data such as gravimetric measurements may be crucial. Only in this way can the key role of snow in various ecological and social contexts be quantified and the research be linked to real effects on social developments and political decisions.

Author Contributions

Conceptualization, S.S., A.D. and C.K.; writing—original draft preparation, S.S.; writing—review and editing, S.S., A.D. and C.K.; visualization, S.S.; supervision, C.K. All authors have read and agreed to the published version of the manuscript.

Funding

This study has been supported by the DLR Polar Monitor II project.

Data Availability Statement

Not applicable.

Acknowledgments

We would like to express our gratitude to Kjirsten Coleman, Jonas Koehler, Philipp Reiners, Patrick Sogno, and Robin Spanier for their support in various stages of the review process.

Conflicts of Interest

The authors declare no conflicts of interest.

References

  1. Bormann, K.J.; Brown, R.D.; Derksen, C.; Painter, T.H. Estimating snow-cover trends from space. Nat. Clim. Chang. 2018, 8, 924–928. [Google Scholar] [CrossRef]
  2. Wester, P.; Mishra, A.; Mukherji, A.; Shrestha, A. The Hindu Kush Himalaya Assessment: Mountains, Climate Change, Sustainability and People; Springer: Berlin/Heidelberg, Germany, 2019. [Google Scholar] [CrossRef]
  3. United Nations Department of Economic and Social Affairs, Population Division. World Population Prospects 2022: Summary of Results; Technical Report 3; United Nations Department of Economic and Social Affairs, Population Division: New York, NY, USA, 2022. [Google Scholar]
  4. Rixen, C.; Høye, T.T.; Macek, P.; Aerts, R.; Kumar, M.; Andeson, J.A.; Arnold, P.A.; Barrio, I.C.; Bjerke, J.W.; Björkman, M.; et al. Winters are changing: Snow effects on Arctic and alpine tundra ecosystems. Arctic Sci. 2022, 8, 572–608. [Google Scholar] [CrossRef]
  5. Engler, R.; Randin, C.; Thuiller, W.; Dullinger, S.; Zimmermann, N.; Araújo, M.; Pearman, P.; Lay, G.L.; Piedallu, C.; Albert, C.; et al. 21st century climate change threatens mountain flora unequally across Europe. Glob. Chang. Biol. 2011, 17, 2330–2341. [Google Scholar] [CrossRef]
  6. Zimova, M.; Hackländer, K.; Good, J.; Melo-Ferreira, J.; Alves, P.; Mills, L.S. Function and underlying mechanisms of seasonal colour moulting in mammals and birds: What keeps them changing in a warming world? Biol. Rev. Camb. Philos. Soc. 2018, 93, 1478–1498. [Google Scholar] [CrossRef] [PubMed]
  7. Slatyer, R.A.; Umbers, K.D.L.; Arnold, P.A. Ecological responses to variation in seasonal snow cover. Conserv. Biol. 2022, 36, e13727. [Google Scholar] [CrossRef]
  8. Flanner, M.; Shell, K.M.; Barlage, M.; Perovich, D.K.; Tschudi, M. Radiative forcing and albedo feedback from the Northern Hemisphere cryosphere between 1979 and 2008. Nat. Geosci. 2011, 4, 151–155. [Google Scholar] [CrossRef]
  9. Tapley, B.D.; Watkins, M.T.; Flechtner, F.; Reigber, C.; Bettadpur, S.; Rodell, M.; Sasgen, I.; Famiglietti, J.S.; Landerer, F.W.; Chambers, D.P.; et al. Contributions of GRACE to understanding climate change. Nat. Clim. Chang. 2019, 9, 358–369. [Google Scholar] [CrossRef]
  10. Zona, D.; Gioli, B.; Commane, R.; Lindaas, J.; Wofsy, S.C.; Miller, C.C.; Dinardo, S.J.; Dengel, S.; Sweeney, C.; Karion, A.; et al. Cold season emissions dominate the Arctic tundra methane budget. Earth Atmos. Planetray Sci. 2016, 113, 40–45. [Google Scholar] [CrossRef]
  11. World Meteorological Organization (WMO). The 2022 GCOS ECVs Requirements—GCOS—245; World Meteorological Organization (WMO): Geneva, Switzeland, 2022. [Google Scholar]
  12. Pulliainen, J.; Grandell, J.; Hallikainen, M. HUT snow emission model and its applicability to snow water equivalent retrieval. IEEE Trans. Geosci. Remote Sens. 1999, 37, 1378–1390. [Google Scholar] [CrossRef]
  13. Pulliainen, J.; Luojus, K.; Derksen, C.; Mudryk, L.; Lemmetyinen, J.; Salminen, M.; Ikonen, J.; Takala, M.; Cohen, J.; Smolander, T.; et al. Patterns and trends of Northern Hemisphere snow mass from 1980 to 2018. Nature 2020, 581, 294–298. [Google Scholar] [CrossRef] [PubMed]
  14. Musselman, K.N.; Addor, N.; Vano, J.A.; Molotch, N.P. Winter melt trends portend widespread declines in snow water resources. Nat. Clim. Chang. 2021, 11, 418–424. [Google Scholar] [CrossRef] [PubMed]
  15. Viviroli, D.; Archer, D.; Buytaert, W.; Fowler, H.; Greenwood, G.; Hamlet, A.; Huang, Y.; Koboltschnig, G.; Litaor, M.; López-Moreno, J.; et al. Climate change and mountain water resources: Overview and recommendations for research, management and policy. Hydrol. Earth Syst. Sci. 2011, 15, 471–504. [Google Scholar] [CrossRef]
  16. Huning, L.; Aghakouchak, A. Global snow drought hot spots and characteristics. Proc. Natl. Acad. Sci. USA 2020, 117, 19753–19759. [Google Scholar] [CrossRef] [PubMed]
  17. Qin, Y.; Abatzoglou, J.T.; Siebert, S.; Huning, L.S.; AghaKouchak, A.; Mankin, J.S.; Hong, C.; Tong, D.; Davis, S.J.; Mueller, N.D. Agricultural risks from changing snowmelt. Nat. Clim. Chang. 2020, 10, 459–465. [Google Scholar] [CrossRef]
  18. Siirila-Woodburn, E.R.; Rhoades, A.M.; Hatchett, B.J.; Huning, L.S.; Szinai, J.; Tague, C.L.; Nico, P.S.; Feldman, D.; Jones, A.D.; Collins, W.D.; et al. A low-to-no snow future and its impacts on water resources in the western United States. Nat. Rev. Earth Environ. 2021, 2, 800–819. [Google Scholar] [CrossRef]
  19. Berghuijs, W.; Woods, R.; Hutton, C.; Sivapalan, M. Dominant flood generating mechanisms across the United States. Geophys. Res. Lett. 2016, 43, 4382–4390. [Google Scholar] [CrossRef]
  20. Reager, J.T.; Famiglietti, J. Global terrestrial water storage capacity and flood potential using GRACE. Geophys. Res. Lett. 2009, 36, L23402. [Google Scholar] [CrossRef]
  21. Zhou, H.; Zhang, L.; Liu, X.; Liang, D.; Zhu, Q.; Gou, Y. Study of the Relationship between High Mountain Asia Snow Cover and Drought and Flood in the Yangtze River Basin during 1980–2019. Remote Sens. 2022, 14, 3588. [Google Scholar] [CrossRef]
  22. Musselman, K.N.; Lehner, F.; Ikeda, K.; Clark, M.P.; Prein, A.F.; Liu, C.; Barlage, M.; Rasmussen, R. Projected increases and shifts in rain-on-snow flood risk over n North America. Nat. Clim. Chang. 2018, 8, 808–812. [Google Scholar] [CrossRef]
  23. Zhang, S.; Zhou, L.; Zhang, L.; Yang, Y.; Wei, Z.; Zhou, S.; Yang, D.; Yang, X.; Wu, X.; Zhang, Y.; et al. Reconciling disagreement on global river flood changes in a warming climate. Nat. Clim. Chang. 2022, 12, 1160–1167. [Google Scholar] [CrossRef]
  24. Ballesteros-Cánovas, J.A.; Trappmann, D.; Madrigal-González, J.; Eckert, N.; Stoffel, M. Climate warming enhances snow avalanche risk in the Western Himalayas. Proc. Natl. Acad. Sci. USA 2018, 115, 3410–3415. [Google Scholar] [CrossRef]
  25. Zgheib, T.; Giacona, F.; Granet-Abisset, A.M.; Morin, S.; Lavigne, A.; Eckert, N. Spatio-temporal variability of avalanche risk in the French Alps. Reg. Environ. Chang. 2022, 22, 8. [Google Scholar] [CrossRef]
  26. Brandt, R.; Kaenzig, R.; Lachmuth, S. Migration as a Risk Management Strategy in the Context of Climate Change: Evidence from the Bolivian Andes. In Global Migration Issues; Springer: Berlin/Heidelberg, Germany, 2016. [Google Scholar] [CrossRef]
  27. Prasain, S. Climate change adaptation measure on agricultural communities of Dhye in Upper Mustang, Nepal. Clim. Chang. 2018, 148, 279–291. [Google Scholar] [CrossRef]
  28. Maurel, M.; Tuccio, M. Climate Instability, Urbanisation and International Migration. J. Dev. Stud. 2016, 52, 735–752. [Google Scholar] [CrossRef]
  29. Arheimer, B.; Hjerdt, N.; Lindström, G. Artificially Induced Floods to Manage Forest Habitats Under Climate Change. Front. Environ. Sci. 2018, 6, 102. [Google Scholar] [CrossRef]
  30. Russo, M.; Carvalho, D.F.; Martins, N.; Monteiro, A.; Russo, M.; Carvalho, D.F.; Martins, N.; Monteiro, A. Forecasting the inevitable: A review on the impacts of climate change on renewable energy resources. Sustain. Energy Technol. Assess. 2022, 52, 102283. [Google Scholar] [CrossRef]
  31. Morin, S.; Samacoïts, R.; François, H.; Carmagnola, C.M.; Abegg, B.; Demiroglu, O.C.; Pons, M.; Soubeyroux, J.M.; Lafaysse, M.; Franklin, S.; et al. Pan-European meteorological and snow indicators of climate change impact on ski tourism. Clim. Serv. 2021, 22, 100215. [Google Scholar] [CrossRef] [PubMed]
  32. Scott, D.; Steiger, R.; Rutty, M.; Knowles, N.; Rushton, B. Future climate change risk in the US Midwestern ski industry. Tour. Manag. Perspect. 2021, 40, 100875. [Google Scholar] [CrossRef]
  33. Willibald, F.; Kotlarski, S.; Ebner, P.P.; Bavay, M.; Marty, C.; Trentini, F.v.; Ludwig, R.; Grêt-Regamey, A. Vulnerability of ski tourism towards internal climate variability and climate change in the Swiss Alps. Sci. Total Environ. 2021, 784, 147054. [Google Scholar] [CrossRef] [PubMed]
  34. Jurt, C.; Burga, M.D.; Vicuña, L.; Huggel, C.; Orlove, B. Local perceptions in climate change debates: Insights from case studies in the Alps and the Andes. Clim. Chang. 2015, 133, 511–523. [Google Scholar] [CrossRef]
  35. Tschakert, P.; Ellis, N.; Anderson, C.; Kelly, A.; Obeng, J. One thousand ways to experience loss: A systematic analysis of climate-related intangible harm from around the world. Glob. Environ. Chang.-Hum. Policy Dimens. 2019, 55, 58–72. [Google Scholar] [CrossRef]
  36. Gudex-Cross, D.; Zhu, L.; Keyser, S.R.; Zuckerberg, B.; Pauli, J.N.; Radeloff, V.C.; Fleishman, E. Winter conditions structure extratropical patterns of species richness of amphibians, birds and mammals globally. Glob. Ecol. Biogeogr. 2022, 31, 1366–1380. [Google Scholar] [CrossRef]
  37. Zimova, M.; Giery, S.T.; Newey, S.; Nowak, J.J.; Spencer, M.; Mills, L.S. Lack of phenological shift leads to increased camouflage mismatch in mountain hares. Proc. R. Soc. B Biol. Sci. 2020, 287, 20201786. [Google Scholar] [CrossRef]
  38. Melin, M.; Mehtätalo, L.; Helle, P.; Ikonen, K.; Packalen, T. Decline of the boreal willow grouse (Lagopus lagopus) has been accelerated by more frequent snow-free springs. Sci. Rep. 2020, 10, 6987. [Google Scholar] [CrossRef]
  39. Loe, L.; Hansen, B.; Stien, A.; Albon, S.; Bischof, R.; Carlsson, A.M.; Irvine, J.; Meland, M.; Rivrud, I.M.; Ropstad, E.; et al. Behavioral buffering of extreme weather events in a high-Arctic herbivore. Ecosphere 2016, 7, e01374. [Google Scholar] [CrossRef]
  40. Williams, C.; Henry, H.; Sinclair, B. Cold truths: How winter drives responses of terrestrial organisms to climate change. Biol. Rev. Camb. Philos. Soc. 2015, 90, 214–235. [Google Scholar] [CrossRef]
  41. Inouye, D. Effects of climate change on alpine plants and their pollinators. Ann. N. Y. Acad. Sci. 2020, 1469, 26–37. [Google Scholar] [CrossRef] [PubMed]
  42. Kelsey, K.C.; Pedersen, S.H.; Leffler, A.J.; Sexton, J.O.; Feng, M.; Welker, J.M. Winter snow and spring temperature have differential effects on vegetation phenology and productivity across Arctic plant communities. Glob. Chang. Biol. 2021, 27, 1572–1586. [Google Scholar] [CrossRef] [PubMed]
  43. Seastedt, T.; Oldfather, M. Climate Change, Ecosystem Processes and Biological Diversity Responses in High Elevation Communities. Climate 2021, 9, 87. [Google Scholar] [CrossRef]
  44. Wang, X.; Wang, T.; Guo, H.; Liu, D.; Zhao, Y.; Zhang, T.; Liu, Q.; Piao, S. Disentangling the mechanisms behind winter snow impact on vegetation activity in northern ecosystems. Glob. Chang. Biol. 2018, 24, 1651–1662. [Google Scholar] [CrossRef] [PubMed]
  45. Jia, G.J.; Epstein, H.E.; Walker, D.A. Greening of arctic Alaska, 1981–2001. Geophys. Res. Lett. 2003, 30, 2067. [Google Scholar] [CrossRef]
  46. Derksen, C.; Brown, R.; Walker, A. Merging Conventional (1915–1992) and Passive Microwave (1978–2002) Estimates of Snow Extent and Water Equivalent over Central North America. J. Hydrometeorol. 2004, 5, 850–861. [Google Scholar] [CrossRef]
  47. Dahe, Q.; Shiyin, L.; Peiji, L. Snow Cover Distribution, Variability, and Response to Climate Change in Western China. J. Clim. 2006, 19, 1820–1833. [Google Scholar] [CrossRef]
  48. Dietz, A.J.; Kuenzer, C.; Dech, S. Global SnowPack: A new set of snow cover parameters for studying status and dynamics of the planetary snow cover extent. Remote Sens. Lett. 2015, 6, 844–853. [Google Scholar] [CrossRef]
  49. Marshall, H.P.; Buehler, Y. Airborne and Spaceborne Snow Remote Sensing with Optical and Microwave Sensors: A Review of Current Approaches and Future Outlook for Avalanche Applications. In Proceedings of the International Snow Science Workshop, Bend, OR, USA, 8–13 October 2023. [Google Scholar]
  50. Kwon, Y.; Yoon, Y.; Forman, B.A.; Kumar, S.V.; Wang, L. Quantifying the observational requirements of a space-borne LiDAR snow mission. J. Hydrol. 2021, 601, 126709. [Google Scholar] [CrossRef]
  51. Steiner, L.; Studemann, G.; Grimm, D.; Marty, C.; Leinss, S.; Steiner, L.; Studemann, G.; Grimm, D.; Marty, C.; Leinss, S. (Near) Real-Time Snow Water Equivalent Observation Using GNSS Refractometry and RTKLIB. Sensors 2022, 22, 6918. [Google Scholar] [CrossRef] [PubMed]
  52. Nievinski, F.G.; Larson, K.M. Inverse Modeling of GPS Multipath for Snow Depth Estimation—Part I: Formulation and Simulations. IEEE Trans. Geosci. Remote Sens. 2014, 52, 6555–6563. [Google Scholar] [CrossRef]
  53. Leinss, S.; Wiesmann, A.; Lemmetyinen, J.; Hajnsek, I. Snow Water Equivalent of Dry Snow Measured by Differential Interferometry. IEEE J. Sel. Top. Appl. Earth Obs. Remote Sens. 2015, 8, 3773–3790. [Google Scholar] [CrossRef]
  54. Guneriussen, T.; Hogda, K.; Johnsen, H.; Lauknes, I. InSAR for estimation of changes in snow water equivalent of dry snow. IEEE Trans. Geosci. Remote Sens. 2001, 39, 2101–2108. [Google Scholar] [CrossRef]
  55. Eppler, J.; Rabus, B.; Morse, P. Snow water equivalent change mapping from slope-correlated synthetic aperture radar interferometry (InSAR) phase variations. Cryosphere 2022, 16, 1497–1521. [Google Scholar] [CrossRef]
  56. Premier, V.; Marin, C.; Bertoldi, G.; Barella, R.; Notarnicola, C.; Bruzzone, L. Exploring the use of multi-source high-resolution satellite data for snow water equivalent reconstruction over mountainous catchments. Cryosphere 2023, 17, 2387–2407. [Google Scholar] [CrossRef]
  57. Lievens, H.; Demuzere, M.; Marshall, H.P.; Reichle, R.H.; Brucker, L.; Brangers, I.; de Rosnay, P.; Dumont, M.; Girotto, M.; Immerzeel, W.W.; et al. Snow depth variability in the Northern Hemisphere mountains observed from space. Nat. Commun. 2019, 10, 4629. [Google Scholar] [CrossRef]
  58. Marin, C.; Bertoldi, G.; Premier, V.; Callegari, M.; Brida, C.; Hürkamp, K.; Tschiersch, J.; Zebisch, M.; Notarnicola, C. Use of Sentinel-1 radar observations to evaluate snowmelt dynamics in alpine regions. Cryosphere 2020, 14, 935–956. [Google Scholar] [CrossRef]
  59. Tsang, L.; Durand, M.; Derksen, C.; Barros, A.P.; Kang, D.H.; Lievens, H.; Marshall, H.P.; Zhu, J.; Johnson, J.; King, J.; et al. Review article: Global monitoring of snow water equivalent using high-frequency radar remote sensing. Cryosphere 2022, 16, 3531–3573. [Google Scholar] [CrossRef]
  60. Kornfeld, R.P.; Arnold, B.W.; Gross, M.A.; Dahya, N.T.; Klipstein, W.M.; Gath, P.F.; Bettadpur, S. GRACE-FO: The Gravity Recovery and Climate Experiment Follow-On Mission. J. Spacecr. Rocket. 2019, 56, 931–951. [Google Scholar] [CrossRef]
  61. Bahrami, A.; Goïta, K.; Magagi, R. Analysing the contribution of snow water equivalent to the terrestrial water storage over Canada. Hydrol. Process. 2020, 34, 175–188. [Google Scholar] [CrossRef]
  62. Biancamaria, S.; Cazenave, A.; Mognard, N.M.; Llovel, W.; Frappart, F. Satellite-based high latitude snow volume trend, variability and contribution to sea level over 1989/2006. Glob. Planet. Chang. 2011, 75, 99–107. [Google Scholar] [CrossRef]
  63. Yang, P.; Xia, J.; Zhan, C.; Wang, T. Reconstruction of terrestrial water storage anomalies in Northwest China during 1948–2002 using GRACE and GLDAS products. Hydrol. Res. 2018, 49, 1594–1607. [Google Scholar] [CrossRef]
  64. Cao, Q.; Clark, E.A.; Mao, Y.; Lettenmaier, D.P. Trends and Interannual Variability in Terrestrial Water Storage Over the Eastern United States, 2003–2016. Water Resour. Res. 2019, 55, 1928–1950. [Google Scholar] [CrossRef]
  65. Zhao, M.; A, G.; Velicogna, I.; Kimball, J.S. A Global Gridded Dataset of GRACE Drought Severity Index for 2002–2014: Comparison with PDSI and SPEI and a Case Study of the Australia Millennium Drought. J. Hydrometeorol. 2017, 18, 2117–2129. [Google Scholar] [CrossRef]
  66. Suzuki, K.; Matsuo, K.; Yamazaki, D.; Ichii, K.; Iijima, Y.; Papa, F.; Yanagi, Y.; Hiyama, T. Hydrological Variability and Changes in the Arctic Circumpolar Tundra and the Three Largest Pan-Arctic River Basins from 2002 to 2016. Remote Sens. 2018, 10, 402. [Google Scholar] [CrossRef]
  67. Yin, W.; Yang, S.; Hu, L.; Tian, S.; Wang, X.; Zhao, R.; Li, P. Improving understanding of spatiotemporal water storage changes over China based on multiple datasets. J. Hydrol. 2022, 612, 128098. [Google Scholar] [CrossRef]
  68. Chang, A.T.C.; Foster, J.L.; Hall, D.K. Nimbus-7 SMMR Derived Global Snow Cover Parameters. Ann. Glaciol. 1987, 9, 39–44. [Google Scholar] [CrossRef]
  69. Dong, J.; Walker, J.P.; Houser, P.R. Factors affecting remotely sensed snow water equivalent uncertainty. Remote Sens. Environ. 2005, 97, 68–82. [Google Scholar] [CrossRef]
  70. Foster, J. Comparison of snow mass estimates from a prototype passive microwave snow algorithm, a revised algorithm and a snow depth climatology. Remote Sens. Environ. 1997, 62, 132–142. [Google Scholar] [CrossRef]
  71. Rango, A. Spaceborne remote sensing for snow hydrology applications. Hydrol. Sci. J. 1996, 41, 477–494. [Google Scholar] [CrossRef]
  72. Kelly, R.; Chang, A.T.C. Development of a passive microwave global snow depth retrieval algorithm for Special Sensor Microwave Imager (SSM/I) and Advanced Microwave Scanning Radiometer-EOS (AMSR-E) data. Radio Sci. 2003, 38, 41-1–41-11. [Google Scholar] [CrossRef]
  73. Josberger, E.G.; Mognard, N.M. A passive microwave snow depth algorithm with a proxy for snow metamorphism. Hydrol. Process. 2002, 16, 1557–1568. [Google Scholar] [CrossRef]
  74. Foster, J.L.; Sun, C.; Walker, J.P.; Kelly, R.; Chang, A.; Dong, J.; Powell, H. Quantifying the uncertainty in passive microwave snow water equivalent observations. Remote Sens. Environ. 2005, 94, 187–203. [Google Scholar] [CrossRef]
  75. Derksen, C.; Walker, A.; LeDrew, E.; Goodison, B. Combining SMMR and SSM/I Data for Time Series Analysis of Central North American Snow Water Equivalent. J. Hydrometeorol. 2003, 4, 304–316. [Google Scholar] [CrossRef]
  76. Tanniru, S.; Ramsankaran, R. Passive Microwave Remote Sensing of Snow Depth: Techniques, Challenges and Future Directions. Remote Sens. 2023, 15, 1052. [Google Scholar] [CrossRef]
  77. Taheri, M.; Mohammadian, A. An Overview of Snow Water Equivalent: Methods, Challenges, and Future Outlook. Sustainability 2022, 14, 11395. [Google Scholar] [CrossRef]
  78. Kauffman, G.J. Governance, Policy, and Economics of Intergovernmental River Basin Management. Water Resour. Manag. 2015, 29, 5689–5712. [Google Scholar] [CrossRef]
  79. Uereyen, S.; Kuenzer, C. A Review of Earth Observation-Based Analyses for Major River Basins. Remote Sens. 2019, 11, 2951. [Google Scholar] [CrossRef]
  80. Jiang, L.; Yang, J.; Zhang, C.; Wu, S.; Li, Z.; Dai, L.; Li, X.; Qiu, Y. Daily snow water equivalent product with SMMR, SSM/I and SSMIS from 1980 to 2020 over China. Big Earth Data 2022, 6, 420–434. [Google Scholar] [CrossRef]
  81. Rango, A.; Chang, A.T.C.; Foster, J.L. The Utilization of Spaceborne Microwave Radiometers for Monitoring Snowpack Properties. Hydrol. Res. 1979, 10, 25–40. [Google Scholar] [CrossRef]
  82. Tuttle, S.E.; Jacobs, J.M.; Vuyovich, C.M.; Olheiser, C.; Cho, E. Intercomparison of snow water equivalent observations in the Northern Great Plains. Hydrol. Process. 2018, 32, 817–829. [Google Scholar] [CrossRef]
  83. Wang, J.; Tedesco, M. Identification of atmospheric influences on the estimation of snow water equivalent from AMSR-E measurements. Remote Sens. Environ. 2007, 111, 398–408. [Google Scholar] [CrossRef]
  84. Chang, A.T.C.; Foster, J.L.; Kelly, R.E.J.; Josberger, E.G.; Armstrong, R.L.; Mognard, N.M. Analysis of Ground-Measured and Passive-Microwave-Derived Snow Depth Variations in Midwinter across the Northern Great Plains. J. Hydrometeorol. 2005, 6, 20–33. [Google Scholar] [CrossRef]
  85. Kongoli, C. Interpretation of AMSU microwave measurements for the retrievals of snow water equivalent and snow depth. J. Geophys. Res. 2004, 109, D24111. [Google Scholar] [CrossRef]
  86. Papa, F.; Legresy, B.; Mognard, N.; Josberger, E.; Remy, F. Estimating terrestrial snow depth with the TOPEX-Poseidon altimeter and radiometer. IEEE Trans. Geosci. Remote Sens. 2002, 40, 2162–2169. [Google Scholar] [CrossRef]
  87. Mognard, N.M.; Josberger, E.G. Northern Great Plains 1996/97 seasonal evolution of snowpack parameters from satellite passive-microwave measurements. Ann. Glaciol. 2002, 34, 15–23. [Google Scholar] [CrossRef]
  88. Cho, E.; Tuttle, S.; Jacobs, J. Evaluating Consistency of Snow Water Equivalent Retrievals from Passive Microwave Sensors over the North Central U. S.: SSM/I vs. SSMIS and AMSR-E vs. AMSR2. Remote Sens. 2017, 9, 465. [Google Scholar] [CrossRef]
  89. Azar, A.E.; Ghedira, H.; Romanov, P.; Mahani, S.; Tedesco, M.; Khanbilvardi, R. Application of Satellite Microwave Images in Estimating Snow Water Equivalent 1. JAWRA J. Am. Water Resour. Assoc. 2008, 44, 1347–1362. [Google Scholar] [CrossRef]
  90. Ge, Y.; Gong, G. Observed Inconsistencies between Snow Extent and Snow Depth Variability at Regional/Continental Scales. J. Clim. 2008, 21, 1066–1082. [Google Scholar] [CrossRef]
  91. Derksen, C.; Walker, A. Identification of systematic bias in the cross-platform (SMMR and SSM/I) EASE-Grid brightness temperature time series. IEEE Trans. Geosci. Remote Sens. 2003, 41, 910–915. [Google Scholar] [CrossRef]
  92. Derksen, C.; Walker, A.; LeDrew, E.; Goodison, B. Time-series analysis of passive-microwave-derived central North American snow water equivalent imagery. Ann. Glaciol. 2002, 34, 1–7. [Google Scholar] [CrossRef]
  93. Gan, Y.; Zhang, Y.; Kongoli, C.; Grassotti, C.; Liu, Y.; Lee, Y.K.; Seo, D.J. Evaluation and blending of ATMS and AMSR2 snow water equivalent retrievals over the conterminous United States. Remote Sens. Environ. 2021, 254, 112280. [Google Scholar] [CrossRef]
  94. Kumar, S.V.; Jasinski, M.; Mocko, D.M.; Rodell, M.; Borak, J.; Li, B.; Beaudoing, H.K.; Peters-Lidard, C.D. NCA-LDAS Land Analysis: Development and Performance of a Multisensor, Multivariate Land Data Assimilation System for the National Climate Assessment. J. Hydrometeorol. 2019, 20, 1571–1593. [Google Scholar] [CrossRef]
  95. Kumar, S.V.; Zaitchik, B.F.; Peters-Lidard, C.D.; Rodell, M.; Reichle, R.; Li, B.; Jasinski, M.; Mocko, D.; Getirana, A.; De Lannoy, G.; et al. Assimilation of Gridded GRACE Terrestrial Water Storage Estimates in the North American Land Data Assimilation System. J. Hydrometeorol. 2016, 17, 1951–1972. [Google Scholar] [CrossRef]
  96. Kumar, S.V.; Peters-Lidard, C.D.; Arsenault, K.R.; Getirana, A.; Mocko, D.; Liu, Y. Quantifying the Added Value of Snow Cover Area Observations in Passive Microwave Snow Depth Data Assimilation. J. Hydrometeorol. 2015, 16, 1736–1741. [Google Scholar] [CrossRef]
  97. Kumar, S.V.; Peters-Lidard, C.D.; Mocko, D.; Reichle, R.; Liu, Y.; Arsenault, K.R.; Xia, Y.; Ek, M.; Riggs, G.; Livneh, B.; et al. Assimilation of Remotely Sensed Soil Moisture and Snow Depth Retrievals for Drought Estimation. J. Hydrometeorol. 2014, 15, 2446–2469. [Google Scholar] [CrossRef]
  98. Vuyovich, C.M.; Jacobs, J.M.; Daly, S.F. Comparison of passive microwave and modeled estimates of total watershed SWE in the continental United States. Water Resour. Res. 2014, 50, 9088–9102. [Google Scholar] [CrossRef]
  99. Tedesco, M.; Narvekar, P.S. Assessment of the NASA AMSR-E SWE Product. IEEE J. Sel. Top. Appl. Earth Obs. Remote Sens. 2010, 3, 141–159. [Google Scholar] [CrossRef]
  100. Ma, H.; Zhang, G.; Mao, R.; Su, B.; Liu, W.; Shi, P. Snow depth variability across the Qinghai Plateau and its influencing factors during 1980–2018. Int. J. Climatol. 2023, 43, 1094–1111. [Google Scholar] [CrossRef]
  101. Wei, P.; Zhang, T.; Zhou, X.; Yi, G.; Li, J.; Wang, N.; Wen, B. Reconstruction of Snow Depth Data at Moderate Spatial Resolution (1 km) from Remotely Sensed Snow Data and Multiple Optimized Environmental Factors: A Case Study over the Qinghai-Tibetan Plateau. Remote Sens. 2021, 13, 657. [Google Scholar] [CrossRef]
  102. Wang, J.; Huang, X.; Wang, Y.; Liang, T. Retrieving Snow Depth Information From AMSR2 Data for Qinghai–Tibet Plateau. IEEE J. Sel. Top. Appl. Earth Obs. Remote Sens. 2020, 13, 752–768. [Google Scholar] [CrossRef]
  103. Wang, Y.; Huang, X.; Wang, J.; Zhou, M.; Liang, T. AMSR2 snow depth downscaling algorithm based on a multifactor approach over the Tibetan Plateau, China. Remote Sens. Environ. 2019, 231, 111268. [Google Scholar] [CrossRef]
  104. Dai, L.; Che, T.; Xie, H.; Wu, X. Estimation of Snow Depth over the Qinghai-Tibetan Plateau Based on AMSR-E and MODIS Data. Remote Sens. 2018, 10, 1989. [Google Scholar] [CrossRef]
  105. Dai, L.; Che, T.; Ding, Y.; Hao, X. Evaluation of snow cover and snow depth on the Qinghai–Tibetan Plateau derived from passive microwave remote sensing. Cryosphere 2017, 11, 1933–1948. [Google Scholar] [CrossRef]
  106. Ahmad, J.A.; Forman, B.A.; Kwon, Y. Analyzing Machine Learning Predictions of Passive Microwave Brightness Temperature Spectral Difference Over Snow-Covered Terrain in High Mountain Asia. Front. Earth Sci. 2019, 7, 212. [Google Scholar] [CrossRef]
  107. Kwon, Y.; Forman, B.A.; Ahmad, J.A.; Kumar, S.V.; Yoon, Y. Exploring the Utility of Machine Learning-Based Passive Microwave Brightness Temperature Data Assimilation over Terrestrial Snow in High Mountain Asia. Remote Sens. 2019, 11, 2265. [Google Scholar] [CrossRef]
  108. Smith, T.; Bookhagen, B. Assessing uncertainty and sensor biases in passive microwave data across High Mountain Asia. Remote Sens. Environ. 2016, 181, 174–185. [Google Scholar] [CrossRef]
  109. Smith, T.; Bookhagen, B. Changes in seasonal snow water equivalent distribution in High Mountain Asia (1987 to 2009). Sci. Adv. 2018, 4, e1701550. [Google Scholar] [CrossRef]
  110. Wang, S.; Zhou, F.; Russell, H. Estimating Snow Mass and Peak River Flows for the Mackenzie River Basin Using GRACE Satellite Observations. Remote Sens. 2017, 9, 256. [Google Scholar] [CrossRef]
  111. Forman, B.A.; Reichle, R.H.; Rodell, M. Assimilation of terrestrial water storage from GRACE in a snow-dominated basin: GRACE in a snow-dominated basin. Water Resour. Res. 2012, 48, W01507. [Google Scholar] [CrossRef]
  112. Tong, J.; Velicogna, I. A Comparison of AMSR-E/Aqua Snow Products with in situ Observations and MODIS Snow Cover Products in the Mackenzie River Basin, Canada. Remote Sens. 2010, 2, 2313–2322. [Google Scholar] [CrossRef]
  113. Tong, J.; Déry, S.J.; Jackson, P.L.; Derksen, C. Snow distribution from SSM/I and its relationships to the hydroclimatology of the Mackenzie River Basin, Canada. Adv. Water Resour. 2010, 33, 667–677. [Google Scholar] [CrossRef]
  114. Walker, A.E.; Silis, A. Snow-cover variations over the Mackenzie River basin, Canada, derived from SSM/I passive-microwave satellite data. Ann. Glaciol. 2002, 34, 8–14. [Google Scholar] [CrossRef]
  115. Zhu, L.; Zhang, Y.; Wang, J.; Tian, W.; Liu, Q.; Ma, G.; Kan, X.; Chu, Y. Downscaling Snow Depth Mapping by Fusion of Microwave and Optical Remote-Sensing Data Based on Deep Learning. Remote Sens. 2021, 13, 584. [Google Scholar] [CrossRef]
  116. Chen, L.; Muthu, B.; Cb, S. Estimating snow depth Inversion Model Assisted Vector Analysis based on temperature brightness for North Xinjiang region of China. Eur. J. Remote Sens. 2021, 54, 265–274. [Google Scholar] [CrossRef]
  117. Cao, Y.; Nan, Z.; Cheng, G.; Zhang, L. Hydrological Variability in the Arid Region of Northwest China from 2002 to 2013. Adv. Meteorol. 2018, 2018, 1502472. [Google Scholar] [CrossRef]
  118. Liang, J.; Liu, X.; Huang, K.; Li, X.; Shi, X.; Chen, Y.; Li, J. Improved snow depth retrieval by integrating microwave brightness temperature and visible/infrared reflectance. Remote Sens. Environ. 2015, 156, 500–509. [Google Scholar] [CrossRef]
  119. Zhou, Q.; Sun, B. Reliability of long-term snow depth data sets from remote sensing over the western arid zone of China. Remote Sens. Lett. 2013, 4, 1039–1048. [Google Scholar] [CrossRef]
  120. Dai, L.; Che, T.; Wang, J.; Zhang, P. Snow depth and snow water equivalent estimation from AMSR-E data based on a priori snow characteristics in Xinjiang, China. Remote Sens. Environ. 2012, 127, 14–29. [Google Scholar] [CrossRef]
  121. Hu, Y.; Che, T.; Dai, L.; Zhu, Y.; Xiao, L.; Deng, J.; Li, X. A long-term daily gridded snow depth dataset for the Northern Hemisphere from 1980 to 2019 based on machine learning. Big Earth Data 2023, 1–28. [Google Scholar] [CrossRef]
  122. Venäläinen, P.; Luojus, K.; Mortimer, C.; Lemmetyinen, J.; Pulliainen, J.; Takala, M.; Moisander, M.; Zschenderlein, L. Implementing spatially and temporally varying snow densities into the GlobSnow snow water equivalent retrieval. Cryosphere 2023, 17, 719–736. [Google Scholar] [CrossRef]
  123. Mortimer, C.; Mudryk, L.; Derksen, C.; Brady, M.; Luojus, K.; Venäläinen, P.; Moisander, M.; Lemmetyinen, J.; Takala, M.; Tanis, C.; et al. Benchmarking algorithm changes to the Snow CCI+ snow water equivalent product. Remote Sens. Environ. 2022, 274, 112988. [Google Scholar] [CrossRef]
  124. Kouki, K.; Räisänen, P.; Luojus, K.; Luomaranta, A.; Riihelä, A. Evaluation of Northern Hemisphere snow water equivalent in CMIP6 models during 1982–2014. Cryosphere 2022, 16, 1007–1030. [Google Scholar] [CrossRef]
  125. Shao, D.; Li, H.; Wang, J.; Hao, X.; Che, T.; Ji, W. Reconstruction of a daily gridded snow water equivalent product for the land region above 45° N based on a ridge regression machine learning approach. Earth Syst. Sci. Data 2022, 14, 795–809. [Google Scholar] [CrossRef]
  126. Qiao, D.; Li, Z.; Zeng, J.; Liang, S.; McColl, K.A.; Bi, H.; Zhou, J.; Zhang, P. Uncertainty Characterization of Ground-Based, Satellite, and Reanalysis Snow Depth Products Using Extended Triple Collocation. Water Resour. Res. 2022, 58, e2021WR030895. [Google Scholar] [CrossRef]
  127. Girotto, M.; Reichle, R.; Rodell, M.; Maggioni, V. Data Assimilation of Terrestrial Water Storage Observations to Estimate Precipitation Fluxes: A Synthetic Experiment. Remote Sens. 2021, 13, 1223. [Google Scholar] [CrossRef]
  128. Venäläinen, P.; Luojus, K.; Lemmetyinen, J.; Pulliainen, J.; Moisander, M.; Takala, M. Impact of dynamic snow density on GlobSnow snow water equivalent retrieval accuracy. Cryosphere 2021, 15, 2969–2981. [Google Scholar] [CrossRef]
  129. Hu, Y.; Che, T.; Dai, L.; Xiao, L. Snow Depth Fusion Based on Machine Learning Methods for the Northern Hemisphere. Remote Sens. 2021, 13, 1250. [Google Scholar] [CrossRef]
  130. Gonzalez, R.; Kummerow, C.D. AMSR-E Snow: Can Snowfall Help Improve SWE Estimates? J. Hydrometeorol. 2020, 21, 2551–2564. [Google Scholar] [CrossRef]
  131. Mortimer, C.; Mudryk, L.; Derksen, C.; Luojus, K.; Brown, R.; Kelly, R.; Tedesco, M. Evaluation of long-term Northern Hemisphere snow water equivalent products. Cryosphere 2020, 14, 1579–1594. [Google Scholar] [CrossRef]
  132. Xiao, L.; Che, T.; Dai, L. Evaluation of Remote Sensing and Reanalysis Snow Depth Datasets over the Northern Hemisphere during 1980–2016. Remote Sens. 2020, 12, 3253. [Google Scholar] [CrossRef]
  133. Xiao, X.; Zhang, T.; Zhong, X.; Li, X. Spatiotemporal Variation of Snow Depth in the Northern Hemisphere from 1992 to 2016. Remote Sens. 2020, 12, 2728. [Google Scholar] [CrossRef]
  134. Zhao, L.; Yang, Z.L. Multi-sensor land data assimilation: Toward a robust global soil moisture and snow estimation. Remote Sens. Environ. 2018, 216, 13–27. [Google Scholar] [CrossRef]
  135. Tedesco, M.; Jeyaratnam, J. A New Operational Snow Retrieval Algorithm Applied to Historical AMSR-E Brightness Temperatures. Remote Sens. 2016, 8, 1037. [Google Scholar] [CrossRef]
  136. Lin, P.; Wei, J.; Yang, Z.; Zhang, Y.; Zhang, K. Snow data assimilation-constrained land initialization improves seasonal temperature prediction. Geophys. Res. Lett. 2016, 43, 423–432. [Google Scholar] [CrossRef]
  137. Hancock, S.; Baxter, R.; Evans, J.; Huntley, B. Evaluating global snow water equivalent products for testing land surface models. Remote Sens. Environ. 2013, 128, 107–117. [Google Scholar] [CrossRef]
  138. Frei, A.; Tedesco, M.; Lee, S.; Foster, J.L.; Hall, D.K.; Kelly, R.; Robinson, D.A. A review of global satellite-derived snow products. Adv. Space Res. 2012, 50, 1007–1029. [Google Scholar] [CrossRef]
  139. Takala, M.; Luojus, K.; Pulliainen, J.; Derksen, C.; Lemmetyinen, J.; Kärnä, J.P.; Koskinen, J.; Bojkov, B. Estimating northern hemisphere snow water equivalent for climate research through assimilation of space-borne radiometer data and ground-based measurements. Remote Sens. Environ. 2011, 115, 3517–3529. [Google Scholar] [CrossRef]
  140. Clifford, D. Global estimates of snow water equivalent from passive microwave instruments: History, challenges and future developments. Int. J. Remote Sens. 2010, 31, 3707–3726. [Google Scholar] [CrossRef]
  141. Kongoli, C.; Dean, C.A.; Helfrich, S.R.; Ferraro, R.R. Evaluating the potential of a blended passive microwave-interactive multi-sensor product for improved mapping of snow cover and estimations of snow water equivalent. Hydrol. Process. 2007, 21, 1597–1607. [Google Scholar] [CrossRef]
  142. Frappart, F.; Ramillien, G.; Biancamaria, S.; Mognard, N.M.; Cazenave, A. Evolution of high-latitude snow mass derived from the GRACE gravimetry mission (2002–2004). Geophys. Res. Lett. 2006, 33, L02501. [Google Scholar] [CrossRef]
  143. Cordisco, E.; Prigent, C.; Aires, F. Snow characterization at a global scale with passive microwave satellite observations. J. Geophys. Res. 2006, 111, D19102. [Google Scholar] [CrossRef]
  144. Kelly, R.; Chang, A.; Tsang, L.; Foster, J. A prototype AMSR-E global snow area and snow depth algorithm. IEEE Trans. Geosci. Remote Sens. 2003, 41, 230–242. [Google Scholar] [CrossRef]
  145. Armstrong, R.L.; Brodzik, M.J. Hemispheric-scale comparison and evaluation of passive-microwave snow algorithms. Ann. Glaciol. 2002, 34, 38–44. [Google Scholar] [CrossRef]
  146. Gao, S.; Li, Z.; Zhang, P.; Chen, Q.; Huang, L.; Zhou, J.; Zhao, C.; Qiao, H.; Zheng, Z. A novel global snow depth retrieval method considering snow metamorphism and forest influence. Remote Sens. Environ. 2023, 295, 113712. [Google Scholar] [CrossRef]
  147. Pan, J.; Yang, J.; Jiang, L.; Xiong, C.; Pan, F.; Gao, X.; Shi, J.; Chang, S. Combination of Snow Process Model Priors and Site Representativeness Evaluation to Improve the Global Snow Depth Retrieval Based on Passive Microwaves. IEEE Trans. Geosci. Remote Sens. 2023, 61, 4301120. [Google Scholar] [CrossRef]
  148. Yoon, Y.; Kemp, E.M.; Kumar, S.V.; Wegiel, J.W.; Vuyovich, C.M.; Peters-Lidard, C. Development of a global operational snow analysis: The US Air Force Snow and Ice Analysis. Remote Sens. Environ. 2022, 278, 113080. [Google Scholar] [CrossRef]
  149. Xu, X.; Liu, X.; Li, X.; Shi, Q.; Chen, Y.; Ai, B. Global Snow Depth Retrieval From Passive Microwave Brightness Temperature With Machine Learning Approach. IEEE Trans. Geosci. Remote Sens. 2022, 60, 4302917. [Google Scholar] [CrossRef]
  150. Tangdamrongsub, N.; Hwang, C.; Borak, J.S.; Prabnakorn, S.; Han, J. Optimizing GRACE/GRACE-FO data and a priori hydrological knowledge for improved global terrestial water storage component estimates. J. Hydrol. 2021, 598, 126463. [Google Scholar] [CrossRef]
  151. Zhang, Y.; He, B.; Guo, L.; Liu, D. Differences in Response of Terrestrial Water Storage Components to Precipitation over 168 Global River Basins. J. Hydrometeorol. 2019, 20, 1981–1999. [Google Scholar] [CrossRef]
  152. Santi, E.; Pettinato, S.; Paloscia, S.; Pampaloni, P.; Macelloni, G.; Brogioni, M. An algorithm for generating soil moisture and snow depth maps from microwave spaceborne radiometers: HydroAlgo. Hydrol. Earth Syst. Sci. 2012, 16, 3659–3676. [Google Scholar] [CrossRef]
  153. Foster, J.L.; Hall, D.K.; Eylander, J.B.; Riggs, G.A.; Nghiem, S.V.; Tedesco, M.; Kim, E.; Montesano, P.M.; Kelly, R.E.J.; Casey, K.A.; et al. A blended global snow product using visible, passive microwave and scatterometer satellite data. Int. J. Remote Sens. 2011, 32, 1371–1395. [Google Scholar] [CrossRef]
  154. Zschenderlein, L.; Luojus, K.; Takala, M.; Venäläinen, P.; Pulliainen, J. Evaluation of passive microwave dry snow detection algorithms and application to SWE retrieval during seasonal snow accumulation. Remote Sens. Environ. 2023, 288, 113476. [Google Scholar] [CrossRef]
  155. Lin, H.; Cheng, X.; Zheng, L.; Peng, X.; Feng, W.; Peng, F. Recent Changes in Groundwater and Surface Water in Large Pan-Arctic River Basins. Remote Sens. 2022, 14, 607. [Google Scholar] [CrossRef]
  156. Lee, Y.K.; Kongoli, C.; Key, J. An In-Depth Evaluation of Heritage Algorithms for Snow Cover and Snow Depth Using AMSR-E and AMSR2 Measurements. J. Atmos. Ocean. Technol. 2015, 32, 2319–2336. [Google Scholar] [CrossRef]
  157. Luus, K.A.; Gel, Y.; Lin, J.C.; Kelly, R.E.J.; Duguay, C.R. Pan-Arctic linkages between snow accumulation and growing-season air temperature, soil moisture and vegetation. Biogeosciences 2013, 10, 7575–7597. [Google Scholar] [CrossRef]
  158. Seo, K.W.; Ryu, D.; Kim, B.M.; Waliser, D.E.; Tian, B.; Eom, J. GRACE and AMSR-E-based estimates of winter season solid precipitation accumulation in the Arctic drainage region. J. Geophys. Res. 2010, 115, D20117. [Google Scholar] [CrossRef]
  159. Biancamaria, S.; Mognard, N.M.; Boone, A.; Grippa, M.; Josberger, E.G. A satellite snow depth multi-year average derived from SSM/I for the high latitude regions. Remote Sens. Environ. 2008, 112, 2557–2568. [Google Scholar] [CrossRef]
  160. Tedesco, M.; Miller, J. Observations and statistical analysis of combined active–passive microwave space-borne data and snow depth at large spatial scales. Remote Sens. Environ. 2007, 111, 382–397. [Google Scholar] [CrossRef]
  161. Rawlins, M.A.; Fahnestock, M.; Frolking, S.; Vörösmarty, C.J. On the evaluation of snow water equivalent estimates over the terrestrial Arctic drainage basin. Hydrol. Process. 2007, 21, 1616–1623. [Google Scholar] [CrossRef]
  162. Niu, G.Y.; Seo, K.W.; Yang, Z.L.; Wilson, C.; Su, H.; Chen, J.; Rodell, M. Retrieving snow mass from GRACE terrestrial water storage change with a land surface model. Geophys. Res. Lett. 2007, 34, L15704. [Google Scholar] [CrossRef]
  163. Pulliainen, J. Mapping of snow water equivalent and snow depth in boreal and sub-arctic zones by assimilating space-borne microwave radiometer data and ground-based observations. Remote Sens. Environ. 2006, 101, 257–269. [Google Scholar] [CrossRef]
  164. Markus, T.; Powell, D.; Wang, J. Sensitivity of passive microwave snow depth retrievals to weather effects and snow evolution. IEEE Trans. Geosci. Remote Sens. 2006, 44, 68–77. [Google Scholar] [CrossRef]
  165. Oelke, C.; Zhang, T. A model study of circum-Arctic soil temperatures. Permafr. Periglac. Process. 2004, 15, 103–121. [Google Scholar] [CrossRef]
  166. Zhang, Y.; Ma, N. Spatiotemporal variability of snow cover and snow water equivalent in the last three decades over Eurasia. J. Hydrol. 2018, 559, 238–251. [Google Scholar] [CrossRef]
  167. Xiao, X.; Zhang, T.; Zhong, X.; Shao, W.; Li, X. Support vector regression snow-depth retrieval algorithm using passive microwave remote sensing data. Remote Sens. Environ. 2018, 210, 48–64. [Google Scholar] [CrossRef]
  168. Metsämäki, S.; Böttcher, K.; Pulliainen, J.; Luojus, K.; Cohen, J.; Takala, M.; Mattila, O.P.; Schwaizer, G.; Derksen, C.; Koponen, S. The accuracy of snow melt-off day derived from optical and microwave radiometer data—A study for Europe. Remote Sens. Environ. 2018, 211, 1–12. [Google Scholar] [CrossRef]
  169. Kongoli, C.; Key, J.; Smith, T. Mapping of Snow Depth by Blending Satellite and In-Situ Data Using Two-Dimensional Optimal Interpolation—Application to AMSR2. Remote Sens. 2019, 11, 3049. [Google Scholar] [CrossRef]
  170. Xue, Y.; Forman, B.A.; Reichle, R.H. Estimating Snow Mass in North America Through Assimilation of Advanced Microwave Scanning Radiometer Brightness Temperature Observations Using the Catchment Land Surface Model and Support Vector Machines. Water Resour. Res. 2018, 54, 6488–6509. [Google Scholar] [CrossRef] [PubMed]
  171. Xue, Y.; Forman, B.A. Atmospheric and Forest Decoupling of Passive Microwave Brightness Temperature Observations Over Snow-Covered Terrain in North America. IEEE J. Sel. Top. Appl. Earth Obs. Remote Sens. 2017, 10, 3172–3189. [Google Scholar] [CrossRef]
  172. Kwon, Y.; Yang, Z.L.; Hoar, T.J.; Toure, A.M. Improving the Radiance Assimilation Performance in Estimating Snow Water Storage across Snow and Land-Cover Types in North America. J. Hydrometeorol. 2017, 18, 651–668. [Google Scholar] [CrossRef]
  173. Kwon, Y.; Yang, Z.L.; Zhao, L.; Hoar, T.J.; Toure, A.M.; Rodell, M. Estimating Snow Water Storage in North America Using CLM4, DART, and Snow Radiance Data Assimilation. J. Hydrometeorol. 2016, 17, 2853–2874. [Google Scholar] [CrossRef]
  174. Xue, Y.; Forman, B.A. Comparison of passive microwave brightness temperature prediction sensitivities over snow-covered land in North America using machine learning algorithms and the Advanced Microwave Scanning Radiometer. Remote Sens. Environ. 2015, 170, 153–165. [Google Scholar] [CrossRef]
  175. Forman, B.A.; Reichle, R.H.; Derksen, C. Estimating Passive Microwave Brightness Temperature Over Snow-Covered Land in North America Using a Land Surface Model and an Artificial Neural Network. IEEE Trans. Geosci. Remote Sens. 2014, 52, 235–248. [Google Scholar] [CrossRef]
  176. Gan, T.Y.; Barry, R.G.; Gizaw, M.; Gobena, A.; Balaji, R. Changes in North American snowpacks for 1979–2007 detected from the snow water equivalent data of SMMR and SSM/I passive microwave and related climatic factors. J. Geophys. Res. Atmos. 2013, 118, 7682–7697. [Google Scholar] [CrossRef]
  177. Andreadis, K.M.; Lettenmaier, D.P. Implications of Representing Snowpack Stratigraphy for the Assimilation of Passive Microwave Satellite Observations. J. Hydrometeorol. 2012, 13, 1493–1506. [Google Scholar] [CrossRef]
  178. Su, H.; Yang, Z.L.; Dickinson, R.E.; Wilson, C.R.; Niu, G.Y. Multisensor snow data assimilation at the continental scale: The value of Gravity Recovery and Climate Experiment terrestrial water storage information. J. Geophys. Res. 2010, 115, D10104. [Google Scholar] [CrossRef]
  179. Su, H.; Yang, Z.L.; Niu, G.Y.; Dickinson, R.E. Enhancing the estimation of continental-scale snow water equivalent by assimilating MODIS snow cover with the ensemble Kalman filter. J. Geophys. Res. 2008, 113, D08120. [Google Scholar] [CrossRef]
  180. Terzago, S.; Von Hardenberg, J.; Palazzi, E.; Provenzale, A. Snow water equivalent in the Alps as seen by gridded data sets, CMIP5 and CORDEX climate models. Cryosphere 2017, 11, 1625–1645. [Google Scholar] [CrossRef]
  181. Tsutsui, H.; Maeda, T. Possibility of Estimating Seasonal Snow Depth Based Solely on Passive Microwave Remote Sensing on the Greenland Ice Sheet in Spring. Remote Sens. 2017, 9, 523. [Google Scholar] [CrossRef]
  182. Foster, J.; Hall, D.; Kelly, R.; Chiu, L. Seasonal snow extent and snow mass in South America using SMMR and SSM/I passive microwave data (1979–2006). Remote Sens. Environ. 2009, 113, 291–305. [Google Scholar] [CrossRef]
  183. Grippa, M.; Mognard, N.; Le Toan, T. Comparison between the interannual variability of snow parameters derived from SSM/I and the Ob river discharge. Remote Sens. Environ. 2005, 98, 35–44. [Google Scholar] [CrossRef]
  184. Grippa, M.; Mognard, N.; Le Toan, T.; Josberger, E. Siberia snow depth climatology derived from SSM/I data using a combined dynamic and static algorithm. Remote Sens. Environ. 2004, 93, 30–41. [Google Scholar] [CrossRef]
  185. Boone, A.; Mognard, N.; Decharme, B.; Douville, H.; Grippa, M.; Kerrigan, K. The impact of simulated soil temperatures on the estimation of snow depth over Siberia from SSM/I compared to a multi-model climatology. Remote Sens. Environ. 2006, 101, 482–494. [Google Scholar] [CrossRef]
  186. Grippa, M.; Kergoat, L.; Le Toan, T.; Mognard, N.; Delbart, N.; L’Hermitte, J.; Vicente-Serrano, S. The impact of snow depth and snowmelt on the vegetation variability over central Siberia. Geophys. Res. Lett. 2005, 32, L21412. [Google Scholar] [CrossRef]
  187. Bair, E.H.; Abreu Calfa, A.; Rittger, K.; Dozier, J. Using machine learning for real-time estimates of snow water equivalent in the watersheds of Afghanistan. Cryosphere 2018, 12, 1579–1594. [Google Scholar] [CrossRef]
  188. Rosenfeld, S.; Grody, N. Anomalous microwave spectra of snow cover observed from Special Sensor Microwave/Imager measurements. J. Geophys. Res.-Atmos. 2000, 105, 14913–14925. [Google Scholar] [CrossRef]
  189. Rosenfeld, S.; Grody, N. Metamorphic signature of snow revealed in SSM/I measurements. IEEE Trans. Geosci. Remote Sens. 2000, 38, 53–63. [Google Scholar] [CrossRef]
  190. Wang, J.; Yuan, Q.; Shen, H.; Liu, T.; Li, T.; Yue, L.; Shi, X.; Zhang, L. Estimating snow depth by combining satellite data and ground-based observations over Alaska: A deep learning approach. J. Hydrol. 2020, 585, 124828. [Google Scholar] [CrossRef]
  191. Chen, Y.; Chen, Y.; Wilson, J.P.; Yang, J.; Su, H.; Xu, R. A Multifactor Eigenvector Spatial Filtering-Based Method for Resolution-Enhanced Snow Water Equivalent Estimation in the Western United States. Remote Sens. 2023, 15, 3821. [Google Scholar] [CrossRef]
  192. Derksen, C.; Walker, A.; Goodison, B. A comparison of 18 winter seasons of in situ and passive microwave-derived snow water equivalent estimates in Western Canada. Remote Sens. Environ. 2003, 88, 271–282. [Google Scholar] [CrossRef]
  193. Wulder, M.A.; Nelson, T.A.; Derksen, C.; Seemann, D. Snow cover variability across central Canada (1978–2002) derived from satellite passive microwave data. Clim. Chang. 2007, 82, 113–130. [Google Scholar] [CrossRef]
  194. Che, T.; Li, X.; Jin, R.; Armstrong, R.; Zhang, T. Snow depth derived from passive microwave remote-sensing data in China. Ann. Glaciol. 2008, 49, 145–154. [Google Scholar] [CrossRef]
  195. Mizukami, N.; Perica, S. Towards improved snow water equivalent retrieval algorithms for satellite passive microwave data over the mountainous basins of western USA. Hydrol. Process. 2012, 26, 1991–2002. [Google Scholar] [CrossRef]
  196. Yang, J.; Jiang, L.; Luojus, K.; Pan, J.; Lemmetyinen, J.; Takala, M.; Wu, S. Snow depth estimation and historical data reconstruction over China based on a random forest machine learning approach. Cryosphere 2020, 14, 1763–1778. [Google Scholar] [CrossRef]
  197. Wei, Y.; Li, X.; Gu, L.; Zheng, X.; Jiang, T. A novel fine-resolution snow depth retrieval model to reveal detailed spatiotemporal patterns of snow cover in Northeast China. Int. J. Digit. Earth 2023, 16, 1164–1185. [Google Scholar] [CrossRef]
  198. Derksen, C.; Toose, P.; Rees, A.; Wang, L.; English, M.; Walker, A.; Sturm, M. Development of a tundra-specific snow water equivalent retrieval algorithm for satellite passive microwave data. Remote Sens. Environ. 2010, 114, 1699–1709. [Google Scholar] [CrossRef]
  199. Jiang, L.; Wang, P.; Zhang, L.; Yang, H.; Yang, J. Improvement of snow depth retrieval for FY3B-MWRI in China. Sci. China Earth Sci. 2014, 57, 1278–1292. [Google Scholar] [CrossRef]
  200. Kumar, S.V.; Dong, J.; Peters-Lidard, C.D.; Mocko, D.; Gómez, B. Role of forcing uncertainty and background model error characterization in snow data assimilation. Hydrol. Earth Syst. Sci. 2017, 21, 2637–2647. [Google Scholar] [CrossRef]
  201. Tanniru, S.; Ramsankaran, R. Machine Learning-Based Estimation of High-Resolution Snow Depth in Alaska Using Passive Microwave Remote Sensing Data. IEEE J. Sel. Top. Appl. Earth Obs. Remote Sens. 2023, 16, 6007–6025. [Google Scholar] [CrossRef]
  202. Grody, N. Relationship between snow parameters and microwave satellite measurements: Theory compared with Advanced Microwave Sounding Unit observations from 23 to 150 GHz. J. Geophys. Res. 2008, 113, D22108. [Google Scholar] [CrossRef]
  203. Langlois, A.; Royer, A.; Goïta, K. Analysis of simulated and spaceborne passive microwave brightness temperatures using in situ measurements of snow and vegetation properties. Can. J. Remote Sens. 2010, 36, S135–S148. [Google Scholar] [CrossRef]
  204. Foster, J.L.; Skofronick-Jackson, G.; Meng, H.; Wang, J.R.; Riggs, G.; Kocin, P.J.; Johnson, B.T.; Cohen, J.; Hall, D.K.; Nghiem, S.V. Passive microwave remote sensing of the historic February 2010 snowstorms in the Middle Atlantic region of the USA. Hydrol. Process. 2012, 26, 3459–3471. [Google Scholar] [CrossRef]
  205. Mao, K.; Ma, Y.; Xia, L.; Shen, X.; Sun, Z.; He, T.; Zhou, G. A neural network method for monitoring snowstorm: A case study in southern China. Chin. Geogr. Sci. 2014, 24, 599–606. [Google Scholar] [CrossRef]
  206. Yang, J.; Jiang, L.; Wu, S.; Wang, G.; Wang, J.; Liu, X. Development of a Snow Depth Estimation Algorithm over China for the FY-3D/MWRI. Remote Sens. 2019, 11, 977. [Google Scholar] [CrossRef]
  207. Gao, S.; Li, Z.; Chen, Q.; Zhou, W.; Lin, M.; Yin, X. Inter-Sensor Calibration between HY-2B and AMSR2 Passive Microwave Data in Land Surface and First Result for Snow Water Equivalent Retrieval. Sensors 2019, 19, 5023. [Google Scholar] [CrossRef]
  208. Wang, G.R.; Li, X.F.; Wang, J.; Wei, Y.L.; Zheng, X.M.; Jiang, T.; Chen, X.X.; Wan, X.K.; Wang, Y. Development of a Pixel-Wise Forest Transmissivity Model at Frequencies of 19 GHz and 37 GHz for Snow Depth Inversion in Northeast China. Remote Sens. 2022, 14, 5483. [Google Scholar] [CrossRef]
  209. Dai, L.; Che, T.; Ding, Y. Inter-Calibrating SMMR, SSM/I and SSMI/S Data to Improve the Consistency of Snow-Depth Products in China. Remote Sens. 2015, 7, 7212–7230. [Google Scholar] [CrossRef]
  210. Pan, C.G.; Kirchner, P.B.; Kimball, J.S.; Du, J. A Long-Term Passive Microwave Snowoff Record for the Alaska Region 1988–2016. Remote Sens. 2020, 12, 153. [Google Scholar] [CrossRef]
  211. Wu, X.; Zhu, R.; Long, Y.; Zhang, W. Spatial Trend and Impact of Snowmelt Rate in Spring across China’s Three Main Stable Snow Cover Regions over the Past 40 Years Based on Remote Sensing. Remote Sens. 2022, 14, 4176. [Google Scholar] [CrossRef]
  212. Xu, C.; Chen, Y.; Hamid, Y.; Tashpolat, T.; Chen, Y.; Ge, H.; Li, W. Long-term change of seasonal snow cover and its effects on river runoff in the Tarim River basin, northwestern China. Hydrol. Process. 2009, 23, 2045–2055. [Google Scholar] [CrossRef]
  213. Yang, T.; Wang, C.; Chen, Y.; Chen, X.; Yu, Z. Climate change and water storage variability over an arid endorheic region. J. Hydrol. 2015, 529, 330–339. [Google Scholar] [CrossRef]
  214. Liang, S.; Li, X.; Zheng, X.; Jiang, T.; Li, X.; Qiao, D. Effects of Winter Snow Cover on Spring Soil Moisture Based on Remote Sensing Data Product over Farmland in Northeast China. Remote Sens. 2020, 12, 2716. [Google Scholar] [CrossRef]
  215. Qian, A.; Yi, S.; Chang, L.; Sun, G.; Liu, X. Using GRACE Data to Study the Impact of Snow and Rainfall on Terrestrial Water Storage in Northeast China. Remote Sens. 2020, 12, 4166. [Google Scholar] [CrossRef]
  216. Song, Y.; Broxton, P.D.; Ehsani, M.R.; Behrangi, A. Assessment of Snowfall Accumulation from Satellite and Reanalysis Products Using SNOTEL Observations in Alaska. Remote Sens. 2021, 13, 2922. [Google Scholar] [CrossRef]
  217. Wei, Y.; Li, X.; Gu, L.; Zheng, X.; Jiang, T.; Li, X.; Wan, X. A Dynamic Snow Depth Inversion Algorithm Derived From AMSR2 Passive Microwave Brightness Temperature Data and Snow Characteristics in Northeast China. IEEE J. Sel. Top. Appl. Earth Obs. Remote Sens. 2021, 14, 5123–5136. [Google Scholar] [CrossRef]
  218. Rodell, M.; Houser, P.R.; Jambor, U.; Gottschalck, J.; Mitchell, K.; Meng, C.J.; Arsenault, K.; Cosgrove, B.; Radakovich, J.; Bosilovich, M.; et al. The Global Land Data Assimilation System. Bull. Am. Meteorol. Soc. 2004, 85, 381–394. [Google Scholar] [CrossRef]
  219. Pulliainen, J. Retrieval of Regional Snow Water Equivalent from Space-Borne Passive Microwave Observations. Remote Sens. Environ. 2001, 75, 76–85. [Google Scholar] [CrossRef]
  220. Kunzi, K.F.; Patil, S.; Rott, H. Snow-Cover Parameters Retrieved from Nimbus-7 Scanning Multichannel Microwave Radiometer (SMMR) Data. IEEE Trans. Geosci. Remote Sens. 1982, 20, 452–467. [Google Scholar] [CrossRef]
  221. Foster, J.L.; Chang, A.T.C.; Hall, D.K.; Rango, A. Derivation of Snow Water Equivalent in Boreal Forests Using Microwave Radiometry. Arctic 1991, 44, 147–152. [Google Scholar] [CrossRef]
  222. Goodison, B. Passive Microwave Remote Sensing of Land-Atmosphere Interactions: [ESA/NASA International Workshop, Held at Saint Lary (France) from 11–15 January 1993]; De Gruyter: Berlin, Germany, 1995. [Google Scholar] [CrossRef]
  223. Grody, N.; Basist, A. Global identification of snowcover using SSM/I measurements. IEEE Trans. Geosci. Remote Sens. 1996, 34, 237–249. [Google Scholar] [CrossRef]
  224. Derksen, C.; Walker, A.; Goodison, B.; Strapp, J. Integrating in situ and multiscale passive microwave data for estimation of subgrid scale snow water equivalent distribution and variability. IEEE Trans. Geosci. Remote Sens. 2005, 43, 960–972. [Google Scholar] [CrossRef]
  225. Derksen, C.; Silis, A.; Sturm, M.; Holmgren, J.; Liston, G.E.; Huntington, H.; Solie, D. Northwest Territories and Nunavut Snow Characteristics from a Subarctic Traverse: Implications for Passive Microwave Remote Sensing. J. Hydrometeorol. 2009, 10, 448–463. [Google Scholar] [CrossRef]
  226. Larue, F.; Royer, A.; De Sève, D.; Roy, A.; Cosme, E. Assimilation of passive microwave AMSR-2 satellite observations in a snowpack evolution model over northeastern Canada. Hydrol. Earth Syst. Sci. 2018, 22, 5711–5734. [Google Scholar] [CrossRef]
  227. Gu, L.; Fan, X.; Li, X.; Wei, Y. Snow Depth Retrieval in Farmland Based on a Statistical Lookup Table from Passive Microwave Data in Northeast China. Remote Sens. 2019, 11, 3037. [Google Scholar] [CrossRef]
  228. Tedesco, M.; Pulliainen, J.; Takala, M.; Hallikainen, M.; Pampaloni, P. Artificial neural network-based techniques for the retrieval of SWE and snow depth from SSM/I data. Remote Sens. Environ. 2004, 90, 76–85. [Google Scholar] [CrossRef]
  229. Wei, Y.; Li, X.; Gu, L.; Zheng, X.; Jiang, T.; Zheng, Z. A Fine-Resolution Snow Depth Retrieval Algorithm From Enhanced-Resolution Passive Microwave Brightness Temperature Using Machine Learning in Northeast China. IEEE Geosci. Remote Sens. Lett. 2022, 19, 2001305. [Google Scholar] [CrossRef]
  230. Wei, Y.; Li, X.; Li, L.; Gu, L.; Zheng, X.; Jiang, T.; Li, X. An Approach to Improve the Spatial Resolution and Accuracy of AMSR2 Passive Microwave Snow Depth Product Using Machine Learning in Northeast China. Remote Sens. 2022, 14, 1480. [Google Scholar] [CrossRef]
  231. Yang, J.; Jiang, L.; Lemmetyinen, J.; Pan, J.; Luojus, K.; Takala, M. Improving snow depth estimation by coupling HUT-optimized effective snow grain size parameters with the random forest approach. Remote Sens. Environ. 2021, 264, 112630. [Google Scholar] [CrossRef]
  232. Yang, J.; Jiang, L.; Pan, J.; Shi, J.; Wu, S.; Wang, J.; Pan, F. Comparison of Machine Learning-Based Snow Depth Estimates and Development of a New Operational Retrieval Algorithm over China. Remote Sens. 2022, 14, 2800. [Google Scholar] [CrossRef]
  233. Wang, J.; Forman, B.; Xue, Y. Exploration of Synthetic Terrestrial Snow Mass Estimation via Assimilation of AMSR-E Brightness Temperature Spectral Differences Using the Catchment Land Surface Model and Support Vector Machine Regression. Water Resour. Res. 2021, 52, e2020WR027490. [Google Scholar] [CrossRef]
  234. Derksen, C.; Walker, A.; Goodison, B. Evaluation of passive microwave snow water equivalent retrievals across the boreal forest/tundra transition of western Canada. Remote Sens. Environ. 2005, 96, 315–327. [Google Scholar] [CrossRef]
  235. Che, T.; Dai, L.; Zheng, X.; Li, X.; Zhao, K. Estimation of snow depth from passive microwave brightness temperature data in forest regions of northeast China. Remote Sens. Environ. 2016, 183, 334–349. [Google Scholar] [CrossRef]
  236. Larue, F.; Royer, A.; Sève, D.D.; Langlois, A.; Roy, A.; Brucker, L. Validation of GlobSnow-2 snow water equivalent over Eastern Canada. Remote Sens. Environ. 2017, 194, 264–277. [Google Scholar] [CrossRef] [PubMed]
  237. Yang, J.; Jiang, L.; Lemmetyinen, J.; Luojus, K.; Takala, M.; Wu, S.; Pan, J. Validation of remotely sensed estimates of snow water equivalent using multiple reference datasets from the middle and high latitudes of China. J. Hydrol. 2020, 590, 125499. [Google Scholar] [CrossRef]
  238. Luojus, K.; Pulliainen, J.; Takala, M.; Lemmetyinen, J.; Mortimer, C.; Derksen, C.; Mudryk, L.; Moisander, M.; Hiltunen, M.; Smolander, T.; et al. GlobSnow v3.0 Northern Hemisphere snow water equivalent dataset. Sci. Data 2021, 8, 163. [Google Scholar] [CrossRef]
  239. World Meteorological Organization (WMO). WMO Guidelines on the Calculation of Climate Normals (WMO-No. 1203); World Meteorological Organization (WMO): Geneva, Switzerland, 2017. [Google Scholar]
  240. Dai, L.Y.; Ma, L.J.; Nie, S.P.; Wei, S.Y.; Che, T. Historical and real-time estimation of snow depth in Eurasia based on multiple passive microwave data. Adv. Clim. Chang. Res. 2023, 14, 537–545. [Google Scholar] [CrossRef]
  241. Li, Q.; Yang, T.; Li, L. Evaluation of snow depth and snow cover represented by multiple datasets over the Tianshan Mountains: Remote sensing, reanalysis, and simulation. Int. J. Climatol. 2022, 42, 4223–4239. [Google Scholar] [CrossRef]
  242. Hedstrom, N.R.; Pomeroy, J.W. Measurements and modelling of snow interception in the boreal forest. Hydrol. Process. 1998, 12, 1611–1625. [Google Scholar] [CrossRef]
  243. Sturm, M.; Holmgren, J.; Liston, G.E. A Seasonal Snow Cover Classification System for Local to Global Applications. J. Clim. 1995, 8, 1261–1283. [Google Scholar] [CrossRef]
  244. Lambin, E.F.; Geist, H. (Eds.) Land-Use and Land-Cover Change: Local Processes and Global Impacts; Global Change—The IGBP Series; Springer: Berlin/Heidelberg, Germany, 2006. [Google Scholar] [CrossRef]
  245. Yang, J.; Jiang, L.; Dai, L.; Pan, J.; Wu, S.; Wang, G. The Consistency of SSM/I vs. SSMIS and the Influence on Snow Cover Detection and Snow Depth Estimation over China. Remote Sens. 2019, 11, 1879. [Google Scholar] [CrossRef]
  246. Domine, F.; Picard, G.; Morin, S.; Barrere, M.; Madore, J.; Langlois, A. Major Issues in Simulating Some Arctic Snowpack Properties Using Current Detailed Snow Physics Models: Consequences for the Thermal Regime and Water Budget of Permafrost. J. Adv. Model. Earth Syst. 2019, 11, 34–44. [Google Scholar] [CrossRef]
  247. Huang, X.; Deng, J.; Ma, X.; Wang, Y.; Feng, Q.; Hao, X.; Liang, T. Spatiotemporal dynamics of snow cover based on multi-source remote sensing data in China. Cryosphere 2016, 10, 2453–2463. [Google Scholar] [CrossRef]
  248. Cao, G.; Hou, P.; Zheng, Z.; Tang, S. Generation of daily snow depth from multi-source satellite images and in situ observations. J. Geogr. Sci. 2015, 25, 1235–1246. [Google Scholar] [CrossRef]
  249. Miura, T.; Inaoka, K.; Kachi, M.; Kojima, Y. Overview and current status of GOSAT-GW mission and AMSR3 instrument. In Proceedings of the Sensors, Systems, and Next-Generation Satellites XXVII, Amsterdam, The Netherlands, 3–7 September 2023; SPIE: Bellingham, WA, USA, 2023; Volume 12729, pp. 83–88. [Google Scholar] [CrossRef]
  250. Haagmans, R.; Tsaoussi, L.E. Next Generation Gravity Mission as a Mass-change and Geosciences International Constellation (MAGIC) Mission Requirements Document; The European Space Agency: Paris, France, 2020. [Google Scholar] [CrossRef]
Figure 1. An overview of the influence of climate change-driven alterations in snowpack on the environment and society. Several symbols used are adopted or modified according to the courtesy of the Integration and Application Network, University of Maryland Center for Environmental Science, as well as https://www.freepik.com/, accessed on 18 September 2023.
Remotesensing 16 01085 g001
Figure 2. Description of the data-acquisition methods examined in the review. (A) Passive microwave and its main challenges. (B) GRACE and GRACE-FO. Several symbols used are adopted or modified according to the courtesy of the Integration and Application Network, University of Maryland Center for Environmental Science, as well as https://www.freepik.com/, accessed on 18 September 2023.
Remotesensing 16 01085 g002
Figure 3. Flowchart of the selection and data-extraction methodology.
Remotesensing 16 01085 g003
Figure 4. Yearly distribution of the reviewed publications.
Remotesensing 16 01085 g004
Figure 5. Heatmap of the reviewed continental and regional studies. Global, hemispherical, and Arctic, as well as studies conducted on the Southern Hemisphere were excluded.
Remotesensing 16 01085 g005
Figure 6. The examined time frame and geographical scale of the reviewed articles, sorted by publication year.
Remotesensing 16 01085 g006
Figure 7. Main focus of the reviewed articles.
Remotesensing 16 01085 g007
Figure 8. Frequency of different sensor and data combinations, as well as the occurrence of the different sensor and data types.
Remotesensing 16 01085 g008
Figure 9. The employed sensors in the reviewed studies by occurrence and color-coded by sensor type. In the brackets behind the sensor name are designated the operating organization, the mission, as well as the operating period.
Remotesensing 16 01085 g009
Figure 10. Classification of the reviewed publications by methodology. Displayed by publication year (bottom) and overall (top).
Remotesensing 16 01085 g010
Figure 11. Visualization of which methodology (classification used in Section 3.5) was used in to examine which topic (classification used in Section 3.3).
Remotesensing 16 01085 g011
Figure 12. Reviewed articles illustrated using litmaps.com by citations within the reviewed articles (y-axis), as well as publication year (x-axis). The figure serves as a visualization, and thus, the axes are solely qualitative and added for better understanding. The labels indicate the most influential publications within the reviewed sample [13,69,73,74,83,84,91,99,122,123,128,131,135,137,139,144,149,154,164,167,192,194,198,204,231,234,235,236,237,238].
Remotesensing 16 01085 g012
Table 1. Criteria entered in the WoS search string applied to title, abstract, and keywords.
CriteriaConditions
Geographical Scale“Planetary” OR “Global” OR “worldwide” OR “hemispheric” OR “Northern Hemisphere” OR “North Hemisphere” OR “large scale” OR “large-scale” OR “large-area” OR “large area” OR “Continental” OR “Hemispheric-Scale” OR “Hemispheric Scale” OR “Europe” OR “Asia” OR “America” OR “Eurasia” OR “Pan Arctic” OR “Pan-Arctic” OR “USA” OR “United States” OR “Canada” OR “Russia” OR “Soviet Union” OR “Soviet-Union” OR “China” OR “Tibetan Plateau” OR “Alaska” OR “Great Plains” OR “Canadian Shield” OR “Siberia” OR “Prairie” OR “Tundra”
Snow Parameters“Snow Mass” OR “Snow Depth” OR “Snow Water Equivalent” OR “SWE”
Sensors“Passive Microwave” OR “PMW” OR “AMSR-E” OR “AMSR2” OR “SSM/I” OR “SMMR” OR “SSMIS” OR “MWRI” OR “MWR” OR “AMR” OR “CMR” OR “AMSU” OR “JMR” OR “MTVZA” OR “SHF” OR “TOPEX” OR “gravimetric” OR “GRACE” OR “GRACE-FO”
LanguageEnglish
Article TypeArticle
Impact Factor>2
Date2000–2023
Table 2. Number of reviewed publications by country of first author affiliation.
Country
 China 59
 USA 58
 Canada 20
 France 10
 Finland 9
 United Kingdom 5
 Germany 2
 Italy 2
 India 1
 Japan 1
 South Korea 1
 Total 168
Table 3. Number of reviewed publications by publishing journal.
  Journal
  Remote Sensing of Environment 31
  Remote Sensing 28
  Journal of Hydrometeorology 12
  Cryosphere 9
  Hydrological Processes 8
  IEEE Transactions on Geoscience and Remote Sensing 8
  Journal of Geophysical Research-Atmospheres 8
  Journal of Hydrology 7
  Water Resources Research 6
  Annals of Glaciology 5
  IEEE Journal of Selected Topics in Applied Earth Observation and Remote Sensing 5
  Geophysical Research Letters 4
  Hydrology and Earth System Sciences 3
  Journal of Climate 2
  International Journal of Remote Sensing 2
  Big Earth Data 2
  International Journal of Climatology 2
  Other 26
  Total 168
Table 4. Crosstable with the first author affiliation on the y-axis and the location of the study area on the x-axis.
DesignationGlobalHemisphericalPan-ArcticEurasiaEuropeEurope RegionalAsia RegionalNorth AmericaNorth America RegionalSouth America RegionalTotal
Canada-31-----16-20
China38-3--43-2-58
Finland-62-1-----9
France-22---4-2-9
Germany------2---2
India--------1-1
Italy1----1----2
Japan--------1-1
South Korea--1-------1
USA466---51224156
United Kingdom-31-----1-5
Total828132115112471164
Table 5. Overview of the reviewed long term (>30 years) studies with the respective trends. Symbols are in North Pole Azimuth Projection.
Northern Hemisphere
Publication Duration Trend Variable Trend Remarks
Hu 2023 [121]1980–2019SD [cm]Remotesensing 16 01085 i001Besides continental trends, also, regional change rates were examined. Some regions are behaving contrary to their continental trend, meaning the SD increases yearly. Such regions are: Rocky Mountains, northern Alaska, and eastern Siberia.
Kouki 2022 [124]1982–2014SWE [kg]Remotesensing 16 01085 i002The trend is analyzed monthly. The later the season, the stronger and more significant the trend becomes. According to the authors, this is since temperature becomes the most important driver in spring, as precipitation is the main driver in winter.
Shao 2022 [125]1979–2019SWE [mm]Remotesensing 16 01085 i003Compared different datasets. Most of the datasets show a negative trend. However, GLDAS shows a positive trend for the Northern Hemisphere.
Pulliainen 2020 [13]1980–2018SWE [Gt]Remotesensing 16 01085 i004Local and seasonal variations in significance and strength of trends. Northeastern Canada and parts of Scandinavia have significant negative trends; central and eastern Siberia have significant positive trends. In North America, the negative trend weakens later in the season; in Eurasia, the trend behaves contrarily.
Xiao 2020 [132]1980–2016SD [cm]Remotesensing 16 01085 i005Multiple products analyzed. The trend varies by product. GlobSnow has the strongest trend. No significance information stated for the trend.
Eurasia
Dai 2023 [240]1988–2021SD [cm]Remotesensing 16 01085 i006Analyzes SD over the entire year. The strongest negative trend was observed for the winter and spring months. While no trend was detected from 1988–2000, a reduction of SD was noted after 2000.
Europe
Metsämäki 2018 [168]1980–2016MoDRemotesensing 16 01085 i007Examined snow melt of the day as the day in the season when snow begins to thaw. The trend is stronger in boreal forests than in tundra regions
China
Wu 2022 [211]1981–2020SWE [mm]Remotesensing 16 01085 i008The trend varies in strength and significance over China. Especially in the Altay, West Kunlun, Hengduan, and Greater Khingan Mountains, the trend is strongly negative and highly significant. The opposite can be observed, for instance, in the Central Kunlun and the Lesser Khingan Mountains.
Remotesensing 16 01085 i009
Jiang 2022 [80]1980–2016SWE [mm]Remotesensing 16 01085 i010Various trends can be observed over China. Negative trends observed in the Hengduan Mountains and parts of the Khingan Mountains. Positive trends, for instance, appear in the Lesser Khingan and Changbai Mountains. The overall trend is negative; however, it was positive for 1990–2009. Strong negative overall trend since 2009.
Yang 2020 [196]1987–2019SD [cm]Remotesensing 16 01085 i011Trends vary depending on region. Significant negative trends were observed in the Altei, Tianshan, Kunlun, Changbai, and Greater Khingan Mountains, while significant positive trends appeared in the Hengduan and Lesser Khingan Mountains.
China Regional
Ma 2023 [100]1980–2018SD [cm]Remotesensing 16 01085 i012Conducted in Qinghai Plateau. Three different products examined (PMW, ERA-5, MERRA2). The trend varies in strength and significance over the products and season. While PMW and ERA5 data show negative trends, in the MERRA2 data, no trend is visible. A negative trend (PMW and ERA5) is visible, which stronger and more significant (for PMW) in spring than in winter.
Wei 2023 [197]1987–2017SD [cm]Remotesensing 16 01085 i013Conducted in Northeast China. A positive trend occurs in both applied products (FSDM and WESTDC). However, spatial differences and strong and significant increase is observed especially in the Sanjiang Plain and the Western Greater Khingan Mountains. A decrease mainly in the Central Greater Khingan Mountains and Liaohe Plain.
Li 2022 [241]1981–2018SD [cm]Remotesensing 16 01085 i014Conducted in Tianshan Mountains. Four products examined. The trend varies in strength and significance spatially and by product; however, a general decrease was concluded for all products.
Remotesensing 16 01085 i015
Disclaimer/Publisher’s Note: The statements, opinions and data contained in all publications are solely those of the individual author(s) and contributor(s) and not of MDPI and/or the editor(s). MDPI and/or the editor(s) disclaim responsibility for any injury to people or property resulting from any ideas, methods, instructions or products referred to in the content.

