Article

Long-Term Dynamic Monitoring and Driving Force Analysis of Eco-Environmental Quality in China

1
School of Environmental Science and Engineering, Suzhou University of Science and Technology, Suzhou 215009, China
2
School of Geography Science and Geomatics Engineering, Suzhou University of Science and Technology, Suzhou 215009, China
3
School of Resource and Environmental Sciences, Wuhan University, Wuhan 430072, China
4
International Institute of Spatial Lifecourse Health (ISLE), Wuhan University, Wuhan 430072, China
5
Faculty of Geo-Information Science and Earth Observation, University of Twente, 7500 Enschede, The Netherlands
6
State Key Laboratory of Efficient Utilization of Arid and Semi-arid Arable Land in Northern China, Institute of Agricultural Resources and Regional Planning, Chinese Academy of Agricultural Sciences, Beijing 100081, China
7
Hubei Luojia Laboratory, Wuhan 430072, China
8
School of Public Health, Wuhan University, Wuhan 430071, China
*
Author to whom correspondence should be addressed.
These authors contributed equally to this work.
Remote Sens. 2024, 16(6), 1028; https://doi.org/10.3390/rs16061028
Submission received: 17 January 2024 / Revised: 29 February 2024 / Accepted: 7 March 2024 / Published: 14 March 2024
(This article belongs to the Special Issue Geographic Data Analysis and Modeling in Remote Sensing)

Abstract

:
Accurate assessments of the historical and current status of eco-environmental quality (EEQ) are essential for governments to have a comprehensive understanding of regional ecological conditions, formulate scientific policies, and achieve the United Nations Sustainable Development Goals (SDGs). While various approaches to EEQ monitoring exist, they each have limitations and cannot be used universally. Moreover, previous studies lack detailed examinations of EEQ dynamics and its driving factors at national and local levels. Therefore, this study utilized a remote sensing ecological index (RSEI) to assess the EEQ of China from 2001 to 2021. Additionally, an emerging hot-spot analysis was conducted to study the spatial and temporal dynamics of the EEQ of China. The degree of influence of eight major drivers affecting EEQ was evaluated by a GeoDetector model. The results show that from 2001 to 2021, the mean RSEI values in China showed a fluctuating upward trend; the EEQ varied significantly in different regions of China, with a lower EEQ in the north and west and a higher EEQ in the northeast, east, and south in general. The spatio-temporal patterns of hot/cold spots in China were dominated by intensifying hot spots, persistent cold spots, and diminishing cold spots, with an area coverage of over 90%. The hot spots were concentrated to the east of the Hu Huanyong Line, while the cold spots were concentrated to its west. The oscillating hot/cold spots were located in the ecologically fragile agro-pastoral zone, next to the upper part of the Hu Huanyong Line. Natural forces have become the main driving force for changes in China’s EEQ, and precipitation and soil sand content were key variables affecting the EEQ. The interaction between these factors had a greater impact on the EEQ than individual factors.

1. Introduction

The eco-environment is vital for human survival and progress, acting as a necessity for both physical sustenance and societal development and playing a critical role in supporting long-term social and economic growth [1]. However, human effects on the eco-environment have escalated as a result of rising urbanization, and ecological and environmental concerns have grown increasingly critical [2]. The Sixth Assessment Report from the Intergovernmental Panel on Climate Change (IPCC) highlights that global warming, driven by human activities, is threatening eco-environmental quality (EEQ) and raising a range of eco-environmental problems [3], such as biodiversity loss [4], land degradation, soil erosion [5], and urban heat islands [6,7,8]. To address the increasingly critical problems of EEQ, the United Nations has included the conservation, restoration, and promotion of the sustainable use of terrestrial ecosystems in its Sustainable Development Goals (SDGs). EEQ evaluation serves as a crucial foundation for shaping environmental protection policies and crafting resource development and utilization plans. It facilitates the coordination of regional economic development and environmental protection, thereby promoting the harmonious coexistence of human society and natural environment [9].
Monitoring the long-term dynamics of EEQ through earth observation approaches is crucial to achieving the SDGs [10,11,12]. The monitoring of EEQ involves various technologies and methods for collecting, analyzing, and interpreting environmental data. Ground-based monitoring stations and sensor networks allow for the detailed monitoring of environmental changes in local areas and can also be deployed in remote areas [13]. However, their limited coverage and sparse distribution are not suitable for monitoring EEQ at large scales. Ecological and mathematical models can also predict future environmental changes and offer decision support, yet their accuracy is limited by the quality of input data and the assumptions underlying the models. Model-building and maintenance can be particularly challenging for complex ecosystems. Among the different ways of EEQ monitoring, remote sensing techniques enable the rapid, large-scale, and long-term monitoring of EEQ, making their use the most efficient method for assessing the eco-environment [14]. For example, monitoring biological indicators such as the normalized difference vegetation index (NDVI) can provide insights into ecosystem health. However, biological responses are affected by a variety of factors with uncertain response time, which must be solved by examining relevant mechanisms from multiple perspectives [15,16]. Considering that such single-factor indicators usually focus on certain aspects of the ecological environment, they are not universally applicable and do not provide a comprehensive reflection of the state of EEQ [17]. Therefore, it is imperative to use a comprehensive model that incorporates numerous ecological indices to evaluate EEQ.
An Ecological Environment Index (EEI) was introduced by the Chinese Ministry of Environmental Protection in 2006, which combines five factors, i.e., Biological Abundance Index, Vegetation Coverage Index, Water Network Density Index, Land Stress Index, and Pollution Load Index, aiming to conduct an annual comprehensive EEQ evaluation at different administrative levels and, in particular, address ecological challenges in some key regions [18,19]. For example, the North China Plain grappled with water scarcity and soil contamination by heavy metals due to intensive industrial activities and coal combustion [20,21,22]; the Yangtze River Delta and Pearl River Delta regions experienced ecological repercussions caused by rapid urbanization, land reclamation, and urban expansion [23,24,25]; several southwestern provinces, including Yunnan, Guizhou, and Guangxi, despite their rich biodiversity, faced ecological threats due to habitat loss resulting from agricultural practices and logging [26,27]; and Inner Mongolia, Xinjiang, and North China encountered issues of soil desertification and erosion due to overgrazing and intensive agricultural production [28,29]. However, although feasible at the regional level, the EEI requires a long interval of monitoring, making it less cost-effective to run. In 2013, a remote sensing ecological index (RSEI) was proposed, which integrates four key satellite-derived ecological factors: greenness, humidity, heat, and dryness [15]. To date, the effectiveness of the RSEI in assessing EEQ has been demonstrated in various landscapes in China, such as urban areas [30], wetlands [31], and basins [32,33,34,35]. However, most of the existing studies have focused only on specific regions or ecosystems, such as nature reserves [36], watershed ecosystems [37], mining ecosystems [38], land borders [39], and urban agglomerations [40]. A nationwide, comprehensive assessment of EEQ is still lacking. Moreover, the existing studies lack nuanced examinations of the dynamics and driving factors of EEQ at various levels, from national to local, failing to effectively uncover fundamental causes of eco-environmental problems [41].
To fill the aforementioned gaps, this study aimed to (1) evaluate the EEQ of China from 2001 to 2021 by constructing a long-term annual RSEI from Google Earth Engine (GEE); (2) explore the spatial and temporal dynamics of EEQ through an emerging hot-spot analysis (EHSA); and (3) reveal the driving factors of EEQ across China using a GeoDetector model. The findings of this study would allow for more accurate identification of eco-environmental issues and facilitate the implementation of targeted solutions, thereby aiding in the optimization of current environmental policies [42,43].

2. Materials and Methods

2.1. Study Area

The study area is the entirety of China (Figure 1). Owing to its expansive territory and vast geographical diversity, China spans a broad spectrum of terrains, including mountains, plateaus, hills, basins, plains, and deserts. The nation’s climate is predominantly shaped by intricate influences of monsoon circulation, further compounded by variations in terrain. Consequently, the ecological environment of China exhibits a high degree of complexity, with the quality varying significantly from one region to another. Concurrently, as the largest developing country globally, China accommodates a substantial one-fifth of the world’s population. While the country’s socio-economic status continues to experience rapid growth, it is confronted with the formidable challenge of serious ecological degradation. The Hu Huanyong Line is a population distribution line approximately at a 45° tilt, stretching from Heihe City in Heilongjiang Province to Tengchong City in Yunnan Province [44]. It is often referred to as the mutation line of China—it is an important dividing line of population geography, natural geography, and the ecological environment in China [45].

2.2. Technical Flowchart

Figure 2 shows a technical flow chart of this study. Here, the GEE platform was used to preprocess the Moderate Resolution Imaging Spectroradiometer (MODIS) series image dataset of China from 2001 to 2021. Subsequently, the four indicators were normalized, and the RSEI was calculated using principal component analysis (PCA). The spatial and temporal evolution characteristics of the RSEI in China were analyzed using an EHSA. Finally, potential indicators affecting the EEQ of China were selected, and the key variables affecting the EEQ of China were analyzed using the GeoDetector model.

2.3. Data Sources

The remote sensing data used in this study were Moderate Resolution Imaging Spectroradiometer (MODIS) data covering the whole of China, which were obtained from the GEE cloud computing platform between 1 January 2001 and 31 December 2021. On the GEE platform, we de-clouded, cropped, projected, and computed the four RSEI indicators. The MODIS is a space-based remote sensing instrument developed and manufactured by NASA to understand global climate change and the impact of human activities on the climate. The instrument receives data in 36 spectral bands ranging from 0.4 microns to 14.4 microns in the visible to infrared wavelengths. It provides a large range of global data, including changes in cloud cover, changes in surface radiant energy, and oceanic and terrestrial processes. The bands used in the study to calculate the four RSEI metrics are listed in Table 1.
This study took into account the following driving factors of ecosystem quality: altitude, river network density, soil sand content, temperature [46], precipitation [47], density of built-up area, night-time light, and population density. The elevation data (Digital Elevation Model, DEM) in China were derived from the Shuttle Radar Topography Mission (SRTM) data of the United States space shuttle Endeavour, which were generated by resampling based on the latest SRTM V4.1 data. The river network was obtained by kriging the national river system data. The soil sand content was processed based on the World Soil Database HWSD2.0 constructed by the Food and Agriculture Organization of the United Nations and the International Institute for Applied Systems in Vienna. Specifically, the soil sand content was extracted separately from the soil depth layer data. Mean annual temperature and mean annual precipitation data were generated by Delta spatial downscaling, programmed at the regional downscaling scale in China based on the global 0.5° climate dataset published by CRU, and the global high-resolution climate dataset published by WorldClim. The built-up area data were extracted from the first Landsat-derived annual land cover product of China (CLCD) from 1985 to 2019 [48]. Night-time light data were the NPP-VIIRS-like NTL data (2000–2018), which were established through new cross-sensor calibration from DMSP-OLS NTL data (2000–2012) and a composition of monthly NPP-VIIRS NTL data (2013–2018) [49]. Population density data were obtained using LandScan Global Population Distribution data from East View Cartographic, developed by the U.S. Department of Energy’s Oak Ridge National Laboratory. The selected driving factors were used to analyze the geographical and temporal variations in EEQ.

2.4. Methodology

2.4.1. RSEI Construction

The RSEI is made up of four indicators: greenness, aridity, humidity, and heat, which together describe the EEQ of a region [15]. Greenness is represented by the NDVI, which represents the degree of vegetation cover in the region [50]. Dryness is represented by the Normalized Difference Built-up and Soil Index (NDBSI) [51], derived by averaging the index-based building and soil indices. Humidity is represented by the WET, calculated through the remote sensing data tassel cap [52]. The calculation method of each indicator is shown in Table 2.
The normalized difference vegetation index (NDVI) is generally recognized as a good indicator of terrestrial vegetation productivity. To reflect the moisture state of water bodies, topsoil, and vegetation, the moisture component calculated by the remote sensing tassel cap is utilized as a moisture indicator. The NDBSI, which is calculated by averaging the Index-Based Built-up Index (IBI) and the Soil Index (SI), is used to monitor dryness. The heat index uses the LST_Day_1km band of the MOD11A2 product.
Where ρ i denotes the reflectance of the MODIS image corresponding to the i-band.
Thus, RSEI can be expressed as:
R S E I = f N D V I , W E T , L S T , N D B S I
Considering the four indicators have various units and value ranges, they were adjusted before PCA using the following formula:
N i = I i I min I max I min
where Ni denotes the normalized value of a given indicator; Ii denotes the value of the indicator; Imin and Imax denote the minimum and maximum values of the indicator, respectively.
RSEI0 denotes the first principal component (PC1) in the principal component analysis, which uses principal component analysis to produce the first RSEI0. RSEI0 was additionally standardized to generate the final RSEI to facilitate the measurements of the indicators. The RSEI value ranges between 0 and 1, with a higher value indicating a better EEQ.

2.4.2. Emerging Hot-Spot Analysis

This study uses the EHSA tool provided by ArcGIS Pro to examine the spatio-temporal distribution of RSEI changes at the province and city levels across China. The EHSA uses a combination of two statistical methods to assess spatio-temporal patterns of target data: the Getis-Ord Gi* index is used to determine the location and degree of spatial aggregation, while Mann–Kendall trend analysis is used to assess time-series changes in Getis-Ord Gi* statistical z-scores in each region [53,54]. This approach enables the assessment of trends in both hot and cold spots within each grid.
With the resultant trend z-score and p-value for each location with data, and with the hot spot z-score and p-value for each bin, the EHSA categorizes each study area location into one of the 17 patterns as follows: No pattern, New hot/cold spot, Consecutive hot/cold spot, Intensifying hot/cold spot, Persistent hot/cold spot, Diminishing hot/cold spot, Sporadic hot/cold spot, Oscillating hot/cold spot, and Historical hot/cold spot.

2.4.3. GeoDetector

The GeoDetector method was utilized in this study to detect the influence of selected drivers (elevation, river network density, average annual temperature, precipitation, density of built-up area, night-time light, average annual precipitation, and soil sand content) on regional EEQ [55]. The detector consists of four modules: factor detection, interaction detection, ecological detection, and hazard detection, and has been widely used in a variety of sectors [56,57]. In this study, we examined the effect of a single factor on the RSEI using factor detection and the effect of two factors on the RSEI using interaction detection (see Table 3). Firstly, the RSEI was selected as the dependent variable and the eight drivers were selected as independent variables. Due to the large scope of the study, the prefecture level was selected to obtain the values of each dependent and independent variable, and the mean values of the RSEI and the respective variable factors were counted. The driving factors were standardized using ArcGIS software to avoid the potential influence of different factor sizes and variances in the range of values on the research. Secondly, the independent variable factors were classified into five levels, as they are numerical values, using the equidistant breakpoint method to transform them from numerical quantities to typological quantities. Finally, q-values were calculated using GeoDetector. The calculation formula is as follows:
q = 1 h = 1 L N h σ h 2 N σ 2 = 1 S S W S S T
where q denotes the explanatory power of the factor on the RSEI, with a larger q value indicating a stronger influence; L denotes the stratification of the factor; Nh denotes the number of cells corresponding to the h stratum of the RSEI and the factor; N denotes the number of cells corresponding to the RSEI and the factor in the whole region; σh2 denotes the variance of the changes in the h stratum; and σ2 denotes the variance of the changes in the RSEI in the whole region.
The samples were entered into a GeoDetector model, and the results were divided into two parts: the explanatory power of the independent variable X on the dependent variable, and the interaction of the effects of these independent factors on the dependent variable. Interaction detection was used to determine the extent to which any two influencing factors, when combined, explain changes in EEQ. Interaction detection may assess the intensity, direction, and linearity of the factor interaction, and facilitate the examination of variable interactions.

3. Results

3.1. Distribution of EEQ in China from 2001 to 2021

The mean values of the RSEI in China showed a fluctuating upward trend from 2001 to 2021, indicating that the EEQ in the study area as a whole was better (Figure 3). The lowest mean value of the RSEI was 0.577 in 2007, and the highest mean value was 0.682 in 2018. Among them, the mean values of the RSEI decreased from 0.603 in 2001 to 0.577 in 2007, and the EEQ tended to deteriorate. From 2007 to 2021, the mean values of the RSEI increased from 0.577 to 0.636, the EEQ improved to 0.577, and the EEQ tended to deteriorate. Although the mean value of the RSEI in China had a downward trend in 2014, 2017, and 2019, it remained above 0.6. Overall, the EEQ of China has shown slow growth in the last 20 years, with an average growth trend of 0.002 per year and a growth rate of 5.35 percent.
The areas with good and bad environments were located on the east and west sides of the Hu Huanyong Line (Figure 4). The areas of poor EEQ in China from 2001 to 2021 were mainly concentrated in arid and semi-arid regions and desert areas west of the Hu Huanyong Line, including the Qaidam Desert, located in the northeastern part of the Tibetan Plateau; the Badanjilin Desert on the southwestern edge of the Inner Mongolia Plateau; the Tengger Desert in the southwestern part of the Alashanzuo Banner of the Inner Mongolia Autonomous Region; the border with the central part of Gansu Province; and the Taklamakan Desert in the center of the Tarim Basin in southern Xinjiang. Semi-arid areas include western Tibet, most of Qinghai, south-central Gansu, eastern Inner Mongolia, northern Shaanxi, and northern Shanxi, all of which, due to climatic constraints, had RSEI values of around 0.5 and medium ecological quality. At the same time, most areas in Southern and Eastern China, where located to the east of the Hu Huanyong Line, had large amounts of arable land with a green RSEI, indicating that the EEQ in these areas was good. However, certain urban areas and cities and counties with rapid economic development and high levels of urbanization had RSEI values of only about 0.5, with medium EEQ. The three northeastern provinces (Heilongjiang, Jilin, and Liaoning) had the best EEQ in China, with RSEI values close to 1.
In order to understand the variation in annual mean EEQ at the prefecture level, each of the 10 cities with the highest and lowest annual mean EEQs were selected, as shown in Figure 5. The gap between the 10 cities with the highest annual mean EEQ and the 10 cities with the lowest annual mean EEQ is huge. The annual mean EEQs of the top 10 cities are all greater than 0.75, and those of the 10 cities with the lowest annual mean EEQs are all less than 0.53. This illustrates the great variation in ecological quality between Chinese cities. It is worth noting that 9 of the 10 cities with the highest annual mean EEQ are in Northeast China, while all 10 cities with the lowest annual mean EEQ are in Western China. They are separated by the Hu Huanyong Line.

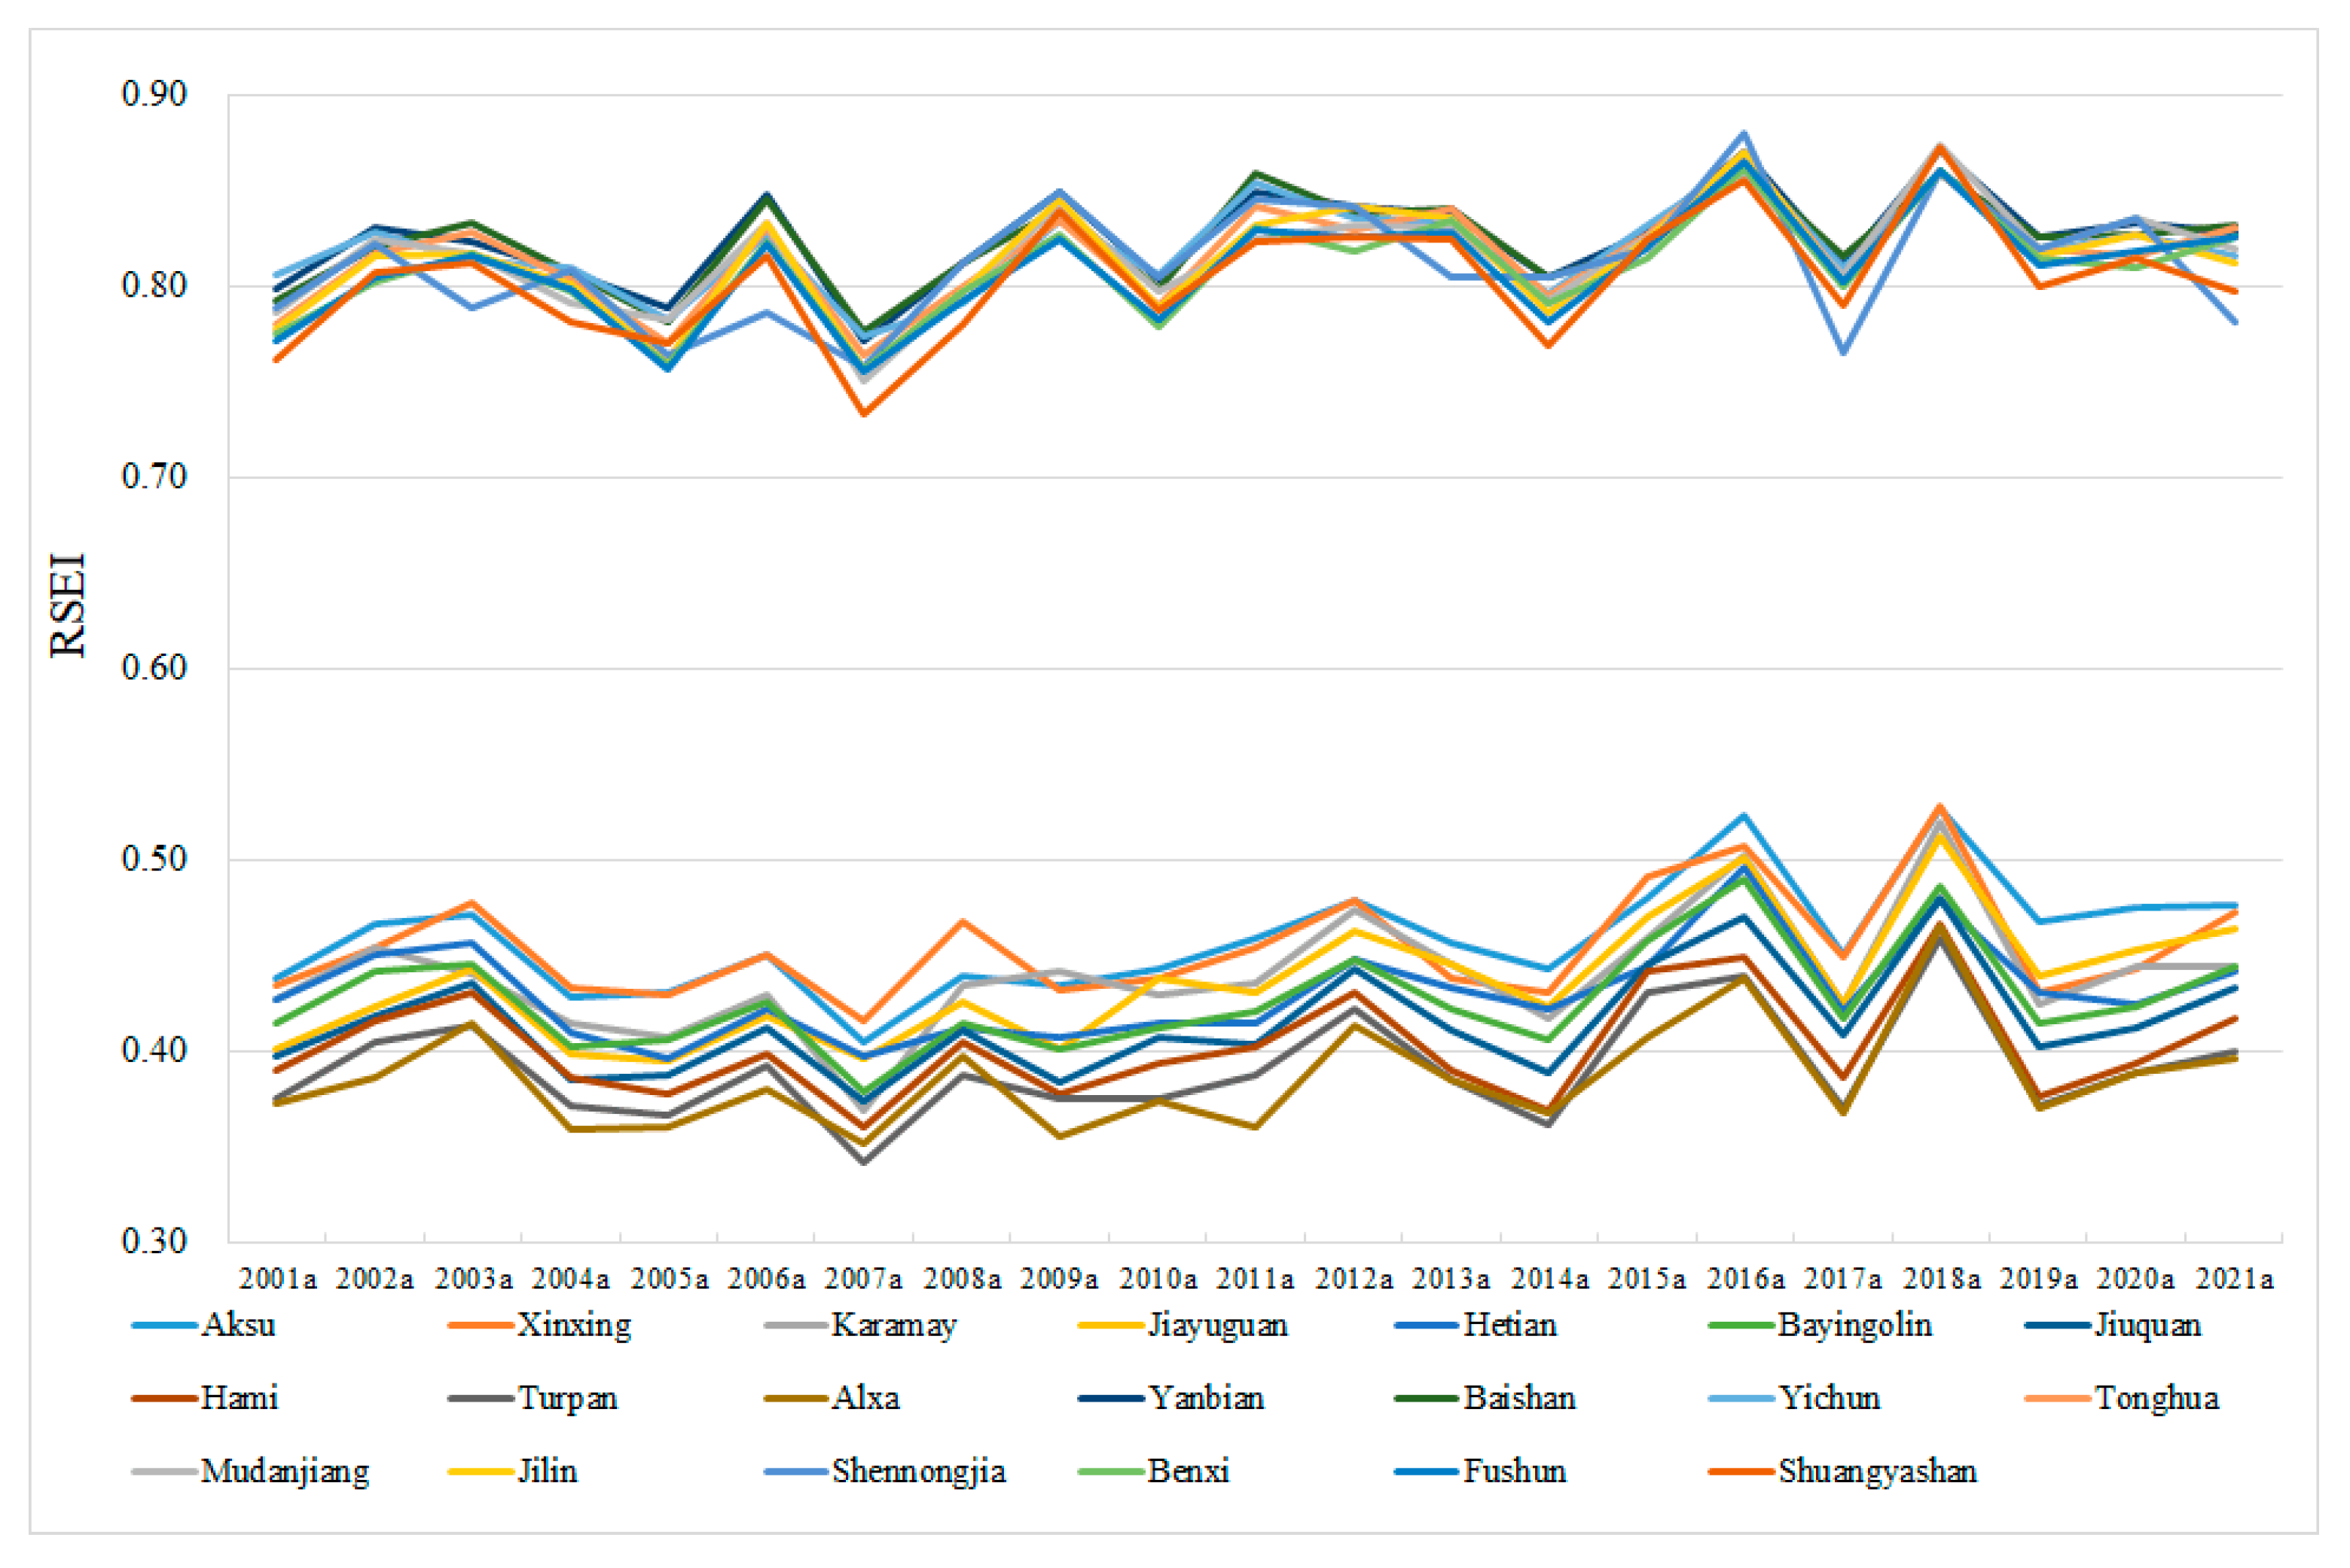
3.2. Changes of EEQ at the Provincial Level

Figure 6 shows the annual variation of mean RSEI in China from 2001 to 2021, based on which 34 provincial administrative divisions can be divided into 3 levels. There is considerable regional heterogeneity in the distribution of EEQ in China.
The provinces of Heilongjiang, Jilin, Liaoning, Anhui, and Fujian have relatively greater annual mean EEQ values among the 34 provincial administrative divisions; their annual mean EEQ values are mostly above 0.70. The four provinces of Tianjin, Shanxi, Hong Kong, and Shanghai are at the end of the first level, whose annual mean EEQ values are all greater than 0.6. The five provinces of Tibet, Qinghai, Inner Mongolia, Ningxia, and Gansu are in the second tier, with the lowest annual mean EEQ values being greater than 0.47. Xinjiang is alone at the third level, with the highest annual mean EEQ value being less than 0.52. The provinces in the second and third levels are all to the west of the Hu Huanyong Line. The annual mean EEQ value in most of the provinces shows a slightly upward trend overall, and the annual mean EEQ value in most of the provinces showed a significant decline in 2005a, 2007a, 2017a, and 2019a. Vertically, the EEQ of the three northeastern provinces had always been at a good level, with the RSEI value stabilized at 0.5 or above. The EEQ in Southern and Eastern China has changed little and stayed at a good level, with a fragmented distribution of areas with medium EEQ, which is closely related to the level of urban development. The EEQ of arid regions such as most of Xinjiang, northwestern Gansu, western Inner Mongolia, northern Ningxia, northwestern Qinghai, and northern Tibet has always been at a poor level. The western part of Tibet had relatively large changes in RSEI values, with RSEI decreasing significantly in 2004, 2005, 2015, and 2018, and most of the areas with medium EEQ turned to poorer levels.

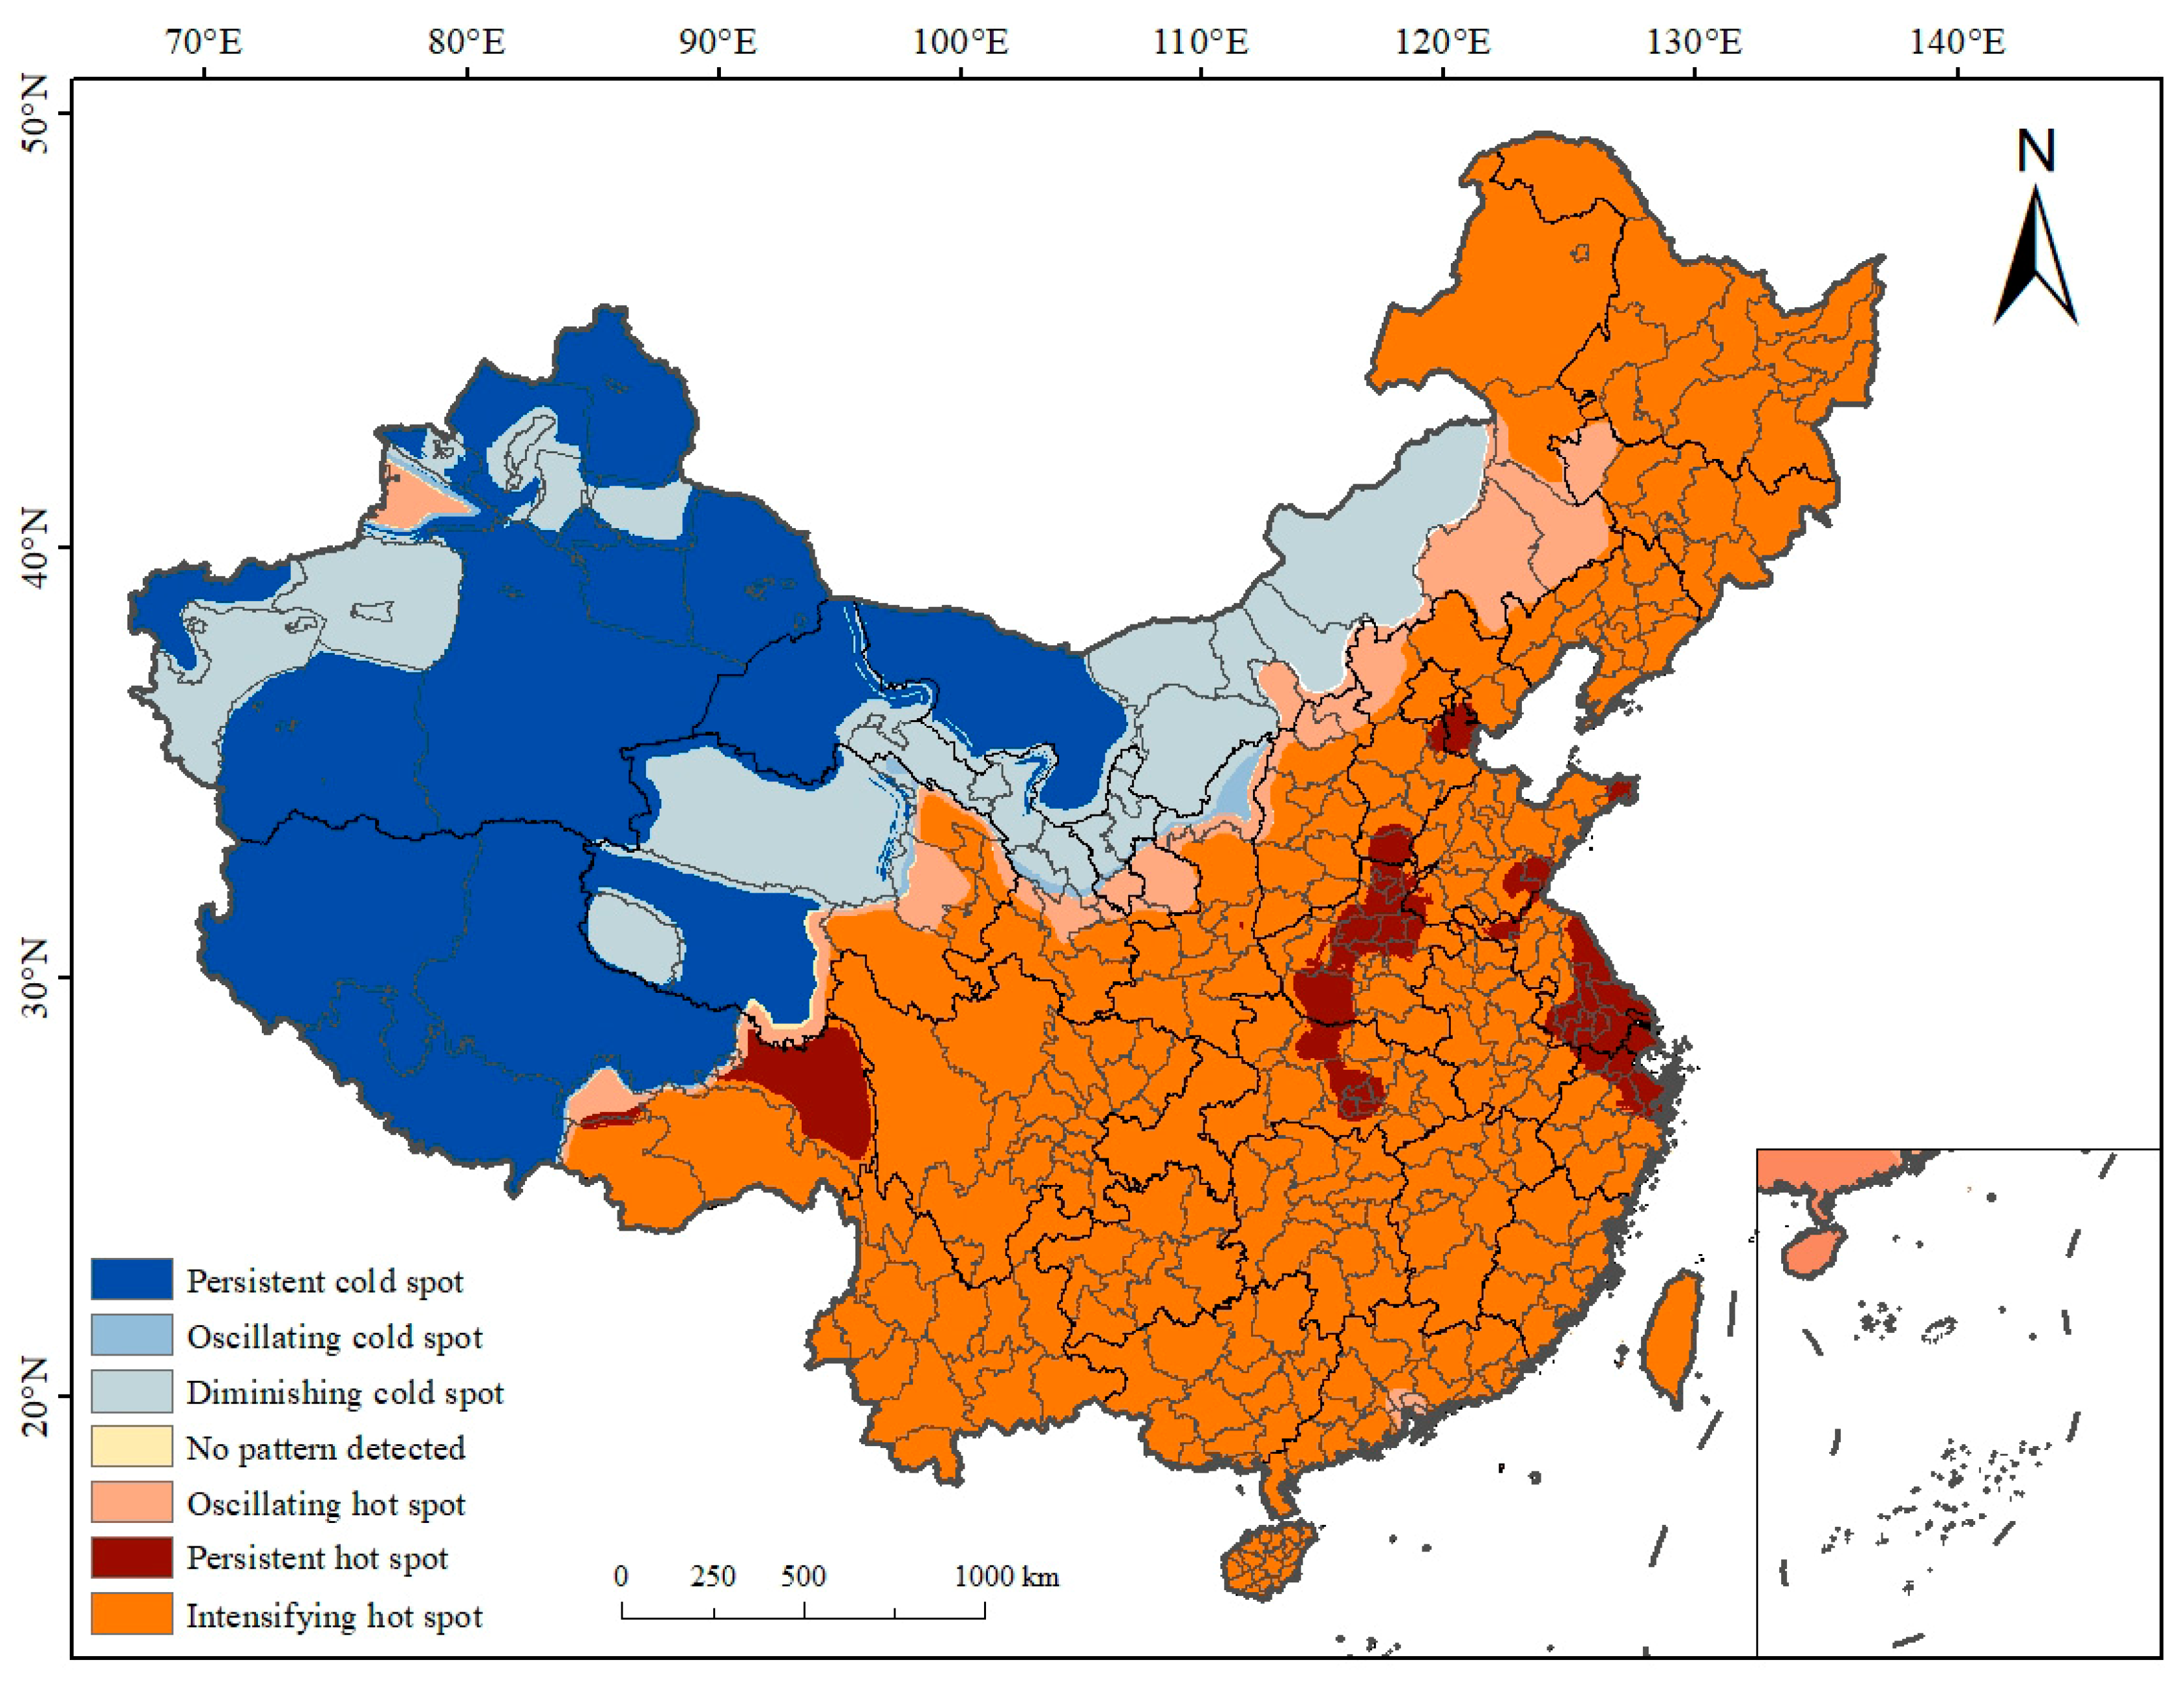
3.3. Spatial-Temporal Patterns of EEQ

Figure 7 shows the spatial-temporal patterns of the RSEI in China. The locations highlighted in red represent spatio-temporal patterns of hot spots, while those in blue represent spatio-temporal patterns of cold spots. The spatio-temporal patterns of hot/cold spots in China are dominated by intensifying hot spots, persistent cold spots, and diminishing cold spots, followed by oscillating hot spots, persistent hot spots, and oscillating cold spots, with an area percentage of 49.51%, 27.72%, 13.58%, 4.90%, 3.53%, and 0.51%, respectively. It is clear that the hot spots are concentrated east of the Hu Huanyong Line, while the cold spots are concentrated west of it. The intensifying hot spots are mainly located in a vast area east of the Hu Huanyong Line. The persistent hot spots form six clustered areas in China, located in (1) Tianjin and Langfang in the Beijing-Tianjin-Hebei region; (2) Weihai in the Shandong Peninsula; (3) Rizhao, Linyi, and Xuzhou at the junction of Jiangsu and Shandong; (4) Yancheng, Taizhou, Nantong, Zhenjiang, Nanjing, Changzhou, Wuxi, Suzhou, Shanghai, Huzhou, Jiaxing, Shaoxing, Ningbo, and Zhoushan in the Yangtze River Delta region; (5) Central Henan and Hubei, involving Handan in Hebei, Heze in Shandong, Anyang, Puyang, Hebi, Shangqiu, Kaifeng, Zhengzhou, Zhoukou, Xuchang, Pingdingshan, Nanyang in Henan, Xiangyang, Jingmen, Tianmen, Qianjiang, and Xiantao in Hubei; (6) and Chamdo and Lhasa in Tibet. The oscillating hot spots move from the junction of Inner Mongolia and Jilin to the west and south, away from the Hu Huanyong Line. In addition, the oscillating hot spots are also found in Guangzhou, Foshan, Dongguan, Zhongshan, Shenzhen, Hong Kong, and Macao in the Pearl River Delta region, as well as in Ili in Xinjiang. The oscillating cold spots are distributed in narrow strips just below the gradually decreasing hot spots. The diminishing cold spots are mainly concentrated in the upper-middle part of Inner Mongolia, Ningxia, and Gansu, the Haixi Mongol-Tibetan Autonomous Prefecture in Qinghai, and Kashgar, Aksu, Karamay, and Changji Hui Autonomous Prefecture in Xinjiang. The persistent cold spots are mainly concentrated in Xinjiang, most parts of Tibet, Jiuquan in Gansu, Yushu Tibetan Autonomous Prefecture in Qinghai, and Alxa League in Inner Mongolia.

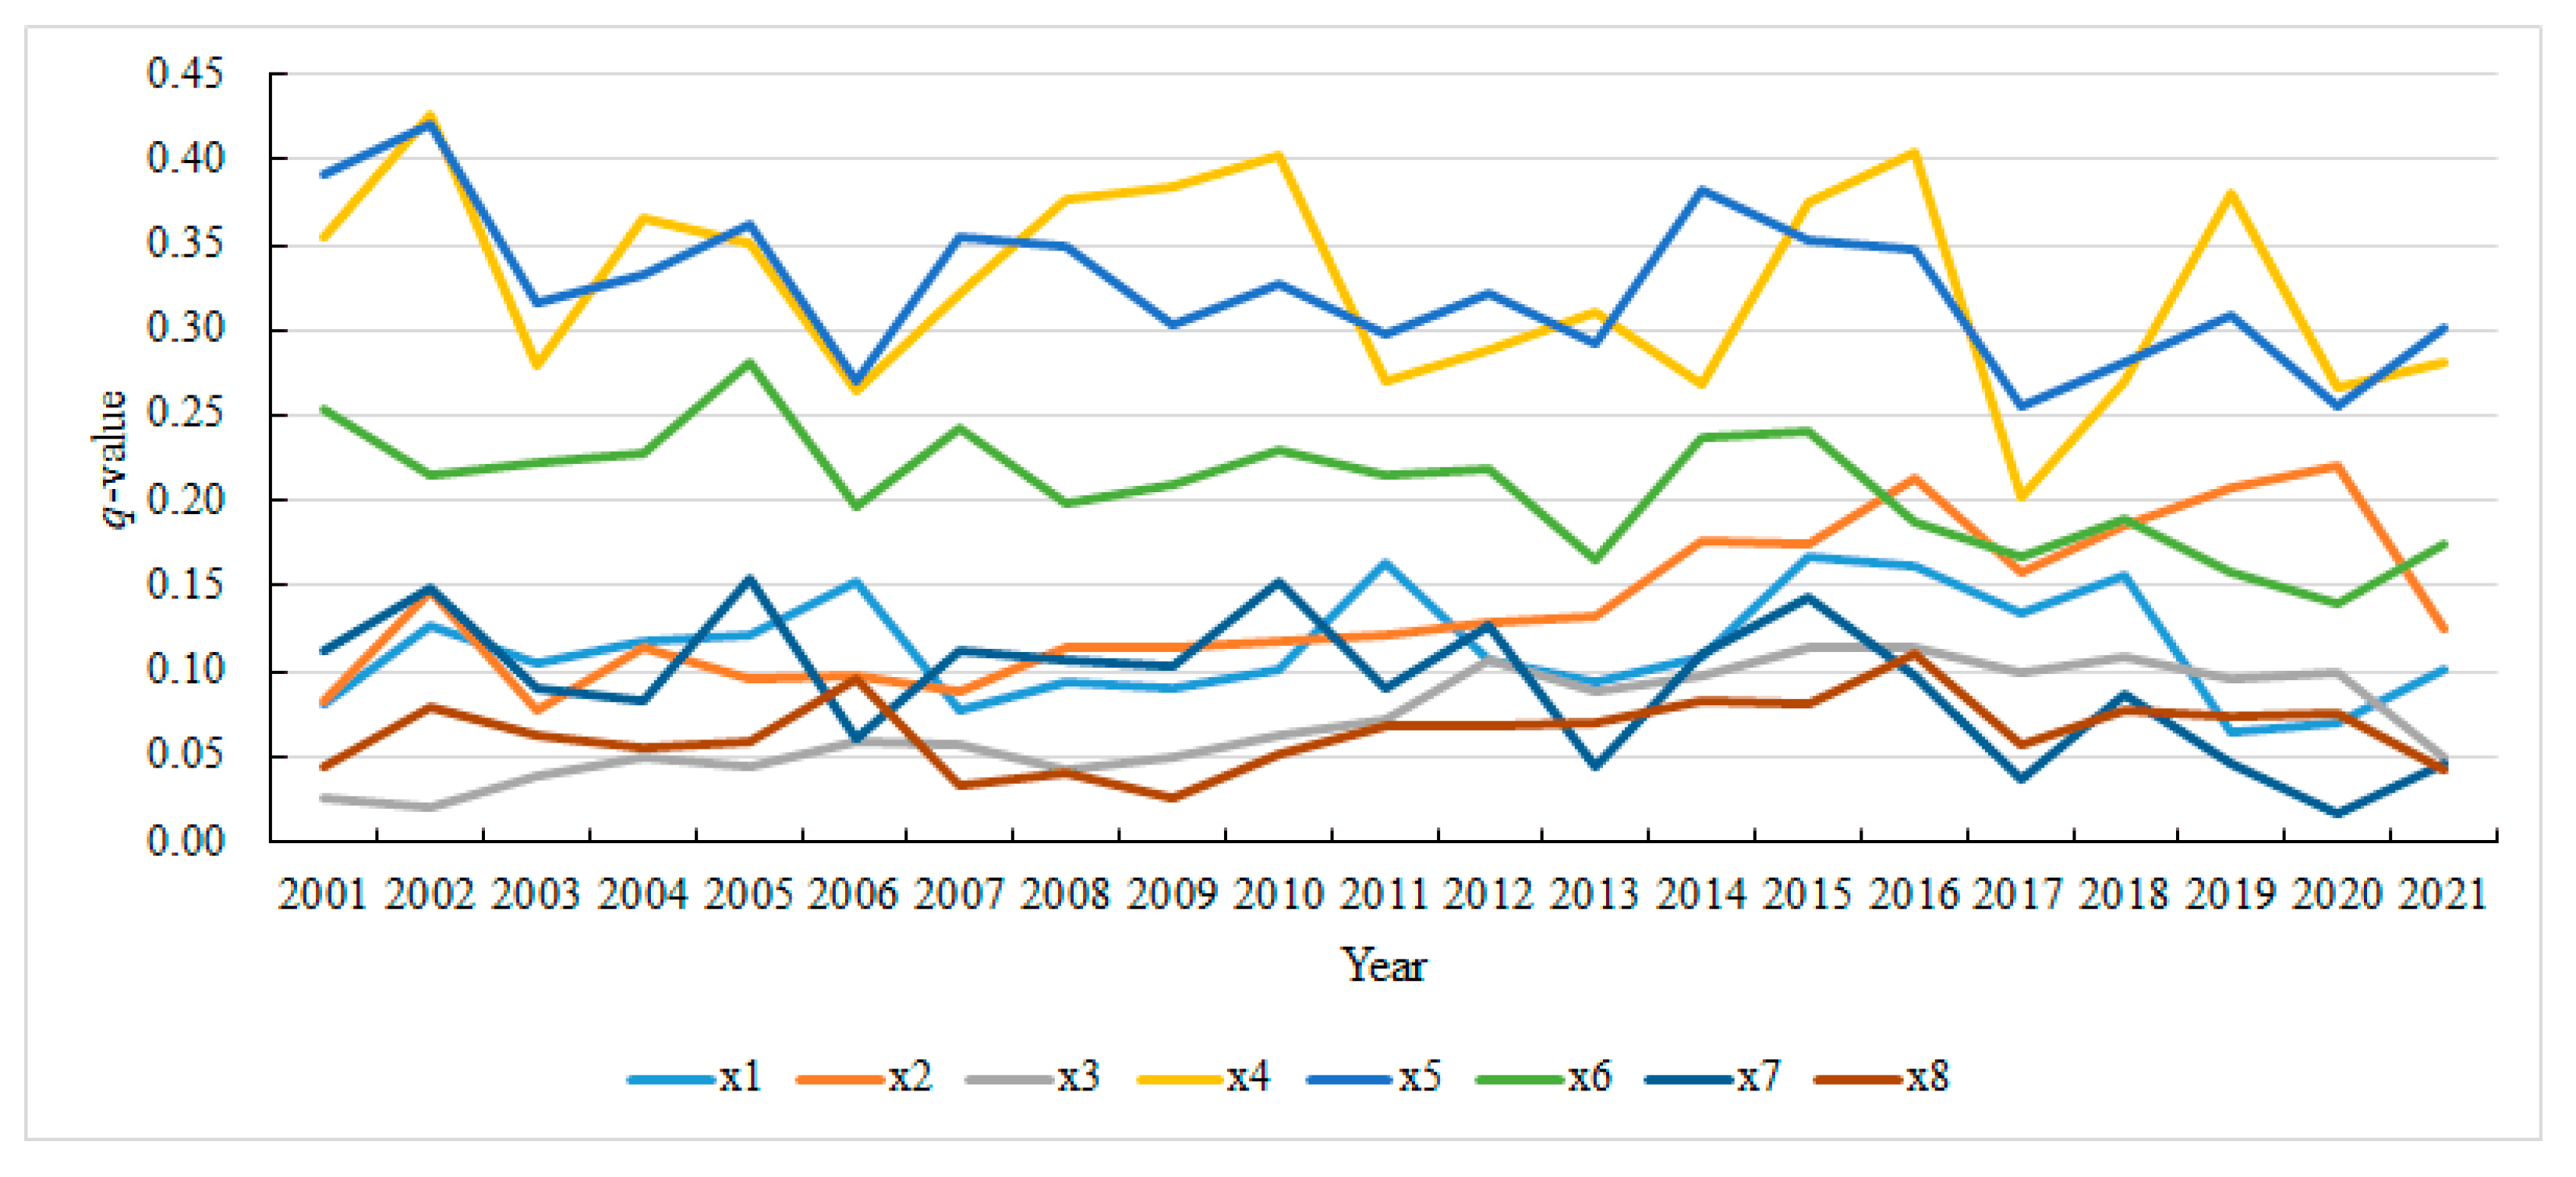
3.4. Natural and Social Driver of EEQ

Based on available data and the actual situation in the study area, eight driving factors were selected for studying the change in EEQ in the study area from 2001 to 2021: elevation, population density, average annual temperature, density of built-up area, night-time light, river network density, average annual precipitation, and soil sand content (see Figure 8). All drivers were normalized in ArcGIS. Observably, elevation impacts the natural environment the most due to the variant climatic conditions in various vertical zones. Precipitation and temperature are indicators of the local climate, while river network density is a comprehensive measure of a region’s natural geography. High river network density is typically found in regions with high precipitation, steep topographic slopes, and impermeable soils. Population density, demand for night-time light, and density of built-up area are all direct indicators of a region’s level of economic development. The higher the level of economic development, the higher the population density, demand for night-time lighting, and density of building land.
The p-value associated with the q-value for each independent variable, denoted as X in the GeoDetector, serves as an indicator of the significance of the respective factor. A p-value below 0.05 suggests a statistically significant difference, while a p-value below 0.01 indicates a highly significant difference. Essentially, a smaller p-value implies an increased likelihood that the independent variable X exerts an influence on the dependent variable Y. The p-value for each indicator is less than 0.001, indicating that the selected detection parameters have a significant impact on the geographical differentiation characteristics of EEQ. The effect of each factor on EEQ and its variation from 2001 to 2021 are shown in Figure 9. Average annual precipitation and soil sand content exhibit the most substantial impact on EEQ, as evidenced by q-values consistently exceeding 0.3. Notably, in 2002, these q-values reached their peak at 0.42. Furthermore, the q-values associated with average annual precipitation, soil sand content, river network density, and average annual temperature generally demonstrate a declining pattern, suggesting a diminishing influence of environmental factors on EEQ over the years. In contrast, night lighting, annual average temperature, and density of building land exhibit comparatively minor effects, as indicated by q-values below 0.1. It is worth noting that the impact of population density has increased over the last 20 years, with the q-value rising from 0.08 in 2001 to 0.16 in 2021. This demonstrates how human activities have increasingly influenced changes in the EEQ of China. As the economy expands, so does the scale of human activity, leading to an increased demand for various resources and placing challenges and pressures on the surrounding natural environment.
The results of factor interaction detection in this study showed two-factor enhancement and nonlinear enhancement effects, indicating that the influence of the two-factor interaction is greater than the independent influence of the original two factors and is thus better able to promote changes in EEQ in China. The evolutionary trends of interaction factor drivers, as depicted in Figure 10, reveal that average annual precipitation exerts the most robust interaction from 2001 to 2021, as indicated by consistently high q-values predominantly surpassing 0.4. Notably, the most impactful interaction occurs between annual precipitation and built-up area density, with q-values reaching 0.627 (2009), 0.621 (2015), and 0.617 (2016). Subsequently, the interactions of annual precipitation with population density (q-value of 0.615 in 2019) and elevation (q-value of 0.614 in 2016) also demonstrate considerable influence. Examining the longitudinal perspective, the q-values associated with built-up area density∩annual precipitation and built-up area density∩soil sand content consistently exceed 0.4. In summary, average annual precipitation is the dominant factor of EEQ in the study area, and the strength of the interaction between natural and social factors is greater than that within each factor, indicating that the main driving factors of EEQ in China are natural factors.

4. Discussion

The Chinese EEQ has a clear east–west divide along the Hu Huanyong Line. The average value of the RSEI in China showed a fluctuating upward trend from 2001 to 2021. From 2000 to 2021, the EEQ of China was impacted predominantly by natural factors and gradually decreased, while the impact of human factors was stable and slightly increased.

4.1. Changes in National EEQ

The EEQ of the whole country showed a broad downward trend from 2001 to 2007 and then rebounded from 2007 to 2021, and the fluctuation of the overall EEQ became smaller. The EEQ of the entire country was significantly influenced by the economic development from 2001 to 2007. The emission of environmental pollutants and the destruction of natural resources in the period of rapid economic development produced a wide range of obvious declining trends in the EEQ of the country. During the period of 2007–2010, the EEQ of the country improved effectively as the macro-controls of national policy effectively curbed the destruction of EEQ in economic development. In the stage after 2010, the influence of social factors on EEQ became gradually significant. The ecological problems brought about by the process of urbanization gradually became severe, and the environmental pollution brought about by the transformation of the industrial structure improved but still existed. Consequently, the EEQ of China declined in 2014, 2017, and 2019. However, with the improvement of the economy, culture, and education systems, coupled with enhancements in population quality and an increasing social awareness of environmental protection, the EEQ of China rose in line with environmental protection and resource conservation. It can be expected that the EEQ of China will gradually stabilize with the stabilization of its economic structure and social and demographic structure.

4.2. Changes in Regional EEQ

The regions with the poorest EEQ are mostly located in Xinjiang, Gansu, and Qinghai in the west and Inner Mongolia Autonomous Region in the north, and natural factors are the primary causes of low EEQ in the western regions. These regions include high altitudes, vast topography undulations, and landscapes dominated by the Gobi Desert and sandy areas [58], with temperature extremes and insufficient precipitation resulting in inadequate plant cover and vulnerable biological habitats [59]. These areas need special attention in China’s pursuit of the SDGs. The EEQ in most areas of Western China is mediocre or worse due to natural constraints. Noteworthy is the slight increase in the EEQ in the western region in 2010, while the RSEI values in other regions declined. This trend may be associated with the Ministry of Environmental Protection of China’s 2008 study on ecological civilization development in the western region’s ecologically fragile and impoverished regions. The EEQ in Tibet, Ningxia, Shaanxi, Shanxi, and Hebei provinces was the lowest. Conversely, the EEQ of the three northeastern provinces of Heilongjiang, Jilin and Liaoning was much better than the national average. The flat terrain and fertile soil of Northeast China facilitate vegetation growth. Moreover, the region is abundant in forest resources, and the forests help with water nourishment and soil erosion prevention, making them imperative for the governance and protection of the local eco-environment [11]. The EEQ is also lower in areas with heavy human activity interference, such as Macao, Shanghai, and Hong Kong, where socio-economic development, high population density, and low vegetation cover dominate [60,61].
China is one of the world’s most populated countries, with a particularly complicated natural environment. Years of uncoordinated economic expansion have resulted in a fundamental imbalance in the link between the demographic of China, economic, social, and ecological surroundings, with significant variances in EEQ across the country. Although the quality of the natural environment in both the west and the north is worse than the national average, the reasons for this vary. The poorer EEQ of Northern China is primarily due to the backwardness of industries and the over-concentration of polluting, energy, and resource industries [62,63,64], which pollute the surrounding environment during the manufacturing process. The natural environment in Western China is relatively fragile in many ways [65,66], and much of the western region is in arid or semi-arid climatic zones with low precipitation, particularly in certain areas of Xinjiang and Inner Mongolia, where drought is a serious problem, putting enormous pressure on the local ecosystem. The western region has a distinct grassland environment, although herder overgrazing has resulted in grassland degradation [67], threatening local biodiversity and ecological balance.

4.3. EEQ’s Spatial-Temporal Pattern

EHSA can identify statistically significant spatio-temporal trends. Here, it reveals the complexity of the current RSEI changes in China and reflects the aggregation pattern and trend of the RSEI. Low RSEI values aggregate as the cold spots of EEQ, while high RSEI values aggregate as the hot spots of EEQ. The spatial distribution of EHSA suggests that the RSEI spatio-temporal hot spots of China are mainly distributed east of the Hu Huanyong Line, where the EEQ has continued to improve in the last two decades. In contrast, most of the area west of the Hu Huanyong Line includes the spatio-temporal cold spots of the RSEI, where the EEQ has not improved significantly.
Intensifying hot spots cover nearly half of the territory in China, concentrated east of the Hu Huanyong Line. This means that these areas have been hot spots for at least 20 years and that the RSEI at this location has shown a statistically significant increase over this period of time. The EEQ in these regions is significantly better. The persistent hot spots mean that the location has been a hot spot for at least 20 years and the RSEI level has not tended to rise or fall significantly over that time. Most of them are located around the urban agglomeration (e.g., Yangtze River Delta urban agglomeration), where there is a high level of human activity, except for Chamdo in Tibet. He [68] found less fluctuation in EEQ in the Yangtze River Delta region over the past two decades. The oscillating hot/cold spots are banded around the Hu Huanyong Line, overlap considerably with an agro-pastoral zone of China, and are also at the junction of China’s RSEI cold hot spots. The natural environment there is fragile. The area of oscillating hot spots is 10 times that of the oscillating cold spots. This indicates an overall ecological improvement in the region. Ili also is an oscillating hot spot as it has experienced a process of decline followed by slow recovery, and it has largely stabilized since 2010 [69]. The distribution of diminishing cold spots indicates a positive ecological trend. This is consistent with the conclusion that the ecological quality of the Yellow River Basin Area and the semi-arid grassland area in Northwest China is generally improving [70]. The persistent cold spots are mainly concentrated in the desert areas of arid zones or alpine deserts, which have a harsh natural environments and very little human activity, making it extremely difficult to improve the ecosystem.

4.4. EEQ’s Driving Factors

Precipitation, river network density, and soil sand content are the main factors influencing changes in the overall EEQ in China. Additionally, climatic factors also play a role in the spatial distribution of EEQ. The findings of this study align with previous research in the field [71]. The soil type in the study area plays a dominant role in determining the EEQ. Given that much of Western China is located in arid and semi-arid climatic zones with low precipitation, the soil is vulnerable to wind and water erosion. Moreover, the high sand content of the soil affects vegetation growth and soil retention capacity, leading to regional eco-environment fragility. The Loess Plateau region features steep topography and is prone to soil erosion, resulting in a high soil sand content, and the region’s EEQ assessment is primarily “fair”. In China, precipitation is more concentrated in the south and less concentrated in the north, and both precipitation and river network density reflect water conditions in the region. The Yangtze River Delta and the Pearl River Basin in China have plentiful yearly precipitation and complex river networks; therefore, wetlands and marshes are widely spread. Some studies have demonstrated that wetlands are extremely important to the region’s eco-environment and play critical roles in maintaining ecological balance, safeguarding biodiversity, and regulating climate [72,73,74]. This is also consistent with the study’s findings that the EEQ of Eastern and Southern China has improved.
The relatively low single-factor explanatory power of human social factors for EEQ in the study area may stem from several factors. Firstly, the large size of the study area might dilute the influence of localized social factors. Secondly, indicators such as population density, night-time lighting, and building density exhibit an increasing trend from the northwest to the southeast of China. This suggests that the western and eastern regions of China are sparsely populated and relatively backward in terms of economic development. As a result, the social factors of these regions have not been extensively studied. Social variables have limited explanatory power for the overall EEQ in the study area. Compared to natural causes, social factors have a more rapid impact on regional EEQ. Due to geographical and climatic conditions, the population growth rate in Western China has been much lower than in the eastern and southern areas over the past 20 years. At the same time, economic growth is a reflection of human activities, and the western region has lagged behind the coastal areas, resulting in the western region having the least change in EEQ among the five regions. On the one hand, rapid economic development and increasing population density, combined with lax government oversight of environmental pollution monitoring and prevention, resulted in the overall EEQ of China being average at the beginning of the 21st century. On the other hand, since 2010, with the government paying more attention to environmental issues and promoting the concept of sustainable development, coupled with the growing awareness of environmental protection among citizens, the EEQ has been gradually and steadily improving.
China’s State Council issued the National Ecological Environment Construction Plan in 1998, launching a series of major initiatives to improve the country’s eco-environment. The greater the number of major ecological projects carried out in a region, the greater the degree of environmental improvement. The northern region has implemented major ecological projects such as the Three North Protective Forest System, the comprehensive management of the Beijing-Tianjin sand source, and the protection of natural forest resources. As a result, the average RSEI has increased from 0.56 in 2001 to 0.63 in 2021, making it the region with the largest increase in the average RSEI. The Three North region has successfully established an extensive forest protection system spanning east to west over the recent years, resulting in a notable improvement in both forest and vegetation coverage within the region. A pivotal initiative contributing to this enhancement is the Beijing-Tianjin Wind and Sand Source Comprehensive Management Project, which strategically employs comprehensive management measures to establish forests and grassland. The Natural Forest Protection Project specifically targets key state-owned forestry enterprises and locally well-known forestry enterprises playing vital ecological roles across 18 provinces, such as Yunnan Province, Sichuan Province, Chongqing City, and Guizhou Province. This project involves a systematic reclassification and regionalization of natural forests, prompting adjustments in the management direction of forest resources. The national strategies for the development of western regions, coupled with coordinated regional development strategies, have significantly propelled economic growth in the western and peripheral regions, resulting in a substantial enhancement of the region’s capabilities in the realm of environmental protection. However, the average RSEI increased by less than 0.02 in both the western and eastern regions. Despite the large number of ecological projects implemented, the western region has a low level of ecological restoration, which may be hindered by climate variables. The lower increase in EEQ in the eastern region can be attributed to its higher initial EEQ, fewer significant ecological projects, and fewer ecological restoration methods.

4.5. Strengths and Limitations

This study investigated the spatial and temporal evolution characteristics of EEQ in China and its driving factors from 2001 to 2021 using methods such as emerging spatio-temporal hot-spot analysis and GeoDetector. In the process of studying the changes in EEQ across the country, the characteristics of the changes in its EEQ were analyzed at the prefecture and city levels through emerging spatio-temporal hot-spot analyses. This approach helps in clearly identifying the differences in the EEQ between provinces and cities and tracking the trends over time. Diagnosing the dominant factors affecting the EEQ of China and analyzing the factors influencing EEQ in conjunction with social policies provide valuable insights for the timely evaluation of the regional EEQ of China, rational formulation of environmental protection policies, effective management of EEQ, and promotion of ecologically sustainable development in China.
Owing to the intricate nature of the ecological environment and the multitude of factors influencing its quality, this study faces challenges in data acquisition and is marked by certain limitations. Notably, there is an absence of a data validation component, and the accuracy and precision of the RSEI are not verified. Furthermore, the study lacks essential ground-truth data, such as information on soil heavy metal pollution and organic matter pollution, which should be incorporated into subsequent investigations. To augment the robustness of the research results, there is a need for synergistic validation with remote sensing data, coupled with an emphasis on refining sampling accuracy to enhance the overall representativeness of the study [75]. Additionally, the analysis of driving factors overlooks certain elements. Future research should address this gap by considering factors like industrial layout, local policy variables (e.g., ecological red line, urban development boundaries, construction of water conservancy facilities, vegetation greening policy), and energy structure. Integrating these aspects into the analysis will provide a more comprehensive understanding of their influence on EEQ.

5. Conclusions

This study monitors and evaluates the EEQ of China from 2001 to 2021 based on the RSEI indicators, examines the drivers affecting the EEQ of China, and draws the following conclusions:
  • Throughout the research period, the average RSEI value in China showed a variable and growing tendency. From 2001 to 2007, the mean value of RSEI in China declined by 0.02 points, and after 2007, the EEQ of China continued to improve while remaining steady. The three northeastern provinces (Heilongjiang, Jilin, and Liaoning) have had high EEQ for the last 20 years, whereas the central area of Xinjiang, the western region of Inner Mongolia, and the northwestern region of Qinghai have had poor EEQ. The EEQ is generally good to moderate in the northern and southern regions of China.
  • Through a spatiotemporal analysis of the EEQ and dynamic changes in the prefectures of China, it is observed that there is significant regional heterogeneity in the distribution of EEQ. The EEQ in the northeast, east, and south is noticeably better than that in the north and west, and the trends of improvement or deterioration align with the national level overall. The mean values of EEQ showed the largest increase during the periods of 2007–2009 and 2014–2016, while there were significant decreases in 2007 and 2017. The western region experienced the smallest overall changes in EEQ, suggesting that the Chinese government should prioritize ecological planning and management efforts in the western region.
  • The spatio-temporal patterns of hot/cold spots in China are dominated by intensifying hot spots, persistent cold spots, and diminishing cold spots, with an area coverage of over 90%. The hot spots are concentrated east of the Hu Huanyong Line, while the cold spots are concentrated west of it. The intensifying hot spot is mainly located in a large area east of the Hu Huanyong Line. The ecological state of China has been relatively stable overall over the past two decades. The oscillating hot/cold spots are located in the ecologically fragile agro-pastoral zone, next to the upper part of the Hu Huanyong Line.
  • According to the results of the GeoDetector quantitative analysis, natural factors in the study area are the dominant factors affecting EEQ, with precipitation and soil sand content being the key factors influencing the change of overall EEQ in China. In future environmental protection initiatives, the government can strategically prioritize the execution of ecological projects aimed at averting the degradation of the ecological environment in the northwestern region. This involves addressing issues such as wind and sand fixation and mitigating soil erosion. In the southern region, particular attention should be directed towards managing population density and built-up area density. Implementing well-considered urban development planning policies is crucial to enhancing the overall quality of the regional ecological environment.

Author Contributions

Conceptualization, W.Z., Z.L. and P.J.; methodology, W.Z., Z.L., K.Q., S.D., H.L. and P.J.; validation, Z.L. and H.L.; formal analysis, Z.L., K.Q., S.D., J.J. and P.J.; investigation, W.Z.; resources, M.L., W.Z. and P.J.; data curation, Z.L., K.Q. and S.D.; writing—original draft preparation, W.Z., Z.L., K.Q. and S.D.; writing—review and editing, W.Z., K.Q., S.D., J.J., H.L., Z.Y., C.C. and P.J.; visualization, J.J.; supervision, W.Z. and P.J.; project administration, W.Z. and M.L.; funding acquisition, W.Z., M.L. and P.J. All authors have read and agreed to the published version of the manuscript.

Funding

This study was supported by the National Key R&D Program of China (2019YFA06074001, 2023YFC3604704), National Natural Science Foundation of China (42071419, 42271433, 42271276), Agricultural Science and Technology Innovation Program (CAAS-ZDRW202201), Jiangsu Province Social Science Foundation, China (22GLD007), Jiangxi Provincial 03 Special Foundation and 5G Program (20224ABC03A05), Wuhan University Specific Fund for Major School-level Internationalization Initiatives (WHU-GJZDZX-PT07), and the International Institute of Spatial Lifecourse Health (ISLE).

Data Availability Statement

Data will be made available upon request.

Acknowledgments

We would like to thank the editor and anonymous reviewers for their constructive comments and suggestions for improving the manuscript.

Conflicts of Interest

The authors declare that they have no known competing financial interests or personal relationships that could have appeared to influence the work reported in this paper.

References

  1. Jia, H.; Yan, C.; Xing, X. Evaluation of Eco-Environmental Quality in Qaidam Basin Based on the Ecological Index (MRSEI) and GEE. Remote Sens. 2021, 13, 4543. [Google Scholar] [CrossRef]
  2. Zhang, F.; Zhou, Z.; Huang, D.; Du, X.; Deng, F.; Yang, Y.; Du, S. Dynamic monitoring and analysis of factors influencing ecological quality in rapidly urbanizing areas based on the Google Earth Engine. Geocarto Int. 2023, 38, 2256299. [Google Scholar] [CrossRef]
  3. Legg, S. IPCC, 2021: Climate Change 2021—The Physical Science basis. Interaction 2021, 49, 44–45. [Google Scholar]
  4. Newbold, T.; Hudson, L.N.; Hill, S.L.; Contu, S.; Lysenko, I.; Senior, R.A.; Börger, L.; Bennett, D.J.; Choimes, A.; Collen, B.J.N. Global effects of land use on local terrestrial biodiversity. Nature 2015, 520, 45–50. [Google Scholar] [CrossRef] [PubMed]
  5. Zhao, J.; Yang, Z.; Govers, G.J.G. Soil and water conservation measures reduce soil and water losses in China but not down to background levels: Evidence from erosion plot data. Geoderma 2019, 337, 729–741. [Google Scholar] [CrossRef]
  6. Pachauri, R.K.; Reisinger, A. Climate change 2007: Synthesis report. In Contribution of Working Groups I, II and III to the Fourth Assessment Report of the Intergovernmental Panel on Climate Change; IPCC: Geneva, Switzerland, 2007. [Google Scholar]
  7. Shi, G.; Dal Tie, X.U. Latest Progress of the Study of Atmospheric CO2 Concentration Retrievals from Satellite. Adv. Earth Sci. 2010, 25, 7. [Google Scholar]
  8. Zhang, X.P.; Cheng, X.M. Energy consumption, carbon emissions, and economic growth in China. Ecol. Econ. 2009, 68, 2706–2712. [Google Scholar] [CrossRef]
  9. Yin, C.; Peng, N.; Li, Y.; Shi, Y.; Yang, S.; Jia, P. A review on street view observations in support of the sustainable development goals. Int. J. Appl. Earth Obs. 2023, 117, 103205. [Google Scholar] [CrossRef]
  10. Hussain, D.; Khan, A.A. Machine learning techniques for monthly river flow forecasting of Hunza River, Pakistan. Earth Sci. Inf. 2020, 13, 939–949. [Google Scholar] [CrossRef]
  11. Yurui, L.; Xuanchang, Z.; Zhi, C.; Zhengjia, L.; Zhi, L.; Yansui, L. Towards the progress of ecological restoration and economic development in China’s Loess Plateau and strategy for more sustainable development. Sci. Total. Environ. 2021, 756, 143676. [Google Scholar] [CrossRef]
  12. Alqadhi, S.; Mallick, J.; Balha, A.; Bindajam, A.; Singh, C.K.; Hoa, P.V. Spatial and decadal prediction of land use/land cover using multi-layer perceptron-neural network (MLP-NN) algorithm for a semi-arid region of Asir, Saudi Arabia. Earth Sci. Inf. 2021, 14, 1547–1562. [Google Scholar] [CrossRef]
  13. Casagli, N.; Frodella, W.; Morelli, S.; Tofani, V.; Ciampalini, A.; Intrieri, E.; Raspini, F.; Rossi, G.; Tanteri, L.; Lu, P. Spaceborne, UAV and ground-based remote sensing techniques for landslide mapping, monitoring and early warning. Geo-Environ. Disasters 2017, 4, 1–23. [Google Scholar] [CrossRef]
  14. Firozjaei, M.K.; Fathololoumi, S.; Weng, Q.; Kiavarz, M.; Alavipanah, S.K. Remotely Sensed Urban Surface Ecological Index (RSUSEI): An Analytical Framework for Assessing the Surface Ecological Status in Urban Environments. Remote Sens. 2020, 12, 2029. [Google Scholar] [CrossRef]
  15. Xu, H.Q. A remote sensing urban ecological index and its application. Acta Ecol. Sin. 2013, 33, 7853–7862. [Google Scholar]
  16. Jia, P.; Stein, A. Using remote sensing technology to measure environmental determinants of non-communicable diseases. Int. J. Epidemiol. 2017, 46, 1343–1344. [Google Scholar] [CrossRef] [PubMed]
  17. Hu, X.; Xu, H. A new remote sensing index for assessing the spatial heterogeneity in urban ecological quality: A case from Fuzhou City, China. Ecol. Indic. 2018, 89, 11–21. [Google Scholar] [CrossRef]
  18. Sun, L.; Yu, Y.; Gao, Y.; He, J.; Yu, X.; Malik, I.; Wistuba, M.; Yu, R. Remote Sensing Monitoring and Evaluation of the Temporal and Spatial Changes in the Eco-Environment of a Typical Arid Land of the Tarim Basin in Western China. Land 2021, 10, 868. [Google Scholar] [CrossRef]
  19. Li, F.; Liu, X.; Liao, S.; Jia, P. The Modified Normalized Urban Area Composite Index: A Satelliate-Derived High-Resolution Index for Extracting Urban Areas. Remote Sens. 2021, 13, 2350. [Google Scholar] [CrossRef]
  20. Wang, C.; Zhao, H. The Assessment of Urban Ecological Environment in Watershed Scale. Proc. Environ. Sci. 2016, 36, 169–175. [Google Scholar] [CrossRef]
  21. Liang, Q.; Xue, Z.J.; Wang, F.; Sun, Z.M.; Yang, Z.X.; Liu, S.Q. Contamination and health risks from heavy metals in cultivated soil in Zhangjiakou City of Hebei Province, China. Environ. Monit Assess 2015, 187, 754. [Google Scholar] [CrossRef]
  22. Yang, L.; Yang, M.; Wang, L.; Peng, F.; Li, Y.; Bai, H. Heavy metal contamination and ecological risk of farmland soils adjoining steel plants in Tangshan, Hebei, China. Environ. Sci. Pollut Res. 2018, 25, 1231–1242. [Google Scholar] [CrossRef]
  23. Zhang, H.; Uwasu, M.; Hara, K.; Yabar, H. Sustainable Urban Development and Land Use Change—A Case Study of the Yangtze River Delta in China. Sustainability 2011, 3, 1074–1089. [Google Scholar] [CrossRef]
  24. Jiang, Y.; Zheng, J. Economic Growth or Environmental Sustainability? Drivers of Pollution in the Yangtze River Delta Urban Agglomeration in China. Emerg. Mark. Financ. Trade 2017, 53, 2625–2643. [Google Scholar] [CrossRef]
  25. Liu, W.; Zhan, J.; Zhao, F.; Yan, H.; Zhang, F.; Wei, X. Impacts of urbanization-induced land-use changes on ecosystem services: A case study of the Pearl River Delta Metropolitan Region, China. Ecol. Indic. 2019, 98, 228–238. [Google Scholar] [CrossRef]
  26. Zhang, Y.-X.; Liu, Q.; Wang, Y.-K.; Huang, J.-H. Assessing the impacts of climate change and anthropogenic activities on vegetation in southwest China. J. Mt. Sci. 2022, 19, 2678–2692. [Google Scholar] [CrossRef]
  27. Li, T.; Bao, R.; Li, L.; Tang, M.; Deng, H. Temporal and Spatial Changes of Habitat Quality and Their Potential Driving Factors in Southwest China. Land 2023, 12, 346. [Google Scholar] [CrossRef]
  28. Li, S.; Verburg, P.H.; Lv, S.; Wu, J.; Li, X. Spatial analysis of the driving factors of grassland degradation under conditions of climate change and intensive use in Inner Mongolia, China. Reg. Environ. Chang. 2012, 12, 461–474. [Google Scholar] [CrossRef]
  29. Su, R.; Cheng, J.; Chen, D.; Bai, Y.; Jin, H.; Chao, L.; Wang, Z.; Li, J. Effects of grazing on spatiotemporal variations in community structure and ecosystem function on the grasslands of Inner Mongolia, China. Sci. Rep. 2017, 7, 40. [Google Scholar] [CrossRef] [PubMed]
  30. Huang, H.; Chen, W.; Zhang, Y.; Qiao, L.; Du, Y. Analysis of ecological quality in Lhasa Metropolitan Area during 1990–2017 based on remote sensing and Google Earth Engine platform. J. Geo. Sci. 2021, 31, 265–280. [Google Scholar] [CrossRef]
  31. Qureshi, S.; Alavipanah, S.K.; Konyushkova, M.; Mijani, N.; Fathololomi, S.; Firozjaei, M.K.; Homaee, M.; Hamzeh, S.; Kakroodi, A.A. A Remotely Sensed Assessment of Surface Ecological Change over the Gomishan Wetland, Iran. Remote Sens. 2020, 12, 2989. [Google Scholar] [CrossRef]
  32. Jing, Y.; Zhang, F.; He, Y.; Kung, H.; Johnson, V.; Arikena, M. Assessment of spatial and temporal variation of ecological environment quality in Ebinur Lake Wetland National Nature Reserve, Xinjiang, China. Ecol. Indic. 2020, 110, 105874. [Google Scholar] [CrossRef]
  33. Ji, J.; Tang, Z.; Zhang, W.; Liu, W.; Jin, B.; Xi, X.; Wang, F.; Zhang, R.; Guo, B.; Xu, Z.; et al. Spatiotemporal and Multiscale Analysis of the Coupling Coordination Degree between Economic Development Equality and Eco-Environmental Quality in China from 2001 to 2020. Remote Sens. 2022, 14, 737. [Google Scholar] [CrossRef]
  34. Xu, H.; Duan, W.; Deng, W.; Lin, M. RSEI or MRSEI? Comment on Jia et al. Evaluation of Eco-Environmental Quality in Qaidam Basin Based on the Ecological Index (MRSEI) and GEE. Remote Sens. 2021, 13, 4543. Remote Sens. 2022, 14, 5307. [Google Scholar] [CrossRef]
  35. Ji, J.; Tang, Z.; Jiang, L.; Sheng, T.; Zhao, F.; Zhang, R.; Shifaw, E.; Liu, W.; Li, H.; Liu, X.; et al. Study on Regional Eco-Environmental Quality Evaluation Considering Land Surface and Season Differences: A Case Study of Zhaotong City. Remote Sens. 2023, 15, 657. [Google Scholar] [CrossRef]
  36. Wang, X.X.; Zhang, X.X.; Li, W.P.; Cheng, X.Q.; Ling, Q.; Zhou, Z.Y.; Hao, J.M.; Lin, Q.R.; Chen, L. Asesment of Eeologieal Environment Quality in Qilian Mountain National Nature Reserve Basedon Improved RSEI Model. J. Ecol. Rural Environ. 2023, 39, 853–863. [Google Scholar]
  37. Xu, L.T.; Liu, H.H.; Huang, L.J.; Wang, Y.F. Spatial and temporal changes of ecological environment and water conservation in Fenhe River Basin from 2000 to 2020. Arid. Zone Res. 2023, 40, 313–325. [Google Scholar]
  38. Li, R.; Chen, G.Q.; Li, W.X.; Meng, R.; Wang, M.J.; Guo, Y.N. Spatiotemporal Analysis of Eco-environmental Benefits in Shenfu-Dongsheng Mining Area During 1995–2020 Based on RSEI. Bull. Soil Water Conserv. 2023, 41, 143–151. [Google Scholar]
  39. Tang, L.D.; Liang, G.D.; Gu, G.H.; Xu, J.; Duan, L.; Zhang, X.Y.; Yang, X.X.; Lu, R.C. Study on the spatial-temporal evolution characteristics, patterns, and driving mechanisms of ecological environment of the Ecological Security Barriers on China’s Land Borders. Environ. Impact Assess Rev. 2023, 103, 107267. [Google Scholar] [CrossRef]
  40. Zhang, L.; Fang, C.; Zhao, R.; Zhu, C.; Guan, J. Spatial–temporal evolution and driving force analysis of eco-quality in urban agglomerations in China. Sci. Total Environ. 2023, 866, 161465. [Google Scholar] [CrossRef]
  41. Streimikiene, D. Environmental indicators for the assessment of quality of life. Intellect. Econ. 2015, 9, 67–79. [Google Scholar] [CrossRef]
  42. Hills, P. Environmental policy and planning in Hong Kong: An emerging regional agenda. Sustain. Dev. 2002, 10, 171–178. [Google Scholar] [CrossRef]
  43. Gustafsson, S.; Hermelin, B.; Smas, L. Integrating environmental sustainability into strategic spatial planning: The importance of management. J Environ. Plann. Man. 2019, 62, 1321–1338. [Google Scholar] [CrossRef]
  44. Guo, H.D.; Wang, X.Y.; Wu, B.F.; Li, X. Cognizing population density demarcative line(hu huanyong-line) based on space technology. Bull. Chin. Acad. Sci. 2016, 31, 1385–1394. [Google Scholar]
  45. Fang, C.L.; Li, G.D.; Qi, W.; Sun, S.A.; Cui, X.G.; Ren, Y.F. Unbalanced trend of urban and rural development on the east and west sides of Hu Huanyong Line and micro-breakthrough strategy along the Bole-Taipei Line. Acta Geogr. Sin. 2023, 78, 443–455. [Google Scholar]
  46. Peng, S.Z.P. 1-km Monthly Mean Temperature Dataset for China (1901–2022); National Tibetan Plateau/Third Pole Environment Data Center: Beijing, China, 2019. [Google Scholar] [CrossRef]
  47. Peng, S.Z. 1-km Monthly Precipitation Dataset for China (1901–2022); National Tibetan Plateau/Third Pole Environment Data Center: Beijing, China, 2019. [Google Scholar] [CrossRef]
  48. Yang, J.; Huang, X. The 30 m annual land cover datasets and its dynamics in China from 1990 to 2021. Earth Syst. Sci. Data 2022, 13, 3907–3925. [Google Scholar] [CrossRef]
  49. Chen, Z.; Yu, B.; Yang, C.; Zhou, Y.; Yao, S.; Qian, X.; Wang, C.; Wu, B.; Wu, J. An extended time-series (2000-2018) of global NPP-VIIRS-like nighttime light data. Earth Syst. Sci. Data 2021, 13, 889–906. [Google Scholar] [CrossRef]
  50. Rouse, J.W., Jr.; Haas, R.H.; Schell, J.A.; Deering, D.W. Monitoring Vegetation Systems in the Great Plains with Erts. NASA Spec. Publ. 1974, 351, 309. [Google Scholar]
  51. Xu, H. Analysis of Impervious Surface and its Impact on Urban Heat Environment using the Normalized Difference Impervious Surface Index (NDISI). Photogram. Eng. Remote. Sens. 2010, 76, 557–565. [Google Scholar] [CrossRef]
  52. Chen, C.; Fu, J.; Zhang, S.; Zhao, X. Coastline information extraction based on the tasseled cap transformation of Landsat-8 OLI images. Estuar. Coast. Shelf Sci. 2019, 217, 281–291. [Google Scholar] [CrossRef]
  53. Huang, Y.; Yang, S.; Zou, Y.; Su, J.; Wu, C.; Zhong, B.; Jia, P. Spatiotemporal epidemiology of COVID-19 from an epidemic course perspective. Geospatial Health. 2022, 17, 1023. [Google Scholar] [CrossRef]
  54. Qiu, G.; Liu, X.; Amiranti, A.Y.; Yasini, M.; Wu, T.; Amer, S.; Jia, P. Geographic clustering and region-specific determinants of obesity in the Netherlands. Geospatial Health. 2020, 15, 839. [Google Scholar] [CrossRef] [PubMed]
  55. Wang, J.F.; Xu, C.D. Geodetector: Principle and prospective. Acta Geogr. Scin. 2017, 72, 116–134. [Google Scholar]
  56. Zhu, L.; Meng, J.; Zhu, L. Applying Geodetector to disentangle the contributions of natural and anthropogenic factors to NDVI variations in the middle reaches of the Heihe River Basin. Ecol. Indic. 2020, 117, 106545. [Google Scholar] [CrossRef]
  57. Xu, L.; Du, H.; Zhang, X. Driving forces of carbon dioxide emissions in China’s cities: An empirical analysis based on the geodetector method. J. Clean. Prod. 2021, 287, 125169. [Google Scholar] [CrossRef]
  58. Zhang, X.S.; Zhang, W.F.; Gao, X.Y.; Wei, J.F.; Liu, Y. Dynamic Assessment of Ecological Environment Quality in Ganzhou District of Zhangye City Based on RSEI. Yellow River 2023, 45, 114–120. [Google Scholar]
  59. Zhao, K.X.; Li, X.M.; Wang, G.G.; Sun, X.W. Dynamic analysis of ecological environment quality in the Yellow River source area based on GEE platform. Chin. J. Ecol. 2024, 43, 290–298. [Google Scholar]
  60. Shang, X.L. Study on the Ecological Environmental Quality and Development Orientation of Three Major Urban Agglomerations in China: Based on the Ecological Meaning of Hu Line. Urban Dev. Stud. 2023, 30, 72–81. [Google Scholar]
  61. Tang, L.N.; Lan, T.; Xing, X.X.; Xie, T.; Li, W.F.; Fang, C.L.; Cao, Y.N.; Xu, Y.Y.; Cao, D.K.; Wang, L.; et al. Past Achievements and Future Strategies of Eco-environmental Construction in Mega Urban Agglomerations in Eastern China. Bull. Chin. Acad. Sci. 2023, 38, 394–406. [Google Scholar] [CrossRef]
  62. Zhou, Y.; He, C.F.; Liu, Y. An empirical study on the geographical distribution of pollution-intensive industries in China. J. Nat. 2015, 30, 1183–1196. [Google Scholar]
  63. Huang, Y.Y.; Zhu, S.J. Public environmental concerns, environmental regulations and energy-intensive industrial dynamics in China. J. Nat. Res. 2020, 35, 2744–2758. [Google Scholar] [CrossRef]
  64. Mao, X.Y.; Liu, Y.; He, C.F. Spatial pattern dynamics of resource-based industry in China. J. Nat. Res. 2015, 30, 1332–1342. [Google Scholar]
  65. Yun, C.; Yuqiang, L.; Xuyang, W.; Caiping, Y.; Yayi, N. Risk and countermeasures of global change in ecologically vulnerable regions of China. J. Desert Res. 2022, 42, 148–158. [Google Scholar]
  66. Sun, K.H.; Zeng, X.D.; Li, F. Study on the dominant climatic driver affecting the changes of LAl of ecological fragile zones in China. J. Nat. Resour. 2021, 36, 1873–1892. [Google Scholar]
  67. Gao, Q.; Liu, T. Causes and consequences of shrub encroachment in arid and semiarid region:a disputable issue. Arid Land Geogr. 2015, 38, 1202–1212. [Google Scholar] [CrossRef]
  68. He, T. Ecological Environment Quality Assessment of Yangtze River Delta Urban Agglomeration based on Google Earth Engine; Shanghai Institute of Technology: Shanghai, China, 2023. [Google Scholar]
  69. Wang, H.L.; Feng, A.P.; Gao, Y.H.; Wang, X.L. Temporal-spatial dynamic change on maximum vegetation coverage degree of Ili river basin. Environ. Sci. Technol. 2018, 41, 161–167. [Google Scholar]
  70. Yin, Z.L.; Feng, Q.; Wang, L.G.; Chen, Z.X.; Chang, Y.B.; Zhu, R. Vegetation coverage change and its influencing factors across the northwest region of China during 2000-2019. J. Desert Res. 2022, 42, 11–21. [Google Scholar]
  71. Sun, D.Q.; Zhang, J.X.; Zhu, C.G.; Hu, Y.; Zhou, L. An Assessment of China’s Ecological Environment Quality Change and lts Spatial Variation. Acta Geogr Sin. 2012, 67, 1599–1610. [Google Scholar]
  72. Hanson, A.; Swanson, L.; Ewing, D.; Grabas, G.; Meyer, S.; Ross, L.; Watmough, M.; Kirkby, J. Wetland Ecological Functions Assessment: An Overview of Approaches. Can. Wildl. Serv. Tech. Rep. Ser. 2008, 16, 123–125. [Google Scholar]
  73. Liu, W.; Guo, Z.; Jiang, B.; Lu, F.; Wang, H.; Wang, D.; Zhang, M.; Cui, L. Improving wetland ecosystem health in China. Ecol. Indic. 2020, 113, 106184. [Google Scholar] [CrossRef]
  74. Chen, W.; Cao, C.; Liu, D.; Tian, R.; Wu, C.; Wang, Y.; Qian, Y.; Ma, G.; Bao, D. An evaluating system for wetland ecological health: Case study on nineteen major wetlands in Beijing-Tianjin-Hebei region, China. Sci. Total Environ. 2019, 666, 1080–1088. [Google Scholar] [CrossRef] [PubMed]
  75. Jia, P.; Xue, H.; Liu, S.; Wang, H.; Yang, L.; Hesketh, T.; Ma, L.; Cai, H.; Liu, X.; Wang, Y.; et al. Opportunities and challenges of using big data for global health. Sci. Bull. 2019, 64, 1652–1654. [Google Scholar] [CrossRef] [PubMed]
Figure 1. Basic characteristics of the study area.
Remotesensing 16 01028 g001
Figure 2. Technical flow chart of the study. EEQ, Eco-environmental quality; LST, Land Surface Temperature; NDBSI, Normalized Different Built-up and Soil Index; NDVI, Normalized Difference Vegetation Index; PCA, Principal Component Analysis; RSEI, Remote Sensing Ecological Index; WET, Wetness component of the tasseled cap transformation.
Remotesensing 16 01028 g002
Figure 3. Trends in the mean value of RSEI (Remote Sensing Ecological Index) in China, 2001–2021.
Remotesensing 16 01028 g003
Figure 4. Spatial distribution of RSEI (Remote Sensing Ecological Index) in China from 2001 to 2021.
Remotesensing 16 01028 g004
Figure 5. Example of annual change in the average value of RSEI (Remote Sensing Ecological Index) at the prefecture level from 2001 to 2021.
Remotesensing 16 01028 g005
Figure 6. Annual change in the average value of RSEI (Remote Sensing Ecological Index) at the provincial level from 2001 to 2021.
Remotesensing 16 01028 g006
Figure 7. The spatial-temporal patterns of RSEI (Remote Sensing Ecological Index) in China, 2001–2021.
Remotesensing 16 01028 g007
Figure 8. Driving factors of EEQ (Ecological Environmental Quality) in China, (a) elevation, (b) population density, (c) average annual temperature, (d) density of built-up area, (e) night-time light, (f) river network density, (g) average annual precipitation, (h) soil sand content. All drivers have been normalized in ArcGIS.
Remotesensing 16 01028 g008
Figure 9. Single-factor analysis. x1: elevation; x2: population density; x3: night-time light; x4: average annual precipitation; x5: soil sand content; x6: river network density; x7: average annual temperature; x8: density of built-up area. The p-values for all points are less than 0.001.
Remotesensing 16 01028 g009
Figure 10. q-value of the extent to which the drivers affect the EEQ under the interaction. x1: elevation; x2: population density; x3: night-time light; x4: annual precipitation; x5: soil sand content; x6: river network density; x7: average annual temperature; x8: density of built-up area.
Remotesensing 16 01028 g010aRemotesensing 16 01028 g010b
Table 1. Data sources.
ProductsBand NameWavelength (nm)Description
MOD09A1sur_refl_b01620–670Surface reflectance for band 1
sur_refl_b02841–876Surface reflectance for band 2
sur_refl_b03459–479Surface reflectance for band 3
sur_refl_b04545–565Surface reflectance for band 4
sur_refl_b051230–1250Surface reflectance for band 5
sur_refl_b061628–1652Surface reflectance for band 6
sur_refl_b072105–2155Surface reflectance for band 7
QA-Surface reflectance 500 m band quality control marks
MOD11A2LST_Day_1km-Land surface temperature
QC_Day-Daytime land surface temperature (LST) quality indicators
Table 2. Indicators employed in the RSEI (Remote Sensing Ecological Index).
IndicatorsCalculation Methods
NDVI N D V I = ρ nir ρ red / ρ nir + ρ red
NDBSI N D B S I = ( S I + I B I ) / 2
S I = ρ S W I R 1 + ρ red ρ blue ρ N I R / ρ S W I R 1 + ρ red + ρ blue + ρ N I R
I B I = 2 ρ S W I R 1 / ρ S W I R 1 + ρ N I R ρ N I R / ρ red + ρ N I R + ρ green / ρ S W I R 1 + ρ green 2 ρ S W I R 1 / ρ S W I R 1 + ρ N I R + ρ N I R / ρ red + ρ N I R + ρ green / ρ S W I R 1 + ρ green
WET W E T M O D I S = 0.2408 ρ blue + 0.3132 ρ green + 0.1147 ρ red + 0.2489 ρ N I R 0.6416 ρ S W I R 1 0.5087 ρ S W I R 2
LSTLST_Day_1km band from MOD11A2 products
Table 3. Detection of types of factor interaction.
InteractionCriteria
Nonlinear weakening q X 1 X 2 < M i n q X 1 , q X 2
Single-factor nonlinear attenuation M i n q X 1 , q X 2 < q X 1 X 2 < M a x q X 1 , q X 2
Two-factor enhancement q X 1 X 2 > M a x q X 1 , q X 2
Mutually independent q X 1 X 2 = q X 1 + q X 2
Nonlinear enhancement q X 1 X 2 > q X 1 + q X 2
Disclaimer/Publisher’s Note: The statements, opinions and data contained in all publications are solely those of the individual author(s) and contributor(s) and not of MDPI and/or the editor(s). MDPI and/or the editor(s) disclaim responsibility for any injury to people or property resulting from any ideas, methods, instructions or products referred to in the content.

