
Impacts of Crop Type and Climate Changes on Agricultural Water Dynamics in Northeast China from 2000 to 2020


Abstract
:
1. Introduction
2. Materials
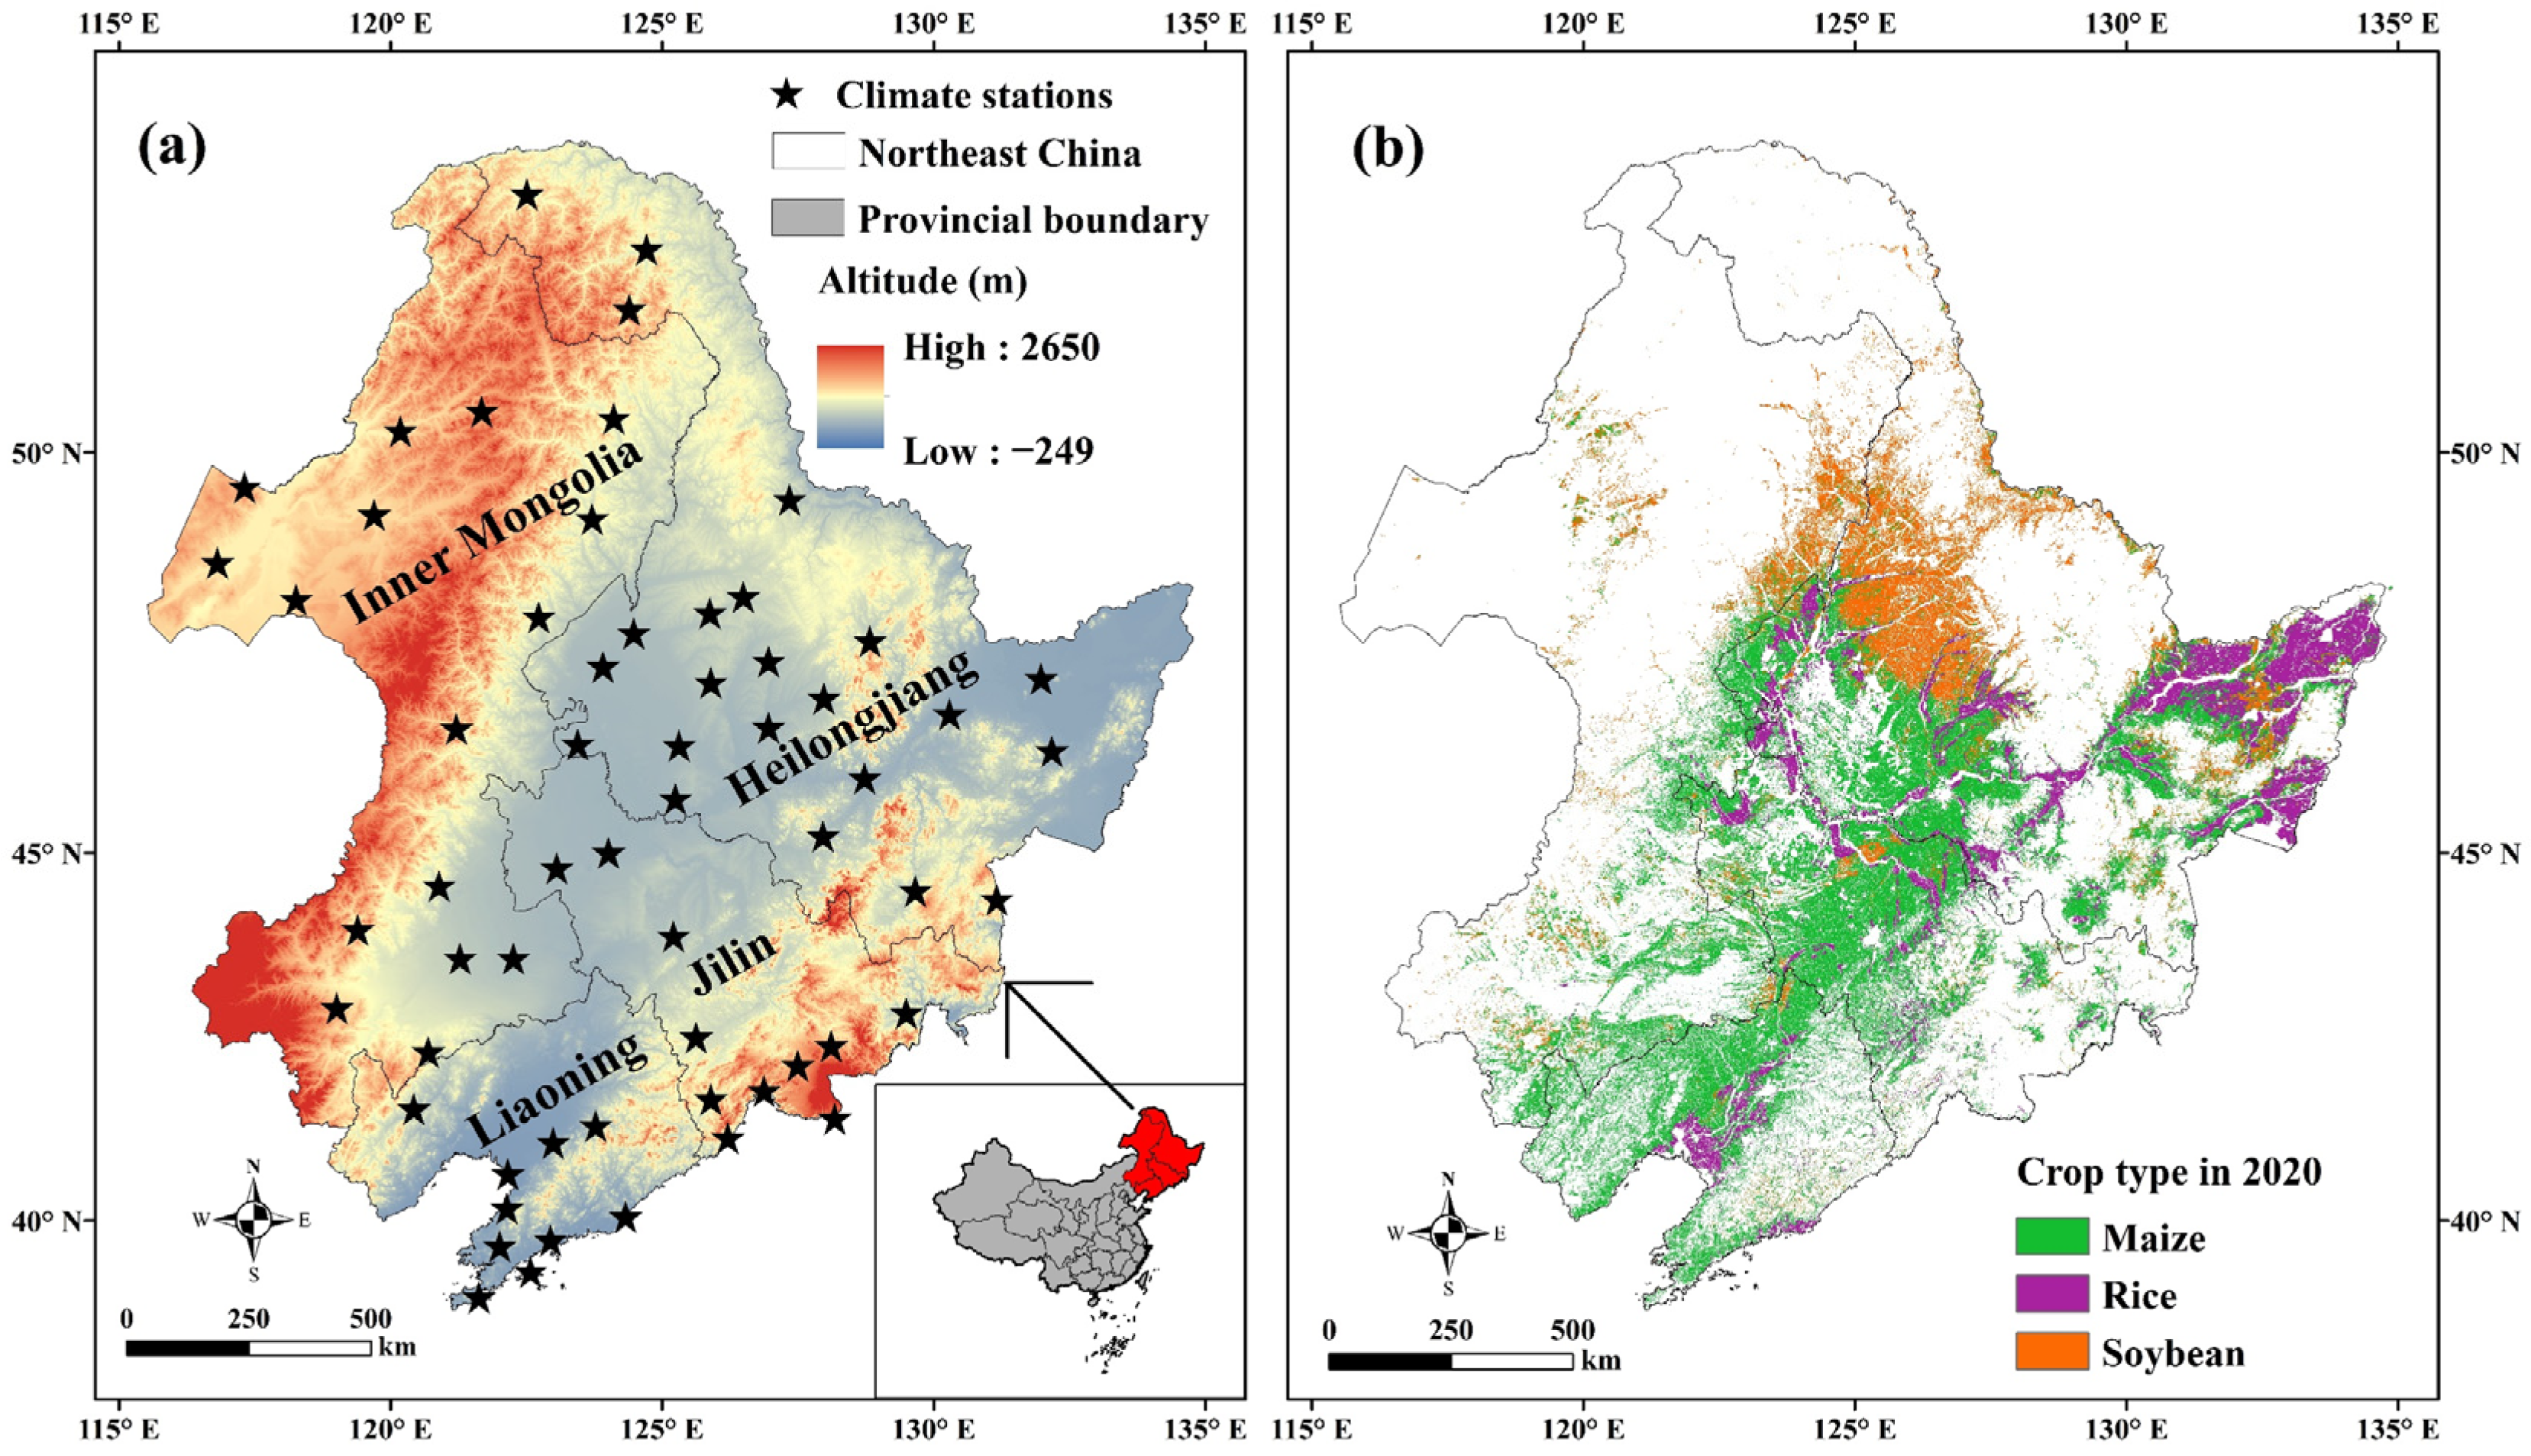
2.1. Study Area
2.2. Data Sources
3. Methods
3.1. Calculation of Effective Precipitation
3.2. Calculation of Crop Water Requirement
3.3. Calculation of Irrigation Water Requirement
3.4. Calculation of Water Supply–Demand Index
3.5. Linear Regression Trend Analysis
4. Results
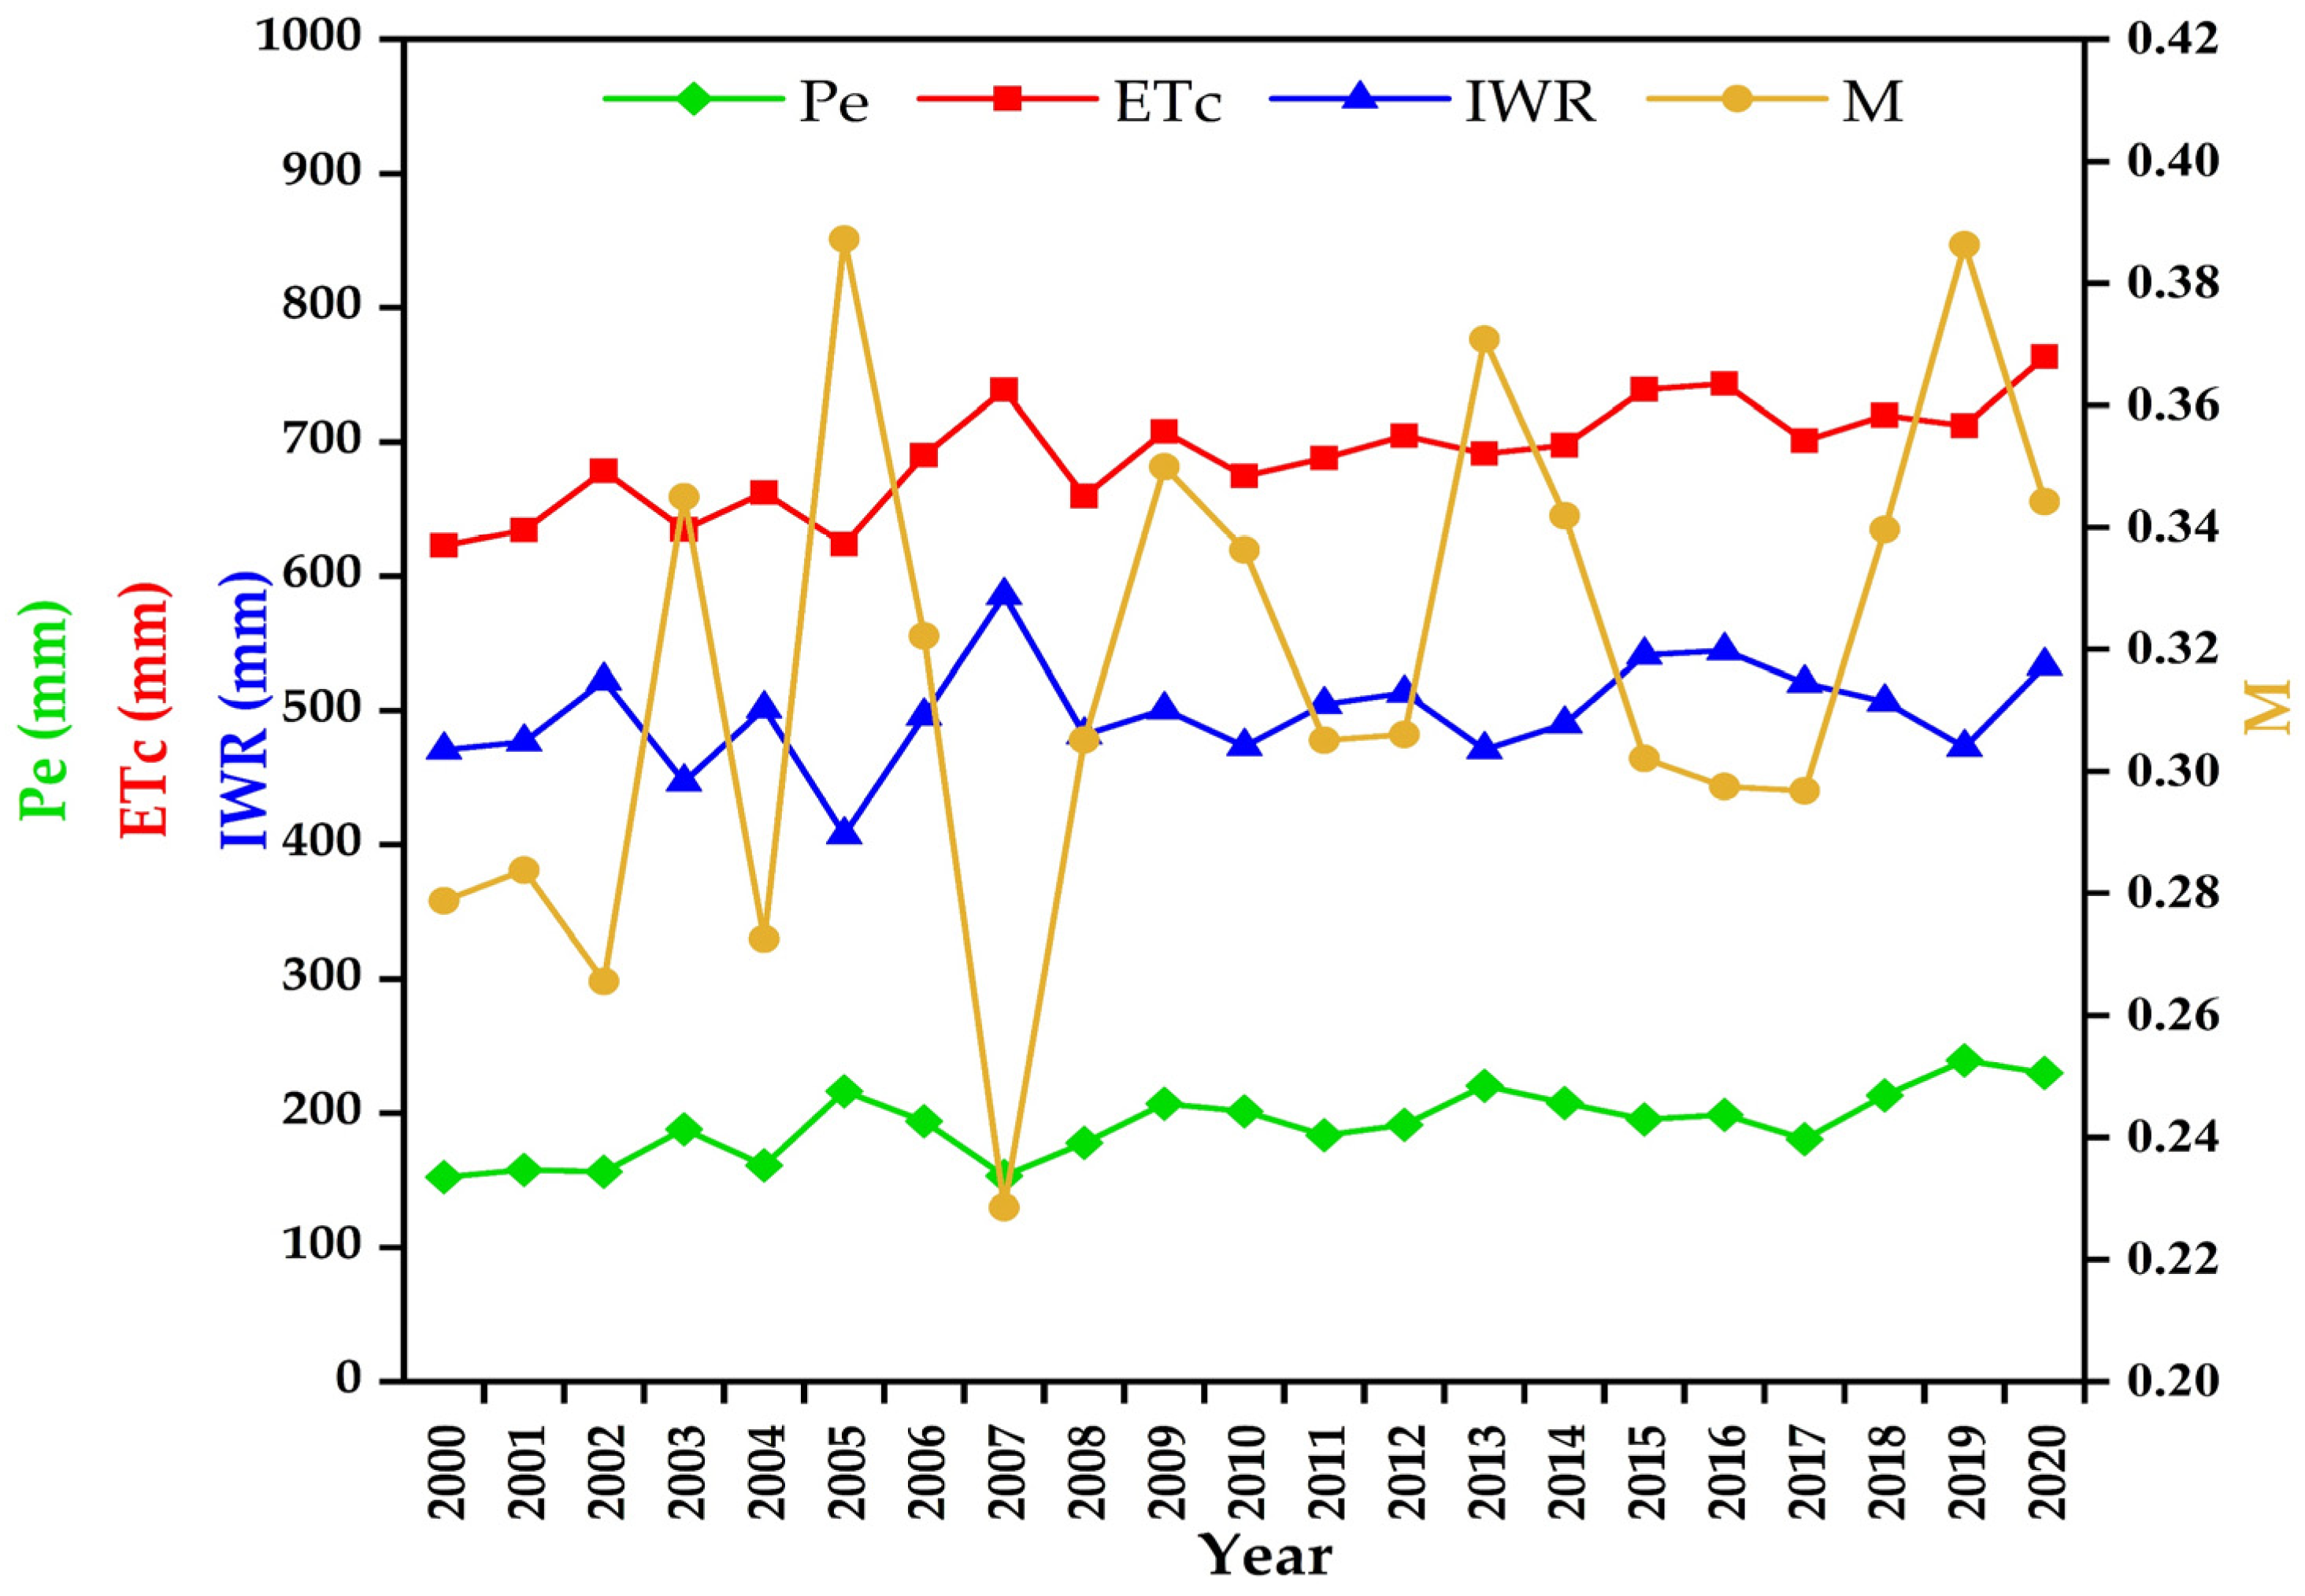
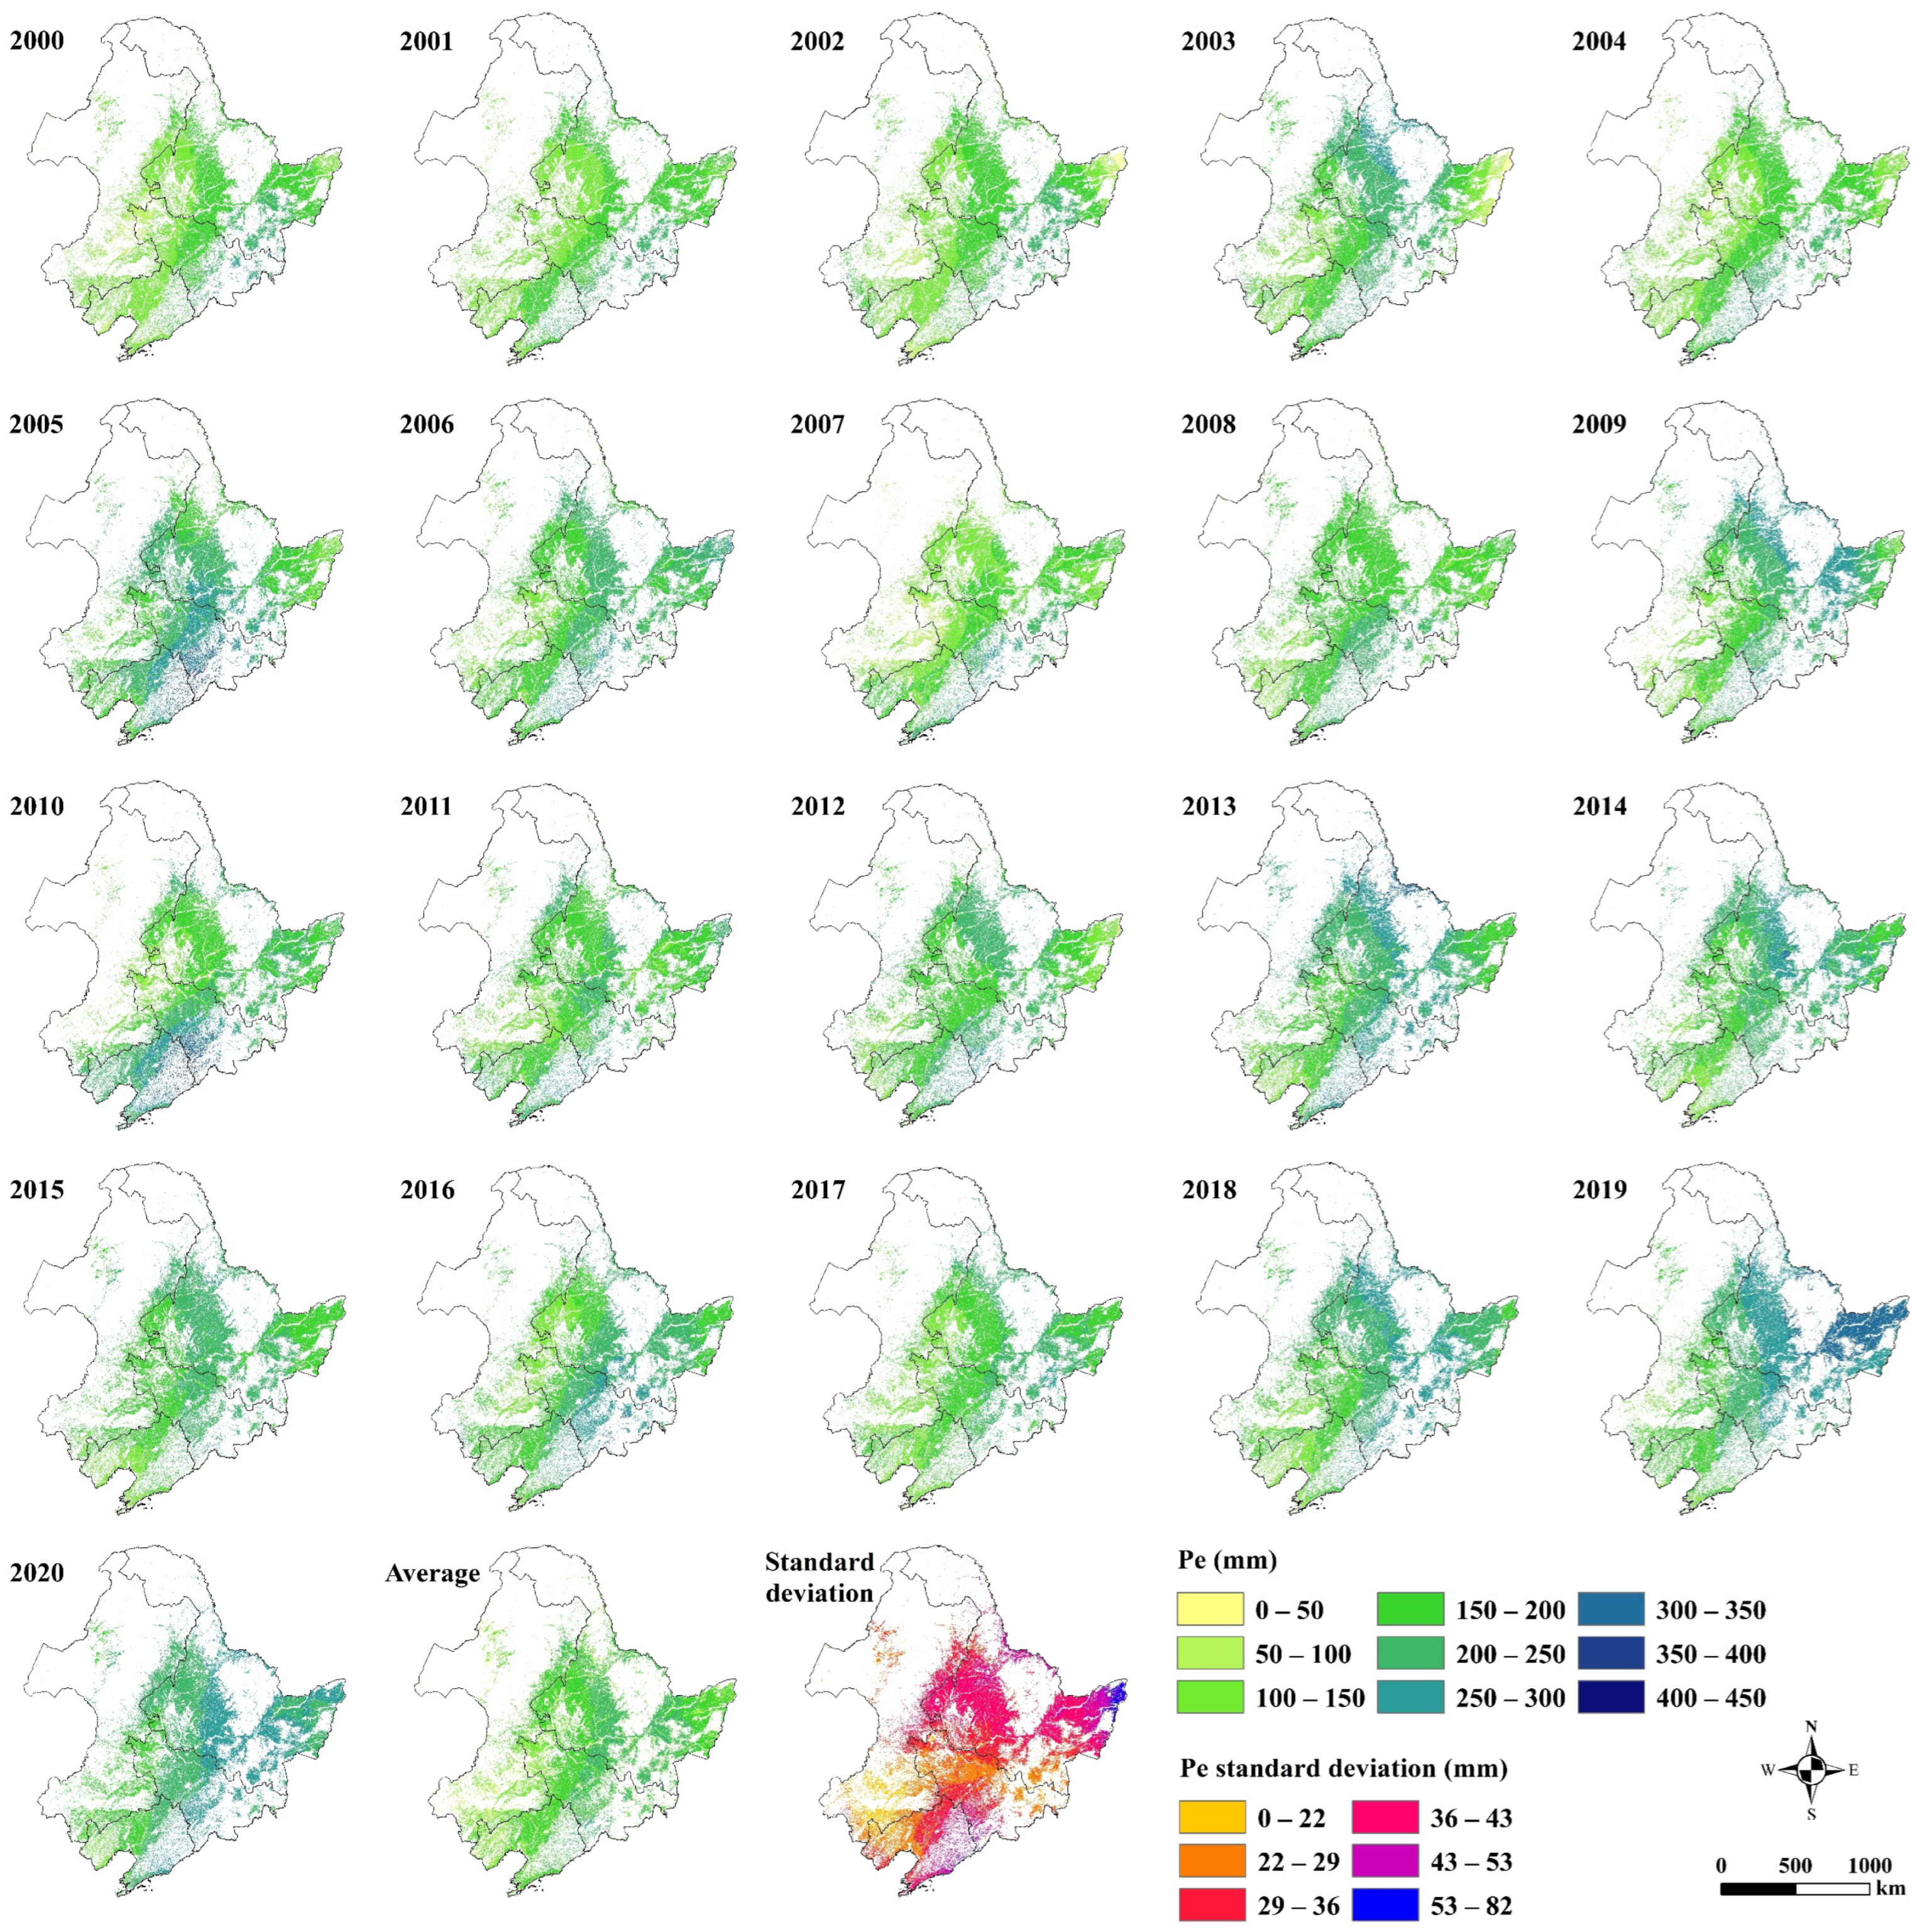
4.1. Annual Spatial Distribution and Temporal Changes in Pe
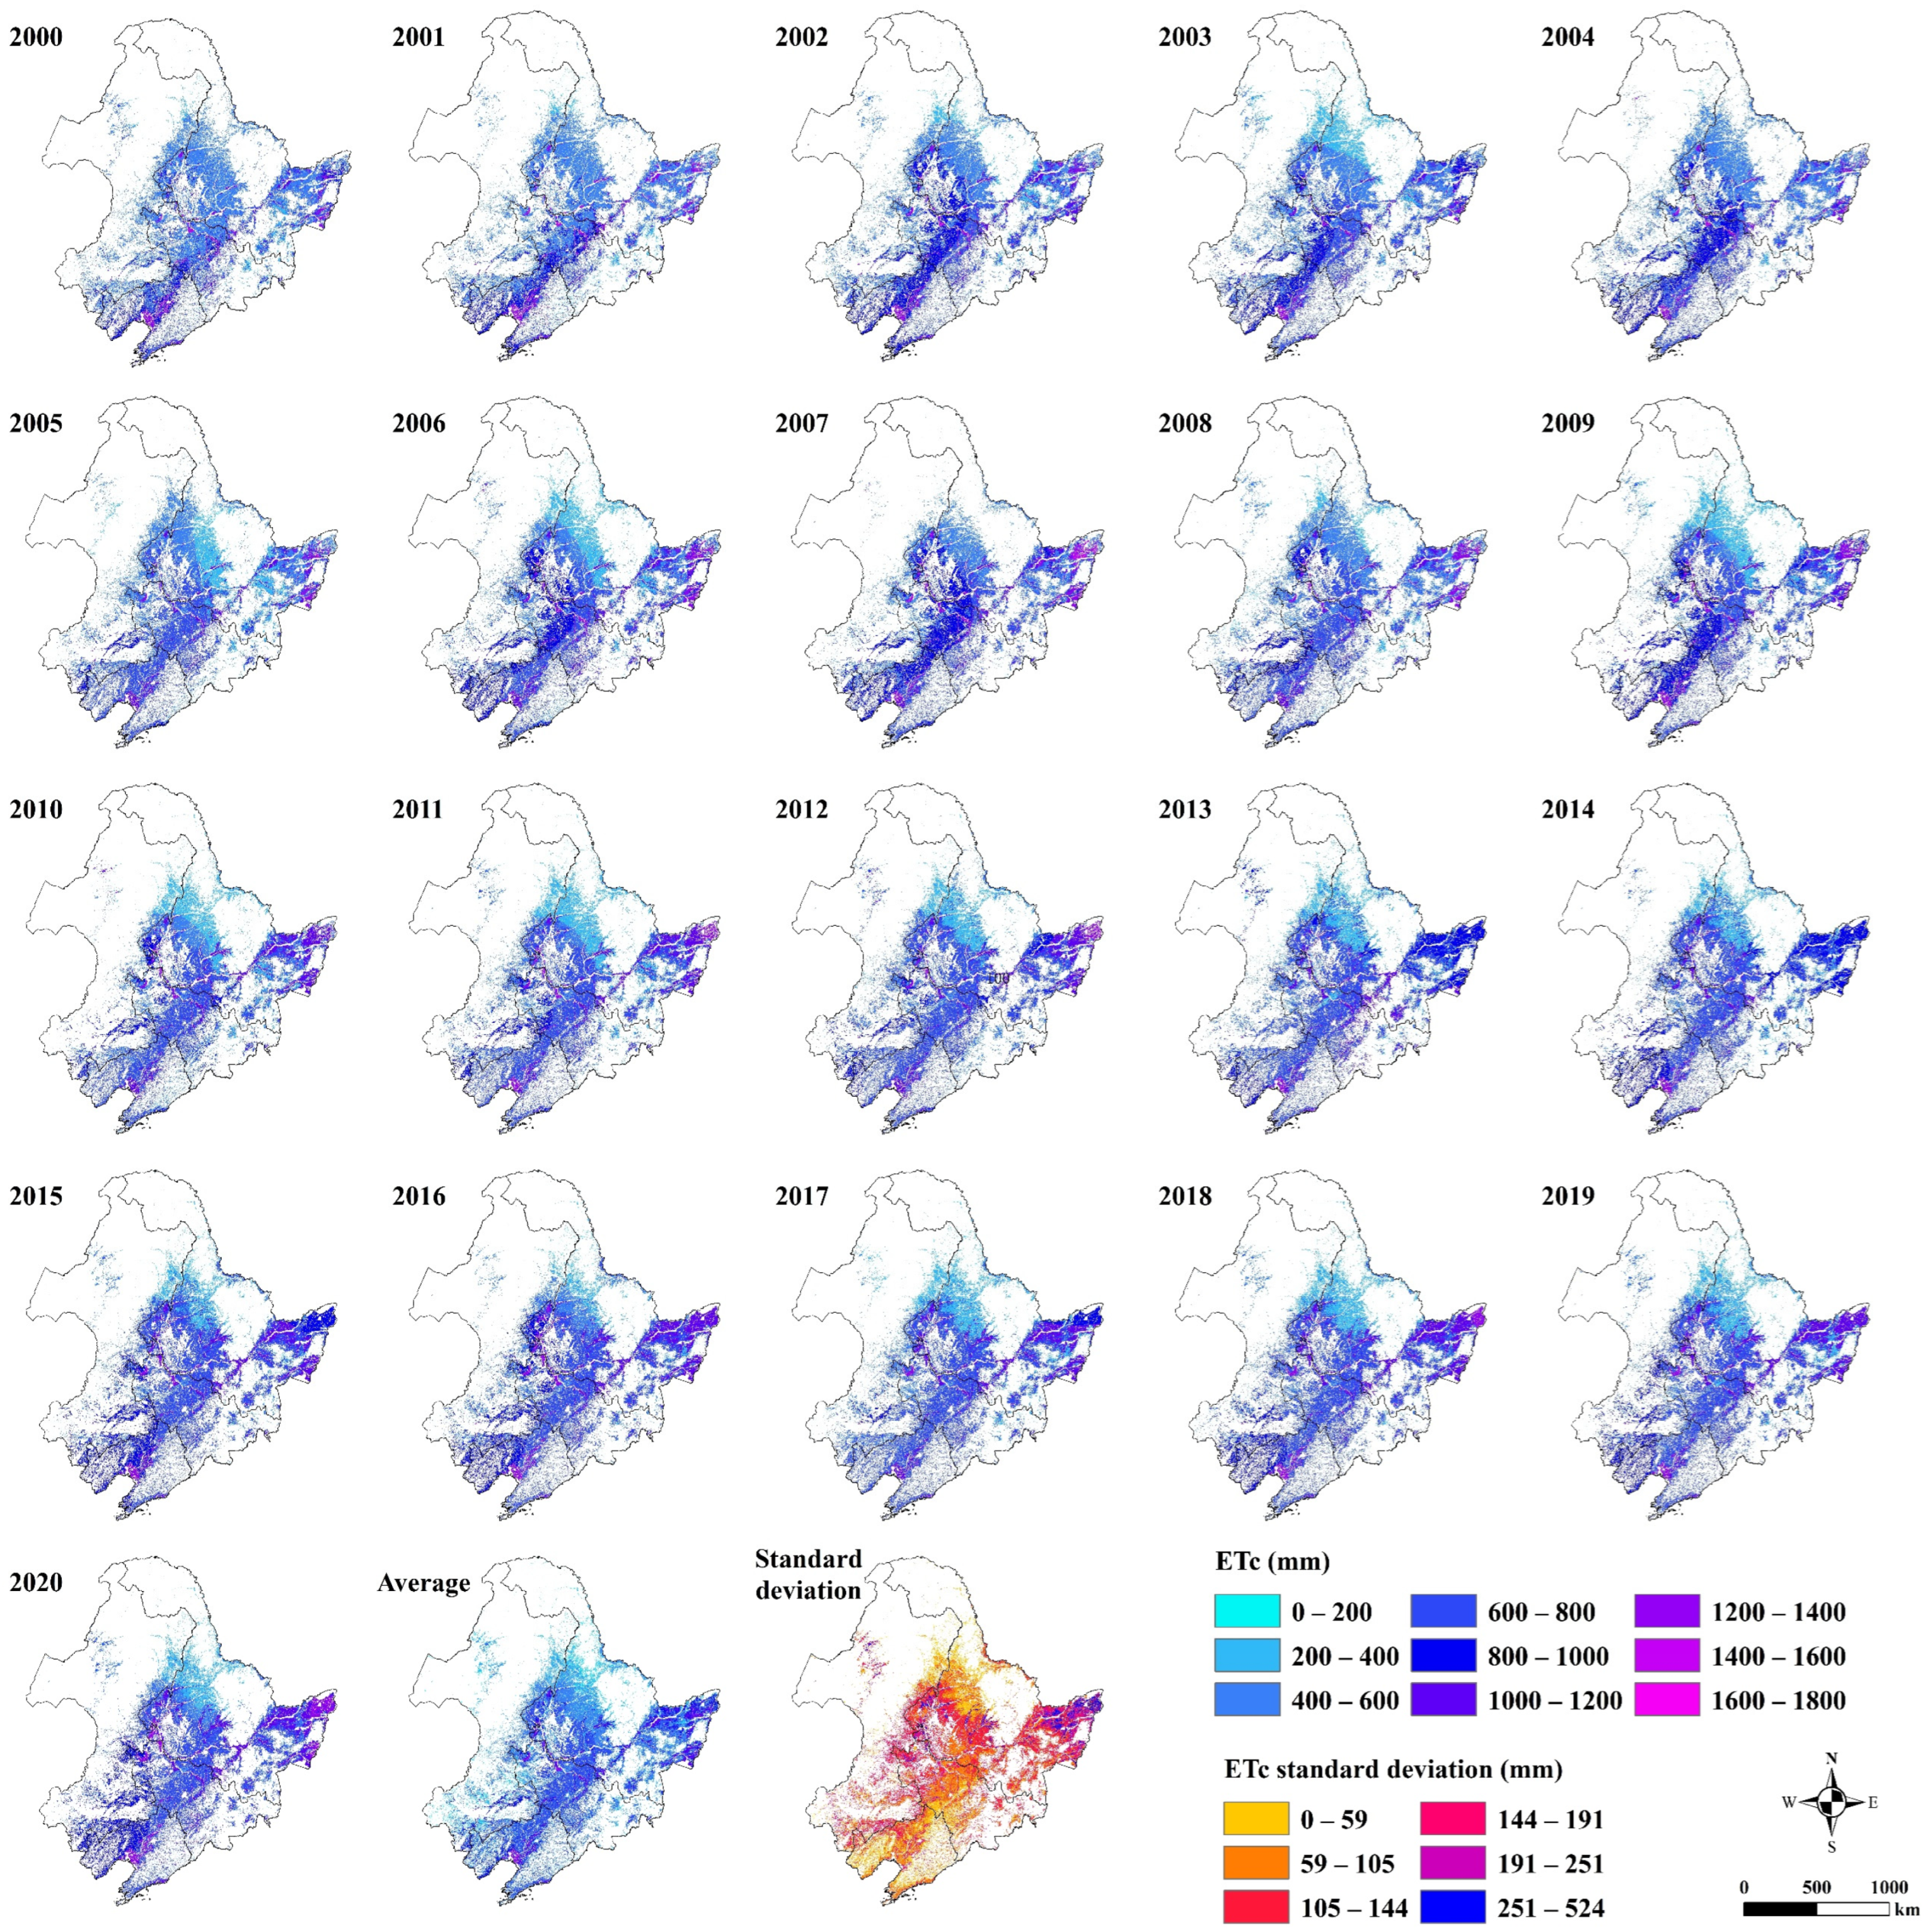
4.2. Annual Spatial Distribution and Temporal Changes in ETc
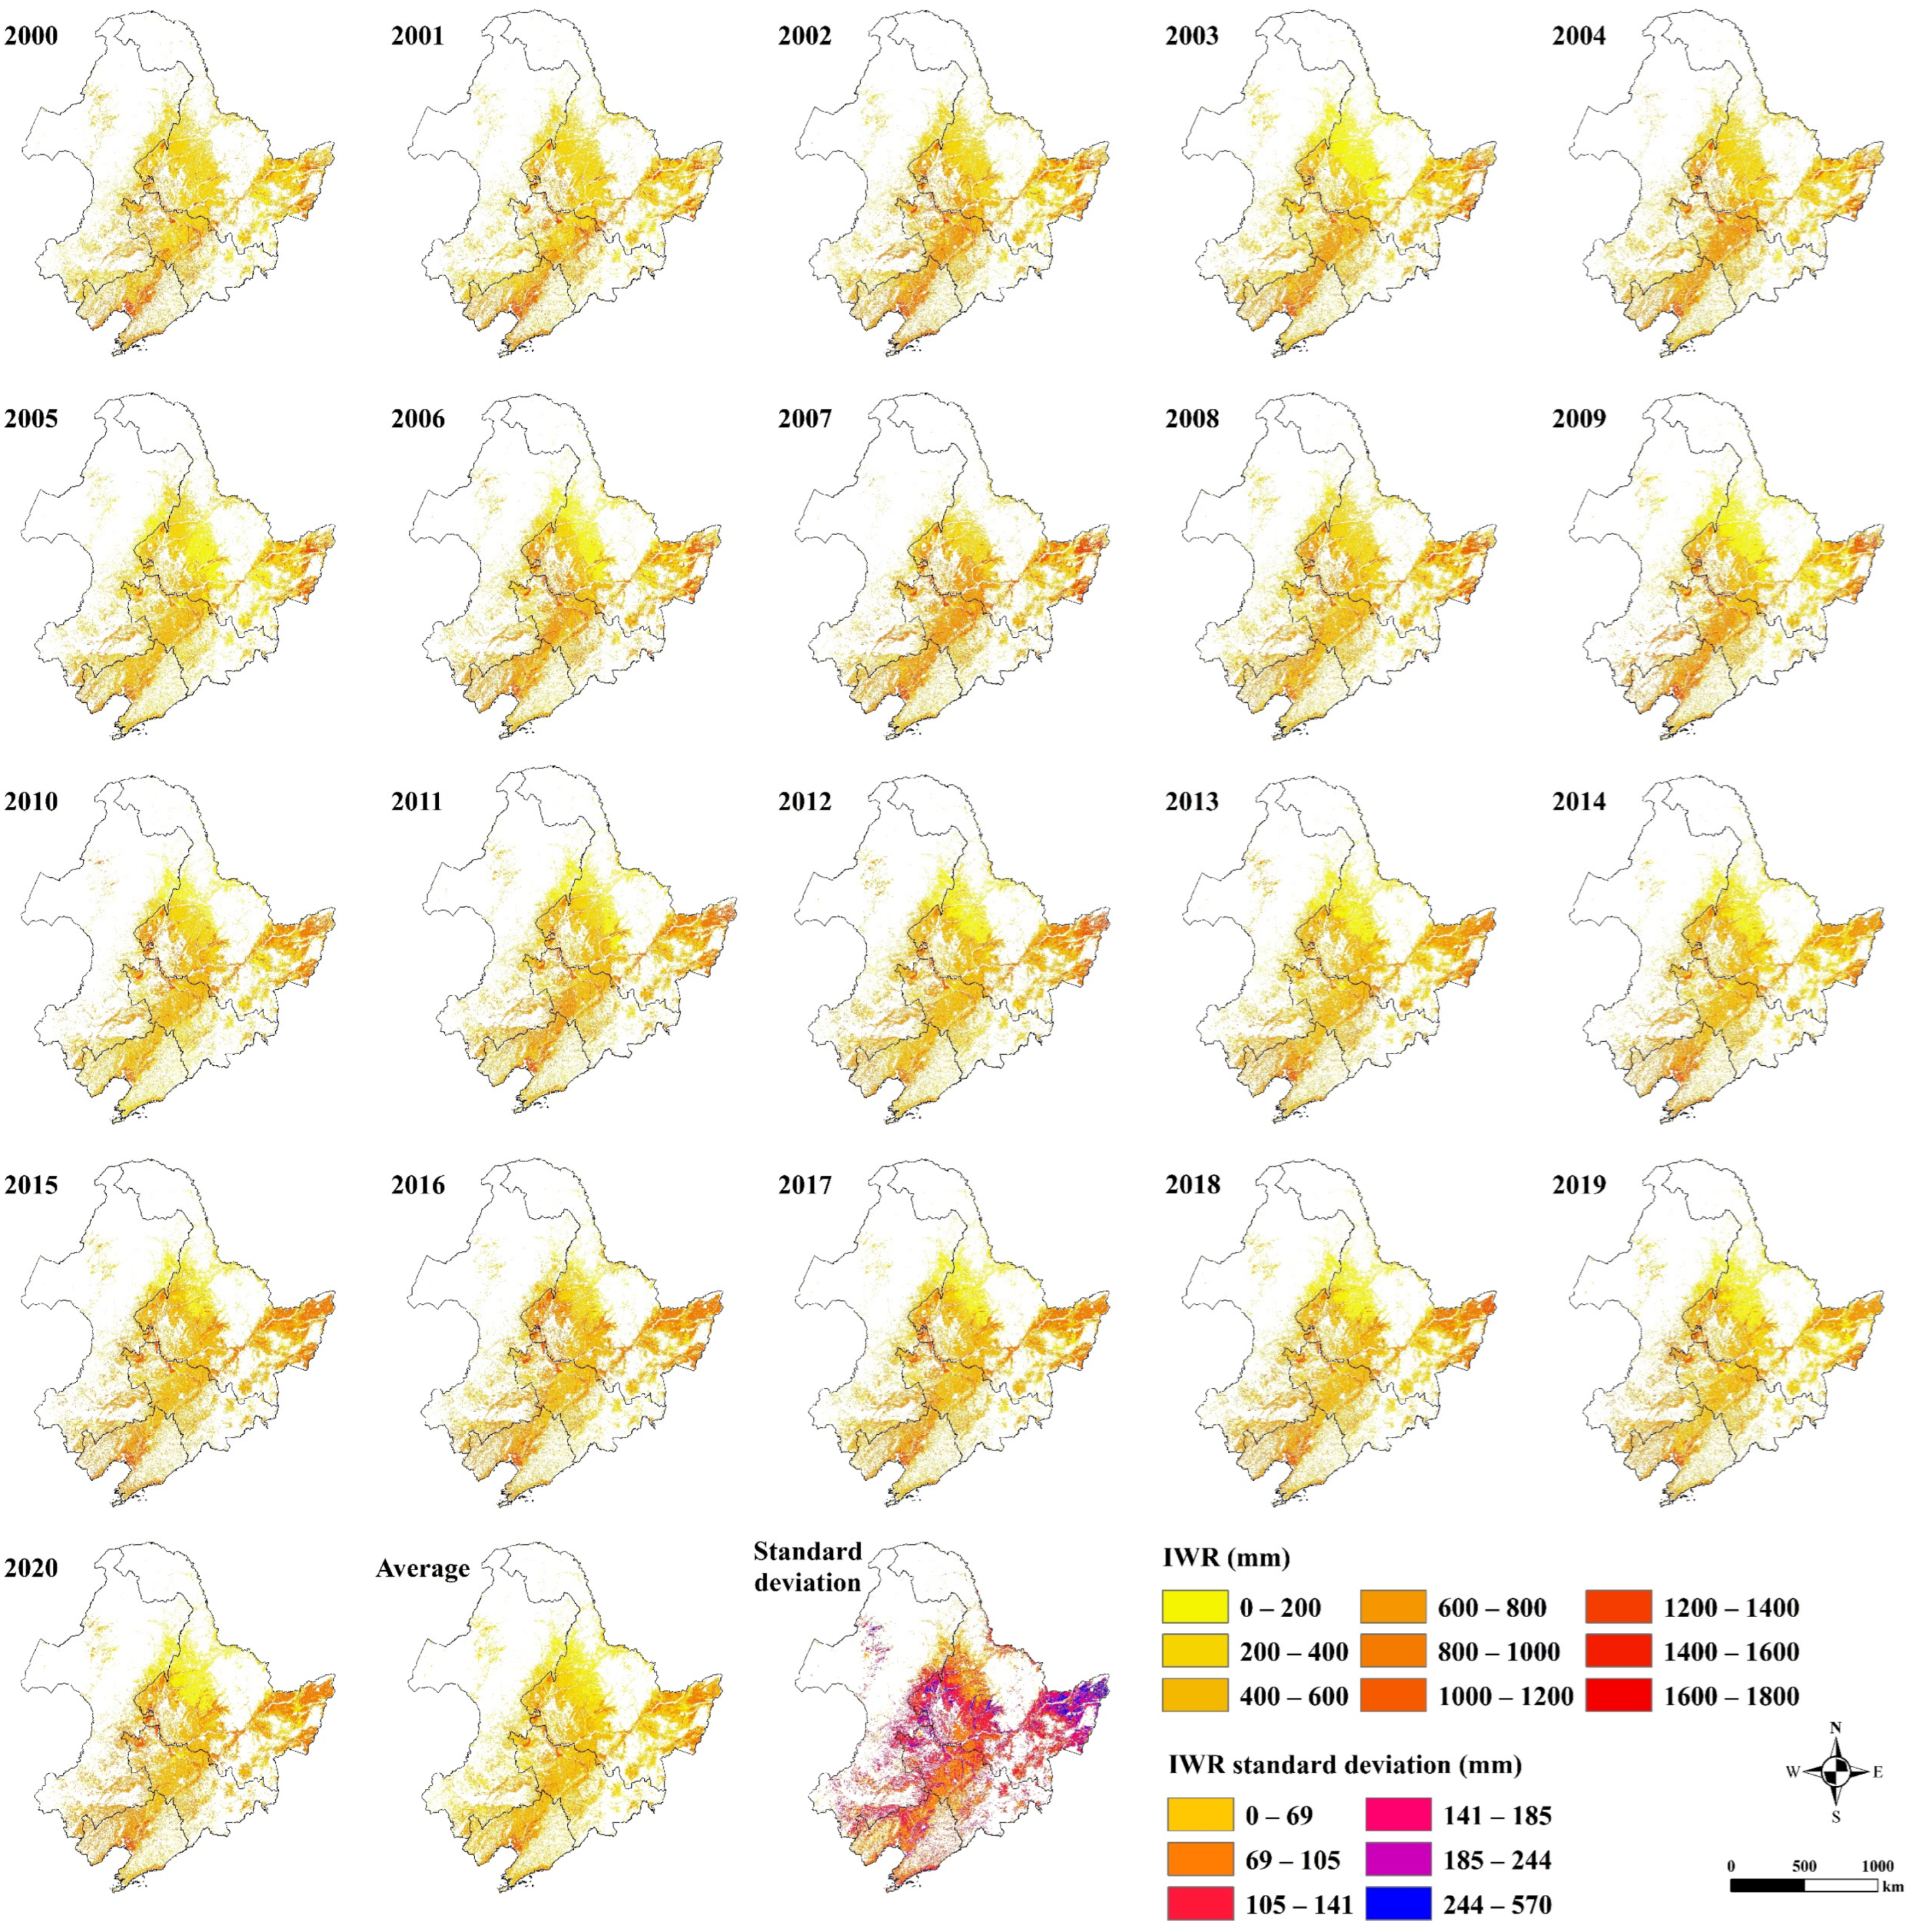
4.3. Annual Spatial Distribution and Temporal Changes in IWR
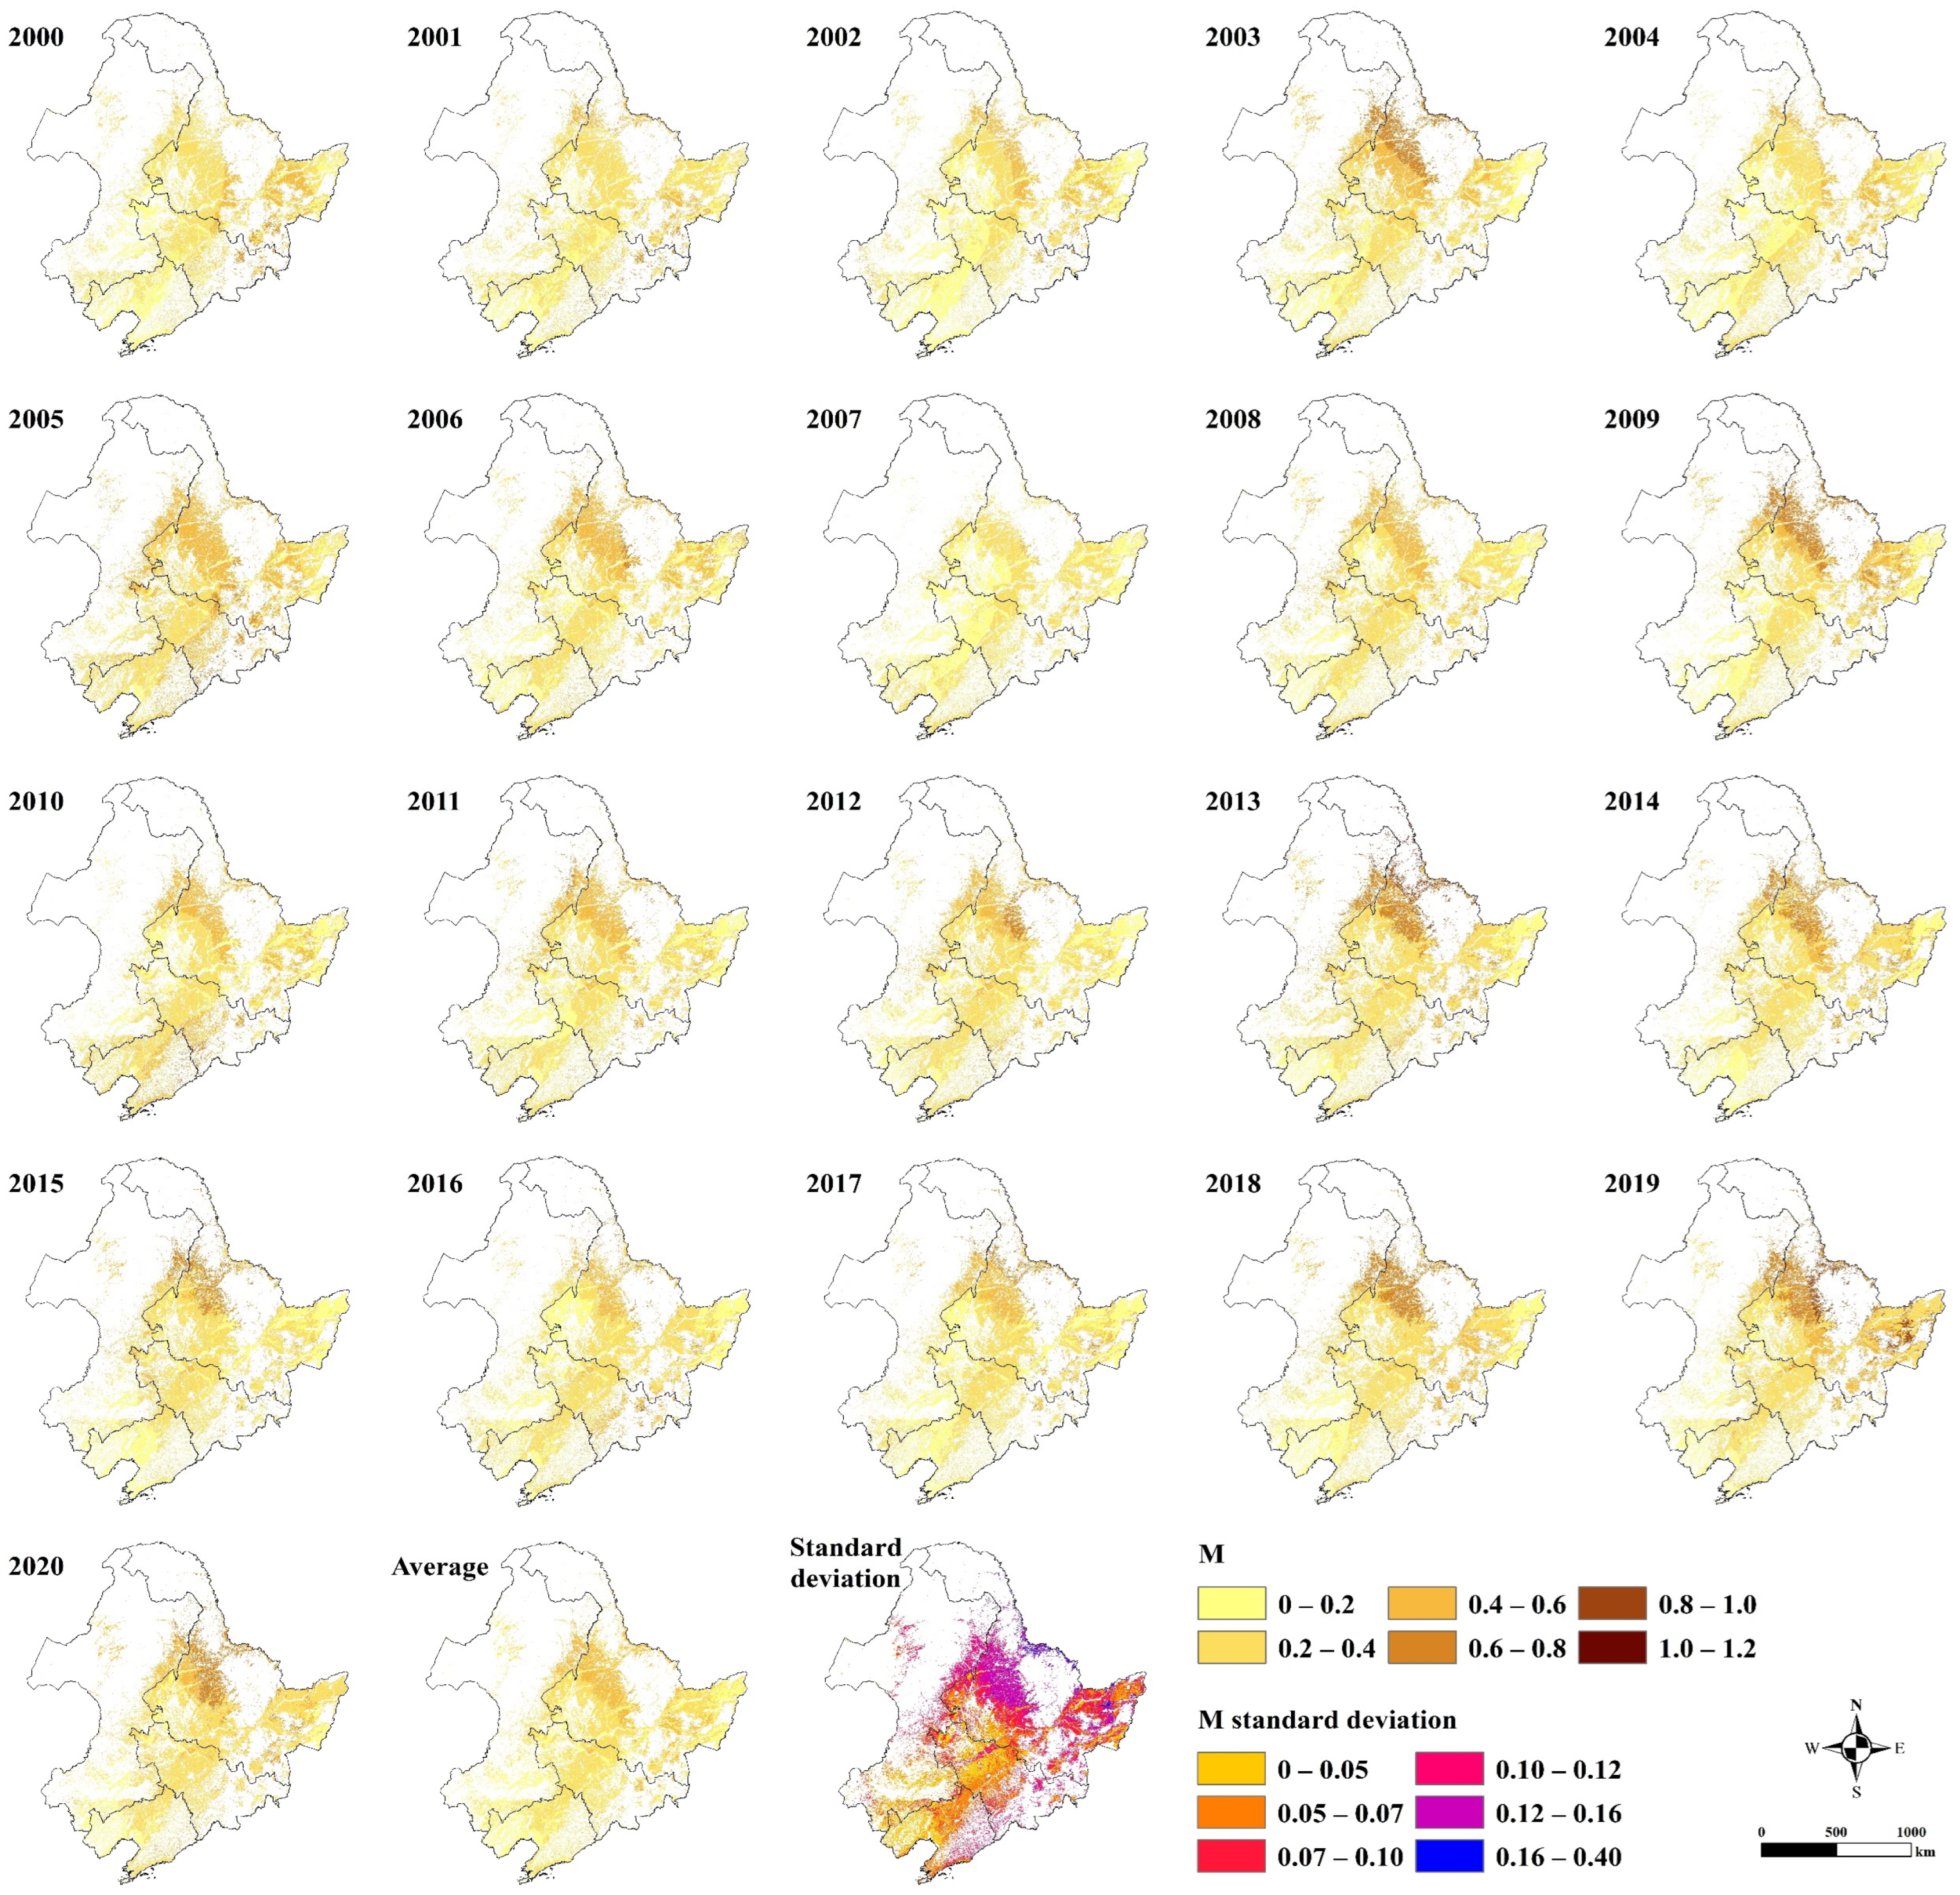
4.4. Annual Spatial Distribution and Temporal Changes in M
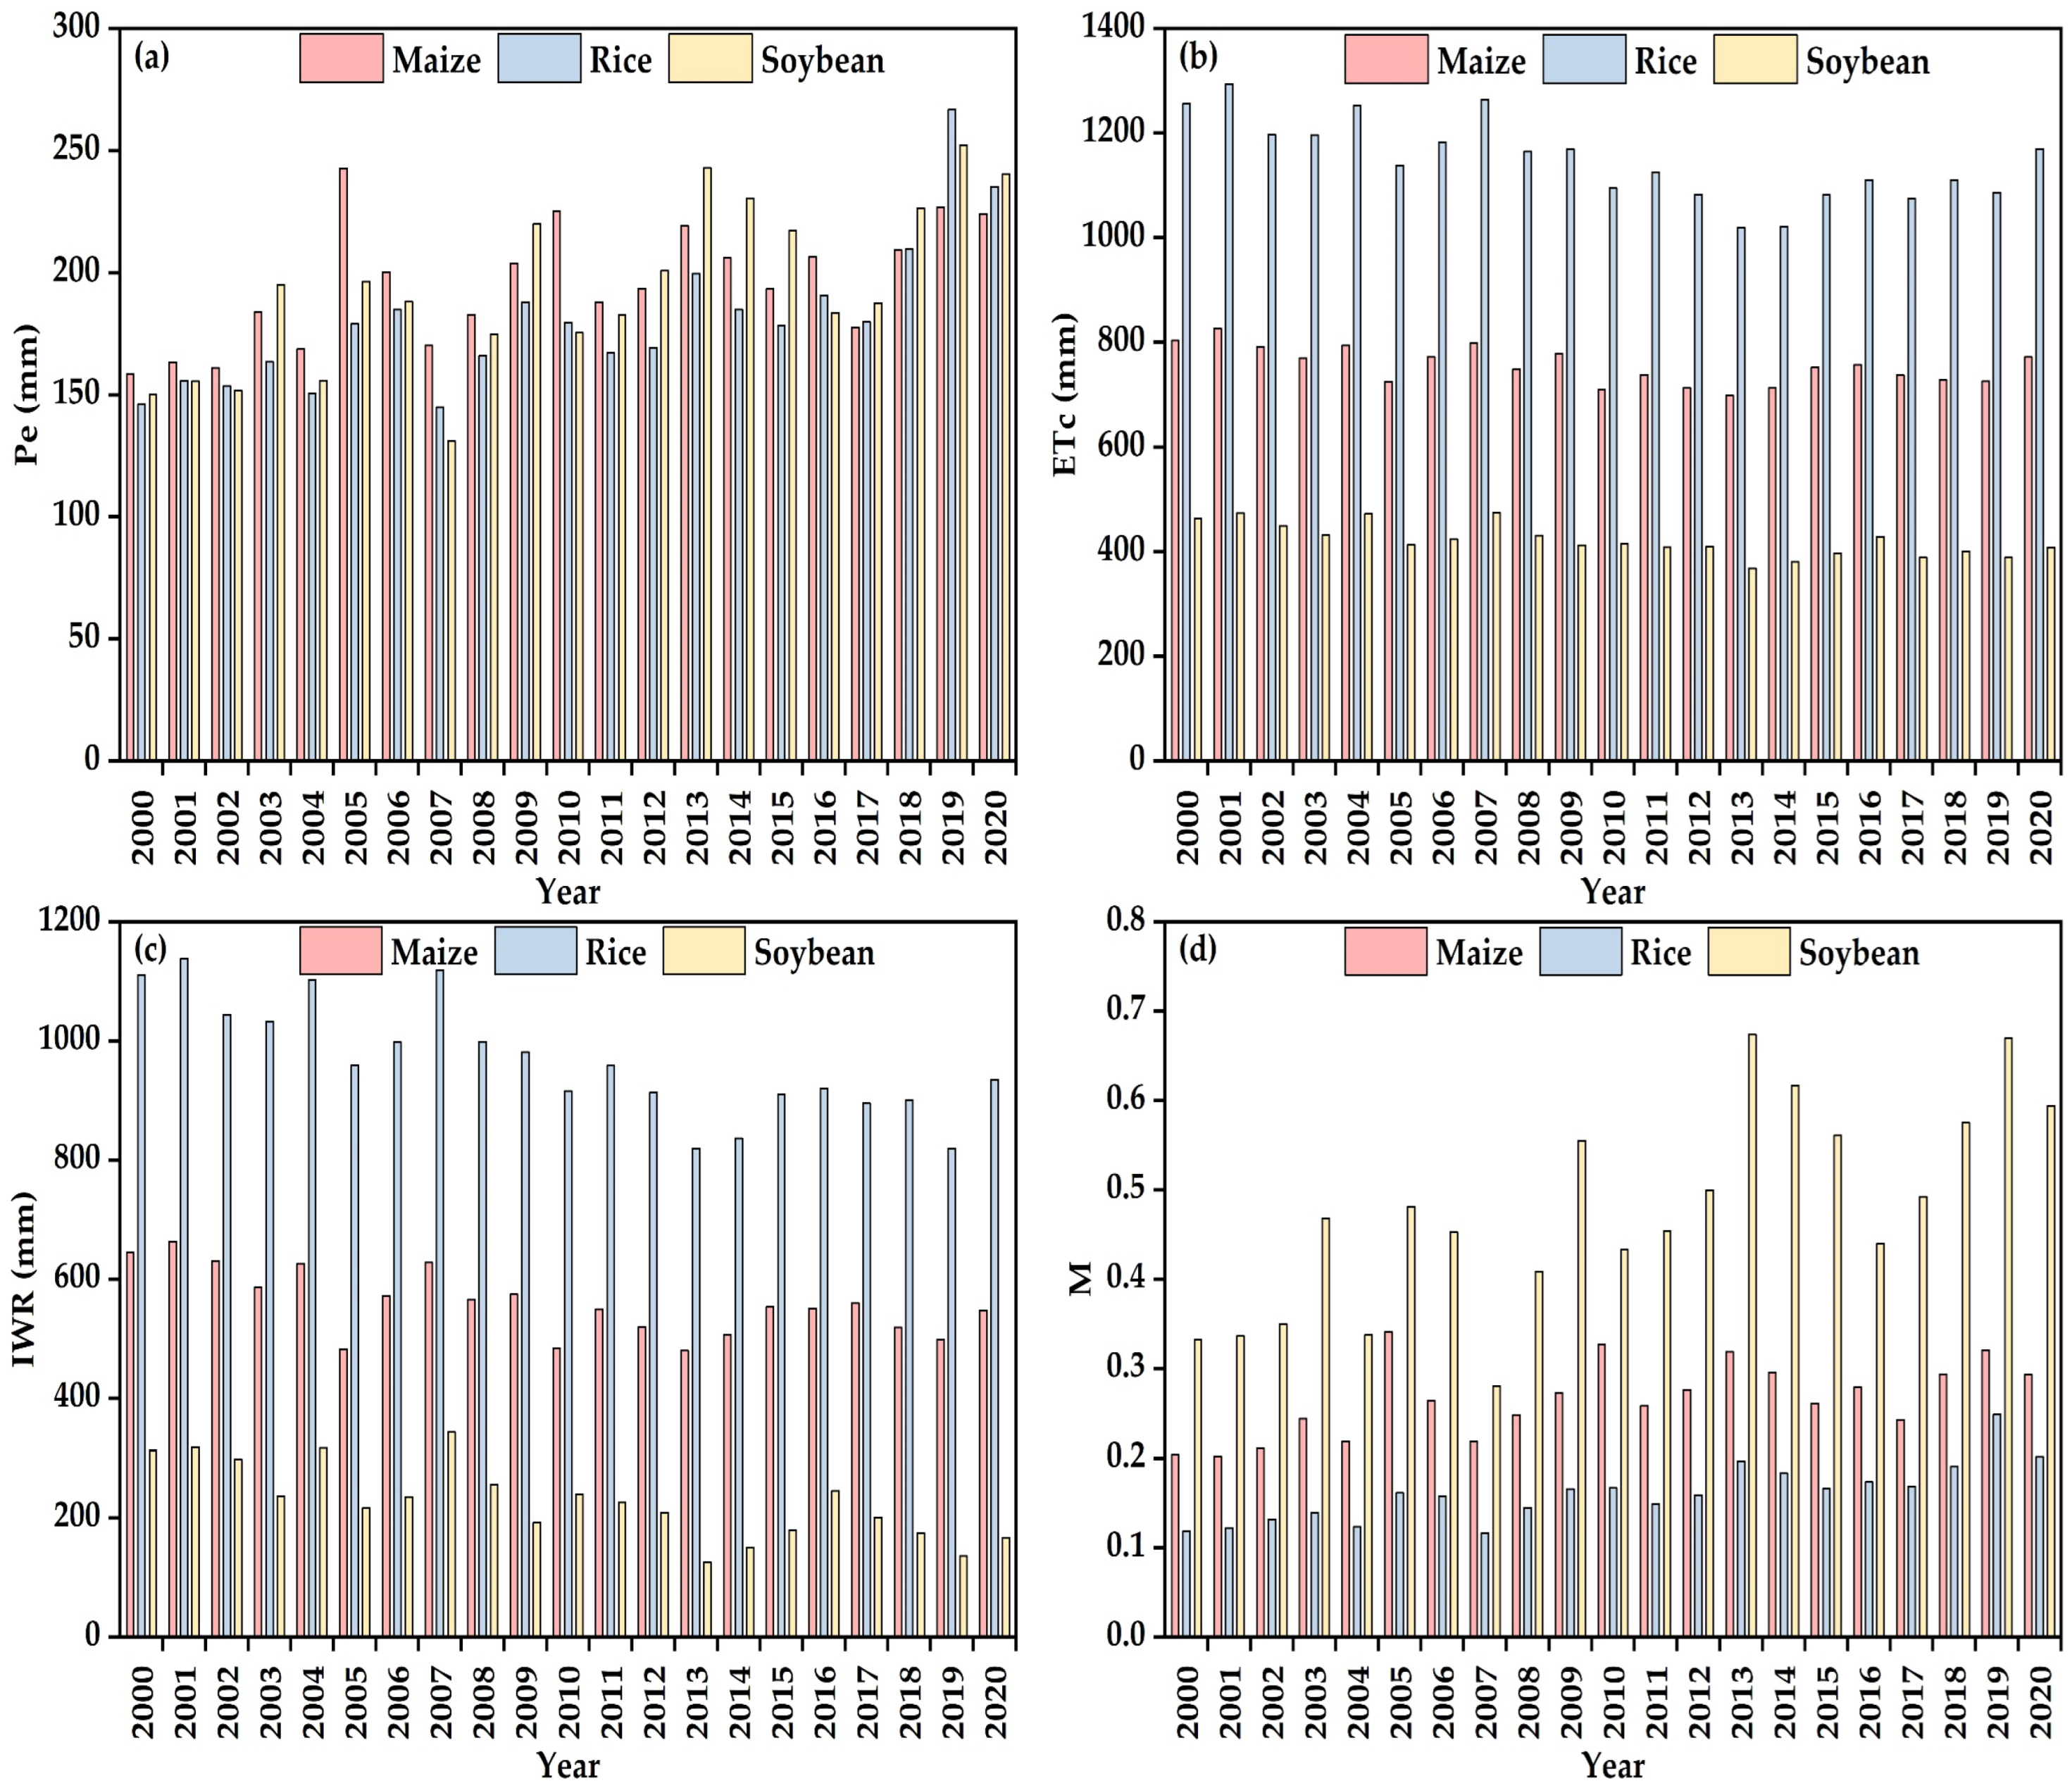
4.5. Impacts of Crop Type Change on IWR
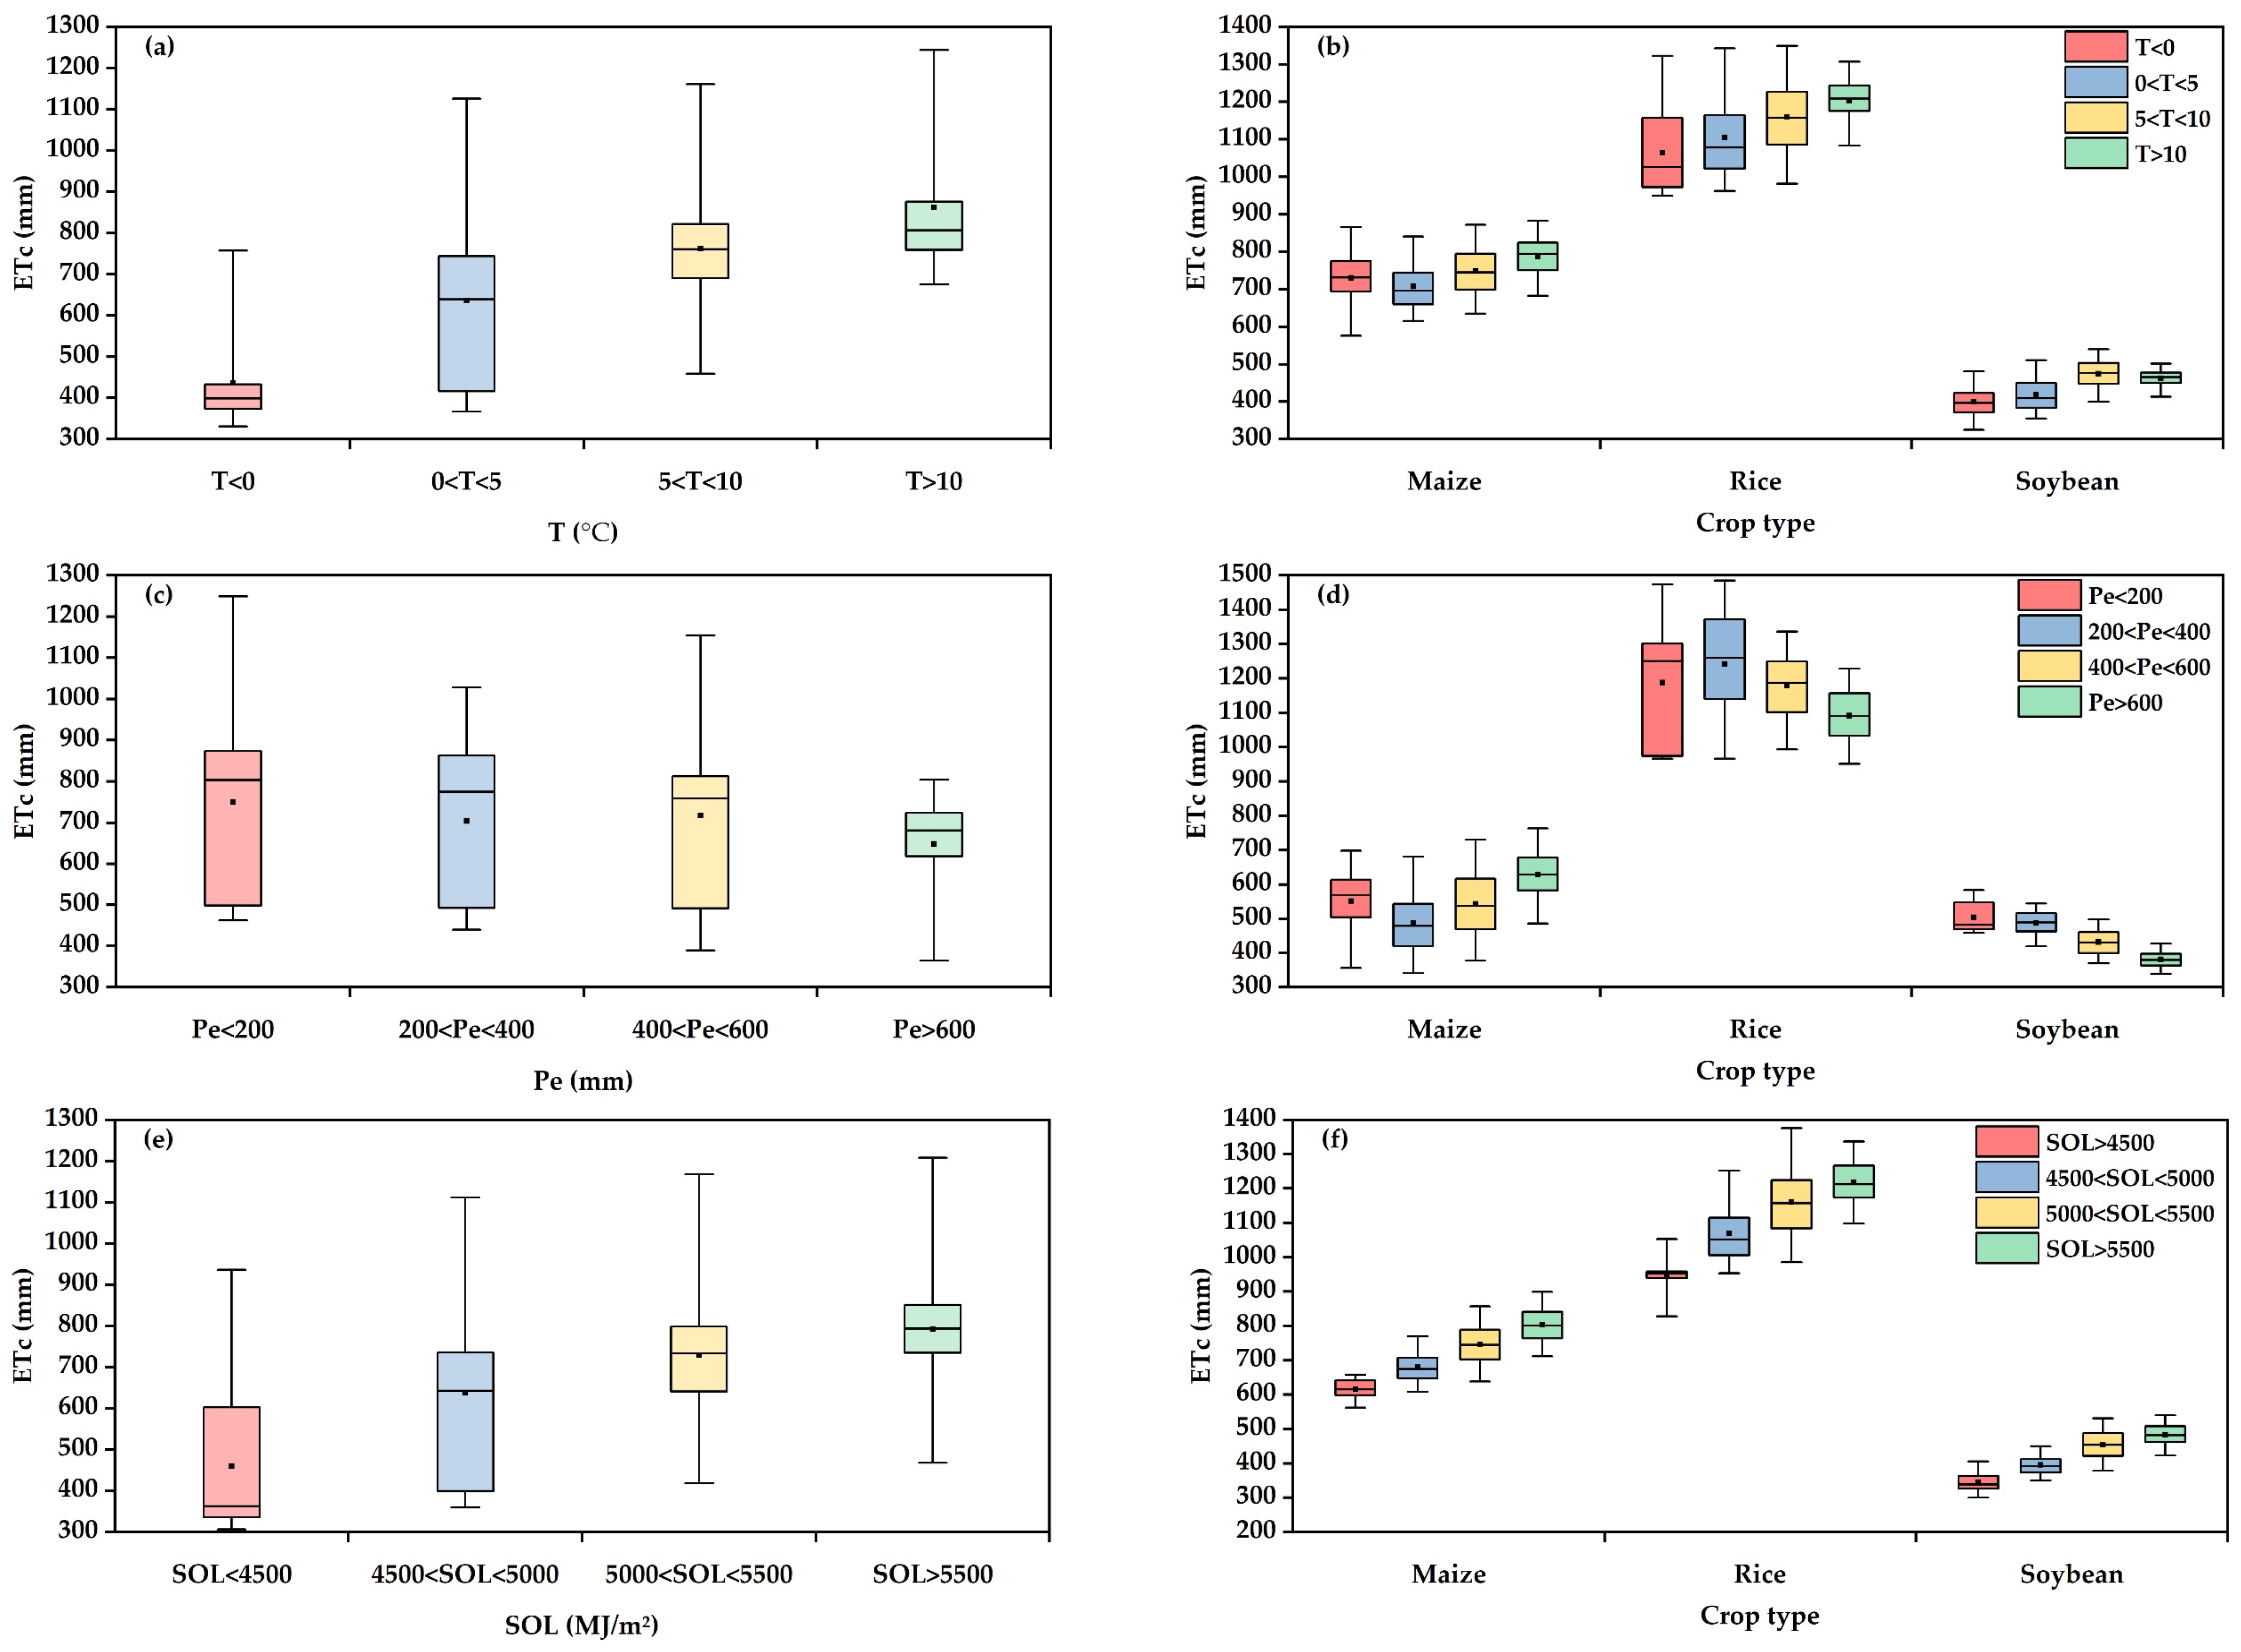
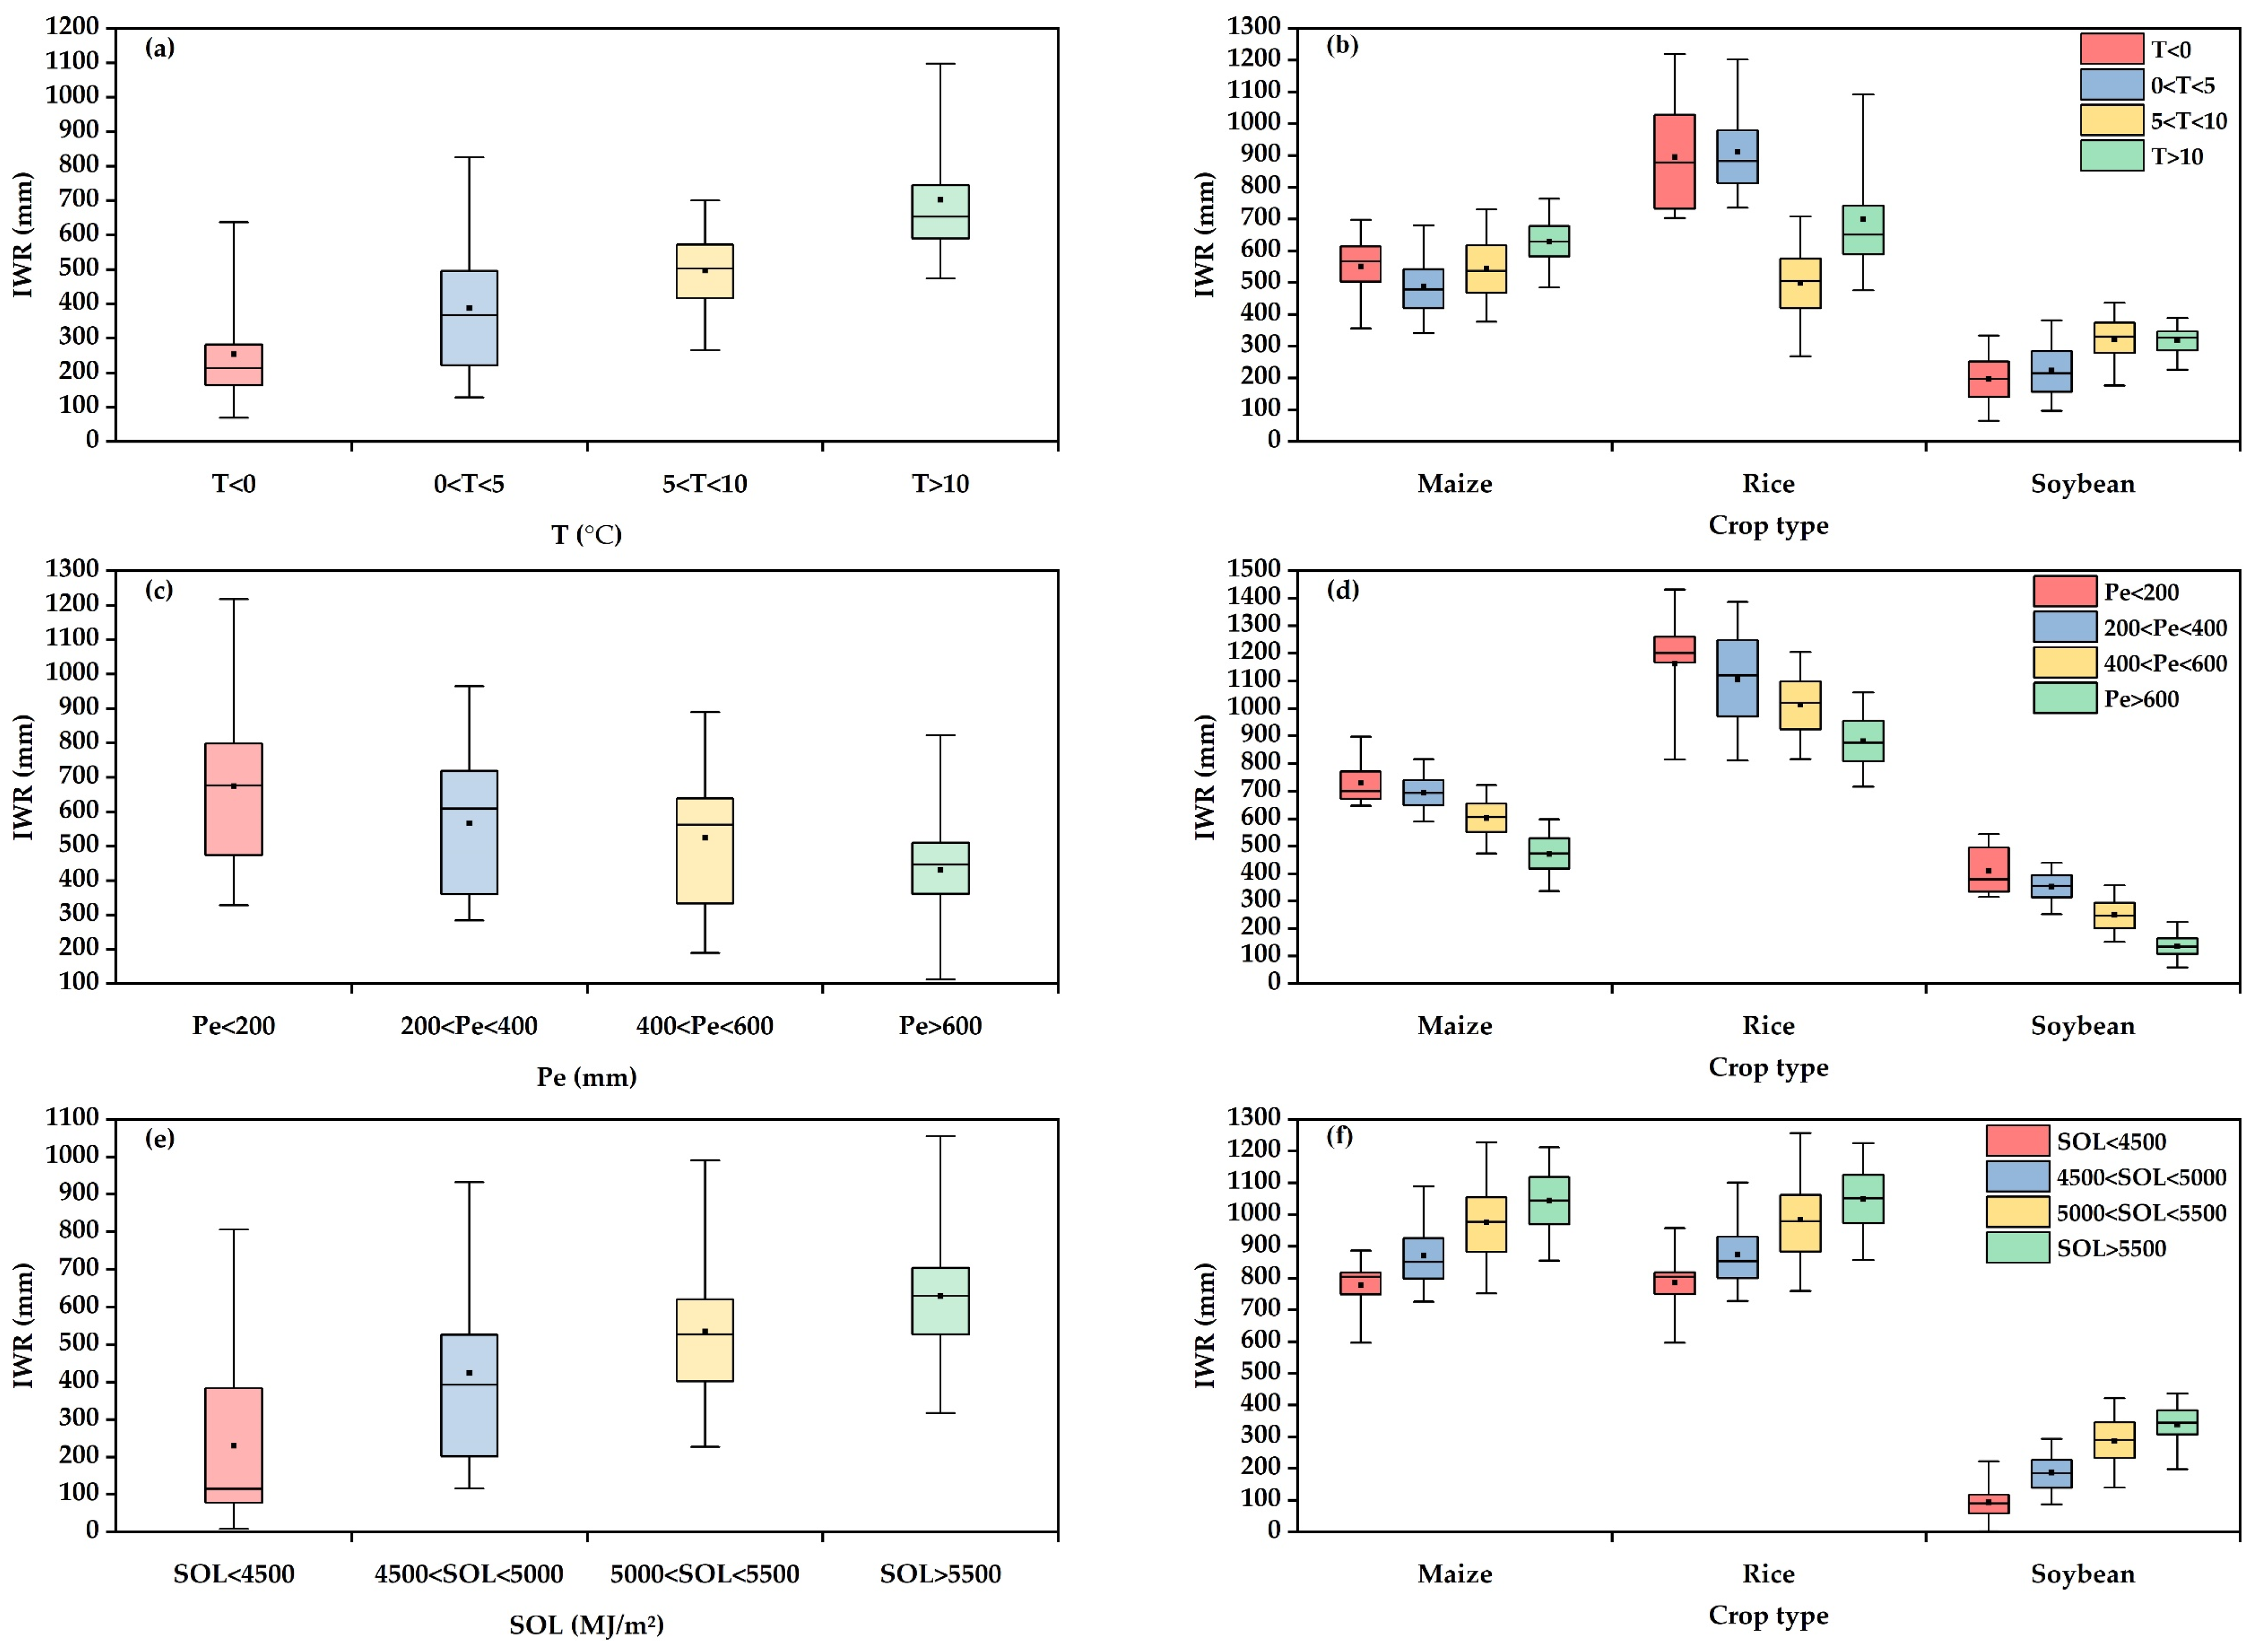
4.6. Climate Impacts on Spatial Heterogeneity of ETc and IWR
5. Discussion
5.1. Reasons for the Spatiotemporal Heterogeneity of IWR
5.2. Policy Recommendations and Practical Implications
5.3. Innovation, Deficiencies, and Prospects
6. Conclusions
Author Contributions
Funding
Data Availability Statement
Acknowledgments
Conflicts of Interest
References
- Field, C.B.; Michalak, A.M. Water, Climate, Energy, Food: Inseparable & Indispensable. Daedalus 2015, 144, 7–17. [Google Scholar] [CrossRef]
- Eliasson, J. The Rising Pressure of Global Water Shortages. Nature 2015, 517, 6. [Google Scholar] [CrossRef]
- Rosa, L.; Chiarelli, D.D.; Rulli, M.C.; Dell’Angelo, J.; D’Odorico, P. Global Agricultural Economic Water Scarcity. Sci. Adv. 2020, 6, eaaz6031. [Google Scholar] [CrossRef]
- Schultz, B.; Thatte, C.; Labhsetwar, V. Irrigation and Drainage. Main Contributors to Global Food Production. Irrig. Drain. 2005, 54, 263–278. [Google Scholar] [CrossRef]
- Calzadilla, A.; Rehdanz, K.; Betts, R.; Falloon, P.; Wiltshire, A.; Tol, R.S. Climate Change Impacts on Global Agriculture. Clim. Chang. 2013, 120, 357–374. [Google Scholar] [CrossRef]
- Guo, B.; Li, W.; Guo, J.; Chen, C. Risk Assessment of Regional Irrigation Water Demand and Supply in an Arid Inland River Basin of Northwestern China. Sustainability 2015, 7, 12958–12973. [Google Scholar] [CrossRef]
- Song, W.; Pijanowski, B.C.; Tayyebi, A. Urban Expansion and Its Consumption of High-Quality Farmland in Beijing, China. Ecol. Indic. 2015, 54, 60–70. [Google Scholar] [CrossRef]
- Caldera, U.; Breyer, C. Strengthening the Global Water Supply through a Decarbonised Global Desalination Sector and Improved Irrigation Systems. Energy 2020, 200, 117507. [Google Scholar] [CrossRef]
- Han, S.; Tian, F.; Gao, L. Current Status and Recent Trend of Irrigation Water Use in China. Irrig. Drain. 2020, 69, 25–35. [Google Scholar] [CrossRef]
- Calow, R.C.; Howarth, S.E.; Wang, J. Irrigation Development and Water Rights Reform in China. Int. J. Water Resour. Dev. 2009, 25, 227–248. [Google Scholar] [CrossRef]
- McLaughlin, D.; Kinzelbach, W. Food Security and Sustainable Resource Management. Water Resour. Res. 2015, 51, 4966–4985. [Google Scholar] [CrossRef]
- Li, H.; Du, X.; Lu, X.; Fang, M. Analysis of Groundwater Overexploitation Based on Groundwater Regime Information. Groundwater 2023, 61, 692–705. [Google Scholar] [CrossRef]
- Shen, H.; Leblanc, M.; Tweed, S.; Liu, W. Groundwater Depletion in the Hai River Basin, China, from in Situ and Grace Observations. Hydrol. Sci. J. 2015, 60, 671–687. [Google Scholar] [CrossRef]
- Howell, T.A. Enhancing Water Use Efficiency in Irrigated Agriculture. Agron. J. 2001, 93, 281–289. [Google Scholar] [CrossRef]
- Kadiresan, K.; Khanal, P.R. Rethinking Irrigation for Global Food Security. Irrig. Drain. 2018, 67, 8–11. [Google Scholar] [CrossRef]
- Li, X.; Jiang, W.; Duan, D. Spatio-Temporal Analysis of Irrigation Water Use Coefficients in China. J. Environ. Manag. 2020, 262, 110242. [Google Scholar] [CrossRef]
- Xiong, W.; Holman, I.; Lin, E.; Conway, D.; Jiang, J.; Xu, Y.; Li, Y. Climate Change, Water Availability and Future Cereal Production in China. Agric. Ecosyst. Environ. 2010, 135, 58–69. [Google Scholar] [CrossRef]
- Cai, X.; McKinney, D.C.; Rosegrant, M.W. Sustainability Analysis for Irrigation Water Management in the Aral Sea Region. Agric. Syst. 2003, 76, 1043–1066. [Google Scholar] [CrossRef]
- Sun, H.; Shen, Y.; Yu, Q.; Flerchinger, G.N.; Zhang, Y.; Liu, C.; Zhang, X. Effect of Precipitation Change on Water Balance and Wue of the Winter Wheat–Summer Maize Rotation in the North China Plain. Agric. Water Manag. 2010, 97, 1139–1145. [Google Scholar] [CrossRef]
- Bhat, O.A.; Lone, M.A.; Kumar, R. Determination of Water Requirement and Crop Coefficients for Green Gram in Temperate Region Using Lysimeter Water Balance. Int. J. Hydrol. Sci. Technol. 2021, 12, 1–15. [Google Scholar] [CrossRef]
- Kadam, S.; Gorantiwar, S.; Mandre, N.; Tale, D. Crop Coefficient for Potato Crop Evapotranspiration Estimation by Field Water Balance Method in Semi-Arid Region, Maharashtra, India. Potato. Res. 2021, 64, 421–433. [Google Scholar] [CrossRef]
- Ray, S.; Dadhwal, V. Estimation of Crop Evapotranspiration of Irrigation Command Area Using Remote Sensing and Gis. Agric. Water Manag. 2001, 49, 239–249. [Google Scholar] [CrossRef]
- Liu, Y.; Song, W.; Deng, X. Spatiotemporal Patterns of Crop Irrigation Water Requirements in the Heihe River Basin, China. Water 2017, 9, 616. [Google Scholar] [CrossRef]
- Mujere, N. Assessing Risks and Resilience to Hydro-Meteorological Disasters. In Disaster Risk Reduction for Resilience: Climate Change and Disaster Risk Adaptation; Springer International Publishing: Cham, Switzerland, 2023; pp. 143–159. [Google Scholar]
- Abedinpour, M.; Sarangi, A.; Rajput, T.; Singh, M.; Pathak, H.; Ahmad, T. Performance Evaluation of Aquacrop Model for Maize Crop in a Semi-Arid Environment. Agric. Water Manag. 2012, 110, 55–66. [Google Scholar] [CrossRef]
- Bocchiola, D. Impact of Potential Climate Change on Crop Yield and Water Footprint of Rice in the Po Valley of Italy. Agric. Syst. 2015, 139, 223–237. [Google Scholar] [CrossRef]
- Pasquel, D.; Roux, S.; Richetti, J.; Cammarano, D.; Tisseyre, B.; Taylor, J.A. A Review of Methods to Evaluate Crop Model Performance at Multiple and Changing Spatial Scales. Precis. Agric. 2022, 23, 1489–1513. [Google Scholar] [CrossRef]
- Zhou, K.; Wang, Y.; Chang, J.; Zhou, S.; Guo, A. Spatial and Temporal Evolution of Drought Characteristics across the Yellow River Basin. Ecol. Indic. 2021, 131, 108207. [Google Scholar] [CrossRef]
- Cobaner, M. Evapotranspiration Estimation by Two Different Neuro-Fuzzy Inference Systems. J. Hydrol. 2011, 398, 292–302. [Google Scholar] [CrossRef]
- Lang, D.; Zheng, J.; Shi, J.; Liao, F.; Ma, X.; Wang, W.; Chen, X.; Zhang, M. A Comparative Study of Potential Evapotranspiration Estimation by Eight Methods with Fao Penman–Monteith Method in Southwestern China. Water 2017, 9, 734. [Google Scholar] [CrossRef]
- Nana, E.; Corbari, C.; Bocchiola, D. A Model for Crop Yield and Water Footprint Assessment: Study of Maize in the Po Valley. Agric. Syst. 2014, 127, 139–149. [Google Scholar] [CrossRef]
- Solangi, G.S.; Shah, S.A.; Alharbi, R.S.; Panhwar, S.; Keerio, H.A.; Kim, T.-W.; Memon, J.A.; Bughio, A.D. Investigation of Irrigation Water Requirements for Major Crops Using Cropwat Model Based on Climate Data. Water 2022, 14, 2578. [Google Scholar] [CrossRef]
- Rossi, R.E.; Mulla, D.J.; Journel, A.G.; Franz, E.H. Geostatistical Tools for Modeling and Interpreting Ecological Spatial Dependence. Ecol. Monogr. 1992, 62, 277–314. [Google Scholar] [CrossRef]
- House-Peters, L.A.; Chang, H. Urban Water Demand Modeling: Review of Concepts, Methods, and Organizing Principles. Water Resour. Res. 2011, 47, W05401. [Google Scholar] [CrossRef]
- He, B.; Lü, A.; Wu, J.; Zhao, L.; Liu, M. Drought Hazard Assessment and Spatial Characteristics Analysis in China. J. Geogr. Sci. 2011, 21, 235–249. [Google Scholar] [CrossRef]
- Yu, X.; He, X.; Zheng, H.; Guo, R.; Ren, Z.; Zhang, D.; Lin, J. Spatial and Temporal Analysis of Drought Risk During the Crop-Growing Season over Northeast China. Nat. Hazards 2014, 71, 275–289. [Google Scholar] [CrossRef]
- Liu, Y.; Wang, J. Revealing Annual Crop Type Distribution and Spatiotemporal Changes in Northeast China Based on Google Earth Engine. Remote Sens. 2022, 14, 4056. [Google Scholar] [CrossRef]
- Zhang, L.; Chen, F.; Lei, Y. Climate Change and Shifts in Cropping Systems Together Exacerbate China’s Water Scarcity. Environ. Res. Lett. 2020, 15, 104060. [Google Scholar] [CrossRef]
- Huai, H.; Chen, X.; Huang, J.; Chen, F. Water-Scarcity Footprint Associated with Crop Expansion in Northeast China: A Case Study Based on Aquacrop Modeling. Water 2019, 12, 125. [Google Scholar] [CrossRef]
- Yang, X.; Jin, X.; Chu, Q.; Pacenka, S.; Steenhuis, T.S. Impact of Climate Variation from 1965 to 2016 on Cotton Water Requirements in North China Plain. Agric. Water Manag. 2021, 243, 106502. [Google Scholar] [CrossRef]
- Wang, J.; Xin, L.; Wang, X.; Jiang, M. The Impact of Climate Change and Grain Planting Structure Change on Irrigation Water Requirement for Main Grain Crops in Mainland China. Land 2022, 11, 2174. [Google Scholar] [CrossRef]
- Zhang, J.; Deng, M.; Han, Y.; Huang, H.; Yang, T. Spatiotemporal Variation of Irrigation Water Requirements for Grain Crops under Climate Change in Northwest China. Environ. Sci. Pollut. Res. 2023, 30, 45711–45724. [Google Scholar] [CrossRef]
- Xu, H.; Tian, Z.; He, X.; Wang, J.; Sun, L.; Fischer, G.; Fan, D.; Zhong, H.; Wu, W.; Pope, E. Future Increases in Irrigation Water Requirement Challenge the Water-Food Nexus in the Northeast Farming Region of China. Agric. Water Manag. 2019, 213, 594–604. [Google Scholar] [CrossRef]
- Lai, J.; Li, Y.; Chen, J.; Niu, G.-Y.; Lin, P.; Li, Q.; Wang, L.; Han, J.; Luo, Z.; Sun, Y. Massive Crop Expansion Threatens Agriculture and Water Sustainability in Northwestern China. Environ. Res. Lett. 2022, 17, 034003. [Google Scholar] [CrossRef]
- Luo, W.; Chen, M.; Kang, Y.; Li, W.; Li, D.; Cui, Y.; Khan, S.; Luo, Y. Analysis of Crop Water Requirements and Irrigation Demands for Rice: Implications for Increasing Effective Rainfall. Agric. Water Manag. 2022, 260, 107285. [Google Scholar] [CrossRef]
- Zhang, Q.; Sun, J.; Zhang, G.; Liu, X.; Wu, Y.; Sun, J.; Hu, B. Spatiotemporal Dynamics of Water Supply–Demand Patterns under Large-Scale Paddy Expansion: Implications for Regional Sustainable Water Resource Management. Agric. Water Manag. 2023, 285, 108388. [Google Scholar] [CrossRef]
- Chi, D.; Wang, H.; Li, X.; Liu, H.; Li, X. Estimation of the Ecological Water Requirement for Natural Vegetation in the Ergune River Basin in Northeastern China from 2001 to 2014. Ecol. Indic. 2018, 92, 141–150. [Google Scholar] [CrossRef]
- Wang, T.; Du, C.; Nie, T.; Sun, Z.; Zhu, S.; Feng, C.; Dai, C.; Chu, L.; Liu, Y.; Liang, Q. Spatiotemporal Analysis of Maize Water Requirement in the Heilongjiang Province of China During 1960–2015. Water 2020, 12, 2472. [Google Scholar] [CrossRef]
- Ren, Z.; Liu, X. Temporal and Spatial Trends of Spring Maize Irrigation Water Requirement in Northeast China in Recent 60 Years. In Proceedings of the Sixth Symposium of Risk Analysis and Risk Management in Western China (WRARM 2019), Kunming, China, 16–17 November 2019; pp. 28–32. [Google Scholar]
- Hutchinson, M.F.; Xu, T. Anusplin Version 4.2 User Guide; Centre for Resource and Environmental Studies, The Australian National University: Canberra, Australia, 2004; Volume 54. [Google Scholar]
- Döll, P.; Siebert, S. Global Modeling of Irrigation Water Requirements. Water Resour. Res. 2002, 38, 8-1–8-10. [Google Scholar] [CrossRef]
- Geng, Q.; Zhao, Y.; Sun, S.; He, X.; Wang, D.; Wu, D.; Tian, Z. Spatio-Temporal Changes and Its Driving Forces of Irrigation Water Requirements for Cotton in Xinjiang, China. Agric. Water Manag. 2023, 280, 108218. [Google Scholar] [CrossRef]
- Jia, K.; Yang, Y.; Dong, G.; Zhang, C.; Lang, T. Variation and Determining Factor of Winter Wheat Water Requirements under Climate Change. Agric. Water Manag. 2021, 254, 106967. [Google Scholar] [CrossRef]
- Allen, R.G.; Pereira, L.S.; Raes, D.; Smith, M. Crop Evapotranspiration-Guidelines for Computing Crop Water Requirements-Fao Irrigation and Drainage Paper 56; Food and Agriculture Organization: Rome, Italy, 1998; Volume 300, p. D05109. [Google Scholar]
- Ren, X.L.; Li, H.L.; Zhang, Y.H.; Pu, X.; Zhang, L.L. Water Requirement Characteristics and Influencing Factors of Main Crops in the Sanjiang Plain from 2000 to 2015. Arid Land Geogr. 2019, 42, 854–866. (In Chinese) [Google Scholar] [CrossRef]
- Smith, M. Cropwat: A Computer Program for Irrigation Planning and Management; Food & Agriculture Organization: Rome, Italy, 1992. [Google Scholar]
- Cates, A.M.; Ruark, M.D.; Hedtcke, J.L.; Posner, J.L. Long-Term Tillage, Rotation and Perennialization Effects on Particulate and Aggregate Soil Organic Matter. Soil. Tillage Res. 2016, 155, 371–380. [Google Scholar] [CrossRef]
- Hu, X.; Chen, M.; Liu, D.; Li, D.; Jin, L.; Liu, S.; Cui, Y.; Dong, B.; Khan, S.; Luo, Y. Reference Evapotranspiration Change in Heilongjiang Province, China from 1951 to 2018: The Role of Climate Change and Rice Area Expansion. Agric. Water Manag. 2021, 253, 106912. [Google Scholar] [CrossRef]
- Singh, K.; Sidhpuria, M.; Jhorar, R.; Kumar, A.; Singh, J.; Mehla, M.K. Energy Utilization for Ground Water Pumping under Declining Water Table Scenario: A Review. Int. J. Econ. Plants 2021, 8, 136–142. [Google Scholar] [CrossRef]
- Tang, Q.; Hua, L.; Cao, Y.; Jiang, L.; Cai, C. Human Activities Are the Key Driver of Water Erosion Changes in Northeastern China. Land. Degrad. Dev. 2024, 35, 62–75. [Google Scholar] [CrossRef]
- Yang, L.; Yang, Y.; Feng, Z.; Zheng, Y. Effect of Maize Sowing Area Changes on Agricultural Water Consumption from 2000 to 2010 in the West Liaohe Plain, China. J. Integr. Agric. 2016, 15, 1407–1416. [Google Scholar] [CrossRef]
- Thomas, A. Agricultural Irrigation Demand under Present and Future Climate Scenarios in China. Glob. Planet. Chang. 2008, 60, 306–326. [Google Scholar] [CrossRef]
- Yosef, B.A.; Asmamaw, D.K. Rainwater Harvesting: An Option for Dry Land Agriculture in Arid and Semi-Arid Ethiopia. Int. J. Water Resour. Environ. Eng. 2015, 7, 17–28. [Google Scholar] [CrossRef]
- Cascone, S.; Coma, J.; Gagliano, A.; Pérez, G. The Evapotranspiration Process in Green Roofs: A Review. Build. Environ. 2019, 147, 337–355. [Google Scholar] [CrossRef]
- Mo, X.; Chen, X.; Hu, S.; Liu, S.; Xia, J. Attributing Regional Trends of Evapotranspiration and Gross Primary Productivity with Remote Sensing: A Case Study in the North China Plain. Hydrol. Earth. Syst. Sci. 2017, 21, 295–310. [Google Scholar] [CrossRef]
- Boonwichai, S.; Shrestha, S.; Babel, M.S.; Weesakul, S.; Datta, A. Climate Change Impacts on Irrigation Water Requirement, Crop Water Productivity and Rice Yield in the Songkhram River Basin, Thailand. J. Clean. Prod. 2018, 198, 1157–1164. [Google Scholar] [CrossRef]
- Hongyun, H.; Liange, Z. Chinese Agricultural Water Resource Utilization: Problems and Challenges. Water Policy 2007, 9, 11–28. [Google Scholar] [CrossRef]
- Ju, Q.; Du, L.; Liu, C.; Jiang, S. Water Resource Management for Irrigated Agriculture in China: Problems and Prospects. Irrig. Drain. 2023, 72, 854–863. [Google Scholar] [CrossRef]
- Li, M.; Cao, X.; Liu, D.; Fu, Q.; Li, T.; Shang, R. Sustainable Management of Agricultural Water and Land Resources under Changing Climate and Socio-Economic Conditions: A Multi-Dimensional Optimization Approach. Agric. Water Manag. 2022, 259, 107235. [Google Scholar] [CrossRef]
- Wang, S.; Wei, Y. Water Resource System Risk and Adaptive Management of the Chinese Heihe River Basin in Asian Arid Areas. Mitig. Adapt. Strateg. Glob. Chang. 2019, 24, 1271–1292. [Google Scholar] [CrossRef]
- Zhang, L.; Cong, Z.; Zhang, D.; Li, Q. Response of Vegetation Dynamics to Climatic Variables across a Precipitation Gradient in the Northeast China Transect. Hydrol. Sci. J. 2017, 62, 1517–1531. [Google Scholar] [CrossRef]
- Liu, J.; Sun, B.; Shen, H.; Ding, P.; Ning, D.; Zhang, J.; Qiu, X. Crop Water Requirement and Utilization Efficiency-Based Planting Structure Optimization in the Southern Huang-Huai-Hai Plain. Agronomy 2022, 12, 2219. [Google Scholar] [CrossRef]
- Ren, D.; Yang, Y.; Yang, Y.; Richards, K.; Zhou, X. Land-Water-Food Nexus and Indications of Crop Adjustment for Water Shortage Solution. Sci.Total Environ. 2018, 626, 11–21. [Google Scholar] [CrossRef]
- Yang, G.; Li, S.; Wang, H.; Wang, L. Study on Agricultural Cultivation Development Layout Based on the Matching Characteristic of Water and Land Resources in North China Plain. Agric. Water Manag. 2022, 259, 107272. [Google Scholar] [CrossRef]
- Liu, Z.; Yang, X.; Lin, X.; Gowda, P.; Lv, S.; Wang, J. Climate Zones Determine Where Substantial Increases of Maize Yields Can Be Attained in Northeast China. Clim. Chang. 2018, 149, 473–487. [Google Scholar] [CrossRef]
- Deng, X.-P.; Shan, L.; Zhang, H.; Turner, N.C. Improving Agricultural Water Use Efficiency in Arid and Semiarid Areas of China. Agric. Water Manag. 2006, 80, 23–40. [Google Scholar] [CrossRef]
- Yang, X.; Pu, Y.; Weng, S.; Hou, M.; Wang, Z. Review of Agricultural Water-Saving Policies and Measures in Recent Years–a Case Study of Jiangsu Province, China. Water Supply 2022, 22, 3951–3967. [Google Scholar] [CrossRef]
- Zhang, W.; Sheng, J.; Li, Z.; Weindorf, D.C.; Hu, G.; Xuan, J.; Zhao, H. Integrating Rainwater Harvesting and Drip Irrigation for Water Use Efficiency Improvements in Apple Orchards of Northwest China. Sci. Hortic. 2021, 275, 109728. [Google Scholar] [CrossRef]
- Lei, H.; Qiao, S.; Pan, H.; Shang, C. Temporal and Spatial Distribution of Agricultural Irrigation Water Requirement and Irrigation Requirement Index in Guizhou Province. Trans. CSAE 2016, 32, 115–121. [Google Scholar] [CrossRef]
- Nie, T.; Liang, Q.; Wang, T.; Chu, L.; Chen, X.; Li, F. Water Requirement and Supply and Irrigation Schedule Formulation for Maize in the Western Region of Heilongjiang Province. South-North Water Transf. Water Sci. Technol. 2021, 19, 960–971. [Google Scholar] [CrossRef]
- Xu, C.; Lu, C.; Sun, Q. Impact of Climate Change on Irrigation Water Requirement of Wheat Growth—A Case Study of the Beijing-Tianjin-Hebei Region in China. Urban Clim. 2021, 39, 100971. [Google Scholar] [CrossRef]


| Method Type | Advantages | Disadvantages | References |
|---|---|---|---|
| Field observation | Obtain more accurate agricultural water data at a finer temporal resolution (e.g., second, minute, hour) | Time-consuming, labor-intensive, and expensive to conduct large-area experiments | [29,30] |
| Non-spatial crop model | Simulate agricultural water use for different crops at different growth periods at the point scale | Difficult to reveal fine-resolution spatial characteristics | [31,32] |
| Spatial crop model | Simulate spatiotemporal distribution of agricultural water use at a finer raster scale | Currently lacking a long-term annual crop-type-specific study | [33,34] |
| Month | Area | Climate Factors | |||||||
|---|---|---|---|---|---|---|---|---|---|
| Maximum Temperature (°C) | Minimum Temperature (°C) | Average Temperature (°C) | Precipitation (mm) | Wind Speed (m/s) | Relative Humidity (%) | Atmospheric Pressure (Pa) | Sunshine Hours (h) | ||
| January | Heilongjiang | −13.57 | −25.45 | −20.09 | 4.99 | 2.19 | 69.18 | 993.87 | 171.25 |
| Jilin | −7.97 | −20.06 | −14.60 | 6.96 | 2.01 | 64.94 | 976.46 | 177.41 | |
| Liaoning | −2.03 | −11.46 | −7.21 | 5.40 | 2.76 | 56.12 | 1017.76 | 196.40 | |
| Inner Mongolia | −12.16 | −23.81 | −18.70 | 2.41 | 2.40 | 58.97 | 966.54 | 196.40 | |
| February | Heilongjiang | −8.33 | −22.08 | −15.63 | 5.05 | 2.44 | 64.36 | 991.40 | 198.53 |
| Jilin | −3.11 | −15.88 | −9.85 | 12.05 | 2.35 | 58.18 | 974.38 | 188.84 | |
| Liaoning | 1.52 | −7.86 | −3.54 | 10.49 | 2.92 | 54.25 | 1015.39 | 193.63 | |
| Inner Mongolia | −7.02 | −20.51 | −14.42 | 2.60 | 2.63 | 54.90 | 964.08 | 218.92 | |
| March | Heilongjiang | 1.32 | −11.54 | −5.16 | 11.19 | 2.95 | 59.31 | 986.48 | 244.55 |
| Jilin | 4.88 | −7.14 | −1.39 | 18.75 | 2.79 | 58.96 | 969.96 | 221.71 | |
| Liaoning | 8.22 | −1.34 | 3.10 | 13.76 | 3.28 | 53.03 | 1010.21 | 242.42 | |
| Inner Mongolia | 2.50 | −11.40 | −4.70 | 5.60 | 3.08 | 50.25 | 959.89 | 270.01 | |
| April | Heilongjiang | 12.00 | −0.83 | 5.58 | 23.52 | 3.25 | 52.18 | 982.10 | 232.49 |
| Jilin | 14.34 | 1.32 | 7.64 | 36.21 | 2.99 | 49.89 | 966.06 | 216.37 | |
| Liaoning | 15.93 | 5.92 | 10.67 | 41.13 | 3.48 | 53.01 | 1004.48 | 242.30 | |
| Inner Mongolia | 13.17 | −0.85 | 6.16 | 14.59 | 3.44 | 41.43 | 955.45 | 265.33 | |
| May | Heilongjiang | 20.26 | 7.04 | 13.72 | 54.52 | 3.08 | 56.55 | 978.81 | 243.01 |
| Jilin | 21.80 | 8.56 | 14.96 | 69.68 | 2.79 | 56.98 | 963.02 | 236.58 | |
| Liaoning | 22.50 | 12.46 | 17.22 | 62.06 | 3.11 | 59.44 | 1000.48 | 266.99 | |
| Inner Mongolia | 21.51 | 7.07 | 14.44 | 33.51 | 3.29 | 43.77 | 951.83 | 275.39 | |
| June | Heilongjiang | 25.62 | 13.50 | 19.49 | 92.08 | 2.51 | 67.75 | 977.81 | 243.81 |
| Jilin | 25.85 | 14.23 | 19.66 | 95.09 | 2.24 | 68.18 | 961.38 | 221.58 | |
| Liaoning | 26.10 | 17.48 | 21.47 | 86.03 | 2.67 | 71.68 | 997.34 | 225.16 | |
| Inner Mongolia | 26.75 | 13.45 | 20.16 | 69.11 | 2.58 | 56.46 | 950.63 | 267.59 | |
| July | Heilongjiang | 27.27 | 17.02 | 21.92 | 138.76 | 2.27 | 77.46 | 977.12 | 229.42 |
| Jilin | 27.81 | 18.11 | 22.51 | 156.72 | 2.02 | 76.61 | 960.83 | 206.85 | |
| Liaoning | 28.43 | 21.18 | 24.48 | 142.83 | 2.52 | 78.98 | 996.18 | 200.08 | |
| Inner Mongolia | 28.49 | 16.78 | 22.46 | 98.14 | 2.34 | 66.67 | 949.94 | 263.09 | |
| August | Heilongjiang | 25.62 | 15.14 | 20.00 | 114.65 | 2.15 | 78.95 | 980.47 | 224.13 |
| Jilin | 26.97 | 16.95 | 21.38 | 148.62 | 1.84 | 78.20 | 963.81 | 210.89 | |
| Liaoning | 28.54 | 20.79 | 24.29 | 179.12 | 2.36 | 79.00 | 999.05 | 218.12 | |
| Inner Mongolia | 26.65 | 14.52 | 20.25 | 77.26 | 2.24 | 67.81 | 953.60 | 259.81 | |
| September | Heilongjiang | 20.45 | 7.75 | 13.66 | 57.72 | 2.36 | 71.27 | 985.42 | 224.84 |
| Jilin | 22.35 | 9.74 | 15.37 | 59.36 | 1.90 | 72.20 | 969.31 | 217.58 | |
| Liaoning | 24.86 | 15.16 | 19.61 | 51.74 | 2.42 | 70.77 | 1005.64 | 233.24 | |
| Inner Mongolia | 21.28 | 7.16 | 13.74 | 33.42 | 2.43 | 60.30 | 958.43 | 247.49 | |
| October | Heilongjiang | 10.73 | −1.31 | 4.31 | 23.80 | 2.67 | 62.39 | 988.54 | 197.94 |
| Jilin | 14.26 | 1.33 | 7.19 | 35.80 | 2.25 | 62.29 | 972.87 | 205.35 | |
| Liaoning | 17.53 | 7.45 | 12.14 | 42.84 | 2.74 | 73.14 | 1011.76 | 215.01 | |
| Inner Mongolia | 11.54 | −1.83 | 4.28 | 13.93 | 2.67 | 53.80 | 961.80 | 229.27 | |
| November | Heilongjiang | −2.43 | −13.07 | −8.15 | 13.10 | 2.53 | 66.35 | 990.89 | 162.43 |
| Jilin | 2.78 | −7.73 | −2.91 | 26.15 | 2.26 | 64.93 | 974.56 | 160.53 | |
| Liaoning | 8.02 | −0.92 | 3.21 | 26.25 | 2.97 | 60.20 | 1014.22 | 177.53 | |
| Inner Mongolia | −1.26 | −12.91 | −7.69 | 6.57 | 2.53 | 58.96 | 963.53 | 185.90 | |
| December | Heilongjiang | −12.53 | −23.06 | −18.23 | 8.08 | 2.49 | 69.96 | 992.83 | 151.10 |
| Jilin | −6.37 | −17.24 | −12.24 | 11.22 | 2.12 | 66.11 | 975.93 | 178.28 | |
| Liaoning | 0.02 | −8.78 | 4.74 | 9.65 | 2.81 | 58.34 | 1017.14 | 178.28 | |
| Inner Mongolia | −10.82 | −21.55 | −16.76 | 3.93 | 2.44 | 61.56 | 965.56 | 174.75 | |
| Growth Period and Kc | Maize | Rice | Soybean |
|---|---|---|---|
| Sowing Date | 27 April | 15 May | 30 April |
| End Date | 20 September | 25 September | 25 September |
| Growth Period (d) | 147 | 134 | 149 |
| Kc ini | 0.49 | 1.15 | 0.32 |
| Kc mid | 1.06 | 1.25 | 0.73 |
| Kc end | 0.58 | 1.05 | 0.32 |
| Crop Type | Pe | ETc | IWR | M | ||||
|---|---|---|---|---|---|---|---|---|
| Slope (mm/a) | Slope% (%/a) | Slope (mm/a) | Slope% (%/a) | Slope (mm/a) | Slope% (%/a) | Slope (/a) | Slope% (%/a) | |
| Maize | 2.24 | 1.15 | −3.50 | −0.46 | −5.77 | −1.03 | 0.004 | 1.48 |
| Rice | 3.69 | 2.04 | −9.09 | −0.79 | −12.73 | −1.32 | 0.004 | 2.67 |
| Soybean | 4.04 | 2.09 | −3.76 | −0.89 | −7.80 | −3.42 | 0.01 | 2.87 |
| Crop Type | Area | Pe (mm) | ETc (mm) | IWR (mm) | M | ||||
|---|---|---|---|---|---|---|---|---|---|
| Average | Standard Deviation | Average | Standard Deviation | Average | Standard Deviation | Average | Standard Deviation | ||
| Maize | Heilongjiang | 207.25 | 28.56 | 729.70 | 226.83 | 522.76 | 254.99 | 0.29 | 0.099 |
| Jinlin | 207.28 | 40.08 | 749.82 | 169.89 | 542.07 | 276.45 | 0.28 | 0.102 | |
| Liaoning | 180.56 | 17.98 | 773.22 | 149.37 | 591.57 | 251.38 | 0.24 | 0.062 | |
| Inner Mongolia | 155.72 | 25.56 | 825.91 | 262.58 | 669.69 | 149.16 | 0.19 | 0.069 | |
| Rice | Heilongjiang | 182.47 | 56.57 | 1142.03 | 255.98 | 960.23 | 183.28 | 0.164 | 0.085 |
| Jinlin | 184.10 | 50.36 | 1166.39 | 283.61 | 981.91 | 139.70 | 0.162 | 0.077 | |
| Liaoning | 161.72 | 41.96 | 1178.45 | 250.53 | 1015.12 | 129.48 | 0.14 | 0.068 | |
| Inner Mongolia | 151.55 | 39.45 | 1249.20 | 158.41 | 1097.31 | 226.28 | 0.12 | 0.043 | |
| Soybean | Heilongjiang | 206.79 | 12.83 | 404.78 | 55.22 | 198.02 | 60.07 | 0.53 | 0.06 |
| Jinlin | 174.92 | 37.40 | 450.86 | 49.97 | 275.94 | 77.11 | 0.40 | 0.12 | |
| Liaoning | 165.45 | 10.81 | 455.04 | 34.04 | 289.59 | 33.82 | 0.37 | 0.03 | |
| Inner Mongolia | 174.08 | 19.72 | 443.34 | 57.28 | 266.43 | 70.10 | 0.41 | 0.08 | |
| Crop Type | Cultivation Area (106 ha) | IWR per Unit Area (102 m3/ha) | Total IWR (109 m3) | ||||||
|---|---|---|---|---|---|---|---|---|---|
| 2000 | 2020 | Change | 2000 | 2020 | Change | 2000 | 2020 | Change | |
| Maize | 10.76 | 22.72 | 11.96 | 64.51 | 54.81 | −9.69 | 69.40 | 124.55 | 55.15 |
| Rice | 2.71 | 6.73 | 4.02 | 111.07 | 93.47 | −17.60 | 30.07 | 62.90 | 32.83 |
| Soybean | 21.46 | 7.71 | −13.75 | 31.36 | 16.77 | −14.59 | 67.31 | 12.92 | −54.39 |
| Conversion Type | Converted Area (106 ha) | Contribution Value (109 m3) | Contribution Rate (%) |
|---|---|---|---|
| Maize to Rice | 1.69 | 4.78 | 7.60 |
| Maize to Soybean | 0.91 | −3.58 | −5.69 |
| Rice to Maize | 0.42 | −2.83 | −4.50 |
| Rice to Soybean | 0.06 | −0.56 | −0.89 |
| Soybean to Maize | 8.70 | 17.57 | 27.93 |
| Soybean to Rice | 1.39 | 9.33 | 14.84 |
| Total | 13.16 | 24.71 | 39.28 |
| Conversion Type | Converted Area (106 ha) | Contribution Value (109 m3) | Contribution Rate (%) |
|---|---|---|---|
| Maize to Rice | 1.11 | 4.85 | 13.53 |
| Maize to Soybean | 0.72 | −2.01 | −5.60 |
| Rice to Maize | 0.69 | −2.36 | −6.58 |
| Rice to Soybean | 0.08 | −0.57 | −1.59 |
| Soybean to Maize | 4.16 | 11.45 | 31.92 |
| Soybean to Rice | 0.50 | 3.43 | 9.57 |
| Total | 7.27 | 14.80 | 41.25 |
Disclaimer/Publisher’s Note: The statements, opinions and data contained in all publications are solely those of the individual author(s) and contributor(s) and not of MDPI and/or the editor(s). MDPI and/or the editor(s) disclaim responsibility for any injury to people or property resulting from any ideas, methods, instructions or products referred to in the content. |
© 2024 by the authors. Licensee MDPI, Basel, Switzerland. This article is an open access article distributed under the terms and conditions of the Creative Commons Attribution (CC BY) license (https://creativecommons.org/licenses/by/4.0/).
Share and Cite
Xiao, X.; Zhang, J.; Liu, Y. Impacts of Crop Type and Climate Changes on Agricultural Water Dynamics in Northeast China from 2000 to 2020. Remote Sens. 2024, 16, 1007. https://doi.org/10.3390/rs16061007
Xiao X, Zhang J, Liu Y. Impacts of Crop Type and Climate Changes on Agricultural Water Dynamics in Northeast China from 2000 to 2020. Remote Sensing. 2024; 16(6):1007. https://doi.org/10.3390/rs16061007
Chicago/Turabian StyleXiao, Xingyuan, Jing Zhang, and Yaqun Liu. 2024. "Impacts of Crop Type and Climate Changes on Agricultural Water Dynamics in Northeast China from 2000 to 2020" Remote Sensing 16, no. 6: 1007. https://doi.org/10.3390/rs16061007