Article

Temporal and Spatial Variation Analysis of Groundwater Stocks in Xinjiang Based on GRACE Data

1
Xinjiang Institute of Ecology and Geography, Chinese Academy of Sciences, Urumqi 830011, China
2
University of Chinese Academy of Sciences, Beijing 100049, China
3
Xinjiang Key Laboratory of RS & GIS Application, Urumqi 830011, China
4
Research Center for Ecology and Environment of Central Asia, Chinese Academy of Sciences, Urumqi 830011, China
*
Author to whom correspondence should be addressed.
Remote Sens. 2024, 16(5), 813; https://doi.org/10.3390/rs16050813
Submission received: 26 January 2024 / Revised: 14 February 2024 / Accepted: 23 February 2024 / Published: 26 February 2024

Abstract

:
Situated in China’s arid and semi-arid zones, the Xinjiang region heavily relies on groundwater for its freshwater supply. This study utilizes data from the Gravity Recovery and Climate Experiment (GRACE) satellite mission, covering the years 2003 to 2021, to quantitatively evaluate the temporal and spatial changes in groundwater storage anomalies (GWSA) in the Xinjiang region. Furthermore, we incorporate the HydroSHEDS dataset to examine the spatial variations in groundwater storage anomalies across watersheds of varying scales. Based on our findings, the GWSA decreased during the study period at a mean rate of −0.381 mm/month, marked by a consistent trend and notable interannual variability. In addition, significant regional disparities are observed; while groundwater storage in the southeastern watersheds is on an upward trend, a general decline is noted in the northern and central regions. The most pronounced depletion is detected in the northwest, especially in the Ili River basin and along the western slopes of the Tianshan Mountains. These changes are intricately linked to anthropogenic factors, including population growth and escalating water demands. In response, the study advocates for the development and enforcement of more rigorous and scientifically informed groundwater management strategies to promote sustainable water use in Xinjiang.

Graphical Abstract

1. Introduction

Groundwater resources, an integral part of the world’s freshwater reserves, play an essential role not only in the home water supply, agricultural irrigation and industrial production but also provide fundamental support for the ecological balance of rivers, lakes, and wetlands [1,2]. Regrettably, the ongoing depletion of global groundwater reserves has triggered a number of intricate hydrological and ecological consequences [3,4]. These comprise, among other things, sea level rise, land subsidence, and an impairment in the efficiency of industrial and agricultural production [5,6]. Research indicates that between 1960 and 2000, the annual global groundwater depletion rate escalated from 126 ± 32 cubic kilometers to 283 ± 40 cubic kilometers [7]. It is particularly noteworthy that, as a major developing country, China is experiencing a pronounced pressure on its groundwater consumption [8,9]. China is among the world’s most populous nations, with a rapidly growing economy and a huge demand for natural resources [10]. Groundwater plays a significant role in China’s water resource system, particularly in the country’s northern dry and semi-arid regions where it provides essential water for sustaining agricultural output and societal subsistence [11,12]. Because it is an arid and semi-arid region in northwestern China, the groundwater situation in the Xinjiang region is particularly critical; groundwater resources in Xinjiang have become a lifeline, sustaining local livelihoods and agricultural demands, and are irreplaceable in ensuring regional ecological balance, agricultural stability, and sustained economic development [13,14]. Given the special climatic conditions of the region and the scarcity of water resources, managing groundwater resources efficiently and protecting them is essential to attaining sustainable regional development. However, recent studies reveal that, under the dual impact of climate change and unregulated extraction, especially driven by agricultural irrigation needs and urbanization, Xinjiang’s groundwater reserves are undergoing unprecedented challenges [15,16]. This trend not only poses a serious threat to the ecosystems and livelihoods of the people living in the arid regions of Xinjiang but may also lead to more serious ecological imbalances [17,18]. Against this background, this study aims to answer two key questions through an in-depth study of groundwater storage (GWS) in the Xinjiang region: first, what are the patterns of spatial and temporal changes in groundwater storage in Xinjiang? Second, which socio-ecological factors are the main drivers of these changes? This research will provide a scientific basis for the precise management and effective protection of groundwater resources in the Xinjiang region and help to address the challenges posed by groundwater resource depletion.
To accurately monitor and estimate the evolution of groundwater storage, numerous explorations have been undertaken by researchers across generations. Scholars within the academic domain have developed land surface hydrological models that capitalize on the equilibrium of moisture and energy exchanges between the terrestrial surface and the atmosphere [19]. However, the performance of these models is often limited by the uncertainty of physical parameters, the influence of meteorological forcing factors (especially precipitation conditions), and inherent limitations in the models’ structure [20]. On the other hand, considering the complex terrain and limited observational data, it is hard to precisely capture the dynamics of groundwater storage solely on field observations, particularly in the arid regions of northwest China [21]. With the successful launch of the Gravity Recovery and Climate Experiment (GRACE) satellite in 2002, its capacity to observe changes in the Earth’s gravitational field has made it a powerful tool for identifying shifts in glaciers, groundwater, and other bodies of water [22,23,24]. The uniqueness of the GRACE satellite lies in its real-time, wide-area, and continuous monitoring capabilities, providing a unique perspective on groundwater storage anomalies (GWSA) and demonstrating its extensive application value in global and regional hydrological cycle monitoring [7]. The GRACE satellite mission concluded successfully in 2017, and its responsibilities seamlessly transitioned to the GRACE Follow-On (GRACE-FO) satellite, launched in 2018 [25]. GRACE-FO maintains the high precision characteristics of its predecessor, continuing to play a pivotal role in the study of global hydrological cycles and climate change. Researchers have employed GRACE satellite data to conduct in-depth analyses of changes in China’s groundwater storage. For instance, in 2017, Yin et al. quantified the GWS dynamics between 2003 and 2012 in six basins in Northern China, finding an average GWS decline rate of about 0.17 cm/year, with five basins showing a downward trend [26]. In 2018, Feng et al. analyzed the spatial and temporal evolution of groundwater storage in the North China Plain, Liao-he River Basin, and Tarim Basin of China by combining the GRACE groundwater storage inversion results with groundwater hydrological modeling and measured groundwater monitoring well data [27]. However, studies on groundwater storage anomaly changes have often been limited to single, simplistic basin-scale analyses, and a systematic understanding of multi-basin groundwater dynamics remains weak.
Employing a cross-scale, tiered-basin approach for spatial insight into GWSA changes has proven to be forward-looking and insightful. By meticulously segmenting basins, this method captures subtle spatial differences in GWSA at various levels, thereby revealing the unique dynamics of water resources across different scales [28]. In this context, the HydroSHEDS global watershed dataset, introduced by the World Wildlife Fund (WWF), has provided indispensable data resources for such research [29]. This dataset characterizes multi-scale features of multi-tiered watersheds using a unified standard and finely divides sub-basins through the Pfafstetter topological coding system, demonstrating its broad applicability in multi-faceted analyses of geographical phenomena [30]. It has been widely used in analyzing various geographic phenomena across multiple basin levels. In 2019, Lin et al. quantified variations in groundwater in China’s Yellow River Basin and carried out a spatiotemporal analysis to quantify the changes in groundwater storage at multiple scales [31,32]. In 2023, Zhao et al. conducted an analysis of the multi-scale characteristics of GWS trends across China, encompassing national, as well as second-, third-, and fifth-level basins. This study revealed hotspots characterized by rapidly decreasing groundwater storage [33].
This study aims to precisely elucidate and thoroughly explore the spatiotemporal variability in groundwater storage in the Xinjiang region. To attain this objective, we initially estimated the groundwater storage anomaly in the Xinjiang region, utilizing data from GRACE satellite observations and the GLDAS model. Subsequently, we conducted a time series analysis of GWSA data in this region and spatial variation in the annual average GWSA data. Furthermore, utilizing the multitier HydroSHEDS watershed dataset, we calculated the average change rate of GWSA in different level (third to sixth) basins in Xinjiang from 2003 to 2021, clearly displaying the features of groundwater storage variations’ spatial distribution at each basin scale. Finally, for areas with significant reductions in groundwater storage, we investigated the driving forces of various socio-ecological factors on the sharp decline in groundwater storage anomalies and explored the potential mechanisms behind the decrease in groundwater storage.

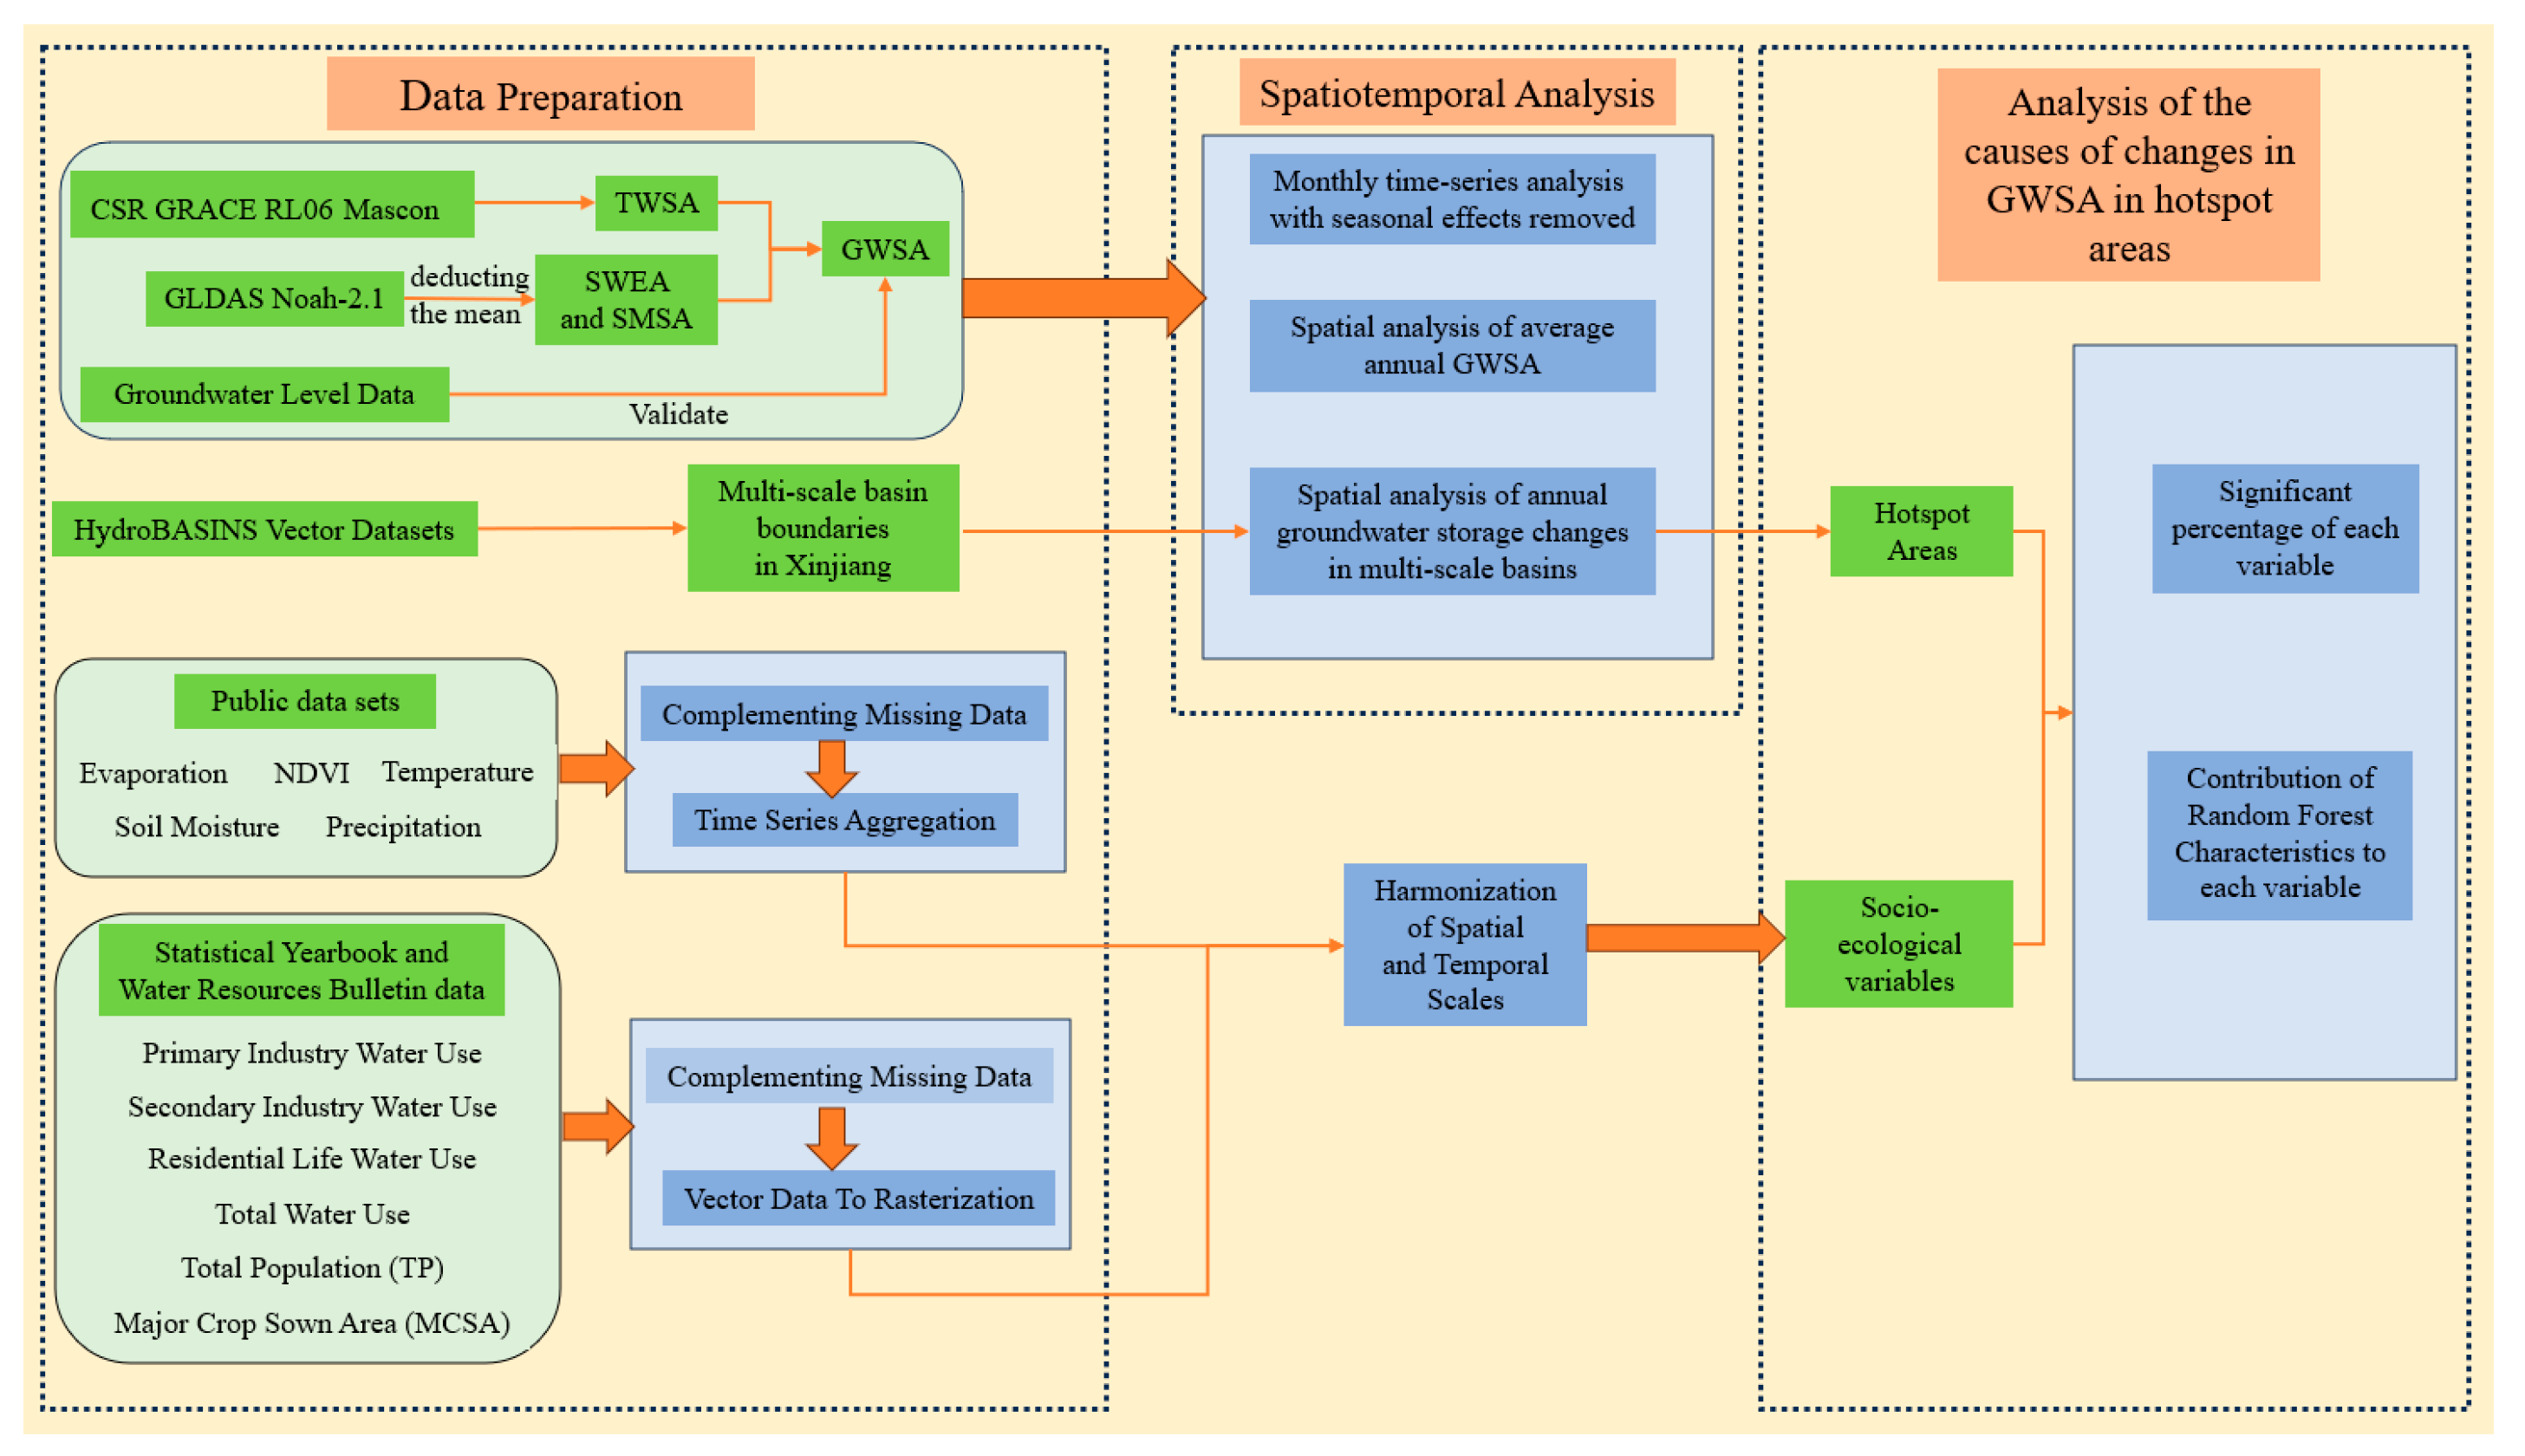
2. Materials and Methods
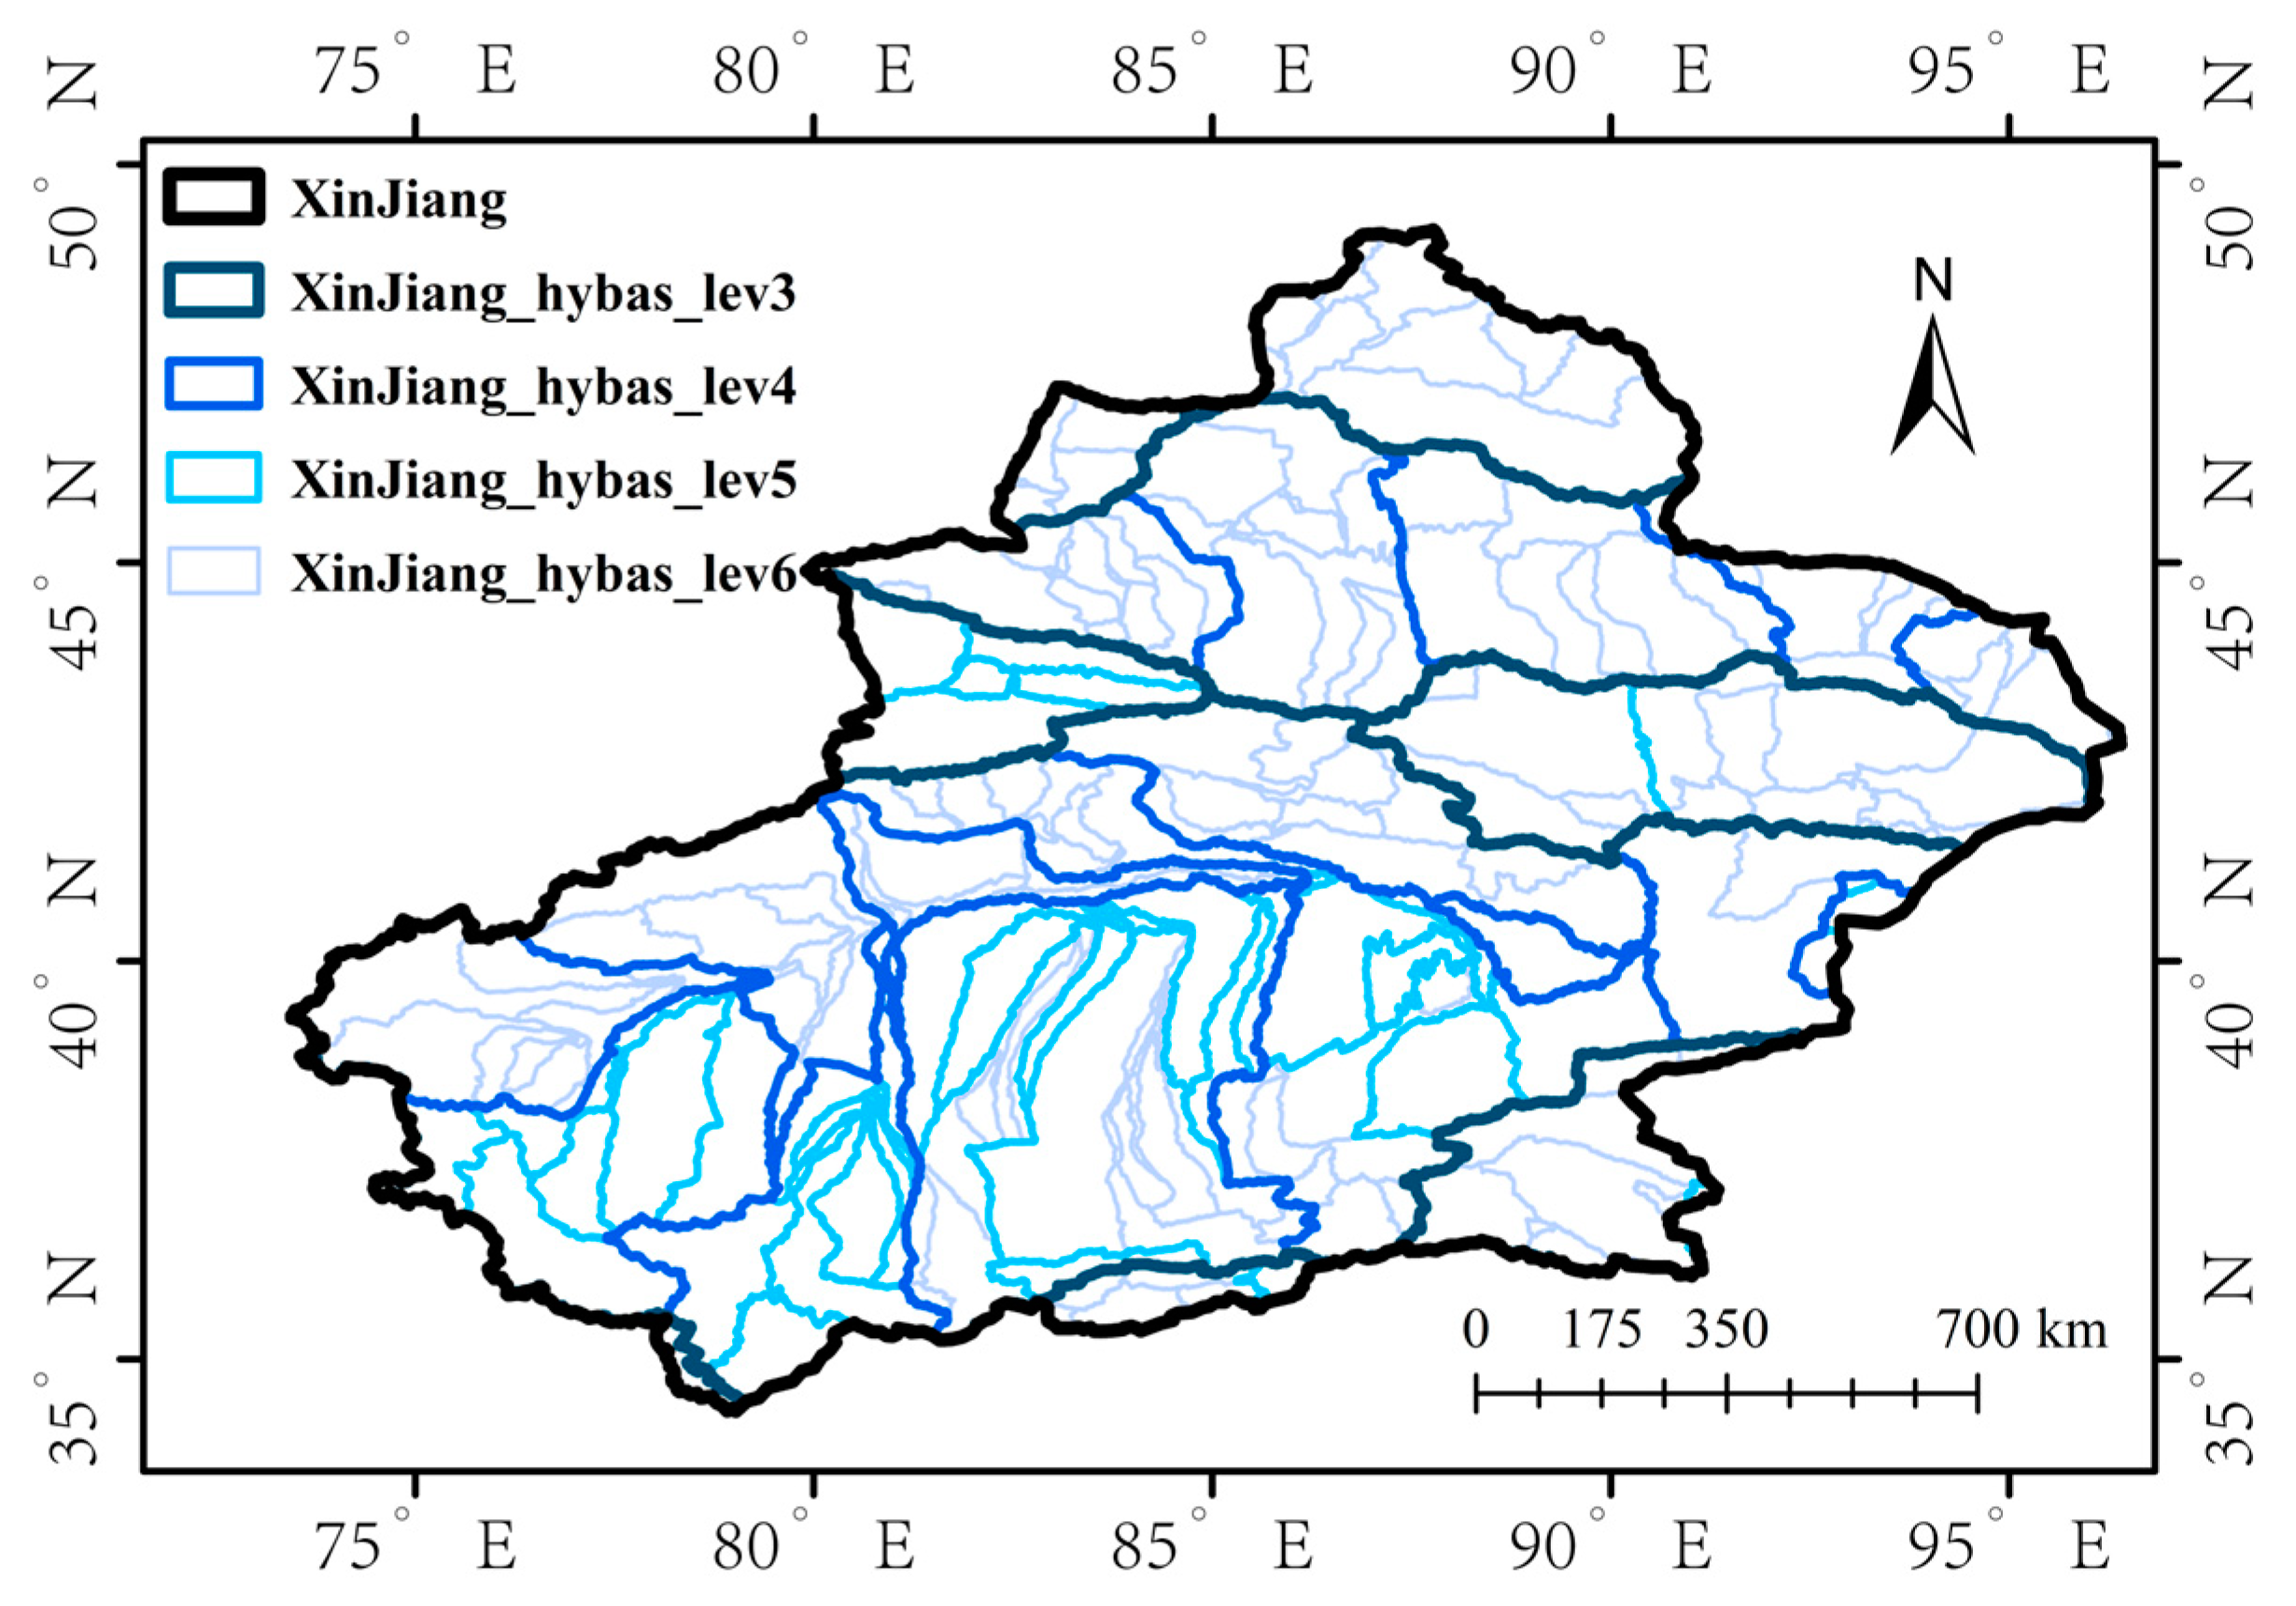
2.1. Study Area

Xinjiang, situated in northwestern China (as shown in Figure 1), covers an area of approximately 1.66 million square kilometers and features a distinctive geographical structure (as shown in Figure 2) often described as “two basins sandwiched between three mountains”. This unique layout encompasses the Altai Mountains, the Tien Shan Mountains, and the Kunlun Mountains, along with the expansive Tarim Basin and the Junggar Basin [34]. The region is characterized by a predominantly arid continental climate. In climatic terms, northern Xinjiang falls into the arid temperate zone, whereas southern Xinjiang lies within the arid warm temperate zone [35]. The average annual temperatures range from 4 to 8 °C in the north and 9 to 12 °C in the south [36]. Precipitation in Xinjiang is generally scarce and unevenly distributed in both time and space, with mountainous areas accounting for 84% of the total annual average precipitation in the whole of Xinjiang [37].
Xinjiang’s water resource scenario, constrained by its arid climate and scant precipitation, presents unique challenges. Despite a vast river network, the region suffers from a scarcity of total water resources and a low water yield per unit area [38]. Water resources are highly unevenly distributed both spatially and temporally, characterized by more in the north than in the south, more in the west than in the east, and more in mountainous areas than in plains. Despite the significant difference in their land areas, with northern Xinjiang making up 28% and southern Xinjiang 72% of the total area, both regions remarkably contribute an equal share, each accounting for 50% of the area’s annual runoff volume. Additionally, Xinjiang experiences a significant seasonal variation in river flow, with about 70% of its annual volume occurring in summer [39].

2.2. Data

Four main types of data were used in this study. The first category of groundwater data consists of GRACE satellite data and GLDAS model data, which are the basis for estimating and analyzing GWSA changes. The second type of data is groundwater level data obtained through groundwater level monitoring stations, which are used to validate the GWSA inferred from GRACE data. The third category is the annual environmental and socio-economic data used to analyze the drivers of anomalous changes in groundwater storage anomalies. The final category of data is geographic information, including basin boundaries and other ancillary data such as state and regional boundaries. These data are used for study area extraction and ancillary analyses.

2.2.1. GRACE Data

The Gravity Recovery and Climate Experiment project utilizes the variation in distance between two co-orbiting satellites to detect changes in Earth’s gravitational field. These changes are influenced by the uneven distribution of mass, such as variations in water storage. As the satellites orbit over regions with differing amounts of water, the gravitational attraction alters, causing minute adjustments in the distance between them [40]. The processed data from GRACE are invaluable for estimating changes in surface water, groundwater, glaciers, and snowpacks, offering vital insights into the global hydrological cycle and climate change studies [2]. The University of Texas Center for Space Research’s CSR RL06 Mascon dataset, which contains information from the GRACE and GRACE-FO missions, is used in this study. The dataset encompasses monthly data with a resolution of 0.25° from 2003 to 2021, (available at http://www2.csr.utexas.edu/grace, accessed on 9 September 2023). Utilizing the Mascon method over the traditional spherical harmonic coefficient (SH) approach notably reduces leakage errors and eliminates north–south striping, yielding higher spatial resolution and signal efficacy [41]. To mitigate crustal static structural changes, the Terrestrial Water Storage Anomaly (TWSA) dataset is referenced against the baseline average spanning 2004–2009 and is expressed in terms of equivalent water height (EWH) [42]. Additionally, linear interpolation is employed to compensate for data gaps due to satellite orbit adjustments or satellite transitions [43]. In particular, there was an approximate 1-year gap between the GRACE and GRACE-FO missions (July 2017–May 2018), which was not ideal but did not affect most relevant applications that focus on seasonal and long-term time scales, and analyses using the GRACE-FO data have shown accuracy that is generally consistent with pre-launch expectations [23,25]. In addition to the data corresponding to the missing months, we employed linear interpolation of the data for the same months in the 5 years prior and after.

2.2.2. GLDAS Model Data

GLDAS (global land data assimilation system) is a collaborative initiative developed jointly by the National Oceanic and Atmospheric Administration (NOAA) and NASA [44]. This system synergistically merges satellite and terrestrial observations with sophisticated modeling techniques to furnish comprehensive and precise estimations of terrestrial surface states and fluxes. In this research, we have chosen the NOAH-2.1 model data from the suite of GLDAS models (available at: https://disk.gsfc.nasa.gov/datasets/GLDAS_NOAH025_M_2.1/, accessed on 9 September 2023), which is distinguished for its minimal bias and reduced uncertainty [45,46]. The NOAH-2.1 model encapsulates an array of terrestrial surface data in a gridded format, encompassing parameters such as soil moisture content and snow water equivalent. Crucially, its spatiotemporal resolution is congruent with that of the GRACE Mascon dataset, ensuring compatibility and coherence in our analysis.

2.2.3. Groundwater Level Data

The principal method for validating the accuracy of GWSA data deduced from GRACE data is to compare these findings with actual groundwater level measurements obtained from monitoring wells [47,48]. However, groundwater observations in the region are very limited [21]. Although some observations may be available, accessing the data is very difficult due to the constraints of the associated data strategy. We have made our best efforts to collect the observations. In this study, we selected 31 monitoring sites across the 12 months of 2021, calculating the Pearson correlation coefficient between the anomalous groundwater level data and corresponding GWSA data. The map below (Figure 3) displays the locations of the monitoring stations.

2.2.4. Reanalysis Data

Prior research suggests that variations in GWS are intricately associated with factors such as precipitation infiltration recharge, surface water replenishment, groundwater discharge, human activities, and the intricate influences of vegetation [49,50]. Owing to the complexities involved in precisely measuring regional groundwater discharge, our analysis included 11 distinct factors. Precipitation (PRE), temperature (TMP), evapotranspiration (ET), and soil moisture (SM) were employed as indicators to characterize the contribution of precipitation infiltration and surface water to groundwater replenishment. Total population (TP), major crop sown area (MCSA), primary industry water use (Primary Industry), secondary industry water use (Secondary Industry), residential water use (Residential Life), and total water use were chosen to represent human activities. Additionally, the normalized difference vegetation index (NDVI) was utilized to signify vegetation change and analyze the driving factors behind GWS decline.
NDVI and ET data from January 2003 to December 2021 come from the Moderate Resolution Imaging Spectroradiometer (MODIS) series of NASA. (https://ladsweb.modaps.eosdis.nasa.gov/, accessed on 21 October 2023) [14]. Precipitation data are derived from the Tibetan Plateau Data Center’s monthly precipitation dataset for China at a 1 km resolution (1901–2021) (http://poles.tpdc.ac.cn/zh-hans/data/, accessed on 21 October 2023) [51]. Temperature data were also obtained from the Tibetan Plateau Data Center, including the monthly temperature dataset for China at a 1 km resolution (1901–2021) (http://poles.tpdc.ac.cn/zh-hans/data/, accessed on 21 October 2023) [52]. Additionally, multiple socio-economic indicators are included, such as total population, major crop sown area, primary industry water use, secondary industry water use, residential life water use, and total water use, sourced from statistical yearbooks published by the Xinjiang Uygur Autonomous Region Government (https://tjj.xinjiang.gov.cn/tjj/zhhvgh/list_nj1.shtml, accessed on 27 October 2023) and water resource bulletins from the Xinjiang Uygur Autonomous Region Water Resources Department (http://slt.xinjiang.gov.cn/slt/szygb/list.shtml, accessed on 27 October 2023).

2.2.5. Geospatial Auxiliary Data

To delineate graded watershed boundaries, this study employs the HydroSHEDS dataset offered by the World Wildlife Fund (WWF) (http://www.Hydrosheds.org, accessed on 11 November 2023) (as shown in Figure 4). Additional vector data, including national, provincial, and urban boundaries, are obtained from the National Geomatics Center of China (http://www.ngcc.cn/ngcc/, accessed on 9 September 2023). Boundary vector file of Xinjiang from China Standard Map—Revision No. GS(2020)4619.

2.3. Methodology

This study’s methodology consists of data preparation, spatial and temporal analysis of GWSA, and investigation of the drivers influencing changes in GWSA (as shown in Figure 5). The initial stage of data preparation involved gathering and analyzing data from several sources, including GRACE satellite data, GLDAS Noah-2.1 model data, Water Resources Bulletin and Statistical Yearbook data, environmental variables data, the HydroBASINS vector dataset, and the boundary vector data of the study region. Then the GWSA were calculated from GRACE satellite data and GLDAS Noah-2.1 model data and calibrated using groundwater level data to confirm their accuracy and reliability. In the process of spatiotemporal analysis, the seasonal trend decomposition technique was used to further characterize the long-term trend in GWSA, assess the average annual change in GWSA in Xinjiang, and spatially analyze the change in groundwater storage anomalies in multi-scale basins. Finally, to explore the potential drivers of GWS changes, we synthesized socioeconomic and environmental data, calculated the percentage significance of each variable for changes in groundwater storage to reveal the main influencing factors, and quantitatively analyzed the effects of these variables using a random forest model. The integration of these techniques offers a strong scientific basis for the Xinjiang region’s sustainable water resource.

2.3.1. GRACE Gravity Satellite and Terrestrial Water Reserves

The GRACE (Gravity Recovery and Climate Experiment) project deduces terrestrial water storage by detecting subtle changes in Earth’s gravitational field. This approach is predicated on the understanding that variations in Earth’s water mass lead to shifts in mass distribution, consequently altering the gravitational field in the vicinity [40,53]. In this study, we have chosen to utilize the GRACE solution to infer terrestrial total water storage (TWS). This inference is based on the equivalent water thickness, a parameter derived from the GRACE data [54]. The equivalent water thickness Δ h ( θ , φ ) is calculated as follows:
Δ h ( θ , φ ) = R ρ ave 3 ρ w l , m   2 l + 1 1 + k l W lm P lm ( cos ( θ ) ) Δ C lm cos ( m φ ) + Δ S lm sin ( m φ )
where l and m represent the degree and order of spherical harmonics, respectively. ρ ave is the average density of the Earth and ρ w is the density of water. R denotes the Earth’s radius, θ and φ correspond to the colatitude and longitude. k l refers to the load Love number, which accounts for the Earth’s deformation in response to the applied load. W lm is an expression in spherical harmonics for a Gaussian smoothing filter. P lm stands for the normalized associated Legendre function, and Δ C lm and Δ S lm are the normalized spherical harmonics coefficients that have been processed by the decorrelation filter.

2.3.2. Inversion of Groundwater Storage Anomalies (GWSA)

Terrestrial water storage anomalies (TWSA) refer to the sum of changes in various hydrological components both at the surface and subsurface within a region [26]. These include the variations in soil moisture storage anomalies (SMSA), snow water equivalent anomalies (SWEA), canopy water storage anomalies (CWSA), surface water storage anomalies (SWSA), and groundwater storage anomalies (GWSA). According to previous studies, in the Xinjiang region, the combined total of canopy water and surface runoff is relatively insignificant and thus can be disregarded in long-term time series analysis [55,56]. And it is true that groundwater resources in the Xinjiang region are mainly influenced by precipitation and glacial snowmelt [57]. Consequently, GWSA can be calculated by subtracting the other components from TWSA, as shown below:
GWSA = TWSA SMSA SWEA
where TWSA is sourced from GRACE satellite observations, and SMSA and SWEA are computed by deducting the 72-month mean for the period 2004–2009, using data for each component from the GLDAS Noah-2.1 dataset.

2.3.3. Pearson Correlation Coefficient

To ensure the accuracy and reliability of groundwater storage anomalies derived from GRACE data. For this purpose, the Pearson correlation coefficient was used to validate the correlation between groundwater storage anomalies derived from GRACE data and groundwater levels observed on the surface. The Pearson correlation coefficient, also known as the correlation coefficient, serves as a statistical indicator for gauging the strength of the linear relationship between two variables. The following is the formula for calculating the Pearson correlation coefficient:
r = ( x i x - ) ( y i y - ) x i x - 2 y i y - 2
In this formula, x i and y i are the sample values of the two variables, respectively. x - and y - are the mean of these sample values, respectively.

2.3.4. Spatial and Temporal Analysis of GWSA

Seasonal Effect Removal in Time Series Analysis

In the realm of time series analysis, the presence of seasonal cycles can obscure the true trends and patterns within the data [26]. Seasonality, characterized by systematic variations that recur over fixed intervals, such as annually or monthly, due to seasonal factors, is a common phenomenon in environmental and socio-economic datasets [58]. Hence, the seasonal-trend decomposition using the Loess (STL) approach is employed for the decomposition of the GWSA time series [33]. The STL method enables the independent assessment of long-term trends, seasonal cycles, and random disturbances within the time series, offering a flexible and robust non-parametric tool for time series analysis. This instrument is particularly adept at distinctly unraveling the seasonal, trend, and residual components, making it exceptionally well suited for managing complex environmental datasets like GWSA. The STL process can be expressed as Equation (4):
S total = S long-term + S seasonal +   S residual
S total represents the raw GWSA time series.
S long-term is the long-term trend component derived through data-smoothing techniques. It reflects the overarching ascension or decline in GWSA, devoid of seasonal and random fluctuations.
S seasonal is the seasonal segment, capturing the cyclical nature of GWSA. This could manifest as seasonal variations in groundwater levels due.
  S residual is the residual element, encapsulating the random oscillations after the extraction of long-term trends and seasonal effects.
With the seasonal cycle accounted for, a sharpened focus is placed on GWSA’s long-term trends and anomalous events. By fitting S long-term and   S residual , an interannual variability trend for GWSA is obtained, offering a clarified view devoid of seasonal influences, which in turn enables a more precise interpretation of GWSA’s evolution.

Quantifying GWSA Changes from 2003 to 2006

The trend in GWS not only mirrors the dynamic changes within environmental and hydrological cycles but is also directly linked to the sustainability of regional water resources. To elucidate this trend with depth and accuracy, the present study employs two renowned non-parametric statistical methods: the Theil–Sen median slope estimator and the Mann–Kendall test [59].
The Theil–Sen median slope estimator is a technique that calculates the median of the slopes between all possible data pairs, thereby providing an estimate of the overall trend [60]. This method boasts significant robustness, offering a sturdy trend estimate, particularly in the presence of potential outliers or non-linear trends. The rate of change in the groundwater storage formula for the Theil–Sen estimator is as follows:
β GWSA = median GWSA j GWSA i j i
In this context, β GWSA denotes the rate of change in groundwater storage, where GWSA i and GWSA j are the groundwater storage anomaly values at the i hand j months within the time series, respectively.
The Mann–Kendall test is utilized to determine the statistical significance of trends within a time series. This non-parametric test does not assume a normal distribution of the data, rendering it an optimal choice for evaluating environmental data that may exhibit skewness, such as GWSA. The essential formula involved in the computation is as follows [61]:
Z = S 1 Var ( S ) ( S   >   0 ) 0 ( S   =   0 ) S + 1 Var ( S ) ( S   <   0 )
S = j 1 n 1 i = j + 1 n sign ( GWSA j GWSA i )
sign θ = 1 ( θ   >   0 ) 0 ( θ   =   0 ) 1 ( θ   <   0 )
Var S = n ( n 1 ) ( 2 n + 5 ) 18
In this formula, GWSA j and   GWSA i are the GWSA values for months i and j , respectively; n represents the number of observations in the time series; and Z is the standard normal test statistic. A trend is considered statistically significant, if |Z| > Z1 − p/2 exceeds. If β GWSA < 0 and p < 0.05, then the GWSA in the region is deemed to exhibit a declining trend.

Rate of Change in Groundwater Storage Anomaly

Groundwater storage anomaly is defined as the deviation in groundwater storage at a given moment from its long-term average or baseline value. This metric offers insights into the short-term dynamic fluctuations in groundwater systems. The instantaneous rate of change in GWSA is commonly represented by ΔGWS, which is theoretically the derivative of GWSA concerning time [62]. Specifically, ΔGWS denotes the minute oscillations inf GWSA over specified intervals, such as monthly or annually. The ΔGWS is instrumental in providing essential information about the real-time dynamics of groundwater systems, aiding in the more accurate assessment of the status and future trends of groundwater resources. Moreover, it serves as a crucial decision-making reference for the sustainable management of groundwater resources.
GWS t dGWSA dt GWSA t GWSA ( t 1 ) t
By calculating the annual mean rate of change, we categorize regions experiencing variations in GWS into six distinct levels: dramatic decrease, rapid decrease, moderate decrease, moderate increase, increase, and rapid increase (As shown in Table 1). Utilizing these six classifications, we conducted a spatiotemporal analysis of GWS in the entire Xinjiang region, focusing on the basins categorized into levels three to six. This analysis was aimed at delving deeper into the fluctuation characteristics of GWS.

2.3.5. Analysis of Factors Affecting Changes in Groundwater

Preprocessing of Reanalysis Data

To investigate the factors influencing groundwater storage changes, it is essential to extract and preprocess data to conform to a uniform spatial and temporal framework. This involves focusing on the Xinjiang region (73.40°E–96.18°E, 34.25°N–49.10°N) with a spatial resolution of 0.25° × 0.25° grid data and an annual temporal sequence from 2003 to 2021. For missing data points, we employ linear interpolation for data imputation. For finer grid data (higher resolution), the resolution is upgraded to 0.25° using ArcGIS, employing key functions such as “Extract Values to Points” and “Zonal Statistics”. For grid data with more detailed temporal sequences (e.g., monthly data), we aggregate the data to an annual time series by averaging (for soil moisture, SM; temperature, TMP; normalized difference vegetation index, NDVI) or accumulating (for evapotranspiration, ET; precipitation, PRE). For the data from statistical yearbooks and water resource bulletins, certain 2021 data points are missing. To address this, we employ a machine learning approach using the exponential triple smoothing algorithm, implemented via the Excel function “FORECAST.ETS” [63]. Additionally, in conjunction with vector data (shapefile), similar functions in ArcGIS are utilized to convert these into raster format. Through these preprocessing steps, we have successfully prepared 14 dynamic variables: SM, ET, PRE, TTMP, NDVI, TP, MCSA, and water usage data for primary industry, secondary industry, residential life, and total water use.

Methods for Analyzing Factors Affecting Changes in Groundwater

To understand the various socio-ecological factors influencing groundwater storage anomaly, we applied two distinct analytical approaches. The first approach involves regression subset selection to sift through multiple socio-ecological variables and pinpoint the ones with significant predictive power. The second approach utilizes a nonlinear machine learning strategy, the random forest model, which provides a detailed quantitative analysis of the relative importance of these factors. Both methods are crucial in identifying the key drivers of GWSA. By integrating these two methods, our analysis gains both breadth and depth, enabling a comprehensive assessment of the socio-ecological factors affecting GWSA.
To identify the primary predictive factors among the socio-ecological variables, we employed a regression subset selection method. This technique generates multiple linear regression models from the 11 socio-ecological factors and measures the predictability of each factor by its significance percentage: the number of models where the factor is significantly divided by the total number of models including that factor. A higher percentage indicates a stronger capability to predict groundwater variations over time or space [31]. This approach supersedes marginal correlation coefficients as it accounts for variables that may not individually relate to groundwater storage but show significant correlations in a multivariate regression model when combined with other variables. Moreover, to quantify the impact of each socio-ecological factor on GWS, we introduced a nonlinear machine learning strategy, the random forest model, to conduct a detailed quantitative analysis of the key factors’ feature importance [64]. As an ensemble of multiple decision trees, random forests assign accurate relative importance to features in prediction, thereby clearly reflecting their value and significance within the predictive framework. Through the collective analysis of numerous decision trees, this method precisely reveals the leading variables in GWS prediction. A high importance score for a feature further signifies its critical influence on the overall prediction.

3. Results

3.1. Validation of Groundwater Storage Estimates

In this study, we selected 31 monitoring sites across the 12 months of 2021, calculating the correlation coefficients between the anomalous groundwater level data and the corresponding GWSA data. This yielded an average correlation coefficient of 0.488 (As shown in Table 2). Groundwater information can be inverted using GRACE-calculated groundwater storage anomaly data. Moreover, the results align with previous studies; the identified hotspots of significant GWS decline in Xinjiang described in this research are consistent with the findings [27,33,60]. The hotspot area of drastic GWS decline—specifically, the northern foothills of the Tianshan Mountains—is also identified as a key area for integrated management of groundwater over-extraction by the Ministry of Water Resources [65].

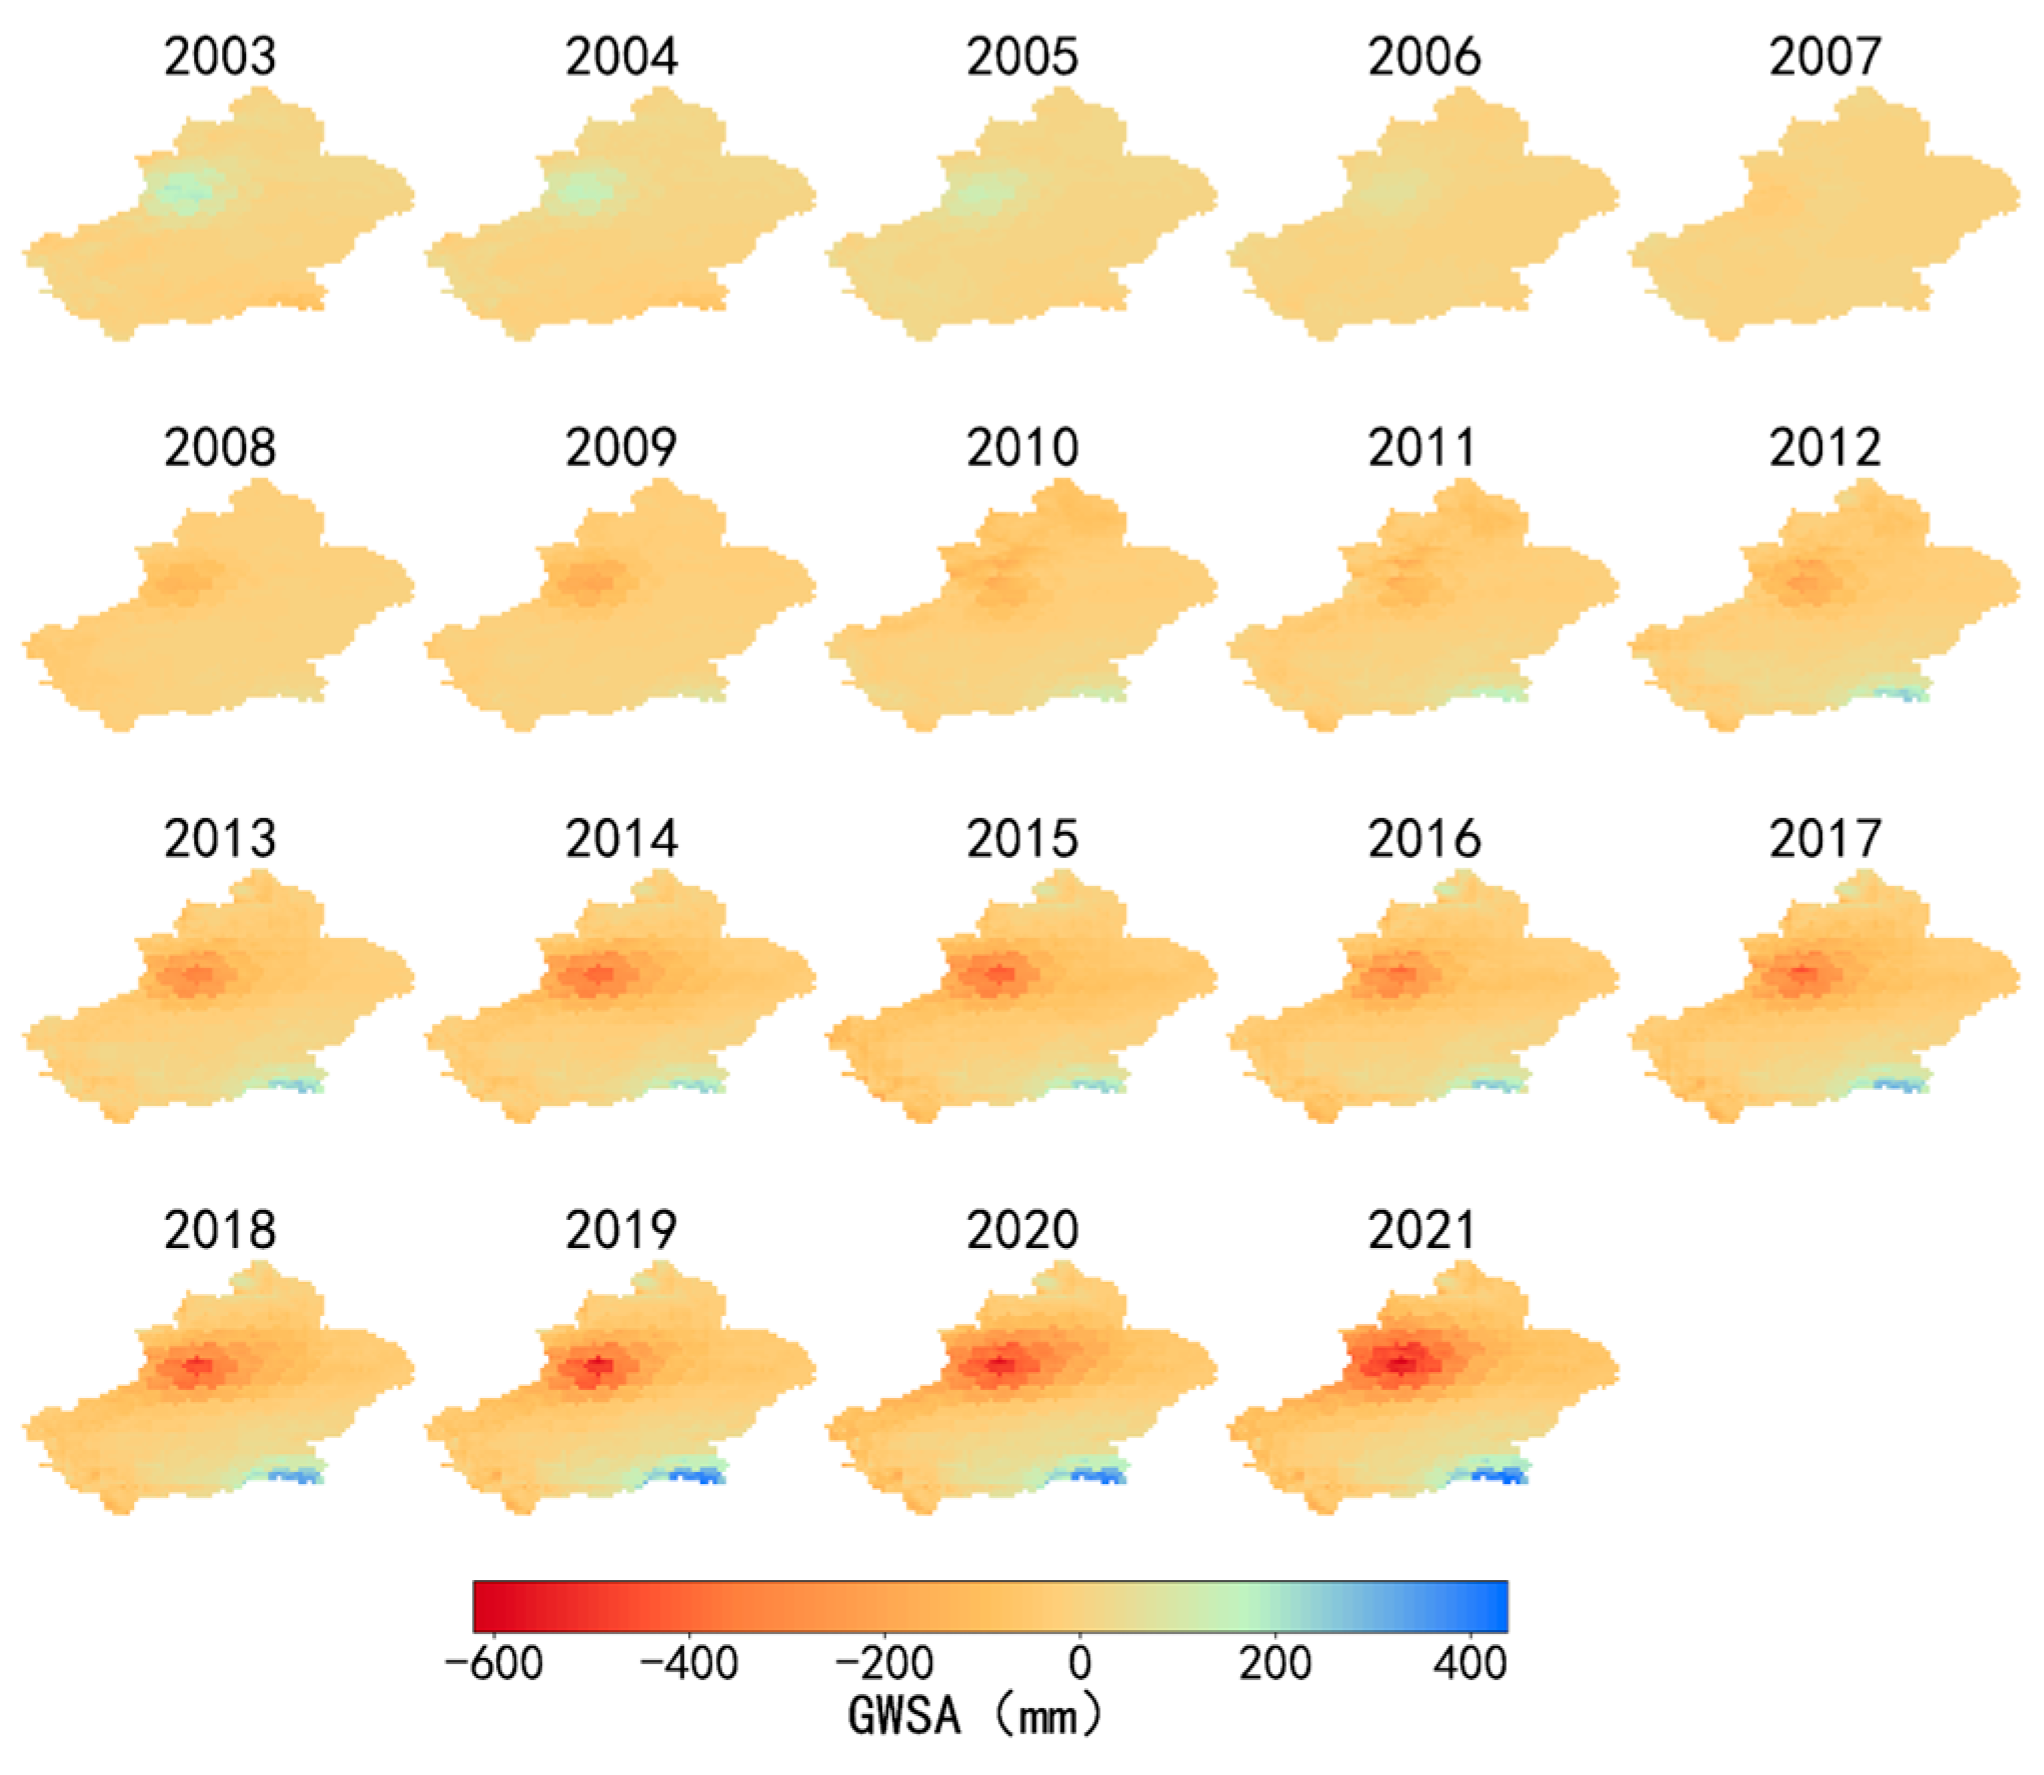
3.2. Spatial Heterogeneity of Groundwater Storage Anomalies in Xinjiang from 2003 to 2021

To more precisely identify long-term patterns, the decision was made to average monthly data on an annual basis, yielding annual-scale groundwater storage anomaly data for the years 2003 to 2021. This approach effectively mitigates the impacts of seasonal factors such as precipitation and snowmelt, which are characterized by short-term fluctuations. As shown in Figure 6, the annual data on groundwater storage anomalies in Xinjiang from 2003 to 2021 revealed significant spatial heterogeneity. Specifically, from 2003 to 2007, the overall regional GWS was stable, with a slight decline in the northwest, suggesting an increasing stress on groundwater resources in that area. Between 2008 and 2012, the GWS in the southeast experienced a slight increase, while the central and western regions saw a declining trend, highlighting the differences in groundwater dynamics across regions. From 2013 to 2016, the positive growth trend in the southeast continued, while the decline in GWS in the northwest and north became more pronounced, as indicated by the red-colored areas representing negative groundwater storage values, signaling an expansion of areas experiencing groundwater depletion. Lastly, during the period from 2017 to 2021, the decline in GWS in the northwest and north was particularly notable, with the low-value areas not only continuing to decrease in value but also expanding in scope. These changes underscore the complexity of groundwater resource distribution in Xinjiang, which is likely influenced by regional climatic fluctuations, changes in land use patterns, and water resource management policies.

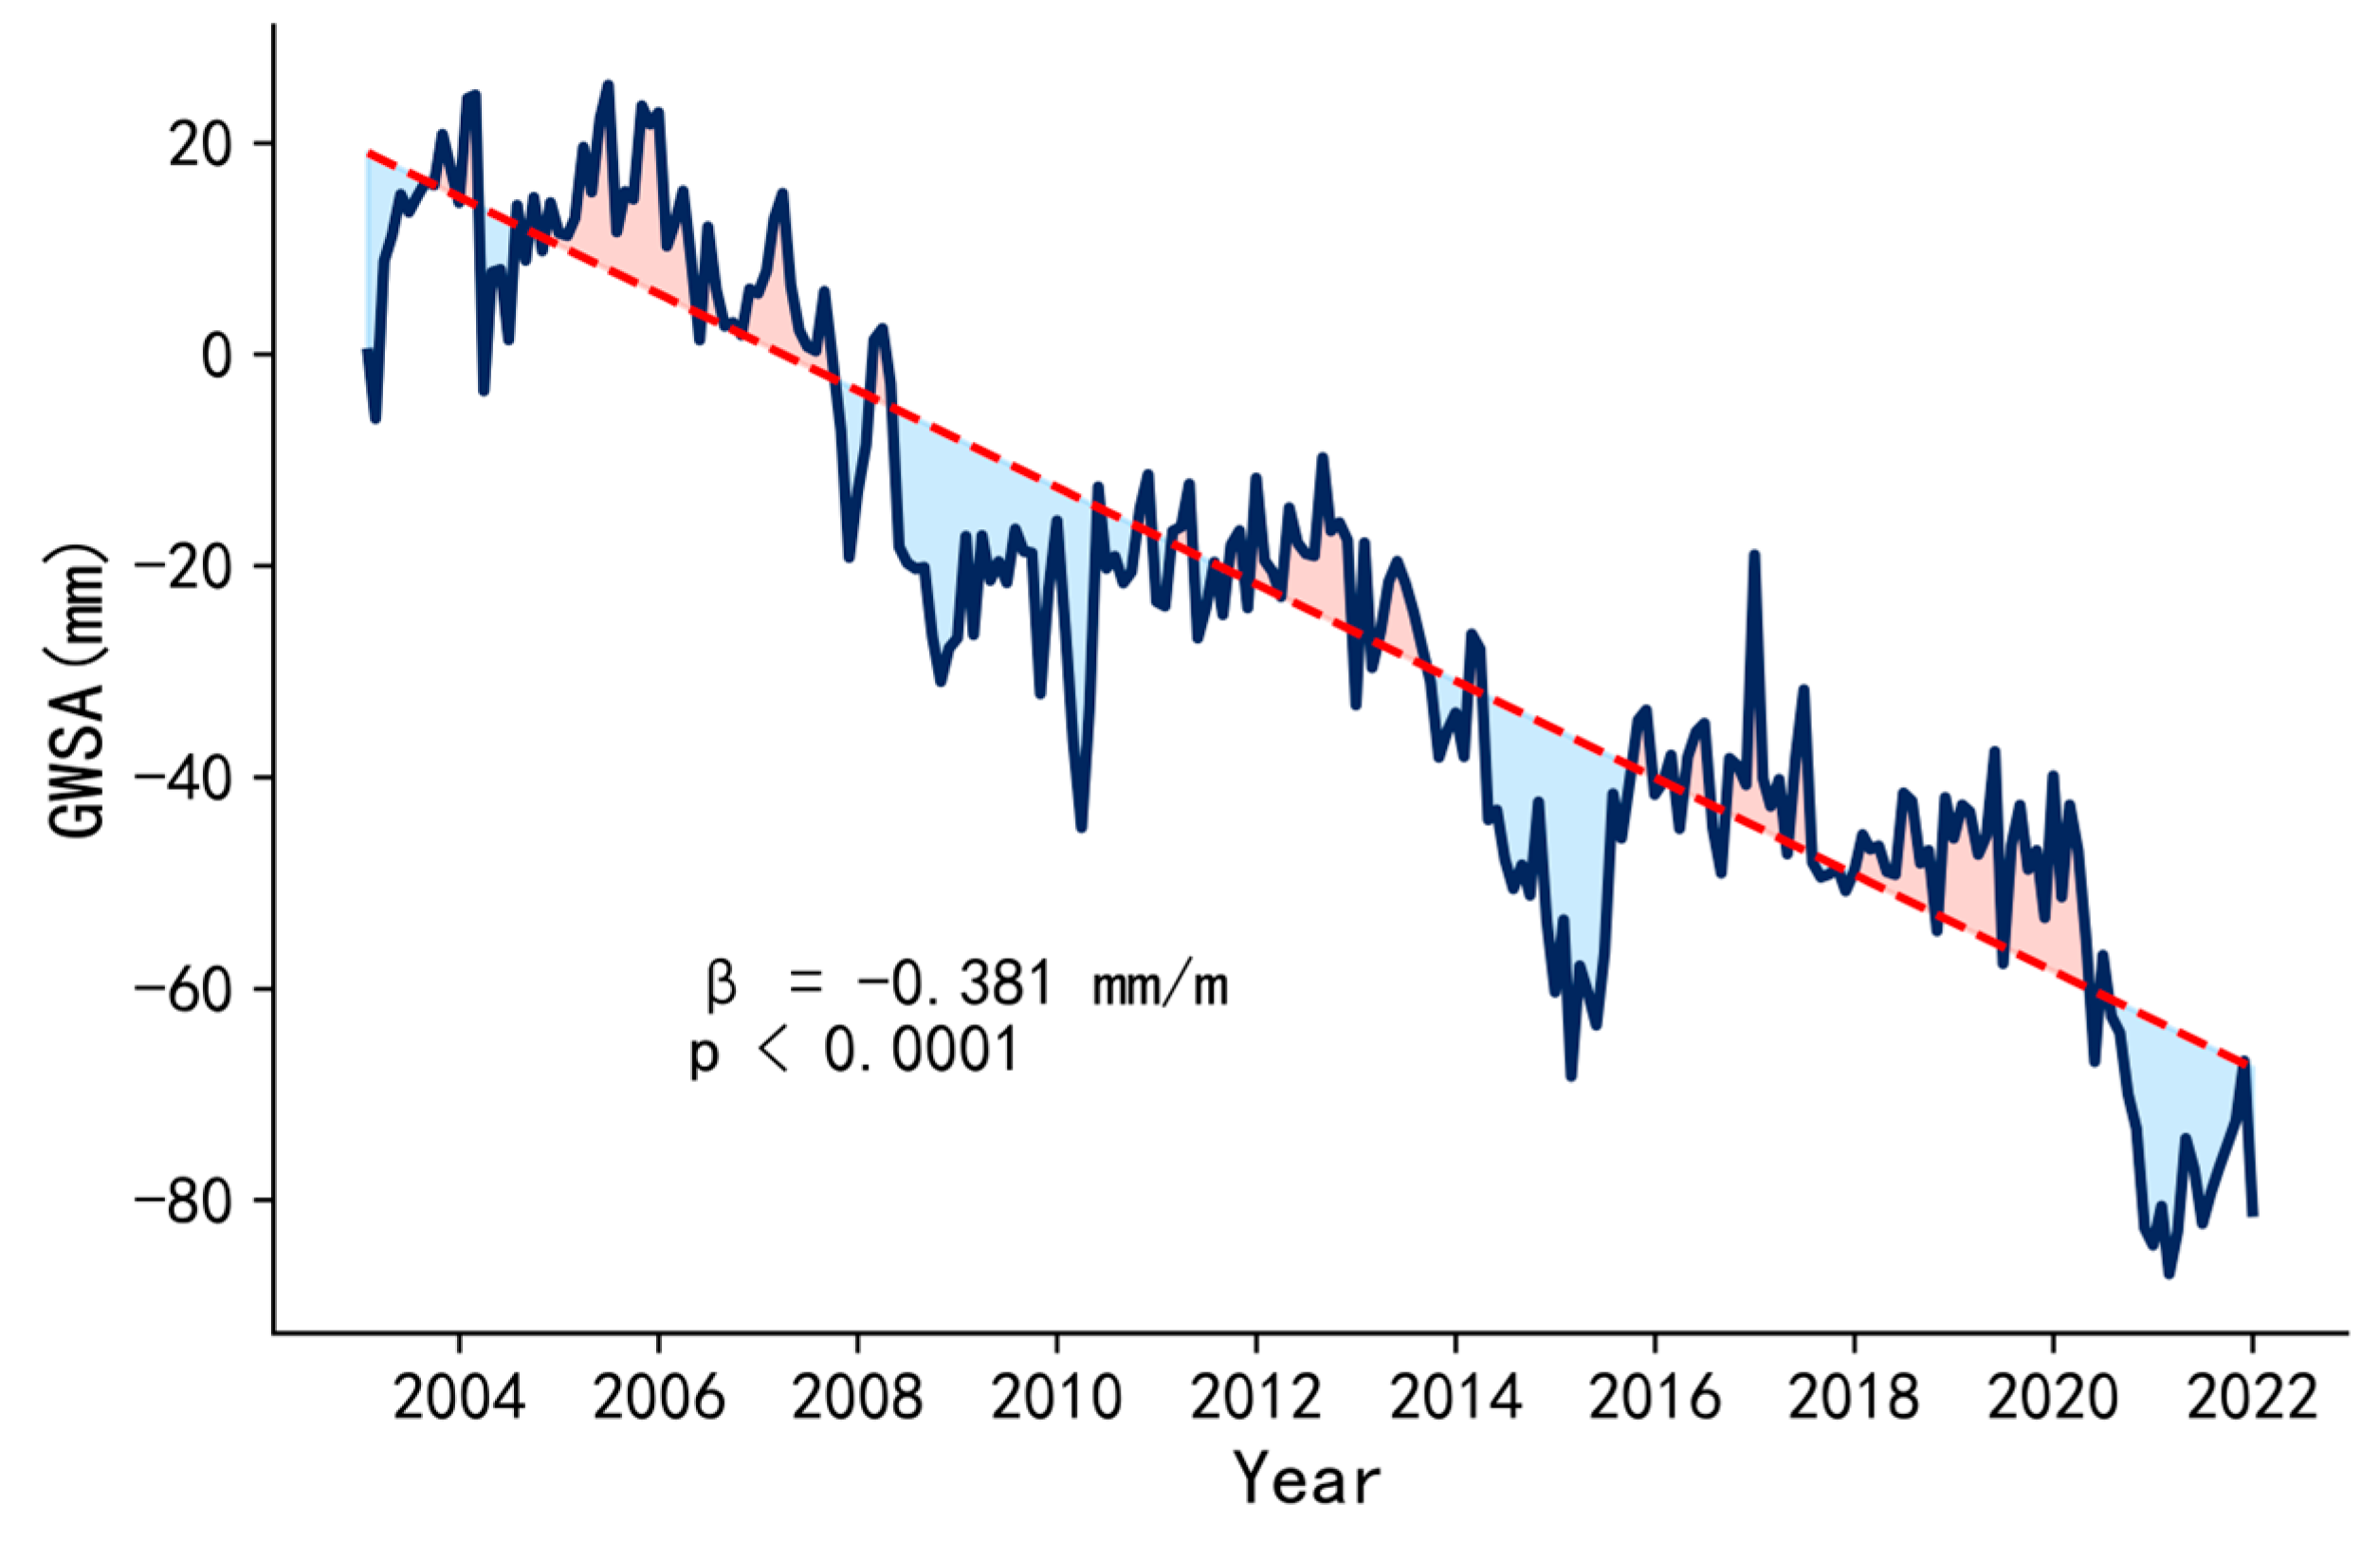
3.3. Changes in Groundwater Storage in Xinjiang from 2003 to 2021

This study conducted an in-depth analysis of the monthly time series data on groundwater storage anomalies in the Xinjiang region from 2003 to 2021. After adjusting for seasonal effects, the data revealed a pronounced downward trend in the region’s groundwater storage, as shown in Figure 7. Employing the Theil–Sen median slope estimator, it was determined that the mean annual decrease in GWSA was approximately 0.381 mm/m. This finding is robustly confirmed by the Mann–Kendall test (p < 0.001), indicating a significant reduction in groundwater storage relative to its long-term average over the past two decades. Notably, in addition to this long-term declining trend, there were also significant annual fluctuations in certain years. This trend can be attributed to various factors, including climate change, excessive groundwater extraction, and inadequate recharge, leading to a consistent decrease in groundwater storage in Xinjiang.

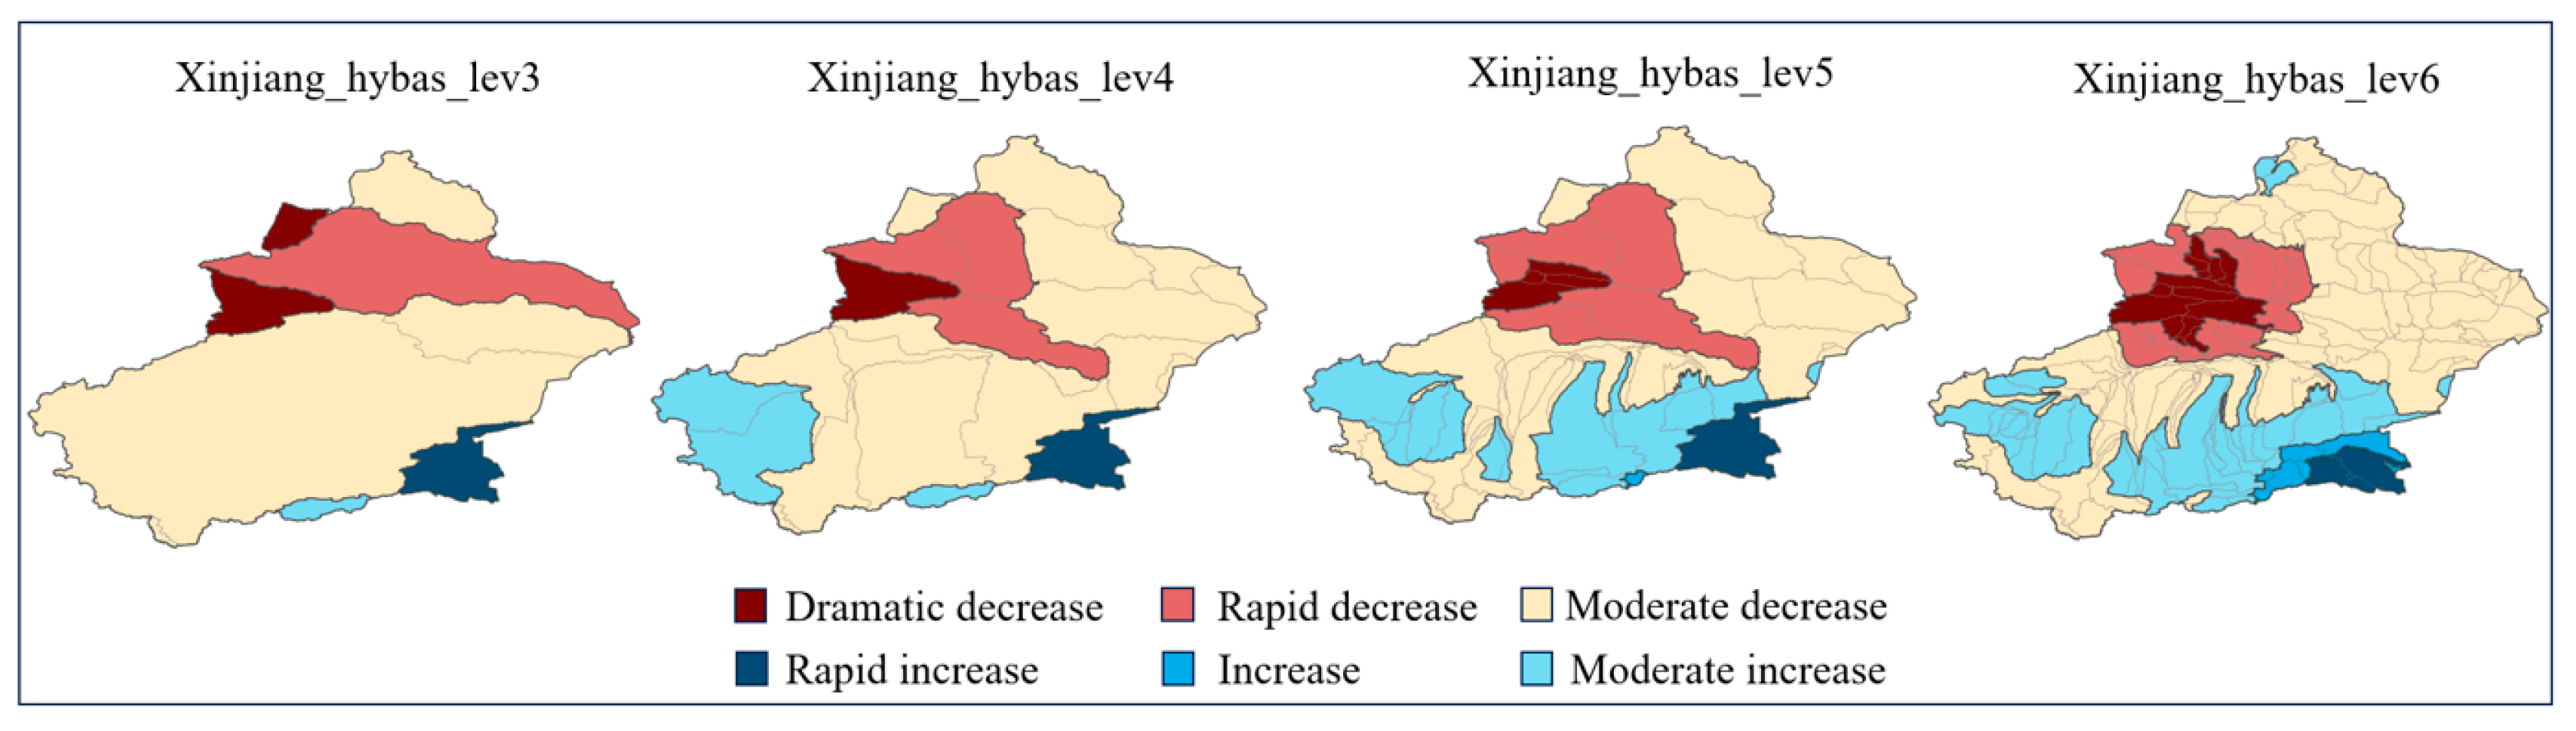
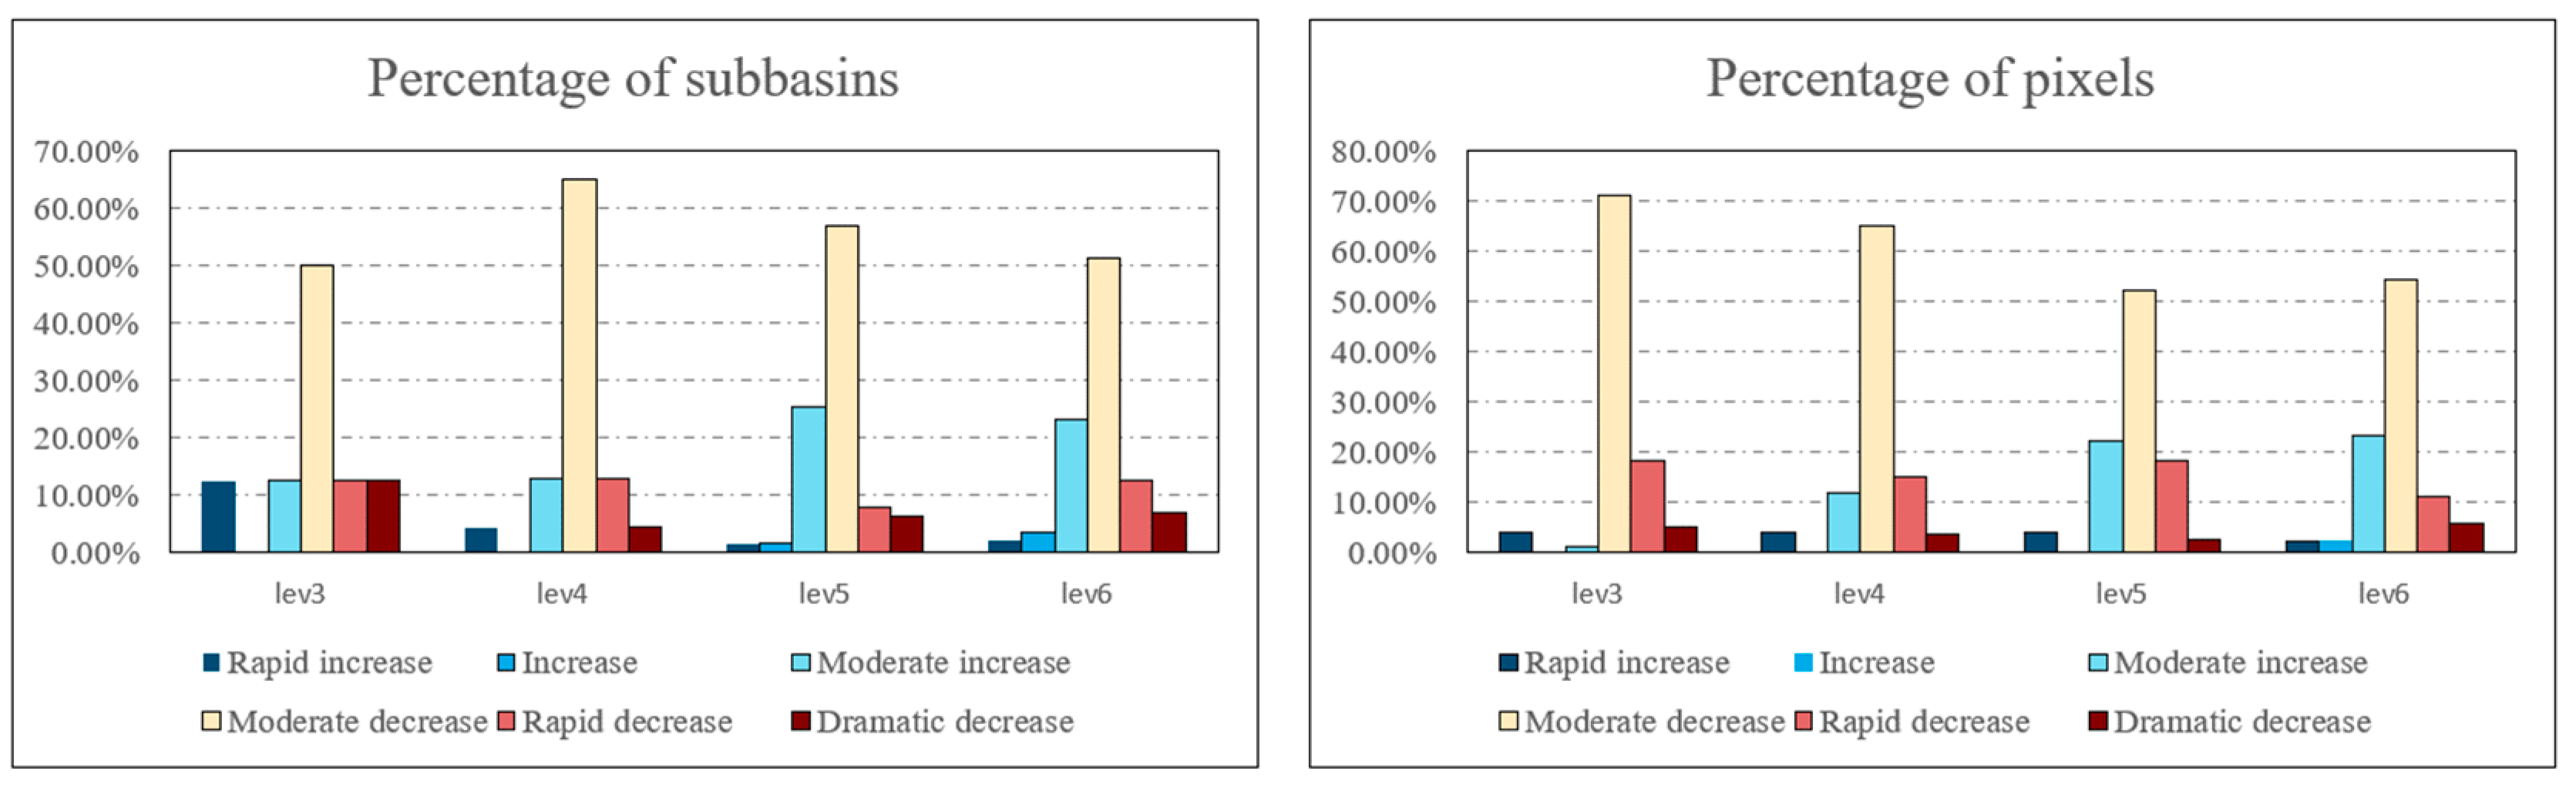
3.4. Multi-Scale Spatiotemporal Analysis of Groundwater Storage in Xinjiang

From 2003 to 2021, an exhaustive analysis of groundwater storage in the third to sixth level river basins in the Xinjiang region underscored pronounced spatial variability in its fluctuations, as shown in Figure 8 and Figure 9. Observations at the third-level river basin scale revealed that half of the eight basins manifested a moderate decrease, encompassing 71.35% of the total observational pixels across the region. Particularly in the northern sector, a uniform trend of decline in GWS was observed across all basins, with the Yili River Basin exhibiting the most significant reduction, plummeting at a rate of 20 mm per year (mm/y). In contrast, two basins proximate to the Altun and Kunlun Mountains in the southeast displayed an upward trajectory in GWS, escalating at rates of 11.52 mm and 2.1 mm annually, albeit their combined pixel proportion was a scant 5.14%.
Delving deeper into the fourth-order basin scale analysis within Xinjiang, it emerged that 15 out of 23 basins were experiencing a moderate decrease, encapsulating 65.28% of the observation pixels. The GWS in the northern basins continued to show a downward trend, with the rate of decline in four sub-basins in the northwest exceeding 10 mm/y, accounting for 18.71% of the total. The Ili River Basin, within this group, marked the highest rate of decline at 25.08 mm/y. However, the southern region presented a contrasting scenario, where five basins exhibited an upward GWS trend, indicating new spatial variations. Beyond the southeastern part and the Kunlun Mountains, basins in western Xinjiang also showed a slight increase, bringing the pixel percentage of basins with growing GWS across Xinjiang to 16.46%.
In a meticulous exploration of the fifth-order basin scale across Xinjiang, it was observed that out of 63 basins, 36 were undergoing a moderate decrease, accounting for 52.21% of the region’s pixels. The northern region continued its declining trend, with some northwestern basins experiencing drastic drops in GWS, the most severe reaching a reduction of 31.63 mm per year (mm/y), highlighting the substantial depletion of groundwater resources in this area. However, the annual rate of change in groundwater storage in the southern basins displays a more intricate spatial pattern, predominantly characterized by a moderate increase, representing 22.30% of the pixels in these basins. Notably, basins near the Altun Mountains maintain a rapid increase, with pixels in growing basins constituting 26.55% of Xinjiang’s total.
At the sixth-order basin scale, a more nuanced perspective emerged, revealing new spatial trends. In the Xinjiang region, out of 189 river basins assessed, 97 basins, or 54.63% of the area, exhibit a moderate decrease in Groundwater Storage (GWS). Despite some areas in northern Xinjiang experiencing GWS growth, the overall situation of groundwater resources remained grave. In the western part of the Tianshan Mountains and the Ili River Valley, 13 basins experienced a dramatic decrease in GWS. Additionally, 24 basins saw a rapid decrease, totaling 11.05% of Xinjiang’s pixels. The spatial pattern in southern Xinjiang continued to show a mix of growth and decline, with 42 basins in a state of moderate increase, accounting for 23.45% of the pixels. Especially in the Altun Mountains area, four basins exhibited the highest GWS growth rates, reaching up to 24.98 mm/year, with the pixel percentage of growing basins in Xinjiang at 28.44%.
In the study of the Xinjiang region from 2003 to 2021, a transition from third to sixth-order basin scales revealed significant regional variations in the annual average rate of change in groundwater storage, both in terms of pixel representation and spatial layout. Across these basin scales, a dramatic decrease was the most prevalent phenomenon, with this trend’s pixel share remaining above 50% even after detailed basin-level segmentation. Specifically, in the northern and northwestern regions, there was a widespread distribution of rapid to severe declines, with the Ili River Basin and western Tianshan facing the most critical groundwater resource depletion. This is likely linked to local climatic conditions, over-exploitation of water resources, and increasing agricultural irrigation demands. In contrast, the subdivision of basins in the south revealed large areas of GWS growth, displaying a spatial layout of concurrent growth and decline, with the region’s changes primarily characterized by slight increases and decreases. Particularly, basins near the Kunlun and Altyn-Tagh mountains consistently demonstrated positive growth in groundwater storage. These variations reflect the differences in hydrological conditions, impacts of climate change, and human activities across different regions.
Water resource management in the Xinjiang region must take into account these spatial and scale differences, as well as the necessary strategic adjustments they entail. For areas where groundwater storage is most critically reduced, such as the Ili River Basin and western Tianshan, priority should be given to urgent measures to prevent further water resource depletion. In regions where groundwater resources are increasing, continued and strengthened effective water resource management practices are needed to ensure the sustainability and persistence of these positive changes.

4. Discussion

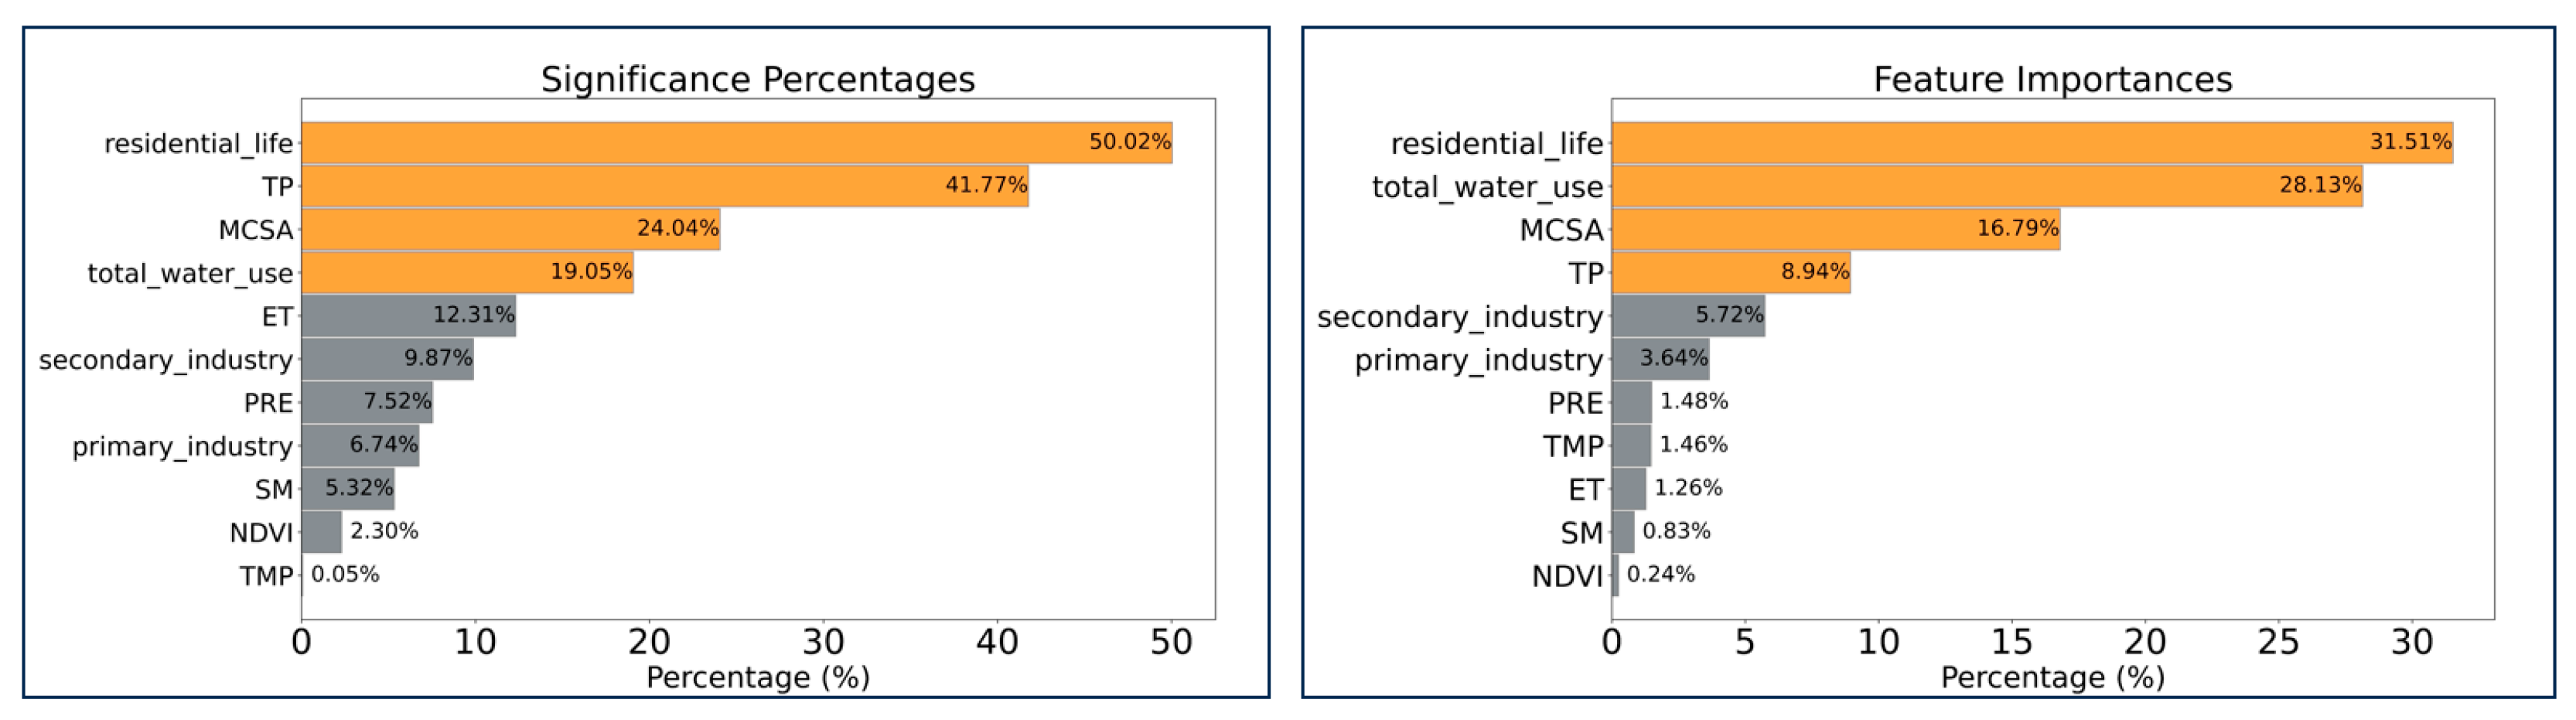
4.1. Determinants of Critical Decline in Groundwater Storage in Xinjiang’s Hotspot Areas

In Section 3, we reveal significant spatial and temporal heterogeneity in groundwater storage dynamics in Xinjiang. Against the backdrop of the alarming status of groundwater in Xinjiang, Section 4 aims to shed light on the key factors driving changes in groundwater storage. Previous studies in this paper have found that northwestern Xinjiang, especially the area around the Yili River and the western Tianshan Mountains, is the region with the most severe groundwater decline. For this reason, we focused our analysis on the most severely impacted areas of dramatic decline in the Class VI basins, where groundwater reductions are most pronounced. By concentrating on these severely affected areas, we attempt to gain a deeper understanding of the main causes affecting groundwater storage decline.
Combining these two experimental approaches, we gained a more accurate and quantified understanding of the socio-ecological factors’ impact on GWS. As shown in Figure 10, in the multiple linear regression analysis, TP (total population) achieved a significant percentage of 41.77%, while residential water use reached 50.02%, indicating their closest statistical correlation with GWS changes, followed by major crop sown area and total water use. In contrast, NDVI and TMP exhibited a relatively lower significance, at 2.30% and 0.05%, respectively. In the random forest model, the feature importance of residential water use was 31.51%, closely followed by total water use, MCSA, and TP, accounting for 28.13%, 16.79%, and 8.93%, respectively. These results underscore the significant roles of residential water use and total water demand in groundwater dynamics, while also highlighting the substantial impact of agricultural activities on groundwater resources. In conclusion, human activities are the primary cause of the reduction in groundwater storage. As the population grows, the region’s water demand continues to rise. Additionally, with economic development and lifestyle changes, the demand for water resources also increases. Therefore, to ensure the sustainability and stability of water resources in the Ili River and western Tianshan region, future resource management and policy decisions must meticulously consider these key variables and their interplay, giving due attention to the profound impact of human activities on groundwater resources.

4.2. Policy Suggestions

In this study, the changes in groundwater storage (GWS) in Xinjiang between 2003 and 2021 were carefully explored. The findings indicate a general downward trend in GWS in Xinjiang during this period, which is especially pronounced in the Yili River Basin and the region around the Tien Shan Mountains. The main drivers of this phenomenon seem to be closely related to the expansion of irrigated agriculture and population growth in the region. To gain a deeper understanding of the context of these changes, we analyzed the situation in Xinjiang in comparison with studies in other arid regions around the globe. California, for example, is also under pressure from declining groundwater reserves, largely attributed to prolonged drought and increased agricultural water demand. However, compared to Xinjiang, California’s groundwater management policies and response strategies exhibit unique characteristics and varying degrees of effectiveness, reflecting the state’s diverse efforts to address groundwater resource overexploitation, climate change impacts, and related policy implementation challenges [66]. In addition, groundwater changes in the Middle East reflect the dual impacts of climate change and anthropogenic pumping activities on groundwater resources [67]. These comparisons not only highlight the specificity of groundwater resource changes in the Xinjiang, but also reveal the common challenges faced by arid regions around the globe.
Given the current situation of groundwater resources in the Xinjiang region, we propose the following policy recommendations. First, integrated management of agricultural water resources is particularly important in the context of the arid climate of Xinjiang. Improving irrigation techniques, adjusting crop cultivation patterns, and increasing the proportion of water-saving crops are key measures to ensure the effective utilization of water resources. Second, it is crucial to strengthen the monitoring and management of groundwater resources in the Xinjiang region. It is recommended that a comprehensive groundwater monitoring network be established to monitor changes in water levels and water quality in real time through observation wells and remote sensing technology. In addition, strict norms for groundwater abstraction and use should be established, with use quotas and restrictions set for different purposes, while legal protection should be strengthened to prevent over-exploitation and pollution of groundwater resources.

4.3. Shortcomings and Prospects

The study presented in this paper provides insights into the sustainable development of groundwater resources in the Xinjiang region. However, this study is not without limitations. First, the coarser resolution of the GRACE satellite data and GLDAS model data limits the accuracy, resulting in a possible bias in groundwater storage anomaly) estimation. Second, groundwater recharge and discharge processes are complex and difficult to quantify accurately, so the effects of groundwater discharge are ignored when analyzing the determinants of groundwater storage anomaly. Incorporating GRACE satellite data into the hydrologic model could refine the parameters or states of the model. Future research efforts could enhance the modeling of interactions between surface runoff, groundwater, and anthropogenic activities to more accurately reflect hydrologic processes [33]. In addition, data assimilation or machine learning techniques by combining GRACE satellites with multisource data can be considered to improve the spatial resolution and accuracy of GWS monitoring results [68]. This advancement will help to further dissect the factors that influence groundwater storage dynamics.

5. Conclusions

From 2003 to 2021, groundwater storage (GWSA) in the Xinjiang region showed an overall decreasing trend. An in-depth analysis of the hierarchical basins reveals that the basins in Xinjiang exhibit their own unique spatial distribution characteristics in terms of groundwater changes: 1, Groundwater reserves in Xinjiang are generally on a downward trend, with more than half of the region on a slight downward trend. In addition to the continuing downward trend, inter-annual fluctuations are also large. 2, Regional differences are evident, with groundwater reserves in the basins near the Kunlun Mountains and the Altun Mountains showing an upward trend. In contrast, the decline in groundwater reserves is particularly severe in the northwestern part of the country near the Ili River and the western part of the Tianshan Mountains. 3, The areas with the most severe decline in groundwater reserves are significantly correlated with the local population growth and its increased demand for irrigated agriculture.

Author Contributions

Conceptualization, L.D. and X.C.; methodology, L.D.; software, L.D.; validation, L.D.; formal analysis, L.D; investigation, L.D. and L.B.; resources, L.D.; data curation, L.D.; writing original draft preparation, L.D.; writing—review and editing, L.D.; visualization, L.D., S.S. and C.C.; supervision, L.D.; project administration, X.C.; funding acquisition, X.C. All authors have read and agreed to the published version of the manuscript.

Funding

This work was supported by the Third Xinjiang Scientific Expedition Program (2021xjkk1300) and the Tianshan Talent Project of Xinjiang Uygur Autonomous Region, China (2022TSYCLJ0056).

Data Availability Statement

Data are contained within the article.

Conflicts of Interest

The authors declare that they have no conflicts of interest or personal relationships that might affect the work reported in this study.

Correction Statement

This article has been republished with a minor correction to resolve spelling and grammatical errors. This change does not affect the scientific content of the article.

References

  1. Sophocleous, M. Interactions between groundwater and surface water: The state of the science. Hydrogeol. J. 2002, 10, 52–67. [Google Scholar] [CrossRef]
  2. Taylor, R.G.; Scanlon, B.; Döll, P.; Rodell, M.; Van Beek, R.; Wada, Y.; Longuevergne, L.; Leblanc, M.; Famiglietti, J.S.; Edmunds, M. Ground water and climate change. Nat. Clim. Change 2013, 3, 322–329. [Google Scholar] [CrossRef]
  3. Alley, W.M.; Reilly, T.E.; Franke, O.L. Sustainability of Ground-Water Resources; US Geological Survey: Reston, VA, USA, 1999; Volume 1186.
  4. Giordano, M. Global groundwater? Issues and solutions. Annu. Rev. Environ. Resour. 2009, 34, 153–178. [Google Scholar] [CrossRef]
  5. Wang, Y.; Zheng, C.; Ma, R. Safe and sustainable groundwater supply in China. Hydrogeol. J. 2018, 5, 1301–1324. [Google Scholar] [CrossRef]
  6. El Shinawi, A.; Kuriqi, A.; Zelenakova, M.; Vranayova, Z.; Abd-Elaty, I. Land subsidence and environmental threats in coastal aquifers under sea level rise and over-pumping stress. J. Hydrol. 2022, 608, 127607. [Google Scholar] [CrossRef]
  7. Frappart, F.; Ramillien, G. Monitoring groundwater storage changes using the Gravity Recovery and Climate Experiment (GRACE) satellite mission: A review. Remote Sens. 2018, 10, 829. [Google Scholar] [CrossRef]
  8. Jia, X.; O’Connor, D.; Hou, D.; Jin, Y.; Li, G.; Zheng, C.; Ok, Y.S.; Tsang, D.C.; Luo, J. Groundwater depletion and contamination: Spatial distribution of groundwater resources sustainability in China. Sci. Total Environ. 2019, 672, 551–562. [Google Scholar] [CrossRef]
  9. Sun, S.; Tang, Q.; Konar, M.; Huang, Z.; Gleeson, T.; Ma, T.; Fang, C.; Cai, X. Domestic groundwater depletion supports China’s full supply chains. Water Resour. Res. 2022, 58, e2021WR030695. [Google Scholar] [CrossRef]
  10. Lancia, M.; Yao, Y.; Andrews, C.B.; Wang, X.; Kuang, X.; Ni, J.; Gorelick, S.M.; Scanlon, B.R.; Wang, Y.; Zheng, C. The China groundwater crisis: A mechanistic analysis with implications for global sustainability. Sustain. Horiz. 2022, 4, 100042. [Google Scholar] [CrossRef]
  11. Huang, T.; Pang, Z. Groundwater recharge and dynamics in northern China: Implications for sustainable utilization of groundwater. Procedia Earth Planet. Sci. 2013, 7, 369–372. [Google Scholar] [CrossRef]
  12. Li, M.; Xie, Y.; Dong, Y.; Wang, L.; Zhang, Z. Recent progress on groundwater recharge research in arid and semiarid areas of China. Hydrogeol. J. 2023, 32, 9–30. [Google Scholar] [CrossRef]
  13. Shao, C.; Liu, Y. Analysis of Groundwater Storage Changes and Influencing Factors in China Based on GRACE Data. Atmosphere 2023, 14, 250. [Google Scholar] [CrossRef]
  14. Xie, Y.; Huang, S.; Liu, S.; Leng, G.; Peng, J.; Huang, Q.; Li, P. GRACE-based terrestrial water storage in northwest China: Changes and causes. Remote Sens. 2018, 10, 1163. [Google Scholar] [CrossRef]
  15. Chen, Y.-n.; Li, W.-h.; Xu, C.-c.; Hao, X.-m. Effects of climate change on water resources in Tarim River Basin, Northwest China. J. Environ. Sci. 2007, 19, 488–493. [Google Scholar] [CrossRef] [PubMed]
  16. Qiu, J. China faces up to groundwater crisis. Nature 2010, 466, 308. [Google Scholar] [CrossRef] [PubMed]
  17. Zhu, J.; Yu, J.; Wang, P.; Zhang, Y.; Yu, Q. Interpreting the groundwater attributes influencing the distribution patterns of groundwater-dependent vegetation in northwestern China. Ecohydrology 2012, 5, 628–636. [Google Scholar] [CrossRef]
  18. Niu, J.; Zhu, X.-G.; Parry, M.A.; Kang, S.; Du, T.; Tong, L.; Ding, R. Environmental burdens of groundwater extraction for irrigation over an inland river basin in Northwest China. J. Clean. Prod. 2019, 222, 182–192. [Google Scholar] [CrossRef]
  19. Tangdamrongsub, N.; Steele-Dunne, S.C.; Gunter, B.C.; Ditmar, P.G.; Sutanudjaja, E.H.; Sun, Y.; Xia, T.; Wang, Z. Improving estimates of water resources in a semi-arid region by assimilating GRACE data into the PCR-GLOBWB hydrological model. Hydrol. Earth Syst. Sci. 2017, 21, 2053–2074. [Google Scholar] [CrossRef]
  20. Zhong, D.; Wang, S.; Li, J. Spatiotemporal downscaling of GRACE Total water storage using land surface model outputs. Remote Sens. 2021, 13, 900. [Google Scholar] [CrossRef]
  21. Arshad, A.; Mirchi, A.; Samimi, M.; Ahmad, B. Combining downscaled-GRACE data with SWAT to improve the estimation of groundwater storage and depletion variations in the Irrigated Indus Basin (IIB). Sci. Total Environ. 2022, 838, 156044. [Google Scholar] [CrossRef]
  22. Feng, W.; Zhong, M.; Lemoine, J.M.; Biancale, R.; Hsu, H.T.; Xia, J. Evaluation of groundwater depletion in North China using the Gravity Recovery and Climate Experiment (GRACE) data and ground-based measurements. Water Resour. Res. 2013, 49, 2110–2118. [Google Scholar] [CrossRef]
  23. Boergens, E.; Güntner, A.; Dobslaw, H.; Dahle, C. Quantifying the Central European droughts in 2018 and 2019 with GRACE Follow-On. Geophys. Res. Lett. 2020, 47, e2020GL087285. [Google Scholar] [CrossRef]
  24. Han, S.-C.; Ghobadi-Far, K.; Yeo, I.-Y.; McCullough, C.M.; Lee, E.; Sauber, J. GRACE Follow-On revealed Bangladesh was flooded early in the 2020 monsoon season due to premature soil saturation. Proc. Natl. Acad. Sci. USA 2021, 118, e2109086118. [Google Scholar] [CrossRef] [PubMed]
  25. Landerer, F.W.; Flechtner, F.M.; Save, H.; Webb, F.H.; Bandikova, T.; Bertiger, W.I.; Bettadpur, S.V.; Byun, S.H.; Dahle, C.; Dobslaw, H. Extending the global mass change data record: GRACE Follow-On instrument and science data performance. Geophys. Res. Lett. 2020, 47, e2020GL088306. [Google Scholar] [CrossRef]
  26. Yin, W.; Hu, L.; Jiao, J.J. Evaluation of groundwater storage variations in Northern China using GRACE data. Geofluids 2017, 2017, 8254824. [Google Scholar] [CrossRef]
  27. Feng, W.; Shum, C.; Zhong, M.; Pan, Y. Groundwater storage changes in China from satellite gravity: An overview. Remote Sens. 2018, 10, 674. [Google Scholar] [CrossRef]
  28. Nixdorf, E. Combining Measurements, Remote Sensing and Numerical Modelling to Assess Multi-Scale Flow Dynamics in Groundwater-Dependent Environmental Systems. 2018. Available online: https://core.ac.uk/download/pdf/236377026.pdf (accessed on 4 January 2024).
  29. Wickel, B.; Lehner, B.; Sindorf, N. HydroSHEDS: A global comprehensive hydrographic dataset. In AGU Fall Meeting Abstracts; Center for Astrophysics: Cambridge, MA, USA, 2007; p. H11H-05. [Google Scholar]
  30. Lehner, B.; Grill, G. Global river hydrography and network routing: Baseline data and new approaches to study the world’s large river systems. Hydrol. Process. 2013, 27, 2171–2186. [Google Scholar] [CrossRef]
  31. Lin, M.; Biswas, A.; Bennett, E.M. Spatio-temporal dynamics of groundwater storage changes in the Yellow River Basin. J. Environ. Manag. 2019, 235, 84–95. [Google Scholar] [CrossRef]
  32. Lin, M.; Biswas, A.; Bennett, E.M. Socio-ecological determinants on spatio-temporal changes of groundwater in the Yellow River Basin, China. Sci. Total Environ. 2020, 731, 138725. [Google Scholar] [CrossRef]
  33. Zhao, K.; Fang, Z.; Li, J.; He, C. Spatial-temporal variations of groundwater storage in China: A multiscale analysis based on GRACE data. Resour. Conserv. Recycl. 2023, 197, 107088. [Google Scholar] [CrossRef]
  34. Cheng, W.; Chai, H.; Zhou, C.; Chen, X. The spatial distribution patterns of digital geomorphology in Xinjiang. Geogr. Res. 2009, 28, 1157–1169. [Google Scholar]
  35. Dong, T.; Liu, J.; Liu, D.; He, P.; Li, Z.; Shi, M.; Xu, J. Spatiotemporal variability characteristics of extreme climate events in Xinjiang during 1960–2019. Environ. Sci. Pollut. Res. 2023, 30, 57316–57330. [Google Scholar] [CrossRef] [PubMed]
  36. Khan, A.A.; Yuanjie, Z.; Khan, J.; Rahman, G.; Rafiq, M. Spatio-temporal Fluctuation of Temperature Using Specific Climate Indices in South Xinjiang, China. Ecol. Quest. 2023, 34, 1–30. [Google Scholar]
  37. Zhang, Q.; Singh, V.P.; Li, J.; Jiang, F.; Bai, Y. Spatio-temporal variations of precipitation extremes in Xinjiang, China. J. Hydrol. 2012, 434, 7–18. [Google Scholar] [CrossRef]
  38. Xu, C.; Chen, Y.; Yang, Y.; Hao, X.; Shen, Y. Hydrology and water resources variation and its response to regional climate change in Xinjiang. J. Geogr. Sci. 2010, 20, 599–612. [Google Scholar] [CrossRef]
  39. Han, Y.; Jia, S. An assessment of the water resources carrying capacity in Xinjiang. Water 2022, 14, 1510. [Google Scholar] [CrossRef]
  40. Tapley, B.D.; Bettadpur, S.; Ries, J.C.; Thompson, P.F.; Watkins, M.M. GRACE measurements of mass variability in the Earth system. science 2004, 305, 503–505. [Google Scholar] [CrossRef] [PubMed]
  41. Lan, Z.; Wenke, S. Progress and prospect of GRACE Mascon product and its application. Rev. Geophys. Planet. Phys. 2022, 53, 35–52. [Google Scholar]
  42. Yin, Z.; Xu, Y.; Zhu, X.; Zhao, J.; Yang, Y.; Li, J. Variations of groundwater storage in different basins of China over recent decades. J. Hydrol. 2021, 598, 126282. [Google Scholar] [CrossRef]
  43. Shamsudduha, M.; Taylor, R.; Longuevergne, L. Monitoring groundwater storage changes in the highly seasonal humid tropics: Validation of GRACE measurements in the Bengal Basin. Water Resour. Res. 2012, 48, w02508. [Google Scholar] [CrossRef]
  44. Syed, T.H.; Famiglietti, J.S.; Rodell, M.; Chen, J.; Wilson, C.R. Analysis of terrestrial water storage changes from GRACE and GLDAS. Water Resour. Res. 2008, 44, w02433. [Google Scholar] [CrossRef]
  45. Xie, J.; Xu, Y.-P.; Wang, Y.; Gu, H.; Wang, F.; Pan, S. Influences of climatic variability and human activities on terrestrial water storage variations across the Yellow River basin in the recent decade. J. Hydrol. 2019, 579, 124218. [Google Scholar] [CrossRef]
  46. Rodell, M.; Houser, P.; Jambor, U.; Gottschalck, J.; Mitchell, K.; Meng, C.-J.; Arsenault, K.; Cosgrove, B.; Radakovich, J.; Bosilovich, M. The global land data assimilation system. Bull. Am. Meteorol. Soc. 2004, 85, 381–394. [Google Scholar] [CrossRef]
  47. Zhong, Y.; Zhong, M.; Feng, W.; Zhang, Z.; Shen, Y.; Wu, D. Groundwater depletion in the West Liaohe River Basin, China and its implications revealed by GRACE and in situ measurements. Remote Sens. 2018, 10, 493. [Google Scholar] [CrossRef]
  48. Feng, W.; WANG, C.-Q.; MU, D.-P.; ZHONG, M.; ZHONG, Y.-L.; XU, H.-Z. Groundwater storage variations in the North China Plain from GRACE with spatial constraints. Chin. J. Geophys. 2017, 60, 1630–1642. [Google Scholar]
  49. Gao, Z.; Zhang, L.; Cheng, L.; Zhang, X.; Cowan, T.; Cai, W.; Brutsaert, W. Groundwater storage trends in the Loess Plateau of China estimated from streamflow records. J. Hydrol. 2015, 530, 281–290. [Google Scholar] [CrossRef]
  50. Müller Schmied, H.; Cáceres, D.; Eisner, S.; Flörke, M.; Herbert, C.; Niemann, C.; Peiris, T.A.; Popat, E.; Portmann, F.T.; Reinecke, R. The global water resources and use model WaterGAP v2. 2d: Model description and evaluation. Geosci. Model Dev. 2021, 14, 1037–1079. [Google Scholar] [CrossRef]
  51. Shouzhang, P. 1-km Monthly Precipitation Dataset for China (1901–2021). A Big Earth Data Platform for Three Poles. 2020. Available online: https://poles.tpdc.ac.cn/zh-hans/data/faae7605-a0f2-4d18-b28f-5cee413766a2/ (accessed on 21 October 2023).
  52. Shouzhang, P. 1-Km Monthly Mean Temperature Dataset for China (1901–2021). A Big Earth Data Platform for Three Poles. 2019. Available online: https://poles.tpdc.ac.cn/zh-hans/data/71ab4677-b66c-4fd1-a004-b2a541c4d5bf/ (accessed on 21 October 2023).
  53. Chen, J.; Famigliett, J.S.; Scanlon, B.R.; Rodell, M. Groundwater storage changes: Present status from GRACE observations. Remote Sens. Water Resour. 2016, 55, 207–227. [Google Scholar]
  54. Yi, H.; Wen, L. Satellite gravity measurement monitoring terrestrial water storage change and drought in the continental United States. Sci. Rep. 2016, 6, 19909. [Google Scholar] [CrossRef]
  55. Sun, Q. GRACE and GLDAS Data-based Estimation of Spatial Variations in Terrestrial Water Variations over Xinjiang. Ph.D. Thesis, Xinjiang University, Ürümqi, China, 2015. (In Chinese). [Google Scholar]
  56. Hu, Z.; Zhou, Q.; Chen, X.; Chen, D.; Li, J.; Guo, M.; Yin, G.; Duan, Z. Groundwater depletion estimated from GRACE: A challenge of sustainable development in an arid region of Central Asia. Remote Sens. 2019, 11, 1908. [Google Scholar] [CrossRef]
  57. Chen, Z.; Jiang, W.; Wu, J.; Chen, K.; Deng, Y.; Jia, K.; Mo, X. Detection of the spatial patterns of water storage variation over China in recent 70 years. Sci. Rep. 2017, 7, 6423. [Google Scholar] [CrossRef] [PubMed]
  58. Theodosiou, M. Forecasting monthly and quarterly time series using STL decomposition. Int. J. Forecast. 2011, 27, 1178–1195. [Google Scholar] [CrossRef]
  59. Gocic, M.; Trajkovic, S. Analysis of changes in meteorological variables using Mann-Kendall and Sen’s slope estimator statistical tests in Serbia. Glob. Planet. Change 2013, 100, 172–182. [Google Scholar] [CrossRef]
  60. Zhang, J.; Liu, K.; Wang, M. Seasonal and interannual variations in China’s groundwater based on GRACE data and multisource hydrological models. Remote Sens. 2020, 12, 845. [Google Scholar] [CrossRef]
  61. Wang, J.; Chen, X.; Hu, Q.; Liu, J. Responses of terrestrial water storage to climate variation in the Tibetan Plateau. J. Hydrol. 2020, 584, 124652. [Google Scholar] [CrossRef]
  62. Jyolsna, P.; Kambhammettu, B.; Gorugantula, S. Application of random forest and multi-linear regression methods in downscaling GRACE derived groundwater storage changes. Hydrol. Sci. J. 2021, 66, 874–887. [Google Scholar] [CrossRef]
  63. De Livera, A.M.; Hyndman, R.J.; Snyder, R.D. Forecasting time series with complex seasonal patterns using exponential smoothing. J. Am. Stat. Assoc. 2011, 106, 1513–1527. [Google Scholar] [CrossRef]
  64. Wang, H.; Yang, F.; Luo, Z. An experimental study of the intrinsic stability of random forest variable importance measures. BMC Bioinform. 2016, 17, 60. [Google Scholar] [CrossRef]
  65. Ministry of Water Resources of the People’s Republic of China. 2023 Comprehensive Management Plan for Overextraction of Groundwater in Key Areas of the 14th Five Year Plan. Available online: https://www.gov.cn/xinwen/2023-03/03/content_5744390.htm (accessed on 4 January 2024). (In Chinese)
  66. Quandt, A.; O’Shea, B.; Oke, S.; Ololade, O.O. Policy interventions to address water security impacted by climate change: Adaptation strategies of three case studies across different geographic regions. Front. Water 2022, 4, 935422. [Google Scholar] [CrossRef]
  67. Wu, W.-Y.; Lo, M.-H.; Wada, Y.; Famiglietti, J.S.; Reager, J.T.; Yeh, P.J.-F.; Ducharne, A.; Yang, Z.-L. Divergent effects of climate change on future groundwater availability in key mid-latitude aquifers. Nat. Commun. 2020, 11, 3710. [Google Scholar] [CrossRef]
  68. Yin, W.; Zhang, G.; Han, S.-C.; Yeo, I.-Y.; Zhang, M. Improving the resolution of GRACE-based water storage estimates based on machine learning downscaling schemes. J. Hydrol. 2022, 613, 128447. [Google Scholar] [CrossRef]
Figure 1. Geographic Location of Xinjiang.
Remotesensing 16 00813 g001
Figure 2. DEM of Xinjiang.
Remotesensing 16 00813 g002
Figure 3. Distribution of groundwater level monitoring points.
Remotesensing 16 00813 g003
Figure 4. Xinjiang’s HydroBASINS vector dataset.
Remotesensing 16 00813 g004
Figure 5. Flow chart.
Remotesensing 16 00813 g005
Figure 6. Annual GWSA in Xinjiang from 2003 to 2021.
Remotesensing 16 00813 g006
Figure 7. Time Series of GWSA in Xinjiang from 2003 to 2021.
Remotesensing 16 00813 g007
Figure 8. Classification of average annual rates of change in GWSA, 2003–2021.
Remotesensing 16 00813 g008
Figure 9. Basin Proportion Grouped Bar Chart and Pixel Proportion Grouped Bar Chart.
Remotesensing 16 00813 g009
Figure 10. Significant Percentage of Variables and Feature Contribution of Variables in RF Model.
Remotesensing 16 00813 g010
Table 1. Classification of rates of spatial and temporal change in groundwater storage.
ClassificationRange
Rapid increase>10
Increase5–10
Moderate increase0–5
Moderate decrease−10–0
Rapid decrease−20–−10
Dramatic decrease<−20
Table 2. Correlation Coefficient between GWSA and GWLA.
Correlation Coefficient IntervalNumber of Sites
0.00–0.251
0.26–0.5017
0.52–0.7510
0.76–1.03
Average value0.488
Disclaimer/Publisher’s Note: The statements, opinions and data contained in all publications are solely those of the individual author(s) and contributor(s) and not of MDPI and/or the editor(s). MDPI and/or the editor(s) disclaim responsibility for any injury to people or property resulting from any ideas, methods, instructions or products referred to in the content.

