Article

Evolution of Wetland Patterns and Key Driving Forces in China’s Drylands

1
Key Laboratory of Mountain Surface Processes and Ecological Regulation, Institute of Mountain Hazards and Environment, Chinese Academy of Sciences, Chengdu 610299, China
2
School of Geography and Resources Science, Sichuan Normal University, Chengdu 610101, China
3
School of Ecology and Environment, Xinjiang University, Urumqi 830046, China
*
Author to whom correspondence should be addressed.
Remote Sens. 2024, 16(4), 702; https://doi.org/10.3390/rs16040702
Submission received: 1 December 2023 / Revised: 11 February 2024 / Accepted: 13 February 2024 / Published: 17 February 2024
(This article belongs to the Special Issue Remote Sensing Applications in Monitoring of Protected Areas II)

Abstract

:
Wetlands within dryland regions are highly sensitive to climate change and human activities. Based on three types of land use data sources from satellite images and a spatial data analysis, the spatiotemporal characteristics of wetland evolution in China’s drylands and their relationship with human interference and climate change from 1990 to 2020 were analyzed. The results were as follows: (1) The wetlands within China’s drylands expanded, including rivers, lakes, and artificial wetlands, apart from marshes, which shrunk. Meanwhile, wetland fragmentation increased, with rivers being particularly severely fragmented. (2) Temperature and precipitation showed an increasing trend from 1990 to 2020 in China’s drylands. Lakes and rivers expanded with regional differences due to the uneven distribution of precipitation and rising temperature. (3) Human activities, more than climate change, became the key driving factor for the changes in wetland patterns in China’s drylands. The increased areas of farmland and grassland along with increased levels of drainage and irrigation activities led to the shrinkage of marshes and the fragmentation of rivers. The increase in the number of artificial reservoirs was the main reason for the expansion of artificial wetlands. This study clarifies the specific driving factors of different types of wetlands within China’s drylands, which is of great use for better protecting wetlands and the gradual restoration of degraded wetlands.

1. Introduction

Wetlands are widely distributed all over the world and have an irreplaceable role in maintaining the global ecosystem, functioning as one of the most essential human living environments. Globally, wetlands cover an area of 12.10 × 10⁶ km2, or about 8% of the total land area [1]. However, with global climate change and rapid socio-economic development in recent years, wetlands have been undergoing drastic changes, with more than half of them having disappeared globally since the Industrial Revolution [2]. The pattern of China’s wetlands is no exception, having changed dramatically. Specifically, the overall area of wetlands has decreased from 4.11 × 10⁵ km2 in the 1980s to 2.14 × 10⁵ km2 in 2010 [3], with almost half of the wetland area having disappeared. Ecological problems in wetlands, such as broken rivers, shrinking lakes, and degraded vegetation, are prominent, and ecological patterns in wetlands have been significantly affected. Therefore, to protect and restore wetlands more effectively and carry out comprehensive protection measures for wetlands, it is critical to investigate the evolutionary aspects of wetland patterns as well as their driving forces.
Many academics have investigated the landscape pattern of wetlands in recent years, analyzing the spatiotemporal changes in their properties and distribution patterns. Indeed, wetland pattern traits, shifting patterns, and driving forces have been widely studied [4,5,6,7]. In the past, most of the research data on wetlands had to be obtained through field surveys, which took a long time and made it difficult to obtain research data [8]. Since then, the emergence of the ‘3s’ (RS, GPS, and GIS) technologies has facilitated the research of wetland changes at large scales and over long time series [9]. Landsat series data and land use data products have been widely used in the evolution of wetlands [10,11,12]. Furthermore, model-based quantitative analyses, such as the dynamic attitude model [13], land use transfer matrix [14], and landscape pattern index [15], have rapidly become the main method for investigating the spatial and temporal dynamics of wetlands. Among them, wet zones [16,17] and coastal areas [18,19,20] have received the most attention, while there is a comparative lack of research globally on wetlands within dryland regions.
Drylands are areas where ecosystems are water-stressed, soils are generally infertile, and vegetation cover is minimal. At present, they comprise around 40% of the earth’s surface and are inhabited by over one-third of the global population [21,22]. Wetlands within drylands are of great value in ecological conservation and utilization. They are important water conservation areas for large rivers, with various functions such as regulating the climate, storing water resources, and providing habitats for rare plants and animals [23]. Wetland ecosystems within drylands, due to their special geographic locations, have formed unique landforms, vegetation, and soil types, and belong to important ecologically fragile regions that can be hard to recover once damaged [24]. As a result, it is critical to comprehend the evolution dynamics of wetlands within drylands, design conservation strategies for the wise use of limited wetland resources, and preserve the ecological environment’s development. In the context of global warming and declining precipitation, extreme drought events are occurring more frequently, increasing the challenges and uncertainties for dryland ecosystems [25,26,27]. Prior studies have found that the depletion rate of wetlands in drylands has been around 10% greater than the global average in recent decades [28]. Wetland degradation and loss, as well as biodiversity loss, are increasing at an alarming rate in Ethiopia [29]. Also, from 1983 to 2019, the wetland area of Maungani, South Africa, decreased by 7283 km2 [30].
Climate change, as well as increasing population pressure and excessive human activities, have altered the water cycle in dryland watersheds, resulting in large spatial and temporal variations in wetland patterns and changes in fragile ecosystems. Furthermore, the size and other ecological characteristics of wetlands vary widely, as do their resilience to climate change and anthropogenic perturbations [31]. Wetlands experienced a significant decline within Southeastern Australian drylands during the so-called millennial drought (2001–2009) as the region suffered its driest period since 1900, with negative consequences for its wetlands [32]. North African Ramsar wetlands suffered a lot of losses from 1980 to 2018 because of severe warming and more intense droughts. Aside from climate change, human activities such as agriculture, urbanization, and other built-up land uses influence the decrease in wetlands in North Africa [33]. The wetlands in the Fetam River catchment, Amhara National Regional State, Ethiopia, declined by 27.90% from 1985 to 2020, with farmland expansion being the main driver of wetland decline; overgrazing and crop production shifts prompted by market opportunities have aggravated this problem [34].
Therefore, just like in other countries, analyzing the evolution of wetlands within drylands and their drivers in China is crucial for wetland management. Accordingly, the objectives of this research were (1) to characterize in detail the temporal and spatial alterations of wetland patterns in China’s drylands from 1990 to 2020; and (2) to comparatively analyze the key drivers of the changes in wetland patterns. Achieving these objectives would be of great significance for elucidating the specific driving mechanisms of the evolution of wetland patterns and thereby gradually restoring degraded wetlands.

2. Data Sources and Methods
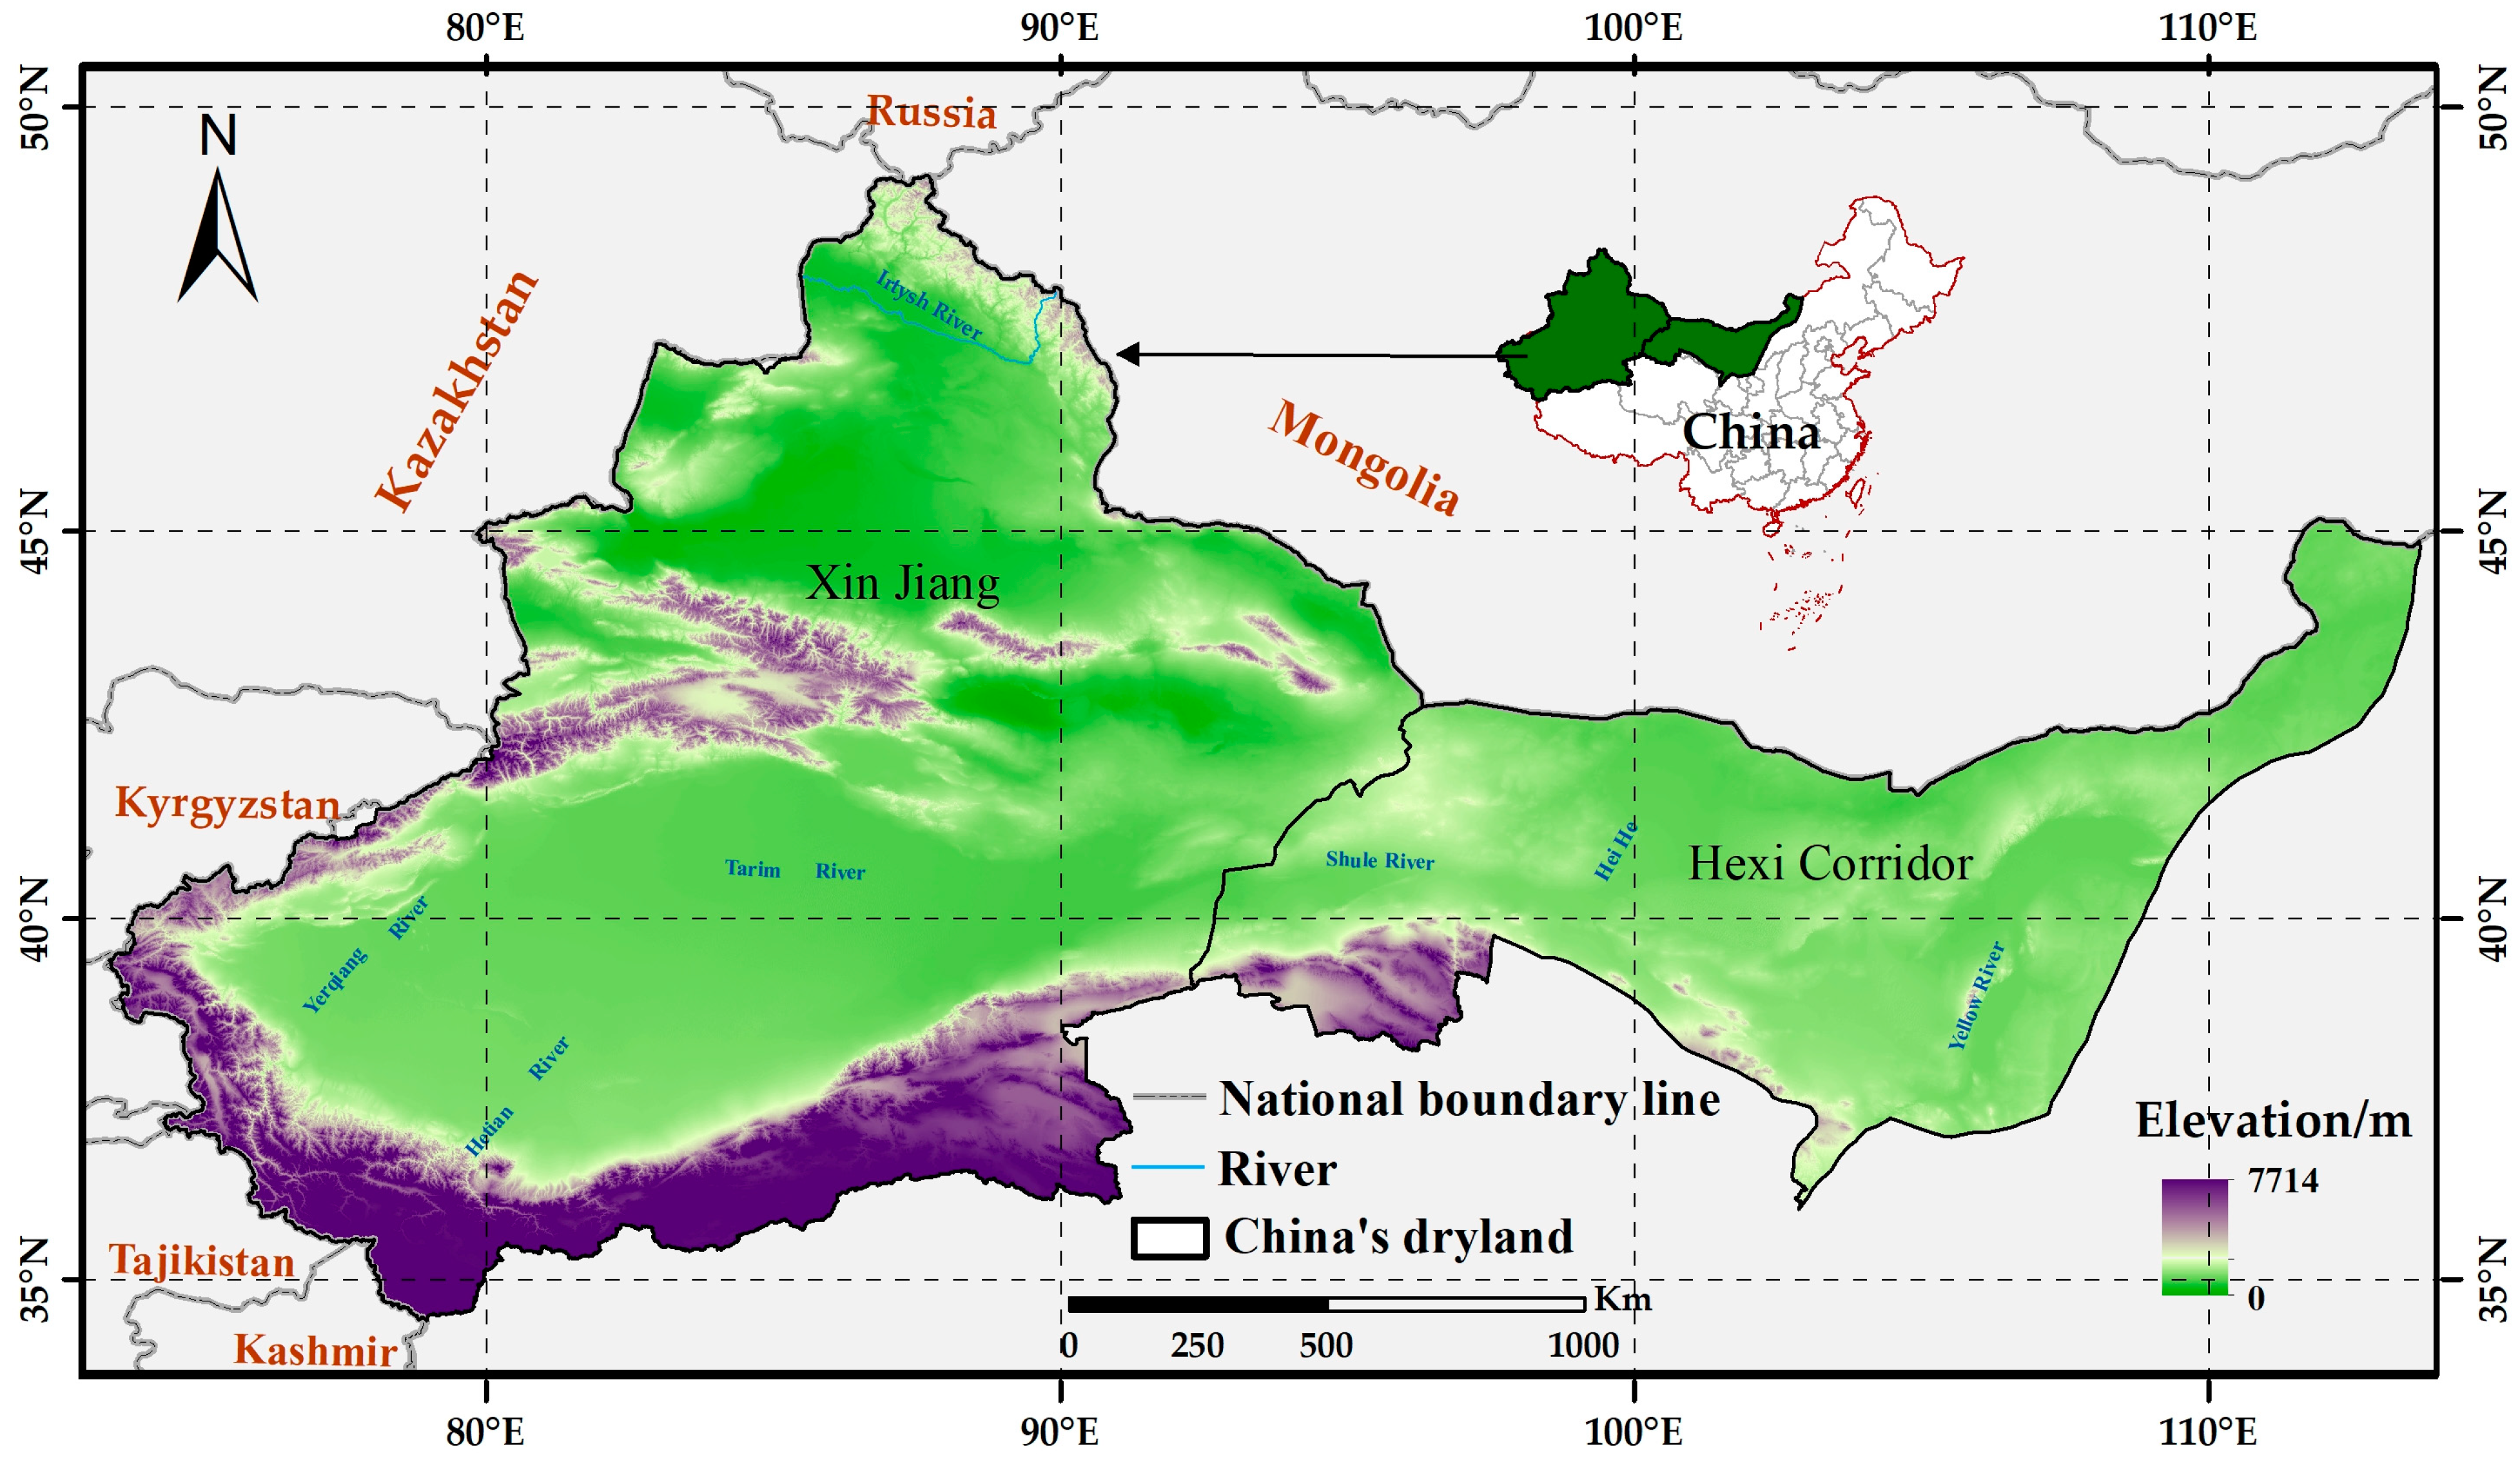
2.1. Study Area

China’s drylands are located in Northern China, including Xinjiang (XJ) and the Hexi Corridor Region (HCR). The total area is about 2.31 × 10⁶ km2, which is about 22.08% of the total area of China (Figure 1). The average annual precipitation in China’s drylands is 304 mm, which is usually much lower than the annual potential evapotranspiration (814.90 mm), with high interannual precipitation variability [35]. The special geomorphology of China’s drylands allows rivers originating in high mountainous areas to form centripetal water systems, distributed in a dendritic pattern, resulting in the formation of many isolated inland wetlands. With reference to the classification system from a convention on wetlands [36], wetlands in China’s drylands were divided into four types in this study: lakes, rivers, marshes, and artificial wetlands.

2.2. Data Sources

The data sources used in China’s drylands included the Multi-period Land Use Remote Sensing Monitoring Data Set (CN_LUCC) [37], Global Surface Cover Remote Sensing Data (GlobeLand30_LUCC) [38], and the Annual China Land Cover Dataset (CLCD_LUCC) [39] from 1990 to 2020. All three types of land use datasets were decoded using Landsat series data. Among them, CN_LUCC is a combination of human–computer interactions and visual interpretation methods to obtain data sets, which have a long time span, good level of data accuracy, and relatively high levels of precision after zooming in [40]. Thus, it is appropriate for important long-term time series investigations, and it has been widely utilized throughout China [41,42]. GlobeLand30_LUCC was retrieved using pixel-object knowledge (POK-based) classification. Its accuracy in global dryland [43], the European Union [44], and other regions is estimated to be above 85% and it has a high degree of consistency with related datasets. Many researchers have used it to analyze the distribution of and changes in various land cover types [45,46]. CLCD_LUCC decodes land use using GEE-based random forest classifier. Its total accuracy is 79.31% [39], and it has been demonstrated to be effective in studying many regions of China [47,48,49].
Based on the three types of data sources, this study uses ArcGIS 10.6 to extract wetlands in China’s drylands, because CN_LUCC is more appropriate for long-term time-series surveys in China. Its wetland classification is refined to the second level, which covers lakes, rivers, marshes, and reservoirs/pits, in line with the classification utilized in this study. Thus, CN_LUCC was utilized as our primary data to research the wetlands in China’s drylands, while GlobeLand30_LUCC and CLCD_LUCC were used as validation data to confirm the trend of the total area of wetlands in China’s drylands derived from CN_LUCC. The 1 km resolution monthly average precipitation [50] and temperature [51] datasets of China from 1990 to 2020 were used to analyze climate changes (Table 1).

2.3. Wetland Area Evolution

Regarding wetland area changes, the changes in wetland area in China’s drylands were first analyzed utilizing three types of data sources. Later, the change in wetland area in four types of wetlands was analyzed using CN_LUCC. In this study, the rate of change in wetland area was used to reveal the change in wetlands. The formula is as follows [52]:
R A C = E A I A I A × 100 % ,
where EA is the wetland area at the end of the study period, and I is the initial wetland area in the study period.
Regarding spatial dynamic change in wetlands, based on CN_LUCC, the spatial dynamic changes in wetlands in China’s drylands from 1990 to 2020 were analyzed and plotted. The methods for mapping the spatial dynamics of wetlands are shown in the Supplementary Materials, Method S1.

2.4. Land Use Transfer Matrix

The quantity and structural features of various land use types in a specific time interval can be fully and conclusively reflected in the land use transfer matrix [53]. In this study, we analyzed the wetland transfer in China’s drylands between 1990 and 2020 using CN_LUCC. The calculation formula is as follows:
S ij = S 11 S 12 S 1 n S 21 S 22 S 2 n         S n 1 S n 2 S n n ,
where S is the area; i and j denote the land use types at the start and end of the study period, respectively; Sij is the converted area of land class i to land class j; and n is the total number of land use types.

2.5. Landscape Indices

The landscape indices are simple quantitative indicators used to characterize the wetlands’ structural composition and spatial arrangement. Furthermore, to better understand the evolutionary aspects of wetland patterns in China’s drylands, this study selected four indices that can best reflect the characteristics of wetland pattern change: number of patches (NP), patch density (PD), landscape shape index (LSI), and aggregation index (AI) [54,55]. Fragstats 4.2 was used to calculate the wetlands as well as each type of wetland pattern index in China’s drylands from 1990 to 2020, using CN_LUCC.
According to relevant studies, the size of the moving window affects the stability of landscape indices and the integrity of spatial information. The moving window method in Fragstats 4.2 was used to obtain the distribution characteristics for each landscape index, utilizing a 2000 m moving window [56,57].

2.6. Linear Trend Analysis

To characterize the temporal changes in and intensities of meteorological elements in China’s drylands from 1990 to 2020, pixel by pixel, we employed the unitary linear regression method based on the least squares approach. This method comprehensively integrates the meteorological data from each year from 1990 to 2020 [58]. Matlab-based unitary linear regression and significance test codes for raster data were collected. Each grid point’s trend and significance raster images were obtained by iterating over the climate raster data pixel by pixel. According to a report in Nature Human Behavior [59], even if the p-value is more than 0.05, we should avoid using absolute descriptions and instead use “rarely” to describe the circumstance. As a result, “slight increase” and “slight decrease” are used to describe the trend of climate change. The results were classified into five categories:
  • Basically stable (θSlope = 0, p < 0.05);
  • Significantly increasing (θSlope > 0, p < 0.05);
  • Slightly increasing (θSlope > 0, p > 0.05);
  • Significantly decreasing (θSlope < 0, p < 0.05);
  • Slightly decreasing (θSlope < 0, p > 0.05).
The unitary linear regression method calculation formula is as follows:
θ Slope = n × i = 1 n i × Q i ( i = 1 n i ) × ( i = 1 n Q i ) n × i = 1 n i 2 ( i = 1 n i ) 2 ,
where θSlope is the trend of the climatic factor; n denotes the number of years studied; and Qi denotes the meteorological element value of year i.

2.7. Human Disturbance Index

The main concept of the human disturbance index (HDI) was derived from the comprehensive index model of land use extent, which used land use remote sensing monitoring data to determine the quantitative relationship between human activities and the ecological environment [60]. Based on the wetlands in China’s drylands in 2020 taken from the CN_LUCC, this study established a 10 km buffer zone, and land use data for 1990–2020 were extracted based on this range. The HDI model was used to analyze the impacts of human activities on wetland dynamics in China’s drylands from 1990 to 2020.
The degree of anthropogenic disturbance in China’s drylands was defined and determined primarily by the degree of disturbance by human activities to land use types. Based on previous research [61,62,63] and the current situation in the study area, land use types (e.g., construction land, farmland, and paddy fields) with greater interference by human activities have a higher defined interference index, and vice versa; the results are shown in Table 2. Then, in ArcGIS 10.6, we utilized the ‘build fishnet’ feature to generate a grid of 2 km by 2 km as the assessment unit. Following that, based on Table 2, the disturbance coefficients of different land use/land cover (LULC) types were assigned, and the HDI of each grid unit could be calculated as follows. ArcGIS was used to conduct statistical analysis and determine an average value for each year, and the spatial variations in HDI between 1990 and 2020 were obtained using ArcGIS10.6 “Raster calculator”. The calculation formula of HDI is as follows [64]:
HDI = i = 0 n A i / A j × P i ,
where HDI is the intensity of human disturbance in a single grid unit; Pi denotes the coefficient of interference for type i land use; Ai denotes the area of type i land use in the grid; Aj is the area of the grid; and n denotes that there are n land use types in the grid.

2.8. Pearson Correlation Analysis

There was statistical significance in the correlation coefficients between the HDI, climate factors, and wetland pattern indices. In this study, we used Matlab 2023 to determine whether there was a correlation and if so, the magnitude of the correlation, between pairs of variables in each grid unit. We found Matlab codes for correlation analysis and conducted significance testing of time series raster data. Correlation analyses of precipitation, temperature, HDI, and wetland pattern indices from 1990 to 2020 were carried out individually, with the 2020 wetland in China’s drylands serving as the boundary. The Supplementary Materials (Method S2) shows the statistical approaches used to analyze the results. The formula is as follows [58,65]:
R = i = 1 n ( x i x ¯ ) ( y i y ¯ ) i = 1 n ( x i x ¯ ) 2 i = 1 n ( y i y ¯ ) 2
where R is the Pearson correlation coefficient between variables x and y, having a value ranging from −1 to 1; n is the sample size; xi denotes the value of the landscape pattern index in year i; yi denotes the climate factors or HDI in year i; and x and y are the means of the two variables, respectively.
The research methodology flowchart of this study is illustrated in Figure 2.

3. Results

3.1. Analysis of Wetland Pattern Changes

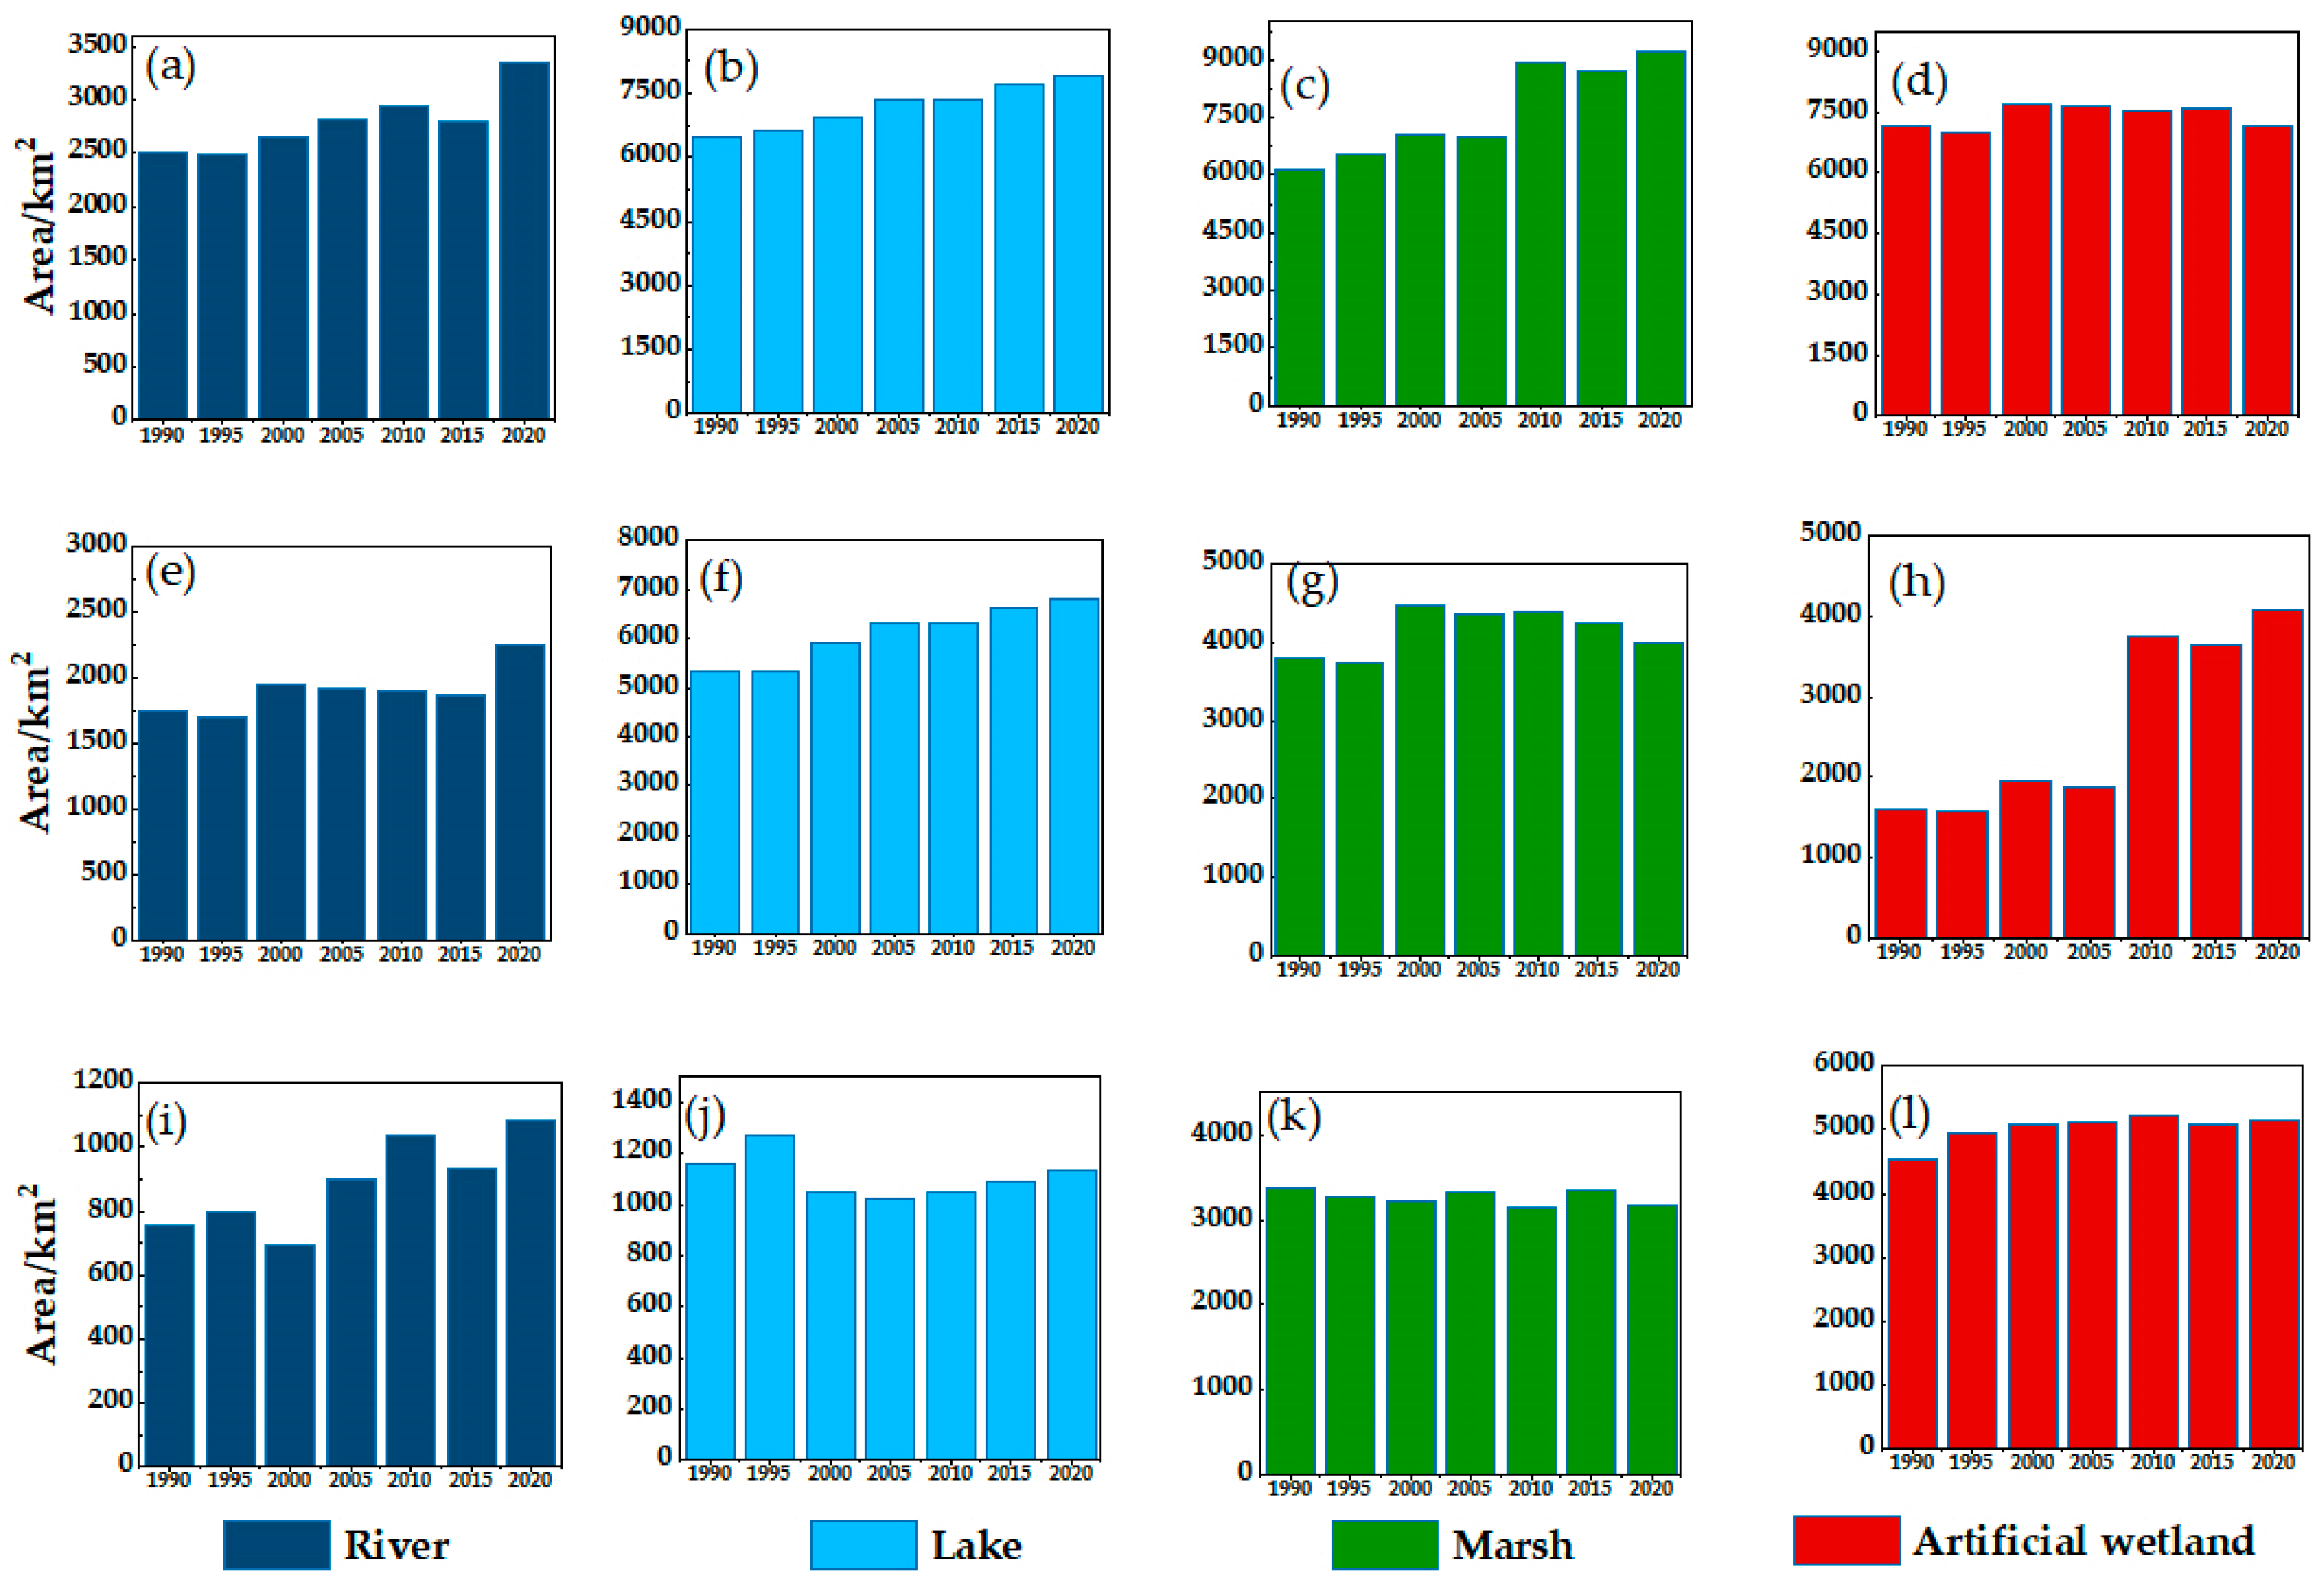
3.1.1. Evolutionary Characteristics

The spatial distribution of wetlands within China’s drylands (Figure 3) shows obvious discontinuities and a relatively small area, and the distribution of wetlands has a close connection with the watershed water system. Marshes were the main type of wetlands within China’s drylands, accounting for 34.38%, followed by lakes, which account for 32.14% of the total wetland area. Artificial wetlands, including paddy fields and reservoirs/pits, accounted for 24.39% of the total wetland area. Rivers accounted for only 9.10% of the total wetland area (Figure 3b).
The three datasets all showed that the wetland area within China’s drylands had an increasing trend from 1990 to 2020, and based on the CN_LUCC analysis, the total wetland area increased by 24.26% (Figure 4a). In XJ and the HCR, the wetland area had a trend of continuous expansion; based on the CN_LUCC analysis, wetlands in XJ increased by 39.63% and wetlands in the HCR increased by 7.56%. There was a wide range of spatial variation in the wetlands within China’s drylands (Figure 4b,c), with wetland expansion mainly taking place in the vicinity of lakes in XJ and in the central Yellow River Basin (Figure 4b), and wetland shrinkage occurring mainly in river basins (Figure 4c).
The area of rivers, lakes, and artificial wetlands within China’s drylands all increased (Figure 5a–d), among which the area of artificial wetlands increased the most, with an increase of 50.89% in 2020 compared to 1990, followed by rivers with an increase of 33.61% and lakes with an increase of 22.14%. There was no significant change in marshes from 1990 and 2020; however, there was a 7.08% decrease from 2000 to 2020. The changes in the four types of wetlands in XJ (Figure 5e–h) were consistent with those in the wetlands within China’s dryland; the areas of rivers, lakes, and artificial wetlands increased from 1990 to 2020, whereas marshes decreased by 10.78% from 2000 to 2020. In the HCR (Figure 5i–l), the area of rivers and artificial wetlands increased; however, marshes and lakes decreased by 5.77% and 2.41%, respectively.

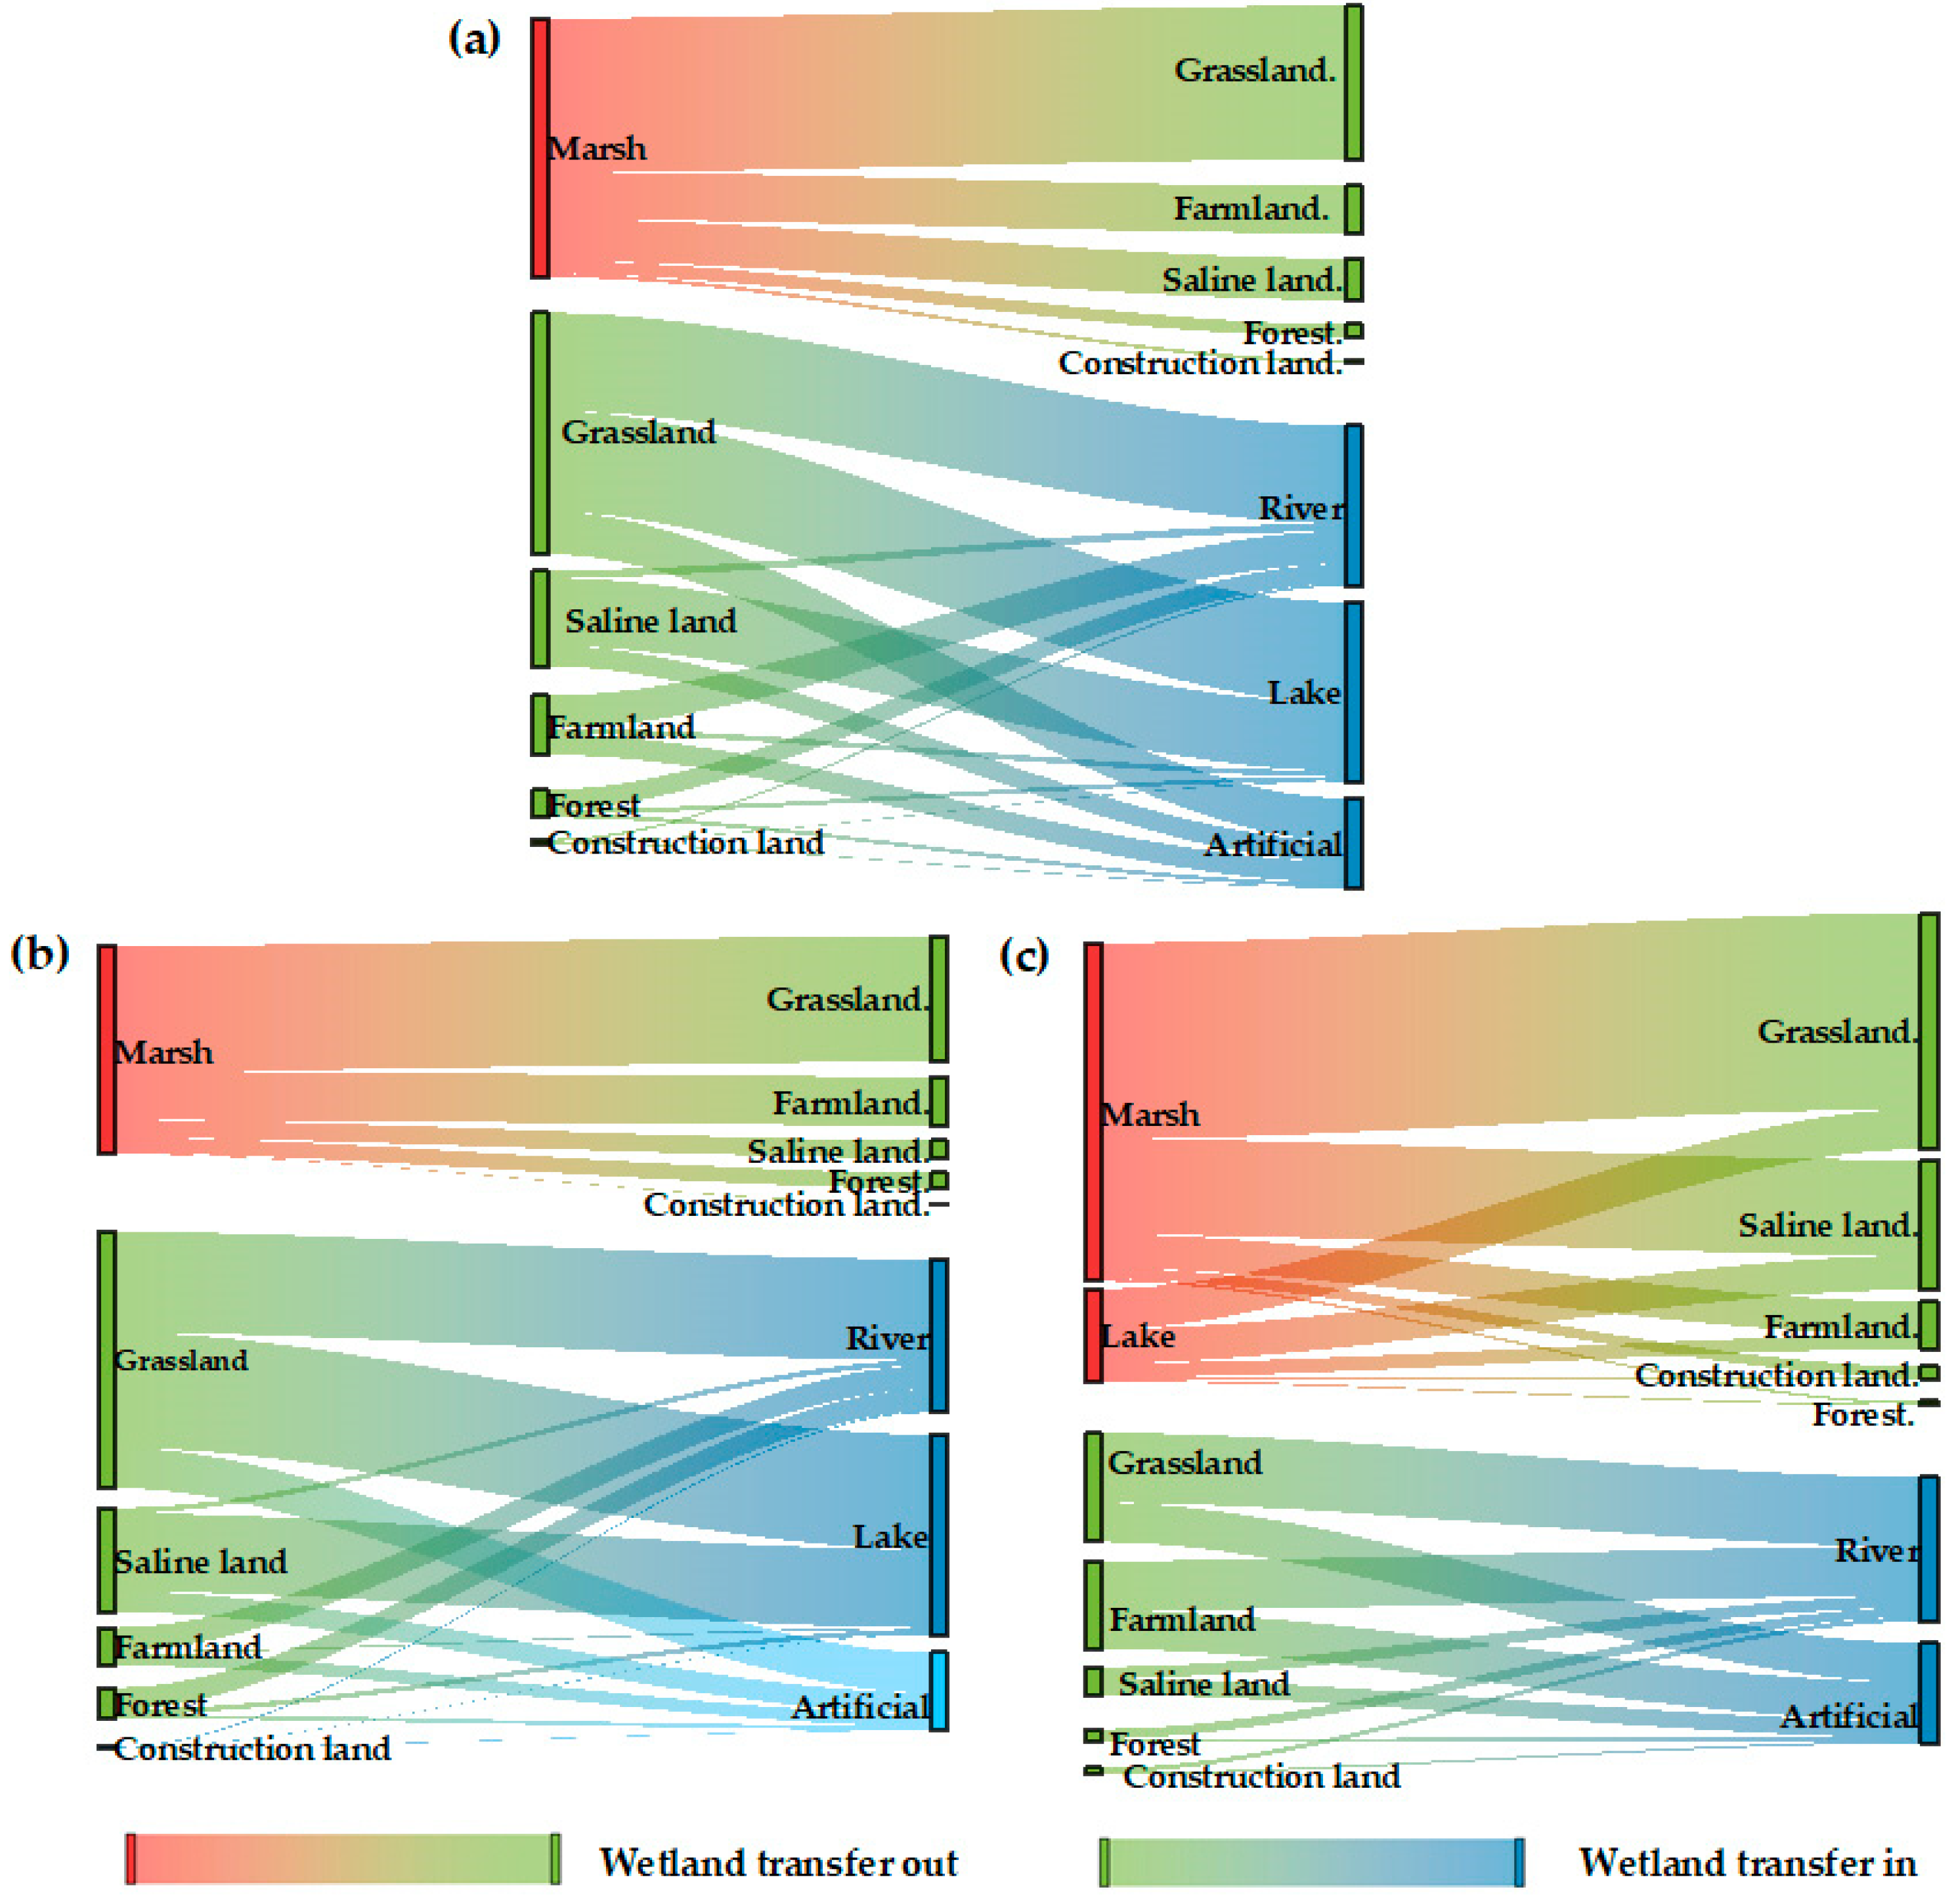
3.1.2. Conversion Characteristics

In the wetlands within China’s drylands from 1990 to 2020, the highest rate of conversion was between grassland and wetland, followed by that between saline land and wetland, and then between farmland and wetland (Figure 6, Tables S1 and S2). Shrinking marshes were converted mainly to grassland, farmland, and saline land. Expanding rivers, lakes, and artificial wetlands were derived mainly from the conversion of grassland, saline land, and farmland (Figure 6a). In XJ and the HCR, expanding wetlands likewise stemmed primarily from the conversion of grasslands, saline land, and farmland, and shrinking marshes mainly were converted to grasslands, farmlands, and saline land (Figure 6b,c). The shrinking lakes of the HCR were converted mainly to grasslands and saline soils (Figure 6c).

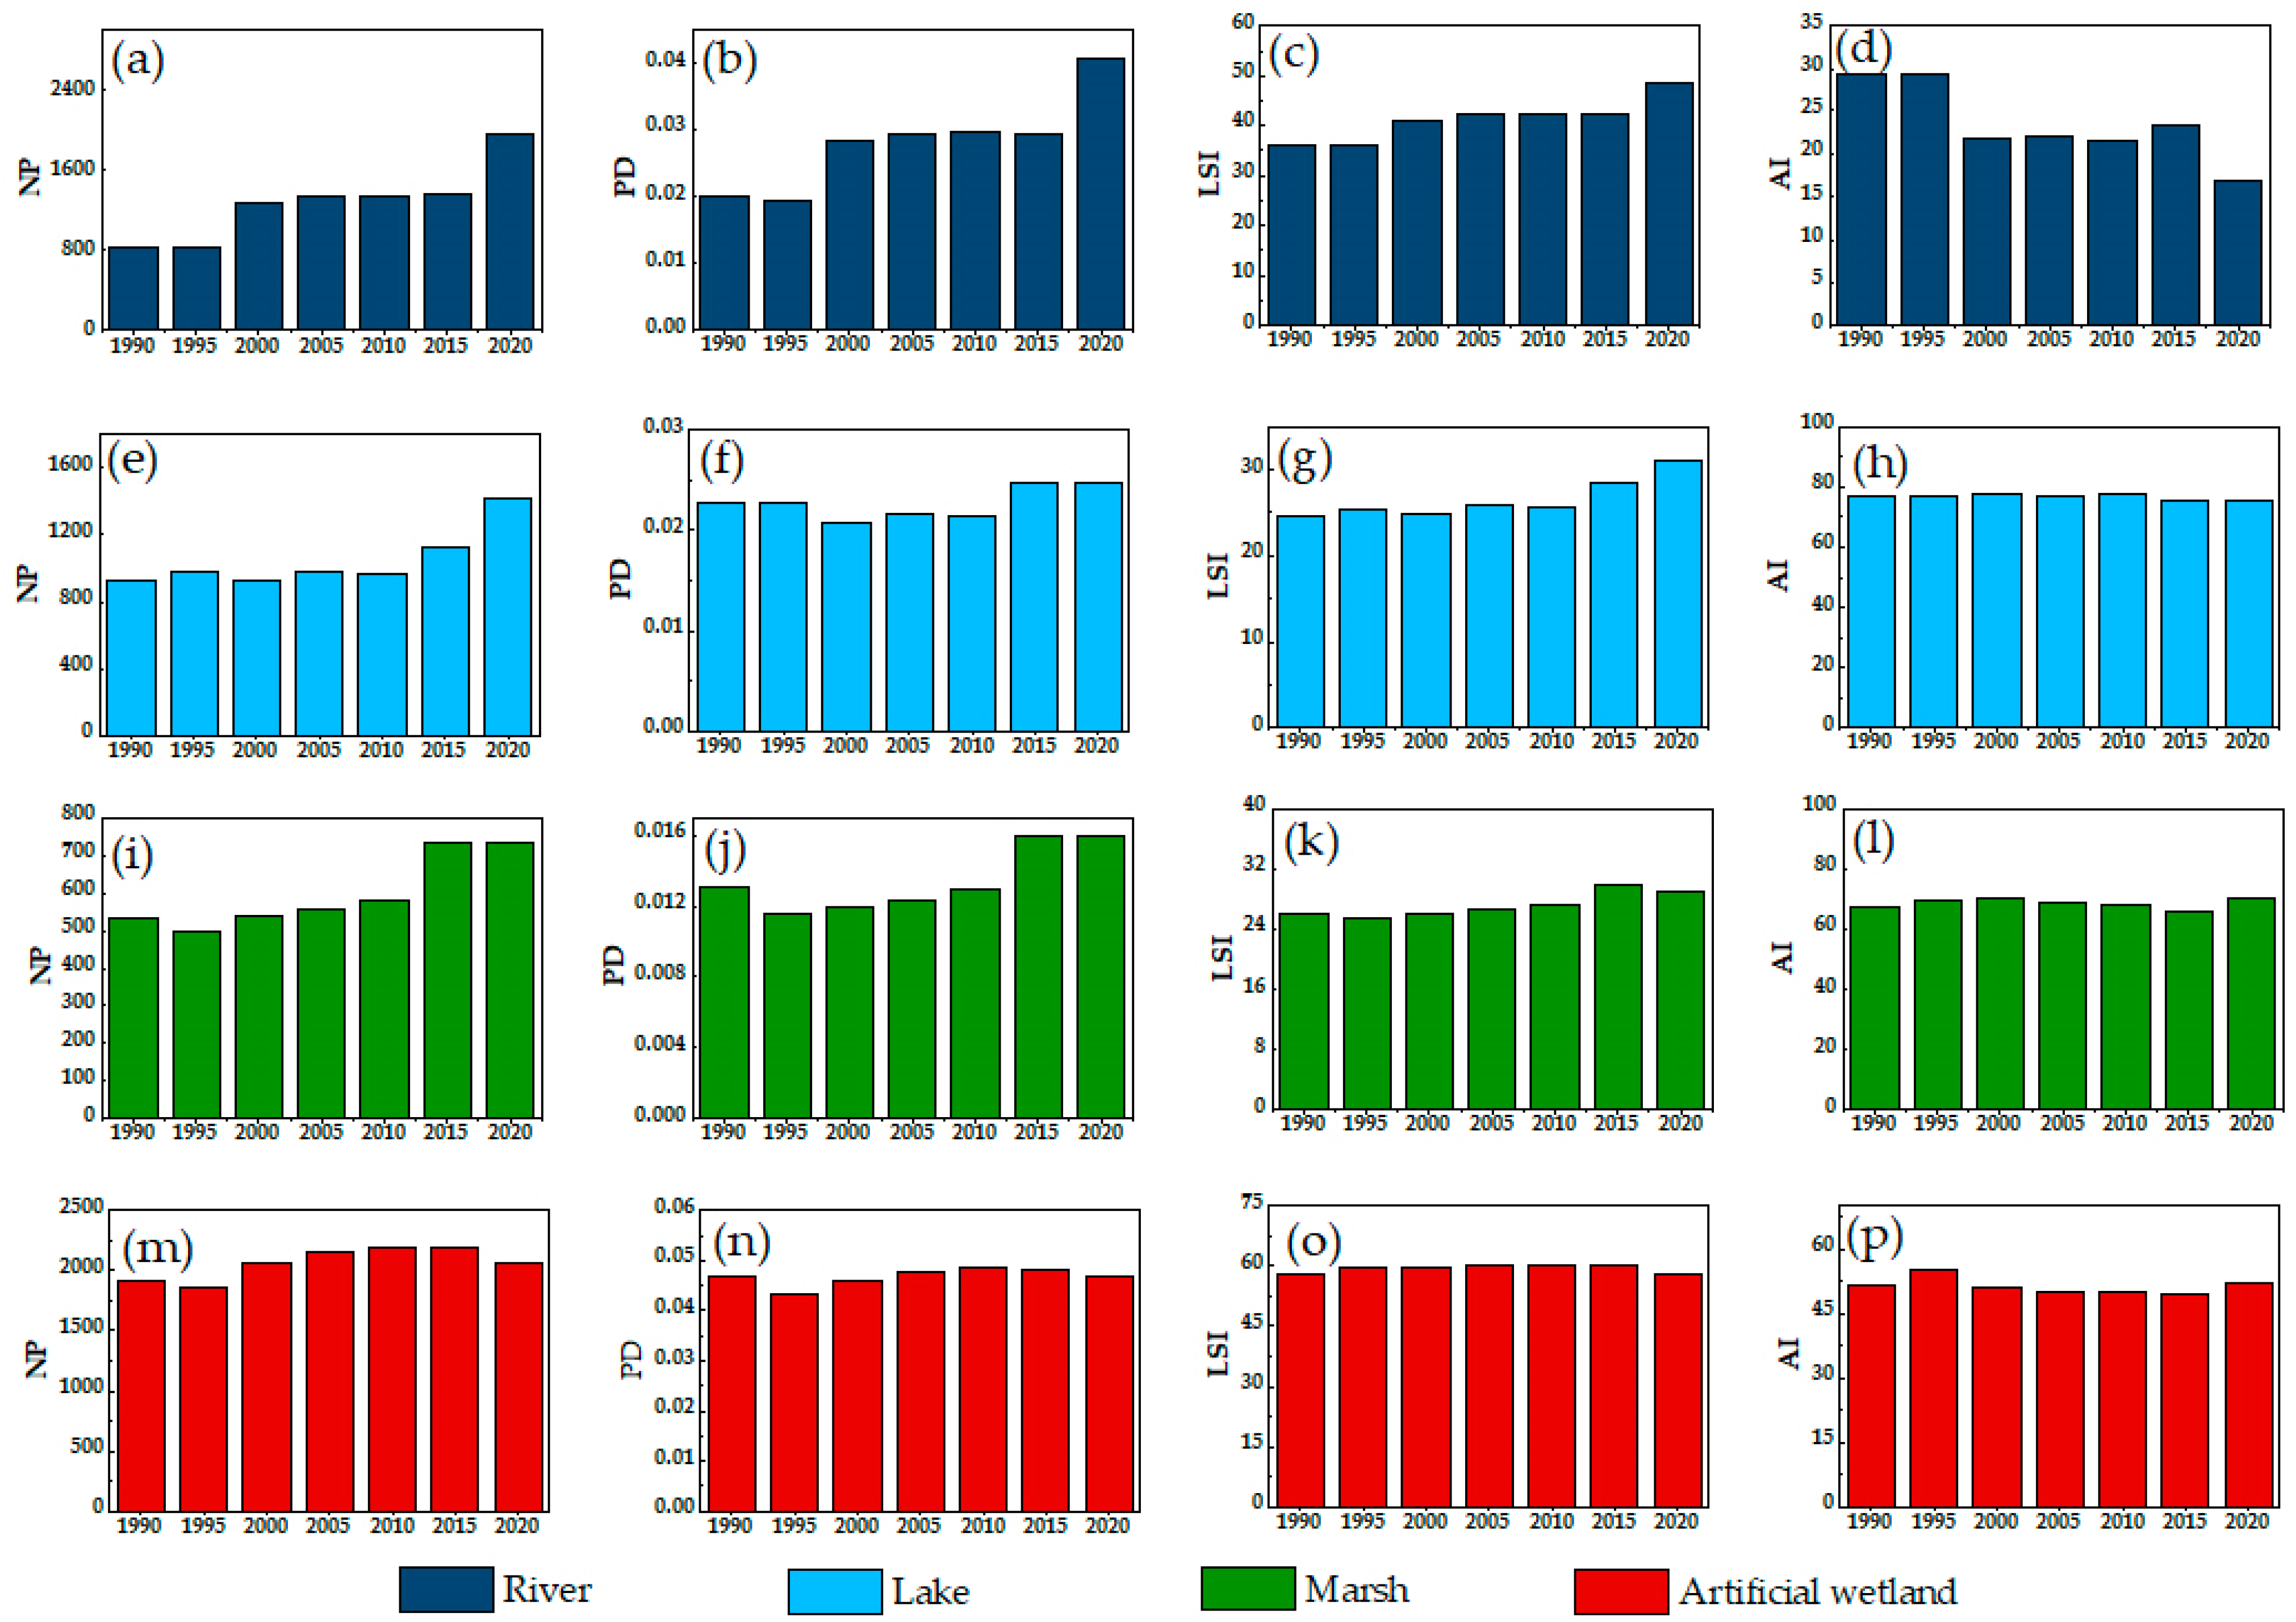
3.1.3. Variation in Wetland Patterns

In regards to landscape, the wetland pattern within China’s drylands changed significantly during the study period (Figure 7a–d). From 1990 to 2020, the NP, PD, and LSI increased, which means that the fragmentation and complexity of wetland patterns within China’s drylands increased. The AI showed a downward trend, with a steady decline from 1995 to 2020, indicating more fragmentation and the greater dispersion of wetland patches.
By further analyzing the changes in the wetland patterns in XJ (Figure 7e–h) and the HCR (Figure 7i–l), the NP and PD show an overall upward trend from 1990 to 2020, indicating that the fragmentation of the wetland patterns intensified in the two regions. The LSI displayed a general upward trend, indicating that the complexity of patches within the wetland increased in XJ and the HCR. The value of AI did not change significantly.
The NP and PD showed the same trend in terms of landscape class type (Figure 8a,b,e,f,i,j,m,n). The NP and PD of the wetland types increased in general from 1990 to 2020, showing that the fragmentation of the wetland types was severe. The NP and PD of rivers and artificial wetlands were greater in 2020, indicating that the fragmentation of these wetland types was serious.
The wetland types that had greater LSIs were artificial wetlands and rivers (Figure 8c,o), indicating that their patch shapes were the most complex. In addition, the LSIs of rivers, lakes, and marshes increased from 1990 to 2020 (Figure 8c,g,k), which indicated that the patch shapes of these three wetland types became more complicated. In contrast, the LSI of artificial wetlands increased from 1990 to 2015 and decreased from 2015 to 2020 (Figure 8o), indicating that the shape of artificial wetlands first became more complicated and then became more simplified.
Changes in the AI are shown in Figure 8d,h,l,p. From 1990 to 2020, the AI of rivers was the smallest among the wetland types, indicating that the distribution of rivers was relatively more fragmented. From 1995 to 2020, the AI of rivers, lakes, and artificial wetlands decreased, while that of marshes increased.

3.2. Climate and Human Activity Changes in Wetlands within China’s Drylands

3.2.1. Trends of Temperature and Precipitation

The climate from 1990 to 2020 showed a “warming and humidifying” trend (Figure 9), in which the temperature and precipitation increased (Figure 9a,c). Concurrently, there was a trend toward increased temperature and precipitation levels in both the HCR and XJ. Based on the spatial and temporal variability, 68.32% of China’s drylands showed a significant increasing trend in temperature, 15.50% of China’s drylands showed a slight increasing trend, and only 0.04% showed a slight decreasing trend. Precipitation had an uneven temporal and spatial distribution: 3.62% showed a significant increasing trend, 59.80% showed a slight increasing trend, 36.48% showed a slight decreasing trend, and only 0.1% showed a significant decreasing trend. The areas of increasing precipitation were concentrated in the western part of XJ and the southeastern part of the HCR, while the areas of decreasing precipitation were primarily in the eastern part of XJ and the northwestern part of the HCR (Figure 9b,d).

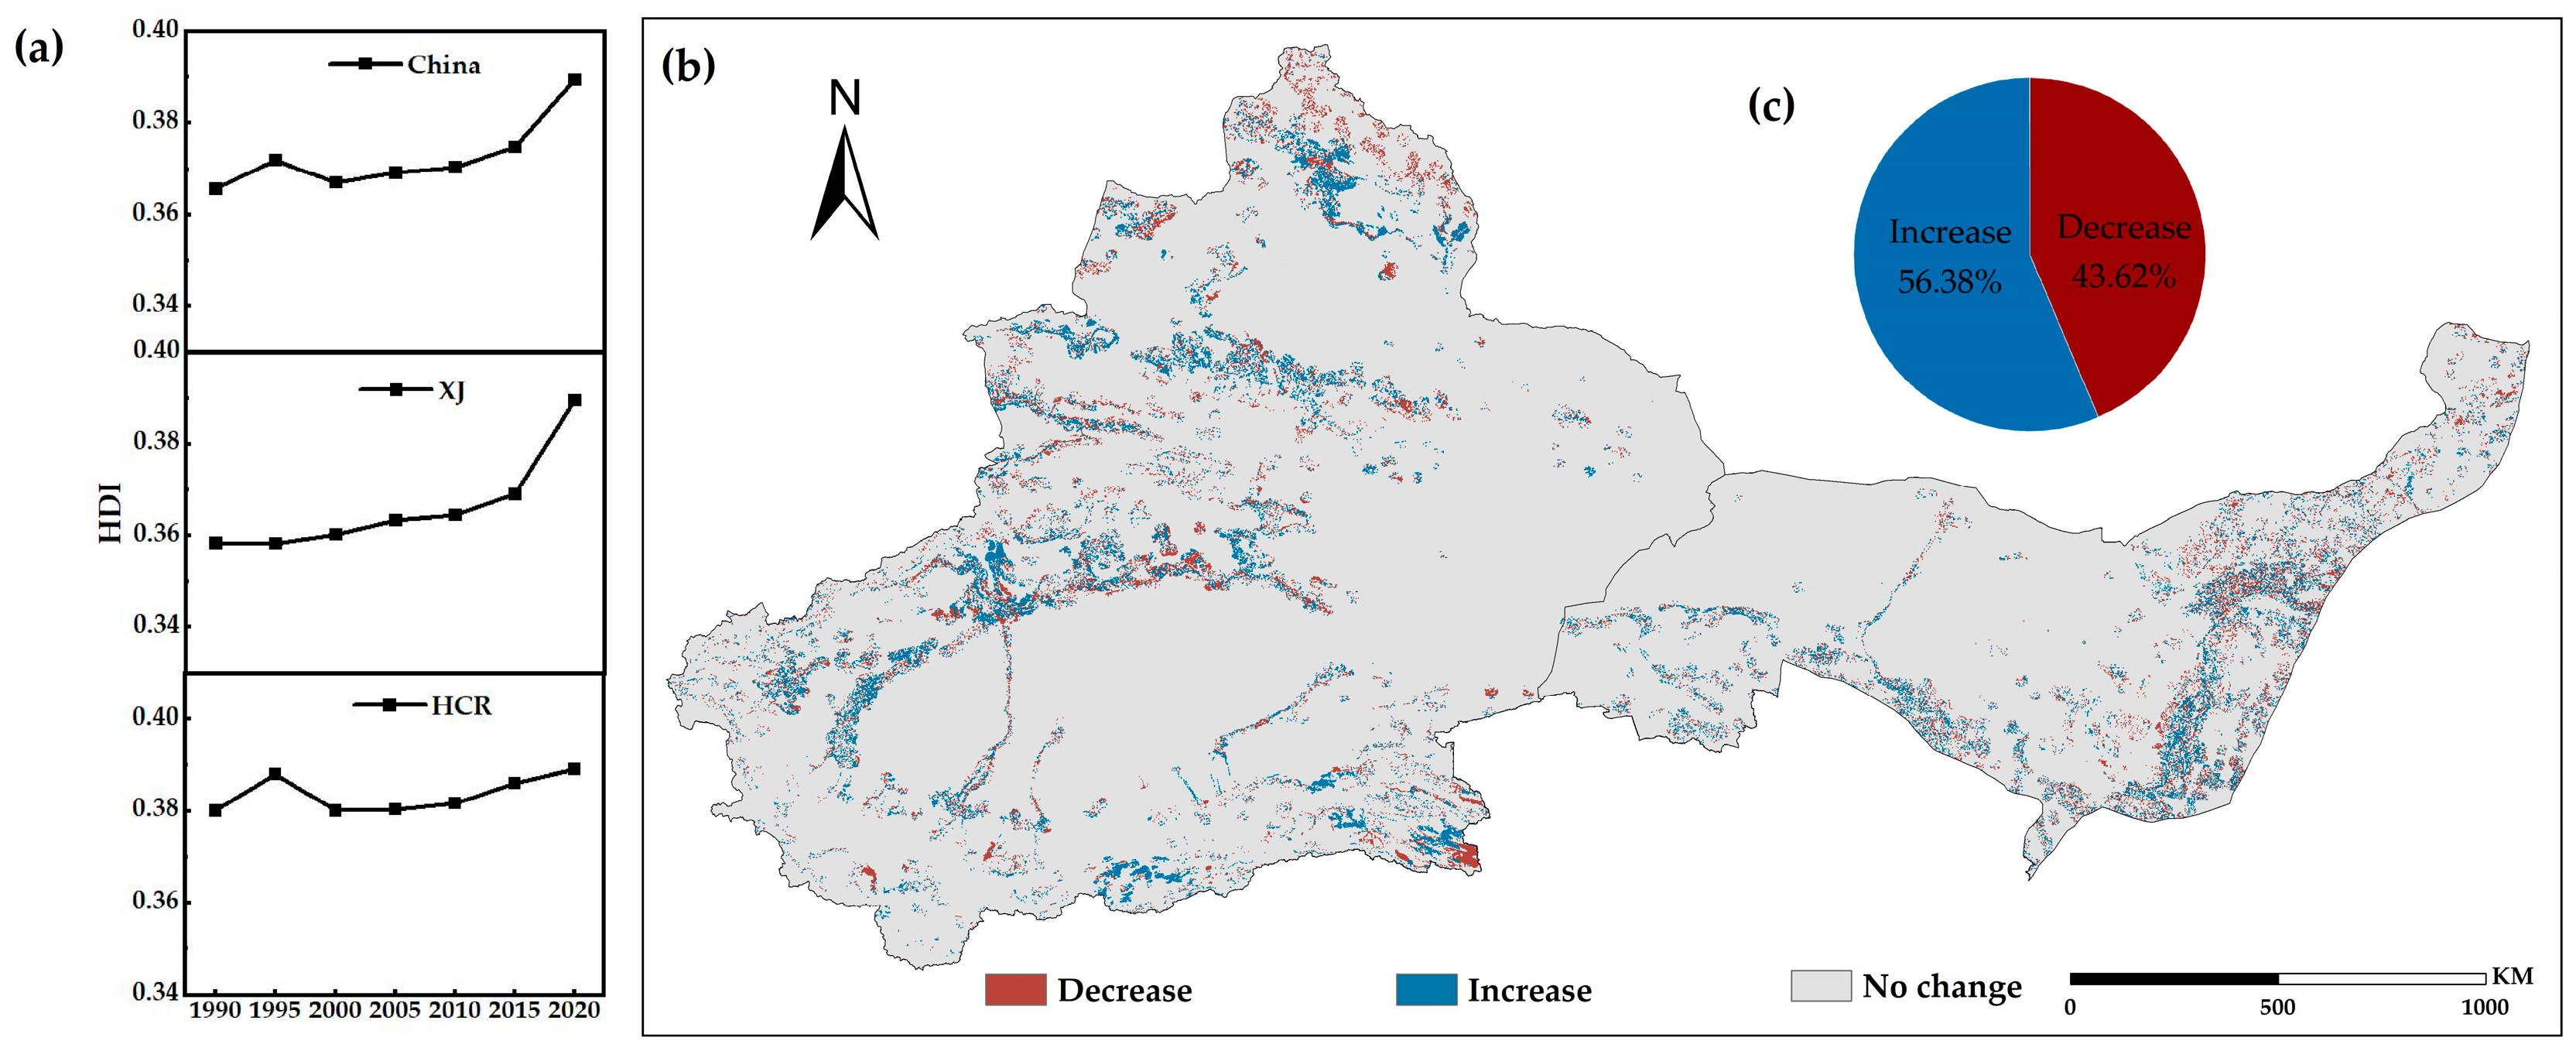
3.2.2. Trends of Human Disturbance Index (HDI)

The HDI changes in the wetland buffer zone are shown in Figure 10. Regarding temporal changes (Figure 10a), the wetland buffer zone’s HDI increased from 1990 to 2020. The HDI in XJ and the HCR also increased, with the HDI in XJ increasing significantly during the study period, while that of the HCR declined from 1995 to 2000 but increased slowly from 2000 to 2020. In terms of the spatial variation in HDI (Figure 10b,c), 56.38% of the study area increased from 1990 to 2020, while 43.62% decreased. The increase in HDI was the most pronounced in the region of the river basin, as a consequence of the growth of urbanization and the spread of anthropogenic agglomerations.

3.3. Key Drivers of Wetland Evolution

3.3.1. Relationship between Wetland Evolution and Climatic Factors

Temperature and precipitation were selected to be combined with the wetland pattern indices to enable a pixel-by-pixel correlation and significance analysis. The results are shown in Figure 11a and Figure 12a, while the spatial distribution is shown in the Supporting Information (Figures S2 and S3). The results indicate that the precipitation over most wetland areas within China’s drylands was significantly and positively correlated with the pattern indices. XJ and the HCR were also significantly and positively correlated with the pattern indices (Figure 11a). Meanwhile, the temperature over most wetland areas within China’s drylands was significantly and positively correlated with the NP, PD, and LSI, but significantly and negatively correlated with AI. The temperature over most areas of XJ was significantly and negatively correlated with the pattern indices, while over most areas of the HCR, it was significantly and positively correlated with them (Figure 12a). Our analysis of the correlation between temperature, precipitation, and the four types of wetland pattern indices revealed, as shown in Figure 11b and Figure 12b, significant positive correlations between precipitation and the pattern indices for most of the four wetland types. The temperature over most river areas was significantly and positively correlated with the NP, PD, and LSI, but not significantly correlated with AI. The temperature over most lake areas was significantly and negatively correlated with the pattern indices. Temperature was strongly and positively correlated with the NP, PD, and LSI in most marsh locations, but significantly and negatively correlated with AI. The temperature over most artificial wetland areas was significantly and positively correlated with the pattern indices (Figure 11b).
By comparing the sizes of the correlations between precipitation, temperature, and the wetland pattern indices, the most important climatic factors affecting the wetlands within China’s drylands were derived. The results are shown in Table 3. Except for the PD of the HCR, where temperature was the dominant climatic factor, for all the others, precipitation was the dominant factor. Thus, precipitation was the main factor influencing changes in wetland patterns within China’s drylands, and temperature also had an important effect.

3.3.2. Relationship between Wetland Evolution and HDI

The relationship between the HDI and wetland patterns is displayed in Figure 13a, while the spatial distribution is in the Supporting Information (Figure S4). The HDI was significantly and positively correlated with the pattern indices in most parts of the wetlands within China’s drylands. Most parts of XJ and the HCR also showed a significant positive correlation. The correlation results between the HDI and the patterns for different wetland types within China’s drylands also showed a significant positive correlation (Figure 13b). An elevated HDI exacerbated the degree of fragmentation of wetlands within China’s drylands, which led to an increase in the degree of wetland patch segregation.

3.3.3. Key Drivers of Wetland Pattern Evolution

The correlation results of climate factors, the HDI, and the wetland pattern indices were compared, and the variables corresponding to higher correlation coefficients were recognized as the dominant factors. The statistics of the shared area of each factor are shown in Table 4. On average, human activities dominated, accounting for over 55% of the regional wetland pattern changes, and the main factor affecting wetland changes within China’s drylands was human activities. Human activities also dominated the changes in wetland patterns in XJ and the HCR.
The shared area statistics of the main influencing factors for the wetland types are shown in Table S3, revealing that the primary factor influencing the change in the pattern of each wetland type was also human activities. The main factor influencing the shift in wetlands inside China’s drylands and the fragmentation of wetland patterns is increased human activity, but climate change also plays a significant role.

4. Discussion

4.1. Analysis of the Driving Forces for the Evolution of Diverse Types of Wetlands

4.1.1. Lake Expansion with Regional Differences and the Uneven Distribution of Precipitation

From 1990 to 2020, lakes showed regional differences in their expansion—namely, westward expansion and eastward contraction, in which the lakes in XJ showed an expanding trend. This aligns with the findings of Wang et al. [66], in which the area of lakes in XJ showed an expanding trend from 1986 to 2019. Most of the major lakes (bodies of water covering more than 10 km2) in XJ showed an expanding trend in recent decades (Table S4). Among climatic factors, temperature adversely affects rain-fed lakes but has a positive impact on snow- and ice-melt-fed lakes [67]. The climate in China’s drylands is warming and becoming wetter, with increases in both precipitation and temperature (Figure 9a,d). Lakes in the plateau and alpine regions of XJ rely on ice and snowmelt water recharge and are less affected by human activities. The wetter climate and greater levels of glacial melt resulted in increased runoff and an increased water supply, which facilitated lake expansion [68,69]. Moreover, the glacial area in the North Tianshan Mountains of Sayram Lake decreased by 316.03 km2 from 1960 to 2018 because of the rising temperatures, and the ice and snow meltwater in the watershed increased surface runoff, resulting in an increase in wetland area [70]. The Kaidu River experienced climate warming from 1980 to 2018, and the rising temperatures promoted the formation of ice and snow meltwater, which led to a gradual increase in the amount of river runoff and an increase in the area of Lake Bosten, whose waters flow from the Kaidu River [71].
The lakes in the HCR shrank. The lakes of Inner Mongolia had a rapid decreasing trend from 1989 to 2018, with the number of lakes decreasing by 83 lakes/a and the total area decreasing by 14.60% [72]. The area of major lakes in the HCR has also shrunk in recent decades (Table S4). Due to the large fluctuations in precipitation in China’s drylands from 1990 to 2020, and the uneven spatial and temporal distribution of precipitation, the northwest of the HCR experienced a decrease in precipitation (Figure 9b). In addition, the increased temperatures in the study area caused a significant increase in evapotranspiration, resulting in a reduction in wetland water recharge and an increase in water consumption. This then led to lakes in the HCR being transformed into grasslands and saline soil (Figure 6c). This aligns with the findings of Guo et al. [72] and Feng et al. [73], who found the primary cause of lake changes in Inner Mongolia to be warming and drying climate trends. Furthermore, a study by Feng et al. [73] on the lake areas in Southeastern Latin America, Southern Latin America, and Central Asia (near the Caspian Sea), which are all in the drylands, found that the drying of the climate led to a decline in the lake areas in these places.

4.1.2. River Expansion but Severe Fragmentation Due to Increased Precipitation, Temperatures, and Human Activity

The rivers in China’s drylands expanded but were severely fragmented from 1990 to 2020. Human activity was the main factor influencing the river dynamics. China’s drylands have implemented numerous water conservation projects, such as water diversion projects, water conservancy construction, the excavation of canals, and the construction of more reservoirs and canals to support the river system. The Tarim River Basin saw a rapid rise in the wetland areas in 2011 after more than 10 years of artificial water transfer, and the wetland areas downstream of the Tarim River increased by 216.80% in 2018 compared to their area in 1900 [74]. The “Ecological Water Transfer Plan” implemented in 2000 increased the Heihe river area [75]. However, the implementation of hydraulic projects increased the level of wetland fragmentation, especially the implementation of water transfer projects, which further exacerbated the fragmentation of the river. Furthermore, human factors, represented by population, farmland, and construction land increases, were the main factors driving the process of the fragmentation of river landscapes.
Furthermore, precipitation and temperature in China’s drylands had an overall increasing trend (Figure 9a,d). On the one hand, increased precipitation resulted in the expansion of rivers. For instance, the Yarkant River Basin’s enhanced streamflow was 87% due to increased precipitation [76]. On the other hand, most rivers in China’s drylands develop in the high mountains, such as the Hotan and Yarkand rivers, which originate in the Tianshan Mountains, the Irtysh River, which originates in the Altai Mountains, and the Hei River, which originates in the Qilian Mountains. Ice meltwater becomes an important recharge source for rivers. The warming of the climate in China’s drylands has caused glaciers to shrink, and runoff from glacial meltwater flows directly into their downstream reaches, increasing the area of rivers. For instance, the Hotan and Aksu river basins saw increases in streamflow primarily due to higher temperatures, which accounted for 94% and 66% of the increases, respectively [76]. Furthermore, rising temperatures in the Heihe River Basin have led to the accelerated melting of Qilian Mountain glaciers, which are the most important sources of water in the HCR. Increased glacial meltwater has led to more runoff into the Heihe River [67].

4.1.3. Marsh Shrinkage all over China’s Drylands and Conversion to Farmland and Grassland

Marshes shrank in size from 1990 to 2020. Mao et al. [77] also showed that the marshes in China’s drylands have decreased by about 69,100 km2 over the past 40 years. Human activities are the most significant cause of marsh shrinkage. The population of China’s drylands increased from 3.66 × 10⁷ people in 1990 to 4.99 × 10⁷ people in 2020 [78]. As the population grew, large-scale land reclamation occurred, crowding out wetlands and causing the marsh area to shrink. Rapid urbanization resulted in a population explosion and urban building land expansion, which occupied a portion of the marsh region. Farmland and construction land continued to increase from 1990 to 2020 by 38.08% and 85.21%, respectively, resulting in marshes in China’s drylands being converted into farmland and construction land (Figure 6a). Luo et al. [69] similarly showed that 122.33 km2 of wetlands were converted to farmland in northern XJ from 1980 to 2015. In addition to cultivating directly on wetlands, overusing water resources for agriculture causes marshes to disappear indirectly. From 2000 to 2010, channels and ditches in XJ increased by 4.07% [23]. In Tarim Populus National Nature Reserve from 1999 to 2016, irrigation channels and paddy fields increased by 111.21% and 100.30%, respectively [79]. Yun et al. [80] similarly showed that the Yellow River Basin in China’s drylands has experienced a serious shrinkage of natural wetland area due to agricultural and pastoral encroachment and irrigation from 1990 to 2020. The increase in drainage and irrigation activities has led to marshes gradually degrading into meadows. The shrinkage of marshes in China’s drylands was mainly due to their conversion into grassland (Figure 6a). The evolution of marshes in China’s drylands is consistent with that of marshes which shrank from 2000 and 2015, and the primary factors contributing to wetland loss are farmland land use and urban sprawl [81]. Furthermore, in recent decades, the marsh areas of Borg El-Arab [82] and dryland of Lake Tana in Ethiopia [83] decreased, mostly as a result of the expansion of farmland.
Climate changes also play a role in marsh shrinkage. In western XJ and the Northwestern HCR (Figure 9b), precipitation decreased, and the increased warmth in the study area resulted in a significant rise in evapotranspiration, resulting in the transformation of many marshes into grasslands and saline soil (Figure 6a). From 1990 to 2020, as a result of reduced precipitation, higher temperatures, and increased evapotranspiration, the marshes of Inner Mongolia’s Yellow River Basin were greatly reduced [80]. From 1986 to 2020, Dalinor Nature Reserve showed increased evapotranspiration caused by rising temperatures and precipitation fluctuations, which led to the amount of water in the lake decreasing [84].

4.1.4. Artificial Wetland Expansion and the Increase in Artificial Reservoirs

The growth of artificial wetlands within China’s drylands was significant from 1990 to 2020. Recently, the increase in the number of artificial reservoirs has been the main reason for the increase in artificial wetlands. The area of reservoirs and pits in XJ increased by 2.28% and 0.05% of its non-wetlands were transformed into artificial wetlands from 2000 to 2010 [23]. A period of a significant increase in the area of reservoirs was from 2010 to 2020, with a total of 136 reservoirs built in XJ, accounting for 23.50% of the total number of reservoirs in the whole territory [69]. In addition, the area of artificial wetlands in Tarim Poplar National Nature Reserve increased by 100.59% from 1999 to 2016 [79]. In Inner Mongolia’s Yellow River Basin, the area of reservoirs increased by 78.20% from 1990 to 2020, and artificial wetlands increased significantly, at a rate of 16.41 km2/a [80]. The growth of artificial wetlands has spread substantially throughout China’s drylands. This aligns with China’s overall development trend. With China’s rapid urbanization, population growth, and increased awareness of environmental protection, the expansion of artificial wetlands, such as reservoirs and wetland parks, has accelerated and will continue to expand in China’s drylands and throughout the country [85].

4.2. Strategies for Wetland Conservation

(1)
Lakes and rivers have expanded over the last 30 years, but the majority of this growth has been caused by increasing snowmelt from glaciers. However, glaciers in China have been decreasing in recent years [86]. Lakes and rivers are in danger, so we need to increase their protection by establishing wetland nature reserves and parks. To increase water resource usage, rational water allocation for living and production should be implemented.
(2)
Compared to climate change, human activities could have more intense and irreversible damage to wetland ecosystems [81]. The degradation of marshes and river fragmentation in China’s drylands is primarily driven by the occupation of wetlands by agriculture and urban construction sites, as well as increased drainage and irrigation activities. Thus, controlling human activity is the most crucial measure for protecting wetlands. As a result, public education about wetland protection should be prioritized, particularly among farmers. Second, we must strengthen the protection of wetlands. For example, we can prohibit the conversion of wetlands into farmland, prohibit grazing operations in marshes, and limit “mowing activities” on reed and other marsh vegetation from May to August to safeguard marshes.
(3)
China has undertaken extensive conservation and restoration efforts to safeguard wetland resources, including the National Wetland Conservation Action Plan (NWCPAP) in 2000, the National Wetland Conservation Plan (NWCP) (2002–2030) in 2003, and the NWCP’s short-term implementation plan every five years. To boost the conservation and restoration of wetland resources in China’s drylands, the National Wetland Conservation Plan must be actively promoted and implemented, increasing wetland protection and restoration.

4.3. Limitations of Remote Sensing Interpretation of Wetlands

Due to its advantages in terms of its efficiency, speed, and observation range, researchers both domestically and internationally favor remote sensing technology. Whether for macro-monitoring, such as for wetland dynamic changes, or micro-monitoring, such as for wetland resource type classifications, remote sensing technology is widely used in wetland research. This effectively avoids the issues of traditional investigation methods, which are slow to update and are difficult to use to conduct investigations in depth. Still, there are still some issues with the way wetland data is currently extracted.
(1)
The range of wetland regions is hard to define accurately, and the accuracy of extractions is unsatisfactory for some wetland types (vegetation and marshes, for example);
(2)
There are several limits to the display of wetland types in remote sensing images. For example, natural wetland boundaries can be artificially repaired or preserved and have visible bounds in remote sensing images, making them easily identifiable as artificial wetlands (reservoirs/pits);
(3)
In some areas of China’s drylands, the quality of remote sensing images is poor, and coverage is inadequate, necessitating additional images from nearby water-rich months or years, making it difficult to extract seasonal wetland data.

5. Conclusions

Based on three types of land use data sources from satellite images, the spatiotemporal characteristics of the evolution of the wetlands and their relationship with human interference and climate change from 1990 to 2020 were analyzed within China’s drylands. Over the last three decades, the area of wetlands in China’s drylands has increased, and the overall fragmentation of the wetlands has worsened. The increase in human activities was found to be the main driving factor for the changes in wetland patterns, but climatic factors, i.e., warming and humidification, also had an important impact. Among them, due to the uneven spatial and temporal distribution of precipitation and rising temperatures, the area of lakes in XJ expanded, while that in the HCR shrunk. Affected by the warmer and wetter climate and the implementation of numerous water transfer projects, the rivers in China’s drylands showed an expanding tendency. However, the fragmentation of rivers increased because there were increasing levels of human activity. The occupation of wetlands by farmland and urban construction land, as well as the increase in drainage and irrigation activities were the main factors causing the marshes to shrink. The growing number of artificial reservoirs was the primary cause of the development of artificial wetlands.

Supplementary Materials

The following supporting information can be downloaded at: https://www.mdpi.com/article/10.3390/rs16040702/s1. Method S1: Methods for mapping spatial dynamics of wetlands; Method S2: Statistical analysis of correlation results; Figure S1: (a–d) Spatial distribution of wetland pattern index–precipitation correlation in the wetlands in China’s dryland; Figure S2: (a–d) Spatial distribution of wetland pattern index–temperature correlation in the wetlands in China’s dryland; Figure S3: (a–d) Spatial distribution of wetland pattern index–HDI correlation in the wetlands in China’s dryland; Table S1: Wetland dynamics in XJ from 1990 to 2020; Table S2: Wetland dynamics in HCR from 1990 to 2020; Table S3: Main factors affecting wetland types in China’s drylands; Table S4: Variation trend of large lakes in China’s dryland.

Author Contributions

Conceptualization, H.Z. and X.W.; methodology, X.W. and H.Z.; software, X.W.; validation, X.W., H.Z. and M.W.; writing—review and editing, X.W. and H.Z.; writing—review and editing, H.Z., M.W., S.J., and Q.Y.; funding acquisition, Z.C., Q.Y. and W.D.; Data curation, X.W. All authors have read and agreed to the published version of the manuscript.

Funding

This work was supported by the Third Xinjiang Scientific Exploration (No: 2021xjkk0702) and the Youth Tianshan Talent Training Program (No: 2022TSYCCY0006).

Data Availability Statement

We used land use data from the Resources and Environment Sciences and Date Center website (resdc.cn), National Catalogue Service For Geographic Information (webmap.cn), land use data from Jie Yang et al., Wuhan University, and climatic data from the National Tibetan Plateau Data Center (tpdc.ac.cn).

Acknowledgments

We would like to thank Zhengrong Yuan and Yuling Liang for their crucial comments that improved the quality of this paper.

Conflicts of Interest

All authors declare that they have no conflicts of interest.

References

  1. Davidson, N.C.; Fluet-Chouinard, E.; Finlayson, C.M. Global extent and distribution of wetlands: Trends and issues. Mar. Freshw. Res. 2018, 69, 620–627. [Google Scholar] [CrossRef]
  2. Davidson, N.C. How much wetland has the world lost? Long-term and recent trends in global wetland area. Mar. Freshw. Res. 2014, 65, 934–941. [Google Scholar] [CrossRef]
  3. Lu, M.Z.; Zou, Y.C.; Xun, Q.L.; Yu, Z.C.; Jiang, M.; Sheng, L.X.; Lu, X.G.; Wang, D.L. Anthropogenic disturbances caused declines in the wetland area and carbon pool in China during the last four decades. Glob. Chang. Biol. 2021, 27, 3837–3845. [Google Scholar] [CrossRef] [PubMed]
  4. Mahdianpari, M.; Jafarzadeh, H.; Granger, J.E.; Mohammadimanesh, F.; Brisco, B.; Salehi, B.; Homayouni, S.; Weng, Q. A large-scale change monitoring of wetlands using time series Landsat imagery on Google Earth Engine: A case study in Newfoundland. GISci. Remote Sens. 2020, 57, 1102–1124. [Google Scholar] [CrossRef]
  5. Zhang, Z.; Bortolotti, L.E.; Li, Z.H.; Armstrong, L.M.; Bell, T.W.; Li, Y.P. Heterogeneous Changes to Wetlands in the Canadian Prairies Under Future Climate. Water Resour. Res. 2021, 57, e2020WR028727. [Google Scholar] [CrossRef]
  6. Wang, J.; Chen, J.S.; Wen, Y.; Fan, W.; Liu, Q.N.; Tarolli, P. Monitoring the coastal wetlands dynamics in Northeast Italy from 1984 to 2016. Ecol. Indic. 2021, 129, 107906. [Google Scholar] [CrossRef]
  7. Cui, L.L.; Li, G.S.; Liao, H.J.; Ouyang, N.L.; Li, X.Y.; Liu, D. Remote Sensing of Coastal Wetland Degradation Using the Landscape Directional Succession Model. Remote Sens. 2022, 14, 5273. [Google Scholar] [CrossRef]
  8. Li, S.; Ma, H.Y.; Yang, D.; Hu, W.; Li, H. The Main Drivers of Wetland Evolution in the Beijing-Tianjin-Hebei Plain. Land 2023, 12, 480. [Google Scholar] [CrossRef]
  9. Jin, H.R.; Huang, C.Q.; Lang, M.W.; Yeo, I.Y.; Stehman, S.V. Monitoring of wetland inundation dynamics in the Delmarva Peninsula using Landsat time-series imagery from 1985 to 2011. Remote Sens. Environ. 2017, 190, 26–41. [Google Scholar] [CrossRef]
  10. Zhou, K. Wetland landscape pattern evolution and prediction in the Yellow River Delta. Appl. Water Sci. 2022, 12, 190. [Google Scholar] [CrossRef]
  11. Zhang, M.; Zhang, H.; Yao, B.; Lin, H.; An, X.; Liu, Y. Spatiotemporal changes of wetlands in China during 2000-2015 using Landsat imagery. J. Hydrol. 2023, 621, 129590. [Google Scholar] [CrossRef]
  12. Yang, L.; Wang, L.; Yu, D.; Yao, R.; Li, C.a.; He, Q.; Wang, S.; Wang, L. Four decades of wetland changes in Dongting Lake using Landsat observations during 1978–2018. J. Hydrol. 2020, 587, 124954. [Google Scholar] [CrossRef]
  13. Chen, H.; Zhang, W.; Gao, H.; Nie, N. Climate Change and Anthropogenic Impacts on Wetland and Agriculture in the Songnen and Sanjiang Plain, Northeast China. Remote Sens. 2018, 10, 356. [Google Scholar] [CrossRef]
  14. Deng, Y.; Shao, Z.; Dang, C.; Huang, X.; Wu, W.; Zhuang, Q.; Ding, Q. Assessing urban wetlands dynamics in Wuhan and Nanchang, China. Sci. Total Environ. 2023, 901, 165777. [Google Scholar] [CrossRef]
  15. Zheng, X.J.; Sun, P.; Zhu, W.H.; Xu, Z.; Fu, J.; Man, W.D.; Li, H.L.; Zhang, J.; Qin, L. Landscape dynamics and driving forces of wetlands in the Tumen River Basin of China over the past 50 years. Landsc. Ecol. Eng. 2017, 13, 237–250. [Google Scholar] [CrossRef]
  16. Stubbs, Q.; Yeo, I.Y.; Lang, M.G.; Townshend, J.; Sun, L.X.; Prestegaard, K.; Jantz, C. Assessment of Wetland Change on the Delmarva Peninsula from 1984 to 2010. J. Coast. Res. 2020, 36, 575–589. [Google Scholar] [CrossRef]
  17. Hempattarasuwan, N.; Untong, A.; Christakos, G.; Wu, J.P. Wetland changes and their impacts on livelihoods in Chiang Saen Valley, Chiang Rai Province, Thailand. Reg. Environ. Chang. 2021, 21, 115. [Google Scholar] [CrossRef]
  18. Hao, L.N.; He, S.; Zhou, J.L.; Zhao, Q.; Lu, X. Prediction of the landscape pattern of the Yancheng Coastal Wetland, China, based on XGBoost and the MCE-CA-Markov model. Ecol. Indic. 2022, 145, 109735. [Google Scholar] [CrossRef]
  19. Shen, S.G.; Pu, J.; Xu, C.; Wang, Y.H.; Luo, W.; Wen, B. Effects of Human Disturbance on Riparian Wetland Landscape Pattern in a Coastal Region. Remote Sens. 2022, 14, 5160. [Google Scholar] [CrossRef]
  20. Yin, L.T.; Zheng, W.; Shi, H.H.; Wang, Y.Z.; Ding, D.W. Spatiotemporal Heterogeneity of Coastal Wetland Ecosystem Services in the Yellow River Delta and Their Response to Multiple Drivers. Remote Sens. 2023, 15, 1866. [Google Scholar] [CrossRef]
  21. Berg, A.; McColl, K.A. No projected global drylands expansion under greenhouse warming. Nat. Clim. Chang. 2021, 11, 331–371. [Google Scholar] [CrossRef]
  22. Mortimore, M.; Anderson, S.; Cotula, L.; Davies, J.; Faccer, K.; Hesse, C.; Morton, J.; Nyangena, W.; Skinner, J.; Wolfangel, C. Dryland Opportunities: A New Paradigm for People, Ecosystems and Development; ICUN: Gland, Switzerland, 2009. [Google Scholar]
  23. LI, J.; Sun, H.; Xing, X.D.; Wang, C.X. Characteristics of Wetland and Its Conservation in Arid and Sem-i arid Areas in Northwest of China. J. Desert Res. 2003, 23, 5. (In Chinese) [Google Scholar]
  24. Yang, A.M.; Wang, F.; Liu, Q.; Liu, X.Y. Classification of wetland and analysis on wetland distribution characteristics and water questions in China. Sci. Soil Water Conserv. 2006, 4, 5. (In Chinese) [Google Scholar]
  25. Dai, A.; Lamb, P.J.; Trenberth, K.E.; Hulme, M.; Jones, P.D.; Xie, P. The recent Sahel drought is real. Int. J. Climatol. 2004, 24, 1323–1331. [Google Scholar] [CrossRef]
  26. Reed, S.C.; Coe, K.K.; Sparks, J.P.; Housman, D.C.; Zelikova, T.J.; Belnap, J. Changes to dryland rainfall result in rapid moss mortality and altered soil fertility. Nat. Clim. Chang. 2012, 2, 752–755. [Google Scholar] [CrossRef]
  27. Guan, X.; Huang, J.; Guo, R.; Yu, H.; Lin, P.; Zhang, Y. Role of radiatively forced temperature changes in enhanced semi-arid warming in the cold season over east Asia. Atmos. Chem. Phys. 2015, 15, 22975–23004. [Google Scholar] [CrossRef]
  28. Xi, Y.; Peng, S.; Ciais, P.; Chen, Y. Future impacts of climate change on inland Ramsar wetlands. Nat. Clim. Chang. 2021, 11, 45–51. [Google Scholar] [CrossRef]
  29. Giweta, M.; Worku, Y. Reversing the Degradation of Ethiopian Wetlands”: Is it Unachievable Phrase or A Call to Effective Action? Int. J. Environ. Sci. Nat. Resour. 2018, 14, 136–146. [Google Scholar] [CrossRef]
  30. Thamaga, K.H.; Dube, T.; Shoko, C. Evaluating the impact of land use and land cover change on unprotected wetland ecosystems in the arid-tropical areas of South Africa using the Landsat dataset and support vector machine. Geocarto Int. 2022, 37, 10344–10365. [Google Scholar] [CrossRef]
  31. Cherkaoui, S.I.; Hanane, S.; Magri, N.; El Agbani, M.-A.; Dakki, M. Factors Influencing Species-Richness of Breeding Waterbirds in Moroccan IBA and Ramsar Wetlands: A Macroecological Approach. Wetlands 2015, 35, 913–922. [Google Scholar] [CrossRef]
  32. van Dijk, A.; Beck, H.E.; Crosbie, R.S.; de Jeu, R.A.M.; Liu, Y.Y.; Podger, G.M.; Timbal, B.; Viney, N.R. The Millennium Drought in southeast Australia (2001–2009): Natural and human causes and implications for water resources, ecosystems, economy, and society. Water Resour. Res. 2013, 49, 1040–1057. [Google Scholar] [CrossRef]
  33. Khelifa, R.; Mahdjoub, H.; Samways, M.J. Combined climatic and anthropogenic stress threaten resilience of important wetland sites in an arid region. Sci. Total Environ. 2022, 806, 150806. [Google Scholar] [CrossRef] [PubMed]
  34. Assefa, W.W.; Eneyew, B.G.; Wondie, A. The driving forces of wetland degradation in Bure and Wonberma Woredas, Upper Blue Nile basin, Ethiopia. Environ. Monit. Assess. 2022, 194, 838. [Google Scholar] [CrossRef] [PubMed]
  35. Li, C.; Fu, B.; Wang, S.; Stringer, L.C.; Wang, Y.; Li, Z.; Liu, Y.; Zhou, W. Drivers and impacts of changes in China’s drylands. Nat. Rev. Earth Environ. 2021, 2, 858–873. [Google Scholar] [CrossRef]
  36. UNESCO. The Ramsar Convention on Wetlands; UNESCO: Paris, France, 1971. [Google Scholar]
  37. Liu, J.Y.; Kuang, W.H.; Zhang, Z.X.; Xu, X.L.; Qin, Y.W.; Ning, J.; Zhou, W.C.; Zhang, S.W.; Li, R.D.; Yan, C.Z.; et al. Spatiotemporal characteristics, patterns, and causes of land-use changes in China since the late 1980s. J. Geogr. Sci. 2014, 24, 195–210. [Google Scholar] [CrossRef]
  38. Chen, J.; Chen, J.; Liao, A.P.; Cao, X.; Chen, L.J.; Chen, X.H.; He, C.Y.; Han, G.; Peng, S.; Lu, M.; et al. Global land cover mapping at 30 m resolution: A POK-based operational approach. Isprs J. Photogramm. Remote Sens. 2015, 103, 7–27. [Google Scholar] [CrossRef]
  39. Yang, J.; Huang, X. The 30 m annual land cover dataset and its dynamics in China from 1990 to 2019. Earth Syst. Sci. Data 2021, 13, 3907–3925. [Google Scholar] [CrossRef]
  40. He, S.L.; Li, J.; Wang, J.L.; Liu, F. Evaluation and analysis of upscaling of different land use/land cover products (FORM-GLC30, GLC_FCS30, CCI_LC, MCD12Q1 and CNLUCC): A case study in China. Geocarto Int. 2022, 37, 17340–17360. [Google Scholar] [CrossRef]
  41. Wei, W.; Xia, J.; Hong, M.; Bo, L. The Evolution of “Three-Zone Space” in the Yangtze River Economic Belt under Major Functional Zoning Strategy from 1980 to 2018. Urban Plan. Forum 2021, 3, 28–35. [Google Scholar] [CrossRef]
  42. Xu, X.; Guo, P.; Zhang, F.; Wu, H.; Guo, W. Analysis for Changing Ecological Effects Under Policy-Driven in Shiyang River Basin. J. Soil Water Conserv. 2020, 34, 185–191. [Google Scholar] [CrossRef]
  43. Bie, Q.; Shi, Y.; Li, X.Z.; Wang, Y.J. Contrastive Analysis and Accuracy Assessment of Three Global 30 m Land Cover Maps Circa 2020 in Arid Land. Sustainability 2023, 15, 741. [Google Scholar] [CrossRef]
  44. Gao, Y.; Liu, L.Y.; Zhang, X.; Chen, X.D.; Mi, J.; Xie, S. Consistency Analysis and Accuracy Assessment of Three Global 30-m Land-Cover Products over the European Union using the LUCAS Dataset. Remote Sens. 2020, 12, 3479. [Google Scholar] [CrossRef]
  45. Li, M.J.; Ti, P.; Zhu, X.L.; Xiong, T.; Mei, Y.T.; Li, Z.L. Analysis of Spatial and Temporal Variability of Global Wetlands during the Last 20 Years Using GlobeLand30 Data. Remote Sens. 2022, 14, 5553. [Google Scholar] [CrossRef]
  46. Chen, J. Framing the Spatio-Temporal Changes in Global Cultivated Land Using GlobeLand30. Sci. Agric. Sin. 2018, 51, 1089–1090. [Google Scholar] [CrossRef]
  47. Liu, J.P.; Ren, Y.; Chen, X.D. Regional Accuracy Assessment of 30-Meter GLC_FCS30, GlobeLand30, and CLCD Products: A Case Study in Xinjiang Area. Remote Sens. 2024, 16, 82. [Google Scholar] [CrossRef]
  48. Hao, X.; Qiu, Y.B.; Jia, G.Q.; Menenti, M.; Ma, J.M.; Jiang, Z.X. Evaluation of Global Land Use-Land Cover Data Products in Guangxi, China. Remote Sens. 2023, 15, 1291. [Google Scholar] [CrossRef]
  49. Wu, Z.; Cai, Z.; Guo, Y.; Wang, Y. Accuracy evaluation and consistency analysis of multi-source remote sensing land cover data in the Yellow River Basin. Chin. J. Eco-Agric. 2023, 31, 4254. [Google Scholar] [CrossRef]
  50. Peng, S. 1-km Monthly Precipitation Dataset for China (1901–2020); National Tibetan Plateau Data Center: Beijing, China, 2020. [Google Scholar] [CrossRef]
  51. Peng, S. 1-km Monthly Mean Temperature Dataset for China (1901–2022); National Tibetan Plateau Data Center: Beijing, China, 2019. [Google Scholar] [CrossRef]
  52. Shen, G.; Yang, X.; Jin, Y.; Xu, B.; Zhou, Q. Remote sensing and evaluation of the wetland ecological degradation process of the Zoige Plateau Wetland in China. Ecol. Indic. 2019, 104, 48–58. [Google Scholar] [CrossRef]
  53. Wang, Z.; Li, T.; Yang, S.; Zhong, D. Spatio-Temporal Dynamic and Structural Characteristics of Land Use/Cover Change Based on a Complex Network: A Case Study of the Middle Reaches of Yangtze River Urban Agglomeration. Sustainability 2022, 14, 6941. [Google Scholar] [CrossRef]
  54. Zhou, S.; Chang, J.; Luo, P.; Kang, Y.; Li, S. Landscape dynamics and human disturbance processes in wetlands in a mining city: A case study in Huaibei, China. Environ. Monit. Assess. 2022, 195, 192. [Google Scholar] [CrossRef]
  55. Thompson, D.K.; Simpson, B.N.; Whitman, E.; Barber, Q.E.; Parisien, M.-A. Peatland Hydrological Dynamics as A Driver of Landscape Connectivity and Fire Activity in the Boreal Plain of Canada. Forests 2019, 10, 534. [Google Scholar] [CrossRef]
  56. Ai, J.W.; Yang, L.Q.; Liu, Y.F.; Yu, K.Y.; Liu, J. Dynamic Landscape Fragmentation and the Driving Forces on Haitan Island, China. Land 2022, 11, 136. [Google Scholar] [CrossRef]
  57. McDonnell, M.J.; Pickett, S.T.A. Ecosystem Structure and Function along Urban-Rural Gradients: An Unexploited Opportunity for Ecology. Ecology 1990, 71, 1232–1237. [Google Scholar] [CrossRef]
  58. Zhao, D.D.; Liu, J.P. Heterogeneity of wetland landscapes and their relationships with anthropogenic disturbances and precipitation in a semiarid region of China. Environ. Monit. Assess. 2022, 194, 786. [Google Scholar] [CrossRef]
  59. Points of significance. Nat. Hum. Behav. 2023, 7, 293–294. [CrossRef]
  60. Hou, W.; Zhai, L.; Qiao, Q.; Walz, U. Monitoring the intensity of human impacts on anthropogenic landscape: A mapping case study in Beijing, China. Ecol. Indic. 2019, 102, 382–393. [Google Scholar] [CrossRef]
  61. Yi, L.; Yu, Z.; Qian, J.; Kobuliev, M.; Xing, X. Evaluation of the heterogeneity in the intensity of human interference on urbanized coastal ecosystems: Shenzhen (China) as a case study. Ecol. Indic. 2021, 122, 107243. [Google Scholar] [CrossRef]
  62. Peng, B.; Fu, Y. Impact characteristics of human disturbance on land-use and landscape ecology pattern, Lushan, Southwest China. IOP Conf. Ser. Earth Environ. Sci. 2019, 227, 052050. [Google Scholar] [CrossRef]
  63. Cui, L.; Li, G.; Chen, Y.; Li, L. Response of Landscape Evolution to Human Disturbances in the Coastal Wetlands in Northern Jiangsu Province, China. Remote Sens. 2021, 13, 2030. [Google Scholar] [CrossRef]
  64. Zhou, Y.; Ning, L.; Bai, X. Spatial and temporal changes of human disturbances and their effects on landscape patterns in the Jiangsu coastal zone, China. Ecol. Indic. Integr. Monit. Assess. Manag. 2018, 93, 111–112. [Google Scholar] [CrossRef]
  65. Zhang, X.P.; Wang, X.Y.; Hu, Z.H.; Xu, J.C. Landscape Pattern Changes and Climate Response in Nagqu Hangcuo National Wetland Park in the Tibetan Plateau. Sustainability 2023, 15, 10200. [Google Scholar] [CrossRef]
  66. Wang, W.; Samat, A.; Ma, L.; Ge, X.Y.; Abuduwaili, J. Spatio-temporal variations and trend analysis of lake area in Xinjiang in 1986—2019. Acta Ecol. Sin. 2022, 42, 15. (In Chinese) [Google Scholar] [CrossRef]
  67. Wang, H.B.; Ma, M.G. Impacts of Climate Change and Anthropogenic Activities on the Ecological Restoration of Wetlands in the Arid Regions of China. Energies 2016, 9, 166. [Google Scholar] [CrossRef]
  68. Mao, D.H.; Wang, Z.M.; Wu, B.F.; Zeng, Y.; Luo, L.; Zhang, B. Land degradation and restoration in the arid and semiarid zones of China: Quantified evidence and implications from satellites. Land Degrad. Dev. 2018, 29, 3841–3851. [Google Scholar] [CrossRef]
  69. Luo, N.N.; Yu, R.; Mao, D.H.; Wen, B.L.; Liu, X.T. Spatiotemporal variations of wetlands in the northern Xinjiang with relationship to climate change. Wetl. Ecol. Manag. 2021, 29, 617–631. [Google Scholar] [CrossRef]
  70. Gao, F.; He, B.; Yan, Z.; Xue, S.; Li, Y. Analysis of the changes and driving force of the water area in the Ulungur Lake over the past 40 years. J. Water Supply Res. Technol. 2020, 69, 500–511. [Google Scholar] [CrossRef]
  71. Saimire, T.; Dilinuer, A. Impact of Climate Change in the Bosten Lake Basin on the Kaidu River Runoff. Clim. Environ. Res. 2022, 27, 323–332. [Google Scholar] [CrossRef]
  72. Guo, J.; Shi, J.S.; Zhang, Y.L.; Wang, Z.W.; Wang, W. Lake Changes in Inner Mongolia over the Past 30 Years and the Associated Factors. Water 2022, 14, 3137. [Google Scholar] [CrossRef]
  73. Feng, Y.H.; Zhang, H.; Tao, S.L.; Ao, Z.R.; Song, C.Q.; Chave, J.; Le Toan, T.; Xue, B.L.; Zhu, J.L.; Pan, J.M.; et al. Decadal Lake Volume Changes (2003-2020) and Driving Forces at a Global Scale. Remote Sens. 2022, 14, 1032. [Google Scholar] [CrossRef]
  74. Wang, S.; Zhou, K.; Zuo, Q.; Wang, J.; Wang, W. Land use/land cover change responses to ecological water conveyance in the lower reaches of Tarim River, China. J. Arid. Land 2021, 13, 1274–1286. [Google Scholar] [CrossRef]
  75. Zhao, W.W.; Ding, J.Y.; Wang, Y.P.; Jia, L.Z.; Cao, W.F.; Tarolli, P. Ecological water conveyance drives human-water system evolution in the Heihe watershed, China. Environ. Res. 2020, 182, 109009. [Google Scholar] [CrossRef]
  76. Wang, X.L.; Luo, Y.; Sun, L.; Shafeeque, M. Different climate factors contributing for runoff increases in the high glacierized tributaries of Tarim River Basin, China. J. Hydrol. Reg. Stud. 2021, 36, 100845. [Google Scholar] [CrossRef]
  77. Mao, D.H.; Yang, H.; Wang, Z.M.; Song, K.; Thompson, J.R.; Flower, R.J. Reverse the hidden loss of China’s wetlands. Science 2022, 376, 1061. [Google Scholar] [CrossRef] [PubMed]
  78. National Bureau of Statistics of China. China Statistical Yearbook; National Bureau of Statistics of China: Beijing, China, 2001.
  79. Liu, X.H.; Guan, K.W.; Zhang, Y.H.; Wu, T.T.; Cao, M.X.; Zhang, P.; Feng, M.Y. Changes of Wetland Area before and after Ecological Water Supplement Project in the National Nature Reserve of Populus euphratica in Tarim. Sci. Silvae Sin. 2018, 54, 8. (In Chinese) [Google Scholar] [CrossRef]
  80. Yun, J.; Liu, H.M.; Xu, Z.C.; Cao, X.A.; Ma, L.Q.; Wen, L.; Zhuo, Y.; Wang, L.X. Assessing Changes in the Landscape Pattern of Wetlands and Its Impact on the Value of Wetland Ecosystem Services in the Yellow River Basin, Inner Mongolia. Sustainability 2022, 14, 6328. [Google Scholar] [CrossRef]
  81. Xu, W.; Fan, X.; Ma, J.; Pimm, S.L.; Kong, L.; Zeng, Y.; Li, X.; Xiao, Y.; Zheng, H.; Liu, J.; et al. Hidden Loss of Wetlands in China. Curr. Biol. 2019, 29, 3065–3071. [Google Scholar] [CrossRef]
  82. Khafagy, M.E.; El-Sayed, H.; Darwish, K.M. Land cover/use change analysis and mapping of Borg El-Arab City, Egypt. Arab. J. Geosci. 2020, 13, 1123. [Google Scholar] [CrossRef]
  83. Kahsay, A.; Demissie, B.; Nyssen, J.; Triest, L.; Lemmens, P.; De Meester, L.; Kibret, M.; Verleyen, E.; Adgo, E.; Stiers, I. Extent of Lake Tana’s Papyrus Swamps (1985–2020), North Ethiopia. Wetlands 2023, 43, 6. [Google Scholar] [CrossRef]
  84. Li, H.D.; Gao, Y.Y.; Li, Y.K.; Yan, S.G.; Xu, Y.Y. Dynamic of Dalinor Lakes in the Inner Mongolian Plateau and Its Driving Factors during 1976–2015. Water. 2017, 9, 749. [Google Scholar] [CrossRef]
  85. Wang, C.Y.; Liu, S.H.; Zhou, S.; Zhou, J.; Jiang, S.C.; Zhang, Y.K.; Feng, T.T.; Zhang, H.L.; Zhao, Y.H.; Lai, Z.Q.; et al. Spatial-temporal patterns of urban expansion by land use/ land cover transfer in China. Ecol. Indic. 2023, 155, 111009. [Google Scholar] [CrossRef]
  86. Su, B.; Xiao, C.D.; Chen, D.L.; Huang, Y.; Che, Y.J.; Zhao, H.Y.; Zou, M.B.; Guo, R.; Wang, X.J.; Li, X.; et al. Glacier change in China over past decades: Spatiotemporal patterns and influencing factors. Earth-Sci. Rev. 2022, 226, 103926. [Google Scholar] [CrossRef]
Figure 1. Geographic location of China’s drylands.
Remotesensing 16 00702 g001
Figure 2. Research methodology flowchart.
Remotesensing 16 00702 g002
Figure 3. (a) Spatial distribution of wetlands within China’s drylands. (b) Proportion of each type of wetland within China’s drylands.
Remotesensing 16 00702 g003
Figure 4. (a) Dynamic changes in wetlands within China’s drylands. (b) Map of wetland expansion, based on the difference in wetland coverage between 1900 and 2020. (c) Map of wetland shrinkage, based on the difference in wetland coverage between 1900 and 2020.
Remotesensing 16 00702 g004
Figure 5. Changes in wetland type area: (ad) wetlands within China’s drylands; (eh) wetlands in XJ; and (il) wetlands in the HCR.
Remotesensing 16 00702 g005
Figure 6. Sankey diagram of wetlands dynamics within China’s drylands from 1990 to 2022: (a) China; (b) XJ; (c) the HCR.
Remotesensing 16 00702 g006
Figure 7. The dynamic variation in landscape index in wetlands within China’s drylands: (ad) China’s drylands as a whole, and then regionally within (eh) XJ and (il) the HCR.
Remotesensing 16 00702 g007
Figure 8. The dynamic variation in landscape index in wetland type within China’s drylands: (ad) rivers; (eh) lakes; (il) marshes; and (mp) artificial wetlands.
Remotesensing 16 00702 g008
Figure 9. Spatial and temporal trends of (ac) precipitation and (df) temperature from 1990 to 2020 in China’s dryland.
Remotesensing 16 00702 g009
Figure 10. Changes in HDI in wetland buffer zones of wetlands within China’s drylands: (a) buffer zones’ HDI temporal changes; (b) buffer zones’ HDI spatial changes; and (c) buffer zones’ HDI trend as a percentage.
Remotesensing 16 00702 g010
Figure 11. (a) Significance test statistics of wetland pattern index–precipitation correlations by region. (b) Significance test statistics of wetland pattern index–precipitation correlations by wetland type.
Remotesensing 16 00702 g011
Figure 12. (a) Significance test statistics of wetland pattern index–temperature correlations by region. (b) Significance test statistics of wetland pattern index–temperature correlations by wetland type.
Remotesensing 16 00702 g012
Figure 13. (a) Significance test statistics of wetland pattern index–HDI correlations by region. (b) Significance test statistics of wetland pattern index–HDI correlations by wetland type.
Remotesensing 16 00702 g013
Table 1. Description of data sources.
DatasetResolutionSourceTime Scale
GlobeLand30_LUCC30 mNational Catalogue Service For Geographic Information [38]2000–2020
CLCD_LUCC30 mLand use data from Jie Yang et al., Wuhan University [39]1990–2020
CN_LUCC1 kmResource and Environment Science and Data Center [37]1990–2020
Precipitation1 kmNational Tibetan Plateau Data Center [50]1990–2020
Temperature1 kmNational Tibetan Plateau Data Center [51]1990–2020
Table 2. Classification of HDI (human disturbance index).
SubcategoryMeaningInterference Index
Construction landResidential land, industrial land, energy development land0.99
FarmlandLand for dry crops0.70
Paddy fieldRice fields0.65
Garden landArbor garden, shrub garden0.57
ForestNatural forest, plantation, sparse forest0.55
LakeA naturally bounded body of water dominated by oxbow lakes0.30
Reservoir pits/pondsReservoirs and aquaculture0.30
RiverPermanent rivers0.23
BeachFloodplain, river bank, sandbank0.17
MarshForest marsh, shrub marsh, coastal wetland0.15
Unused landUnused land including hard-to-utilize land0.10
Table 3. Main climatic factors affecting wetlands within China’s drylands.
RegionDominant FactorsIndex
PDNPLSIAI
ChinaPrecipitation59.48%65.15%65.43%65.89%
Temperatures40.52%34.86%34.57%34.11%
XJPrecipitation67.02%70.66%70.54%70.68%
Temperatures32.97%29.33%29.46%29.32%
HCRPrecipitation49.26%58.11%58.85%59.86%
Temperatures50.74%41.89%41.45%40.14%
Table 4. Main factors affecting wetlands within China’s drylands.
RegionFactorsIndex
PDNPLSIAI
ChinaClimatic factors41.74%43.72%41.73%44.00%
HDI58.26%56.28%58.27%56.00%
XJClimatic factors37.36%37.51%36.89%39.50%
HDI62.64%62.49%63.11%60.50%
HCRClimatic factors47.56%50.39%47.80%49.43%
HDI52.44%49.61%52.20%50.57%
Note: Climatic factors derived from the sum of the percentage of area in which precipitation and temperature are the dominant factors.
Disclaimer/Publisher’s Note: The statements, opinions and data contained in all publications are solely those of the individual author(s) and contributor(s) and not of MDPI and/or the editor(s). MDPI and/or the editor(s) disclaim responsibility for any injury to people or property resulting from any ideas, methods, instructions or products referred to in the content.

