Article

Instantaneous Extraction of Indoor Environment from Radar Sensor-Based Mapping

1
School of Electronics and Information Engineering, College of Engineering, Korea Aerospace University, Goyang-si 10540, Republic of Korea
2
School of Electrical and Electronics Engineering, College of ICT Engineering, Chung-Ang University, Seoul 06974, Republic of Korea
*
Author to whom correspondence should be addressed.
Remote Sens. 2024, 16(3), 574; https://doi.org/10.3390/rs16030574
Submission received: 30 December 2023 / Revised: 26 January 2024 / Accepted: 30 January 2024 / Published: 2 February 2024

Abstract

:
In this paper, we propose a method for extracting the structure of an indoor environment using radar. When using the radar in an indoor environment, ghost targets are observed through the multipath propagation of radio waves. The presence of these ghost targets obstructs accurate mapping in the indoor environment, consequently hindering the extraction of the indoor environment. Therefore, we propose a deep learning-based method that uses image-to-image translation to extract the structure of the indoor environment by removing ghost targets from the indoor environment map. In this paper, the proposed method employs a conditional generative adversarial network (CGAN), which includes a U-Net-based generator and a patch-generative adversarial network-based discriminator. By repeating the process of determining whether the structure of the generated indoor environment is real or fake, CGAN ultimately returns a structure similar to the real environment. First, we generate a map of the indoor environment using radar, which includes ghost targets. Next, the structure of the indoor environment is extracted from the map using the proposed method. Then, we compare the proposed method, which is based on the structural similarity index and structural content, with the k-nearest neighbors algorithm, Hough transform, and density-based spatial clustering of applications with noise-based environment extraction method. When comparing the methods, our proposed method offers the advantage of extracting a more accurate environment without requiring parameter adjustments, even when the environment is changed.

Graphical Abstract

1. Introduction

Recently, autonomous driving is gaining attention not only in the automotive field, but also in the indoor robot field. The core technology for autonomous driving is to figure out the environment around the automobile or robot using the camera, lidar, and radar sensor. However, camera and lidar sensors do not exhibit consistent performance. For instance, lidar encounters challenges when dealing with lengthy corridors and obstructions, such as fog, smoke, dust, and debris [1]. Additionally, its relatively elevated cost can impose restrictions on its applicability across various use cases. Also, while cameras can be used for the extraction of indoor structures, it requires a light source, and there may be potential privacy issues. On the other hand, radar sensors have the advantage of maintaining a relatively stable detection performance even in such an environment [2].
Due to these advantages, several research works have been conducted to generate environment maps using the radar sensor [3,4,5,6,7]. The authors of [3] demonstrate the use of radar to localize and map the position of a robot even under foggy weather conditions. Furthermore, the authors of [4] demonstrate the application of simultaneous localization and mapping technology using frequency-modulated continuous wave (FMCW) radar in visually impaired environments. The authors of [5] showed that mapping of the indoor environment is possible under smoky conditions using millimeter wave radar. In addition, the authors of [6] mapped the indoor environment using multiple-input and multiple-output (MIMO) FMCW radar, and the authors of [7] mapped a forest using synthetic aperture radar.
When using radar sensors in indoor environments, there is a disadvantage of ghost targets being generated by the multiple reflections of radio waves [8]. The presence of ghost targets obstructs the accurate extraction of the indoor environment’s structure. Therefore, it is necessary to remove ghost targets when using radar sensor in an indoor environment, and various related researches are being conducted [9,10,11]. For instance, the authors of [9] have proposed a method for removing ghost targets in indoor environments by comparing the received signal with a threshold value. In [10], the authors propose a method for removing ghost targets based on the Hough transform that uses the linear correlation between the target and multipath within a range-Doppler map. The author of [11] classified targets and noise using the alpha-extended Kalman filter in crowded indoor situations.
However, conventional ghost target removal methods require adjusting parameters to achieve optimal results in varying experimental environments. Thus, there has been an increasing focus on using deep learning to detect ghost targets in recent years [12,13,14]. For example, the authors of [12] proposed a method for removing ghost targets using U-Net and the authors of [13] identified targets in a cluttered environment using convolutional neural networks. Additionally, in [14], the authors proposed a deep neural network-based classifier that uses features such as distance, angle, and signal strength of the targets to distinguish ghost targets. In this paper, we propose a method for extracting the structure of the indoor environment with ghost targets removed using pix2pix [15] without the requirement for parameter adjustment, even in various environments. First, we acquire the detection results of targets in indoor environments using an FMCW radar. Next, using the acquired information on distance, azimuth angle, and elevation angle, we generate an indoor environment map that includes ghost targets. Then, using the proposed method, we extract a structured indoor environment map by removing ghost targets and simultaneously interpolating the unmeasured areas. The proposed method extracts indoor structures using generative adversarial networks (GANs). The generator generates the image of an indoor structure, and the discriminator evaluates the authenticity of the generated images. This process generates the structure of an indoor environment that closely resembles the real environment. Finally, we evaluate the performance of the proposed method using the structural similarity index measure (SSIM) and structural content (SC). Also, we compare the extracted result of the proposed method with the k-nearest neighbors (KNNs) algorithm, the Hough transform, and density-based spatial clustering of applications with noise (DBSCAN)-based structure extraction method.
In summary, the major contributions of our study can be summarized as follows:
  • The proposed method removes the ghost targets generated by the multiple reflections of radio waves and extracts the structure of the indoor environment.
  • The proposed method not only removes general ghost targets, but also performs partial interpolation of the unmeasured areas, resulting in an extracted structure of the indoor environment that closely resembles the actual environment.
  • Unlike conventional methods for structure extraction, the proposed method does not require parameter adjustments in different environments and can extract the structure of an indoor environment using the same parameter settings.
The remainder of this paper is organized as follows. First, in Section 2, we introduce the process of detecting a target and estimating its distance, velocity, and angle in an FMCW radar system. In Section 3, we describe the experimental environment and demonstrate the detection results of the target in indoor environments. Then, in Section 4, we describe the image-to-image translation model architecture used in this paper and evaluate the performance of the proposed method. Finally, we conclude this paper in Section 6.

2. Radar Signal Analysis

2.1. Distance and Velocity Estimation Using FMCW Radar Signal

The FMCW radar system transmits radio waves that have frequencies changing linearly over time, as shown in Figure 1. In this figure, Δ t , Δ f , and f c denote the duration, bandwidth, and center frequency of the q-th chirp, respectively. The transmitted signal for the q-th chirp can be expressed as
s t ( t ) = A t , q exp j 2 π f c t + Δ f q 2 Δ t t 2 ( q 1 ) Δ t ) t q Δ t .
The transmitted signal is reflected off the target, which is then received through the receiving antenna. The received signal includes Doppler shift caused by the relative velocity of the target, time delay caused by distance to the target, and signal attenuation. When v k represents the relative velocity and R k represents the distance to the k-th target, the received signal for the q-th chirp can be expressed as
s r ( t ) = A r , q exp j 2 π ( f c + 2 f c v k c ) ( t 2 R k c ) + Δ f q 2 Δ t ( t 2 R k c ) 2 ( q 1 ) Δ t + 2 R k c ) t q Δ t + 2 R k c ,
where A r , q denotes the attenuated signal amplitude.
As shown in Figure 2, the received signal is down-converted to a baseband signal through a frequency mixer and a low-pass filter. This baseband signal is subsequently sampled in the time domain through an analog-to-digital converter. The sampled signal for the q-th chirp can be expressed as
b [ p , q ] = k = 1 N k A k exp [ j 2 π { 2 Δ f ( R k + v k q Δ t ) c Δ t + 2 v k f c c p T s + 2 f c c ( R k + v k q Δ t ) } ] ,
where N k is the number of targets, and p ( p = 1 , 2 , , N p ) and q ( q = 1 , 2 , , N q ) represent the index of time samples and chirps, respectively. In addition, A k denotes the amplitude of the signal, and T s denotes the sampling time.
The time-sampled signal can be arranged into a two-dimensional matrix as shown in Figure 3. In addition, to estimate both the distance and velocity of the target, we apply the Fourier transform along the sampling axis (p-axis) and the chirp axis (q-axis) of the matrix, respectively, followed by peak detection. The result of the two-dimensional Fourier transform of (3) can be expressed as
B [ r , s ] = 1 N p N q p = 1 N p q = 1 N q b [ p , q ] × exp j 2 π r p N p + s q N q ,
where r ( r = 1 , 2 , , N p ) and s ( s = 1 , 2 , , N q ) denote the index in frequency domain.

2.2. Angle Estimation Using MIMO Antenna System

To accurately locate a target, it is essential to estimate not only the distance but also the angle between the radar sensor and the target. We describe a method for estimating the azimuth and elevation angle using a MIMO antenna array. If we assume that the elevation and azimuth angles between the center of the antenna and the k-th target are denoted as ϕ k and θ k , respectively, then (3), which represents the sampled baseband signal, can be extended as
b [ p , q , u , v ] = k = 1 N k A k exp [ j 2 π { 2 Δ f ( R k + v k q Δ t ) c Δ t + 2 v k f c c p T s + f c d t , a sin θ k c ( u 1 ) + f c d r , a sin θ k c ( v 1 ) + f c d t , e sin ϕ k c ( u 1 ) + f c d r , e sin ϕ k c ( v 1 ) + 2 f c c ( R k + v k q Δ t ) } ] ,
where d t , e and d t , a denote the distance between elements of the transmitting antenna in elevation and azimuth directions, respectively. Similarly, d r , e and d r , a denote the distance between elements of the receiving antenna in the elevation and azimuth directions, respectively. In addition, u ( u = 1 , 2 , , N T ) and v ( v = 1 , 2 , , N R ) represent the index of the elements of the transmitting and receiving antenna. When N T and N R represent the number of elements of the transmitting and receiving antenna, the total number of virtual receiving channels can be increased up to N T × N R [16]. Therefore, when using the MIMO antenna, the data cube can be expanded to a three-dimensional data cube with a size of N p × N q × N T × N R .
To estimate the azimuth angle of the target, we need to select a subset of virtual receiving channels aligned along the azimuth direction. The data cube is constructed with a size of N p × N q × N A , as shown in Figure 4a, with N A representing the number of channels in azimuth direction. Then, if the index of the k-th target obtained through (4) is denoted as r k and s k , it is possible to extract a total of N A sampling values, as shown in Figure 4b. The signal vector consisting of the sampled values from channels N A can be represented as
B A = B 1 [ r k , s k ] B 2 [ r k , s k ] B N A [ r k , s k ] .
Next, we generated the correlation matrix using the signal vector, which is represented as
R A = 1 N s B A B A H .
In Equation (7), N s denotes the number of snapshots, which is the number of independent datasets collected over different time intervals. In addition, the symbol · H represents the Hermitian operator, which is the form of conjugate transpose.
Finally, the angle estimation can be performed using digital beamforming techniques (e.g., Bartlett, Capon) [17]. We used Bartlett’s method to estimate the angle, and the normalized pseudospectrum of Bartlett’s beamformer can be represented as
P A ( θ ) = a A H ( θ ) R A a A ( θ ) max ( a A H ( θ ) a A ( θ ) ) ,
where a A ( θ ) is a steering vector that takes into account the distance in the azimuth direction, and the estimated azimuth angle for the k-th target is the θ that maximizes the value of the normalized pseudospectrum.
Estimating the elevation angle is similar to estimating the azimuth angle. When estimating the elevation angle, the difference is that a subset of virtual receiving channels arranged in the elevation direction are selected and the steering vector takes into account the distance in the elevation direction.

3. Indoor Environment Mapping Using Radar Sensor

3.1. Radar Sensor Used in Measurements

In this paper, we conducted indoor environment mapping using a dual-mode radar sensor that offers both long-range and short-range detection capabilities using a single radar sensor [18]. Figure 5 shows the time–frequency slope in each frame of the dual-mode radar system. As shown in Figure 5, the radar system uses two waveforms with different bandwidths within a single frame to perform long-range and short-range detection. In our radar system, the long-range detection mode uses a narrow bandwidth to detect distant targets with lower range resolution. Conversely, the short-range detection mode uses a wide bandwidth to detect nearby targets with higher range resolution. The radar system used in this study operates at a center frequency of 62 GHz, with a bandwidth of 1.5 GHz used for long-range detection and a 3 GHz bandwidth used for short-range detection. In addition, the radar system has a maximum detection range of 20 m and a range resolution of 0.1 m in long-range detection mode. In short-range detection mode, the maximum detection range is 10 m and a range resolution of 0.05 m. The system is configured with 128 chirps and 256 samples per chirp. Furthermore, the radar system is operated with a 2-by-4 MIMO antenna system, enabling a high level of angular resolution despite its compact size. The radar system operates within a field of view (FOV) ranging from −20° to 20° in long-range mode and −60° to 60° in short-range mode. The specifications of the radar system are summarized in Table 1.

3.2. Measurement Environment

In this paper, the experiment was conducted in three different environments, as shown in Figure 6: The Electronics Engineering Building at Korea Aerospace University (KAU) (i.e., E1); 7th floor, Business and Economics Building (i.e., E2) at Chung-Ang University (CAU); and 9th floor, Business and Economics Building (i.e., E3) at CAU. As shown in Figure 6, the environment of E1 exhibits a 90 left-bent L-shaped structure, and the environment of E2 exhibits a 120 right-bent structure. The environment of E3 represents a T-shaped structure, with each hallway having a different width. Experimental data were collected by mounting a radar on a cart and moving it at intervals of 0.4, 0.225, and 0.45m in each measurement environment. Consequently, the experimental data were obtained at 68 points, 61 points, and 53 points in the E1, E2, and E3 environments, respectively. Then, a map of the indoor environment was generated by accumulating the obtained experimental data.

3.3. Target Detection Results

As mentioned in Section 2, information of the target (i.e., the distance, elevation angle, and azimuth angle) can be obtained using radar. We can represent the position of the target on the x y plane using ( x k , y k ) = ( d k cos ϕ k sin θ k , d k cos ϕ k cos θ k ) about target information, as shown in Figure 7. In Figure 8, the blue points represent the detected targets, and the yellow line represents the location of the actual wall in indoor environments. As shown in the figure, targets were commonly detected in positions that closely resembled the actual walls in all three environments. However, some targets were detected in positions where the actual wall was absent (i.e., in areas without physical structure). In indoor environments, the radio waves in the millimeter wave band are reflected or scattered, resulting in multipath reflections. As a result of these multipath reflections, ghost targets are generated, which are non-existent targets. Consequently, maps generated using information that includes these ghost targets do not accurately represent the structure of the actual environment. Therefore, in Section 4, we introduce a method that uses image-to-image translation to extract the structure of the indoor environment with ghost targets removed.

4. Proposed Environment Extraction Method

In this section, we describe the conditional GAN (CGAN), which is commonly used in image-to-image translation tasks. Additionally, we provide an explanation of the structure and parameters of the model used in this paper.

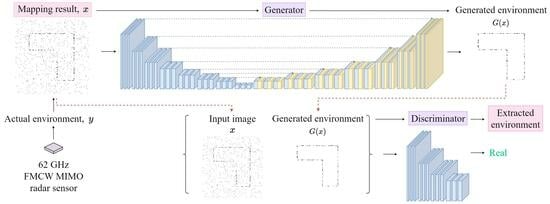
4.1. Conditional GAN for Environment Extraction

4.1.1. Basic Structure of Conditional GAN

The image-to-image translation is the task of transforming the domain or style of an image, such as modifications to its appearance, characteristics, and visual style. Recently, deep learning techniques, specifically GANs, have been widely used for image-to-image translation [19]. The GAN consists of two separate networks: the generator, responsible for generating synthetic images (i.e., fake images), and the discriminator, which distinguishes between real and fake images. The generator and discriminator continually update their parameters through training, improving their respective performance. In the training process, the loss function of the GAN is designed to minimize the generator’s loss and maximize the discriminator’s loss using a min–max strategy during the training process, which can be represented as
G * = arg min G max D L GAN ( G , D ) ,
where L GAN denotes the loss function of the GAN. The L GAN can be expressed as
L GAN ( G , D ) = E X , Z log D ( X , Z ) + E X log ( 1 D ( X , G ( X ) ) ) ,
where X and Z represent the real image and noise vector, respectively. At the beginning of the training, the generator produces results that resemble noise. However, as the training continues, the generator gradually produces synthetic images that become increasingly indistinguishable from real images.
However, traditional GANs have a disadvantage in generating the desired types of images or image styles. This is because traditional GANs learn how to generate images from random noise vectors without any specific instructions or constraints on the type of image being generated. As a result, while traditional GANs can generate a variety of images, they lack the ability to consistently target a specific style or type. To overcome this disadvantage, a recent focus has been on CGAN that receive conditional information such as image class and style to generate images in the desired form [20]. In a CGAN, the generator uses the received conditional information to produce a fake image. Moreover, the discriminator uses conditional information to differentiate between real and fake images. In other words, unlike traditional GANs, CGANs use conditional information in both the generator and discriminator.
The loss function of the CGAN can be expressed as:
L CGAN ( G , D ) = E X , Y log D ( X , Y ) + E X , Y log ( 1 D ( X , G ( Z , Y ) ) ) ,
where Y represents the conditional information. In (11), CGAN uses conditional information to apply a min–max strategy, when compared to (10). Finally, the training process employs the L1 loss function, expressed as
L L 1 ( G ) = X x , y , z y G ( x , z ) 1 ,
and the incorporated loss function can be expressed as
G * = arg min G max D L CGAN ( G , D ) + λ L L 1 ( G ) ,
where λ denotes the weight of the loss function. In this paper, we use pix2pix, a type of CGAN, to extract the structure of an indoor environment with ghost targets removed.

4.1.2. Structure of Proposed Method

The pix2pix is a type of CGAN that uses images as conditional information, and is composed as shown in Figure 9. As shown in the figure, the proposed method takes images as conditional information and trains the relationship between the transformed image (i.e., conditional information) and the untransformed image (i.e., input information), as shown in Figure 10. For the training of the deep learning network, we generated an image resembling the indoor structure map, as shown in Figure 10a. Additionally, as a counterpart to this, in Figure 10b, we added noise components to the generated image to represent ghost targets and unmeasured points occurring when using radar. In other words, Figure 10a performs the extracted indoor environment results (i.e., transformed image), and Figure 10b performs the role of the actual radar measurement result (i.e., untransformed image).
In this paper, the proposed method consists of a U-Net-based generator and a patch-GAN-based discriminator. We chose a U-Net-based generator because U-Net is proficient at eliminating unnecessary noise, extracting crucial features from images, and accurately capturing the underlying structures. The generator comprises eight down-sampling layers that perform as encoders, as well as seven up-sampling layers that perform as decoders. In the encoder–decoder architecture of the generator, skip connections are applied between the layers to recover lost information during the down-sampling operation. The discriminator uses patch-GAN architecture, enabling it to distinguish between real and fake images at a local patch level by learning the structure of specific patch scales. In our work, the discriminator consists of four down-sampling layers performing as encoders. Our training dataset consists of 5000 pairs of images, which are combinations of structure images with ghost targets and structure images without ghost targets (i.e., conditional information). When generating images that include ghost targets, we considered the multipath effects that occur when measuring indoor structures through radar. The training process consisted the number of 100 epochs, during which the generator and discriminator employed the rectified linear unit (ReLU) as activation function. The parameters used in the training of the proposed method are listed in Table 2.

5. Performance Evaluation

In this section, we demonstrate and evaluate the extracted structure of the indoor environment using the proposed method. In addition, we compare the extraction results of the indoor environment using the conventional signal processing method with the results obtained using the proposed method.

5.1. Performance Evaluation of the Proposed Method

The extracted structure of the indoor environment using the proposed method is shown in Figure 11. In this figure, each row represents the structure of the indoor environment for different experimental environments. The first, second, and third rows are the extracted indoor environment structures for E1, E2, and E3, respectively. In addition, each column represents the result of adjusting the epoch of the proposed method. The first, second, and third columns are the results at epochs 5, 10, and 100, respectively. When comparing Figure 11c,f,i with Figure 8a–c, Figure 11c,f,i exhibit a closer resemblance to the actual environment by removing ghost targets and interpolating the unmeasured areas. Furthermore, as the number of epochs in the proposed method increases, the generated results more closely resemble the actual environment. However, if the number of epochs in deep learning is set too high, it can result in longer training times and increases the risk of overfitting. Therefore, we compared the training time and extracted results, and set the number of epochs to 100.

5.2. Comparison between the Proposed Method and Conventional Methods

In this section, we compared the extracted results of the indoor environment obtained through our proposed method with those obtained using the KNN algorithm, Hough transform, and the density-based spatial clustering of applications with noise (DBSCAN) algorithm. In radar measurements, indoor structures such as walls are typically observed in close proximity to each other, while ghost targets manifest at significant distances from these structures or adjacent ghost targets. The KNN algorithm is a non-parametric classification and regression technique that classifies data based on the class of its nearest neighbors [21,22]. Therefore, when applying the KNN algorithm to radar measurements, indoor structures tend to form clusters among themselves, while ghost targets typically create clusters with adjacent ghost targets. When the number of data in a cluster is less than a predefined threshold value, the data from that cluster are classified as ghost targets and removed. Figure 12a–c show the extracted results of the indoor environment using the KNN algorithm for environments E1, E2, and E3, respectively. As shown in the figure, some of the ghost targets were removed using the KNN algorithm, but the ghost target located around the actual wall was not removed. In addition, unlike our proposed method, this method only performs the removal of ghost targets and does not perform interpolation on unmeasured areas.
The Hough transform is an algorithm to detect geometric relationships, such as straight lines and circles, from a given set of points [23,24,25]. We used the Hough transform to detect linear components (e.g., walls) in the indoor environment and to extract the structure of the indoor environment. The structure of the indoor environment extracted using the Hough transform is shown in Figure 12d–f. As shown in the figure, the ghost targets are removed using the Hough transform, and the unmeasured area is partially interpolated. However, the extracted results have a problem: the indoor environment is represented by several overlapping lines instead of a single line and the ghost target is also represented by a line.
Finally, we compared the results of applying DBSCAN, a typical approach for the elimination of ghost targets. The DBSCAN algorithm classifies targets through density-based clustering, which separates low-density points in the surrounding area by considering them as ghost targets. Figure 12g–i show the extracted results of the indoor environment using the DBSCAN algorithm for environments E1, E2 and E3, respectively. As shown in the figure, some of the ghost targets were removed using the DBSCAN algorithm, but ghost targets with high density were not removed. In the case of indoor environment mapping, it is difficult to remove ghost targets through a density-based clustering method because the results do not appear as clusters, but as continuous points. In addition, This method also has the disadvantage of not performing interpolation on unmeasured areas.
In addition, the three conventional methods (i.e., KNN algorithm, Hough transform, and DBSCAN) have the disadvantage of requiring parameter adjustments according to the environment for extracting the structure of the indoor environment. On the other hand, our proposed method has the advantage that it can be widely used without additional parameter adjustments in varying environments.
Moreover, we used SSIM and SC to quantitatively evaluate the structural similarity between the extracted result of the indoor environment and the actual environment. The SSIM evaluates the similarity between two images by considering differences in luminance, contrast, and structure [26]. The SSIM of the extracted results using each method are shown in Table 3. The similarity between the structures extracted by the proposed method and the actual indoor environment was calculated using SSIM, resulting in values of 0.9530 for E1, 0.9562 for E2, and 0.9653 for E3. In comparison, when using the KNN algorithm in E1, E2, and E3, the SSIM similarities were 0.9036, 0.9485, and 0.9361, respectively. Similarly, when using the Hough transform, the SSIM similarities were 0.8711, 0.9388, and 9852, and when using DBSCAN, the SSIM similarities were 0.8971, 0.9463, and 9359.
In addition, the SC is a metric used to assess the similarity between two images by focusing on the differences in structural information [27]. SC is calculated by dividing the sum of the squares of the pixel values of one image by the sum of the squares of the pixel values of the other image. The results of evaluating the SC for our proposed method in E1, E2, and E3 are 0.9935, 0.9987, and 1.0001, respectively. Additionally, the SC calculation results for E1, E2, and E3 are as follows. k-NN: 0.9822, 0.9927, 0.9832; Hough transform: 0.9896, 0.9852, 0.9855; DBSCAN: 0.9836, 0.9930, 0.9833. These results can be found in Table 4.
Finally, when comparing our proposed method to the conventional method, the proposed method demonstrated superiority in both the extraction process and the extracted result.

6. Conclusions

In this paper, we proposed a method of extracting the structure of the indoor environment using image-to-image translation. When using radar in the indoor environment, ghost targets are generated by the multipath of radio waves. The presence of ghost targets causes a difference between the generated map and the actual environment. Therefore, we used the proposed method to extract the structure of the indoor environment, where ghost targets were removed and unmeasured areas were interpolated. We extracted the structure of the indoor environment in three environments using the image-to-image translation, obtaining results that resembled the actual environment. Moreover, as the number of epochs in the proposed method increased, we obtained results that were more similar to the actual environment. The similarity between the extracted structure of the indoor environment and the actual environment was evaluated using the SSIM and SC, resulting in an average similarity of 0.95 and 0.99, respectively. Finally, we compared our proposed method with the KNN algorithm, Hough transform, and DBSCAN-based method of indoor environment extraction. When compared with these conventional methods, our proposed method has the advantage of extracting the indoor environment without requiring parameter adjustments in different environments. In addition, since the proposed method interpolates the unmeasured area, extracted results were more similar to the actual indoor environments. We hope that our research findings contribute to the extraction of indoor environments using radar technology and are used for this purpose.

Author Contributions

Conceptualization, S.L.; methodology, S.L.; software, S.C.; validation, S.C. and S.K.; investigation, S.C.; resources, S.L.; data curation, S.C. and S.K.; writing—original draft preparation, S.C. and S.K.; writing—review and editing, S.L.; visualization, S.C.; supervision, S.L.; project administration, S.L.; funding acquisition, S.L. All authors have read and agreed to the published version of the manuscript.

Funding

This work was supported by the Technology development Program (S3291987) funded by the Ministry of SMEs and Startups (MSS, Korea). This work was also supported by the Chung-Ang University Research Grants in 2023.

Data Availability Statement

The data presented in this study are available on request from the corresponding author. The data are not publicly available due to privacy.

Conflicts of Interest

The authors declare no conflicts of interest. The funders had no role in the design of the study; in the collection, analyses, or interpretation of data; in the writing of the manuscript; or in the decision to publish the results.

Abbreviations

The following abbreviations are used in this manuscript:
CAUChung-Ang University
CGANConditional generative adversarial network
DBSCANDensity-based spatial clustering of applications with noise
FOVField of view
FMCWFrequency-modulated continuous wave
GANGenerative adversarial network
KAUKorea Aerospace University
KNNk-nearest neighbor
MIMOMultiple-input and multiple-output
ReLURectified linear unit
SCStructural content
SSIMStructural similarity index measure

References

  1. Zhang, A.; Atia, M.M. Comparison of 2D localization using radar and lidar in long corridors. In Proceedings of the 2020 IEEE SENSORS. In Proceedings of the 2020 IEEE SENSORS, Rotterdam, The Netherlands, 25–28 October 2020; pp. 1–4. [Google Scholar]
  2. Vargas, J.; Alsweiss, S.; Toker, O.; Razdon, R.; Santos, J. An overview of autonomous vehicles sensors and their vulnerability to weather conditions. Sensors 2021, 21, 5397. [Google Scholar] [CrossRef] [PubMed]
  3. Dogru, S.; Marques, L. Evaluation of an automotive short range radar sensor for mapping in orchards. In Proceedings of the 2018 IEEE International Conference on Autonomous Robot Systems and Competitions (ICARSC), Torres Vedras, Portugal, 25–27 April 2018; pp. 78–83. [Google Scholar]
  4. Marck, J.W.; Mohamoud, A.; Houwen, E.V.; Heijster, R.V. Indoor radar SLAM: A radar application for vision and GPS denied environments. In Proceedings of the 2013 European Radar Conference, Nuremberg, Germany, 9–11 October 2013; pp. 471–474. [Google Scholar]
  5. Lu, C.X.; Rosa, S.; Zhao, P.; Wang, B.; Chen, J.; Stankovic, A.; Trigoni, N.; Markham, A. See through smoke: Robust indoor mapping with low-cost mmwave radar. In Proceedings of the 18th ACM International Conference on Mobile Systems, Toronto, ON, Canada, 16–18 June 2020; pp. 14–27. [Google Scholar]
  6. Kwon, S.-Y.; Kwak, S.; Kim, J.; Lee, S. Radar sensor-based ego-motion estimation and indoor environment mapping. IEEE Sens. J. 2023, 23, 16020–16031. [Google Scholar] [CrossRef]
  7. Martone, M.; Marino, A. Editorial for the Special Issue “SAR for Forest Mapping II”. Remote Sens. 2023, 15, 4376. [Google Scholar] [CrossRef]
  8. Abdalla, A.T.; Alkhodary, M.T.; Muqaibel, A.H. Multipath ghosts in through-the-wall radar imaging: Challenges and solutions. ETRI J. 2018, 40, 376–388. [Google Scholar] [CrossRef]
  9. Choi, J.W.; Kim, J.H.; Cho, S.H. A counting algorithm for multiple objects using an IR-UWB radar system. In Proceedings of the 2012 3rd IEEE International Conference on Network Infrastructure and Digital Content, Beijing, China, 21–23 September 2012; pp. 591–595. [Google Scholar]
  10. Feng, R.; Greef, E.D.; Rykunov, M.; Sahli, H.; Pollin, S.; Bourdoux, A. Multipath ghost recognition for indoor MIMO radar. IEEE Trans. Geosci. Remote Sens. 2021, 60, 5104610. [Google Scholar] [CrossRef]
  11. Jiang, M.; Guo, S.; Luo, H.; Yao, Y.; Cui, G. A Robust Target Tracking Method for Crowded Indoor Environments Using mmWave Radar. Remote Sens. 2023, 15, 2425. [Google Scholar] [CrossRef]
  12. Stephan, M.; Santra, A. Radar-based human target detection using deep residual U-Net for smart home applications. In Proceedings of the 2019 18th IEEE International Conference On Machine Learning And Applications (ICMLA), Boca Raton, FL, USA, 16–19 December 2019; pp. 175–182. [Google Scholar]
  13. Mohanna, A.; Gianoglio, C.; Rizik, A.; Valle, M. A Convolutional Neural Network-Based Method for Discriminating Shadowed Targets in Frequency-Modulated Continuous-Wave Radar Systems. Sensors 2022, 22, 1048. [Google Scholar] [CrossRef] [PubMed]
  14. Jeong, T.; Lee, S. Ghost target suppression using deep neural network in radar-based indoor environment mapping. IEEE Sens. J. 2022, 22, 14378–14386. [Google Scholar] [CrossRef]
  15. Isola, P.; Zhu, J.Y.; Zhou, T.; Efros, A.A. Image-to-image translation with conditional adversarial networks. In Proceedings of the 2017 IEEE Conference on Computer Vision and Pattern Recognition (CVPR), Honolulu, HI, USA, 21–26 July 2017; pp. 5967–5976. [Google Scholar]
  16. Singh, H.; Chattopadhyay, A. Multi-target range and angle detection for MIMO-FMCW radar with limited antennas. arXiv 2023, arXiv:2302.14327. [Google Scholar]
  17. Grythe, J. Beamforming Algorithms-Beamformers; Technical Note; Norsonic: Tranby, Norway, 2015; pp. 1–5. [Google Scholar]
  18. Lee, S.; Kwon, S.-Y.; Kim, B.-J.; Lee, J.-E. Dual-mode radar sensor for indoor environment mapping. Sensors 2021, 21, 2469. [Google Scholar] [CrossRef] [PubMed]
  19. Goodfellow, I.; Abadie, J.P.; Mirza, M.; Xu, B.; Warde-Farley, D.; Ozair, S.; Courville, A.; Bengio, Y. Generative adversarial nets. In Proceedings of the 27th International Conference on Neural Information Processing Systems, Cambridge, MA, USA, 8–13 December 2014; pp. 2672–2680. [Google Scholar]
  20. Mirza, M.; Osindero, S. Conditional generative adversarial nets. arXiv 2014, arXiv:1411.1784. [Google Scholar]
  21. Li, R.L.; Hu, Y.F. Noise reduction to text categorization based on density for KNN. In Proceedings of the 2003 International Conference on Machine Learning and Cybernetics, Xi’an, China, 5 November 2003; pp. 3119–3124. [Google Scholar]
  22. Sha’Abani, M.N.A.H.; Fuad, N.; Jamal, N.; Ismail, M.F. kNN and SVM classification for EEG: A review. In Proceedings of the 5th International Conference on Electrical, Control and Computer Engineering, Singapore, 29–30 July 2019; Springer: Berlin/Heidelberg, Germany, 2019; pp. 555–565. [Google Scholar]
  23. Lim, S.; Lee, S. Hough transform based ego-velocity estimation in automotive radar system. Electron. Lett. 2021, 57, 80–82. [Google Scholar] [CrossRef]
  24. Wang, J.; Howarth, P.J. Use of the Hough transform in automated lineament. IEEE Trans. Geosci. Remote Sens. 1990, 28, 561–567. [Google Scholar] [CrossRef]
  25. Moallem, M.; Sarabandi, K. Polarimetric study of MMW imaging radars for indoor navigation and mapping. IEEE Trans. Antennas Propag. 2014, 62, 500–504. [Google Scholar] [CrossRef]
  26. Dosselmann, R.; Yang, X.D. A comprehensive assessment of the structural similarity index. Signal Image Video Process. 2009, 5, 81–91. [Google Scholar] [CrossRef]
  27. Memom, F.; Unar, M.A.; Memom, S. Image Quality Assessment for Performance Evaluation of Focus Measure Operators. arXiv 2016, arXiv:1604.00546. [Google Scholar]
Figure 1. Transmitted signal of FMCW radar system.
Remotesensing 16 00574 g001
Figure 2. Block diagram of the MIMO FMCW radar system.
Remotesensing 16 00574 g002
Figure 3. Distance and velocity estimation: (a) apply the Fourier transform along the sampling axis and then (b) apply the Fourier transform along the chirp axis.
Remotesensing 16 00574 g003aRemotesensing 16 00574 g003b
Figure 4. Data processing for azimuth angle estimation: (a) receiving channel selection for angle estimation of the azimuth direction and (b) selection of the time sample index and chirp index corresponding to the target.
Remotesensing 16 00574 g004
Figure 5. Transmitted signal of dual-mode FMCW radar system.
Remotesensing 16 00574 g005
Figure 6. Measurement environments: (a) Electronics Engineering Building at KAU; (b) 7th floor, Business and Economics Building at CAU; and (c) 9th floor, Business and Economics Building at CAU.
Remotesensing 16 00574 g006
Figure 7. Estimated target information from the radar sensor data.
Remotesensing 16 00574 g007
Figure 8. Detection results of the indoor environment with ghost targets: (a) Electronics Engineering Building at KAU; (b) 7th floor, Business and Economics Building at CAU; and (c) 9th floor, Business and Economics Building at CAU.
Remotesensing 16 00574 g008
Figure 9. Architecture of the proposed method: (a) generator, (b) discriminator, and (c) layers indicated by arrow color.
Remotesensing 16 00574 g009
Figure 10. Example of training image: (a) transformed and (b) untransformed images.
Remotesensing 16 00574 g010
Figure 11. Structure extraction results of the indoor environment when the training epochs of proposed method were changed to 5, 10, and 100: (ac) for Electronics Engineering Building at KAU; (df) for 7th floor, Business and Economics Building at CAU; (gi) for 9th floor, Business and Economics Building at CAU.
Remotesensing 16 00574 g011aRemotesensing 16 00574 g011b
Figure 12. Extracted indoor environment map using conventional method: (ac) for KNN algorithm, (df) for Hough transform, (gi) for DBSCAN.
Remotesensing 16 00574 g012
Table 1. Specifications of the radar sensor.
Detection ModeLong-Range ModeShort-Range Mode
Bandwidth, B (GHz)1.53
The number of chirps, N c 256256
The number of time samples, N s 128128
Maximum detectable range (m)2010
Range resolution (m)0.10.05
FOV () 20 20 60 60
Table 2. Specifications of parameters used in the training for proposed method.
ParameterValue
The size of generator input layer3
The size of generator output layer3
Activation function of generatorReLU
The size of discriminator input layer3
The size of discriminator output layer1
Activation function of discriminatorReLU
The number of training dataset5000
The number of epochs100
Table 3. SSIM calculation results when using each method.
Measurement EnvironmentE1E2E3
Proposed method0.95300.95620.9653
KNN algorithm0.90360.94850.9361
Hough transform0.87110.93880.9852
DBSCAN0.89710.94630.9359
Table 4. SC calculation results when using each method.
Measurement EnvironmentE1E2E3
Proposed method0.99350.99871.0001
KNN algorithm0.98220.99270.9832
Hough transform0.98960.98520.9855
DBSCAN0.98360.99300.9833
Disclaimer/Publisher’s Note: The statements, opinions and data contained in all publications are solely those of the individual author(s) and contributor(s) and not of MDPI and/or the editor(s). MDPI and/or the editor(s) disclaim responsibility for any injury to people or property resulting from any ideas, methods, instructions or products referred to in the content.

