
Decline in Planting Areas of Double-Season Rice by Half in Southern China over the Last Two Decades
 , ,
, ,  ,
,
Abstract
:1. Introduction
2. Materials and Methods
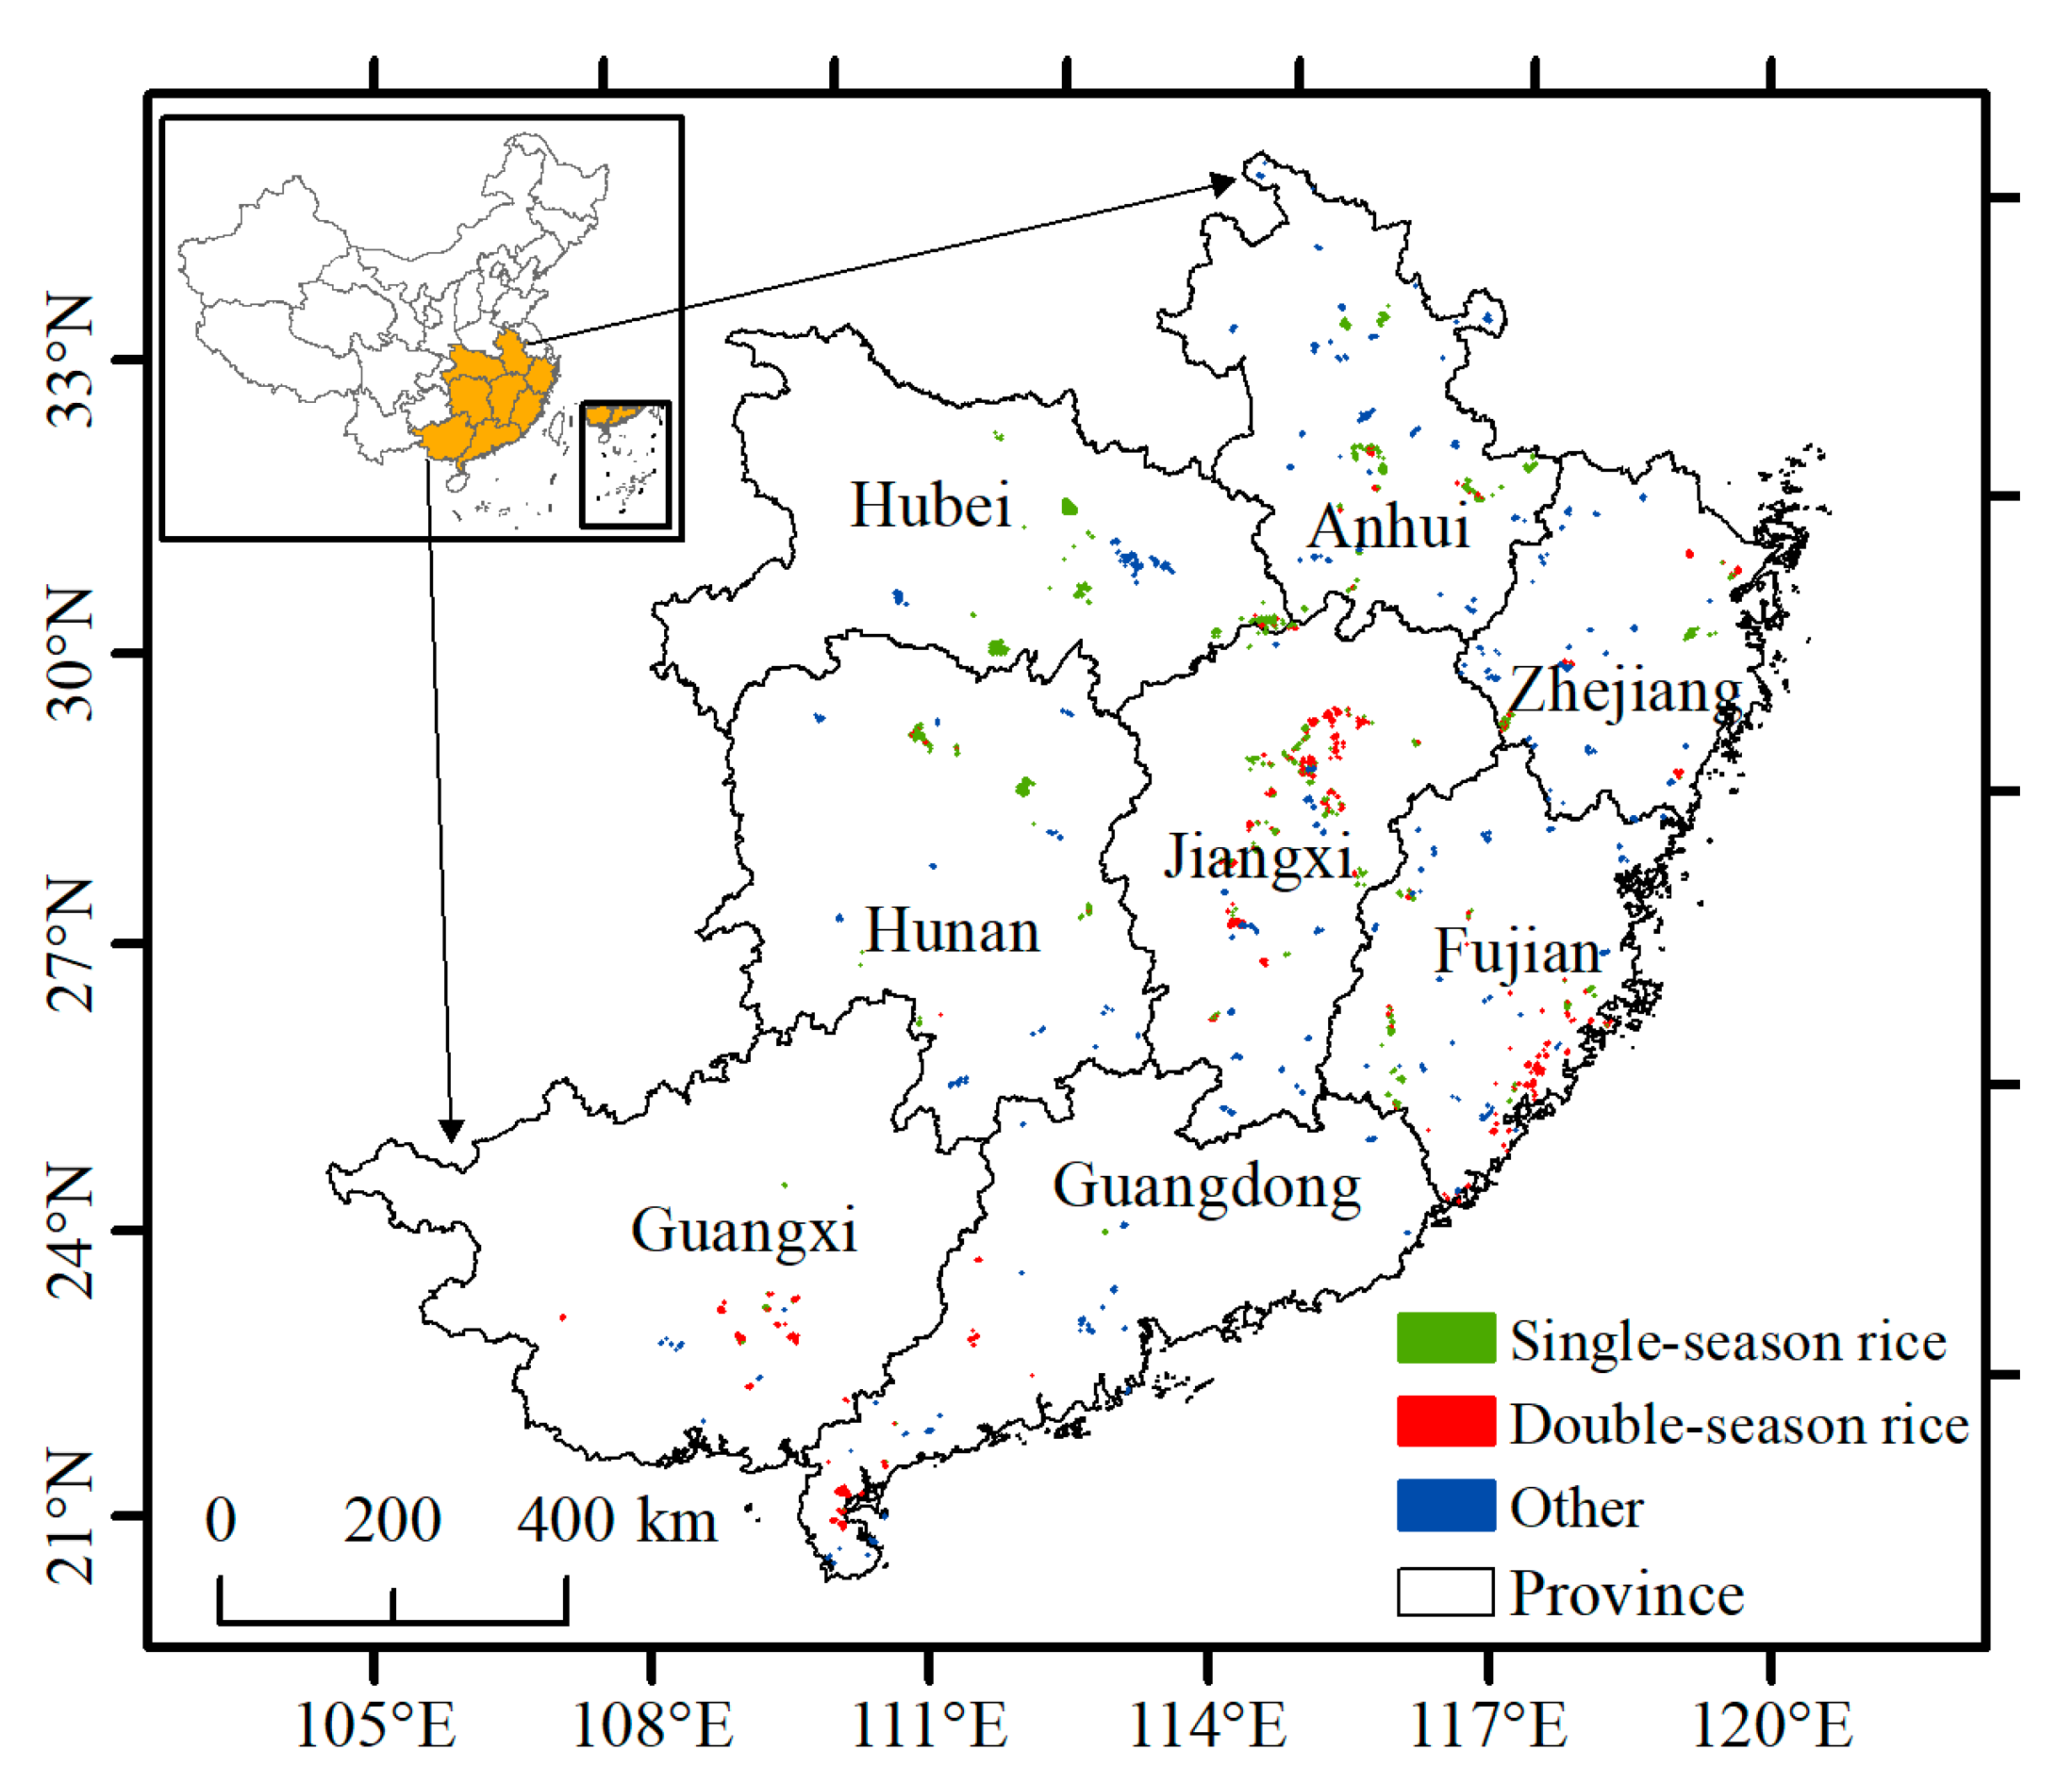
2.1. Study Area
2.2. Data Sources and Pre-Progress
2.2.1. Land Cover Datasets
2.2.2. Satellite Images and Vegetation Indices
2.2.3. Regions of Interest and Other Rice Cropping Pattern Datasets
2.2.4. Statistical and Auxiliary Data
2.3. Methods
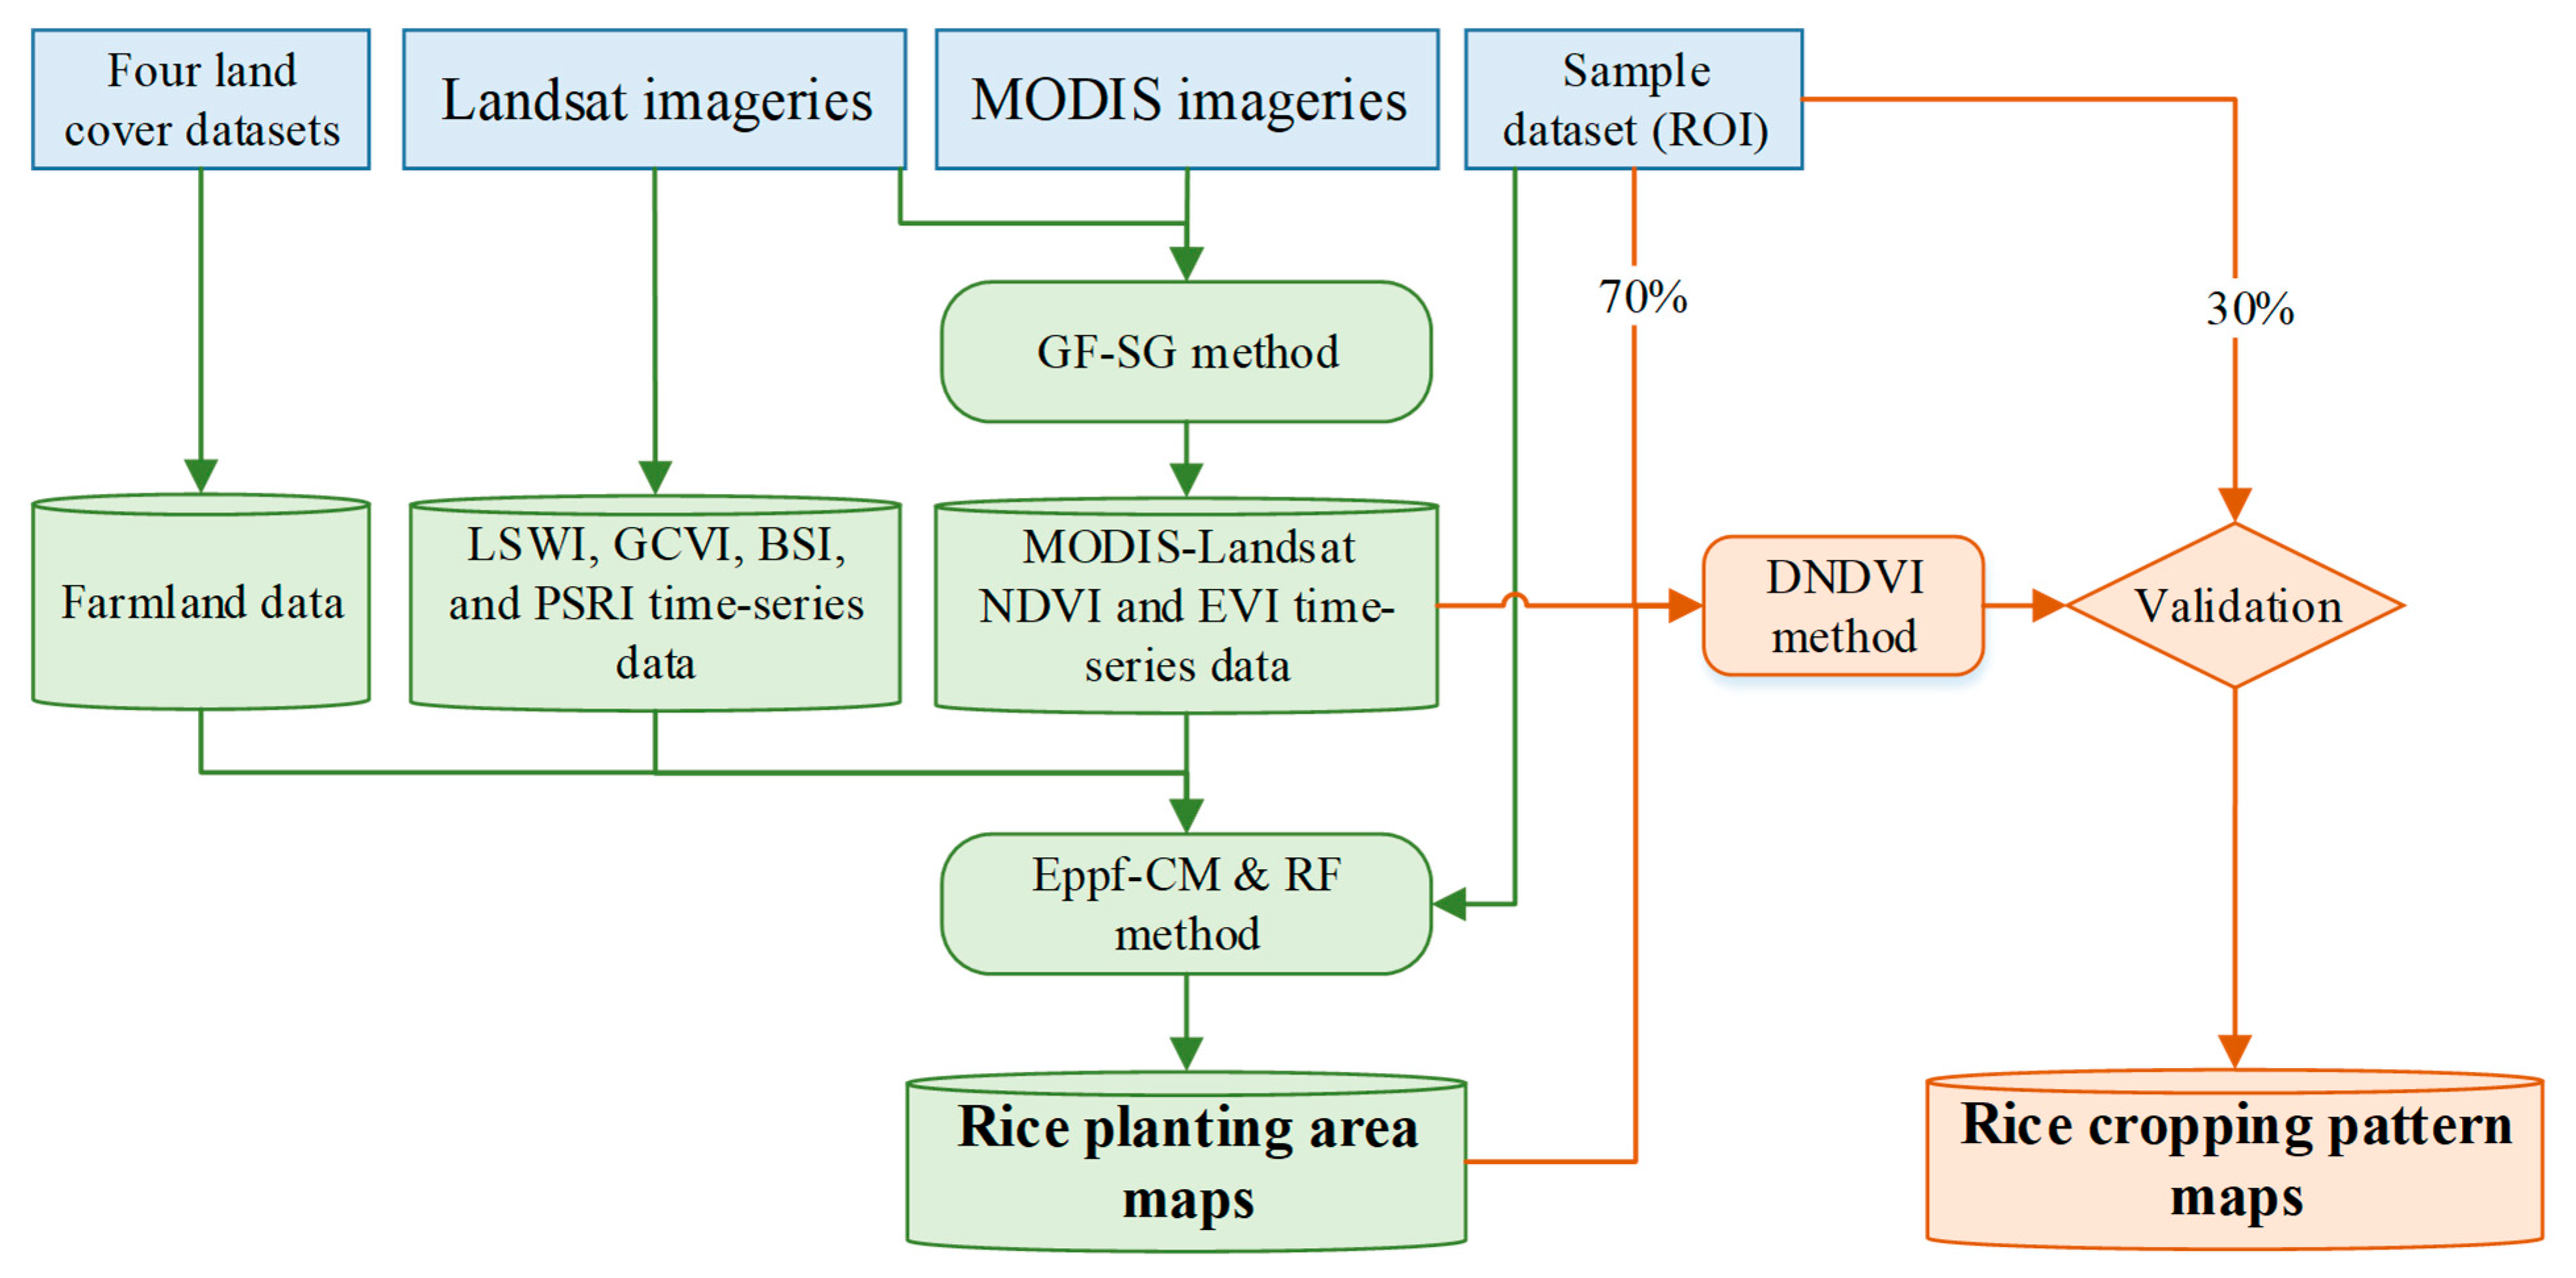
2.3.1. Overview of the Rice Cropping Pattern Mapping Approach
2.3.2. GF-SG Method
2.3.3. Rice Planting Area Mapping
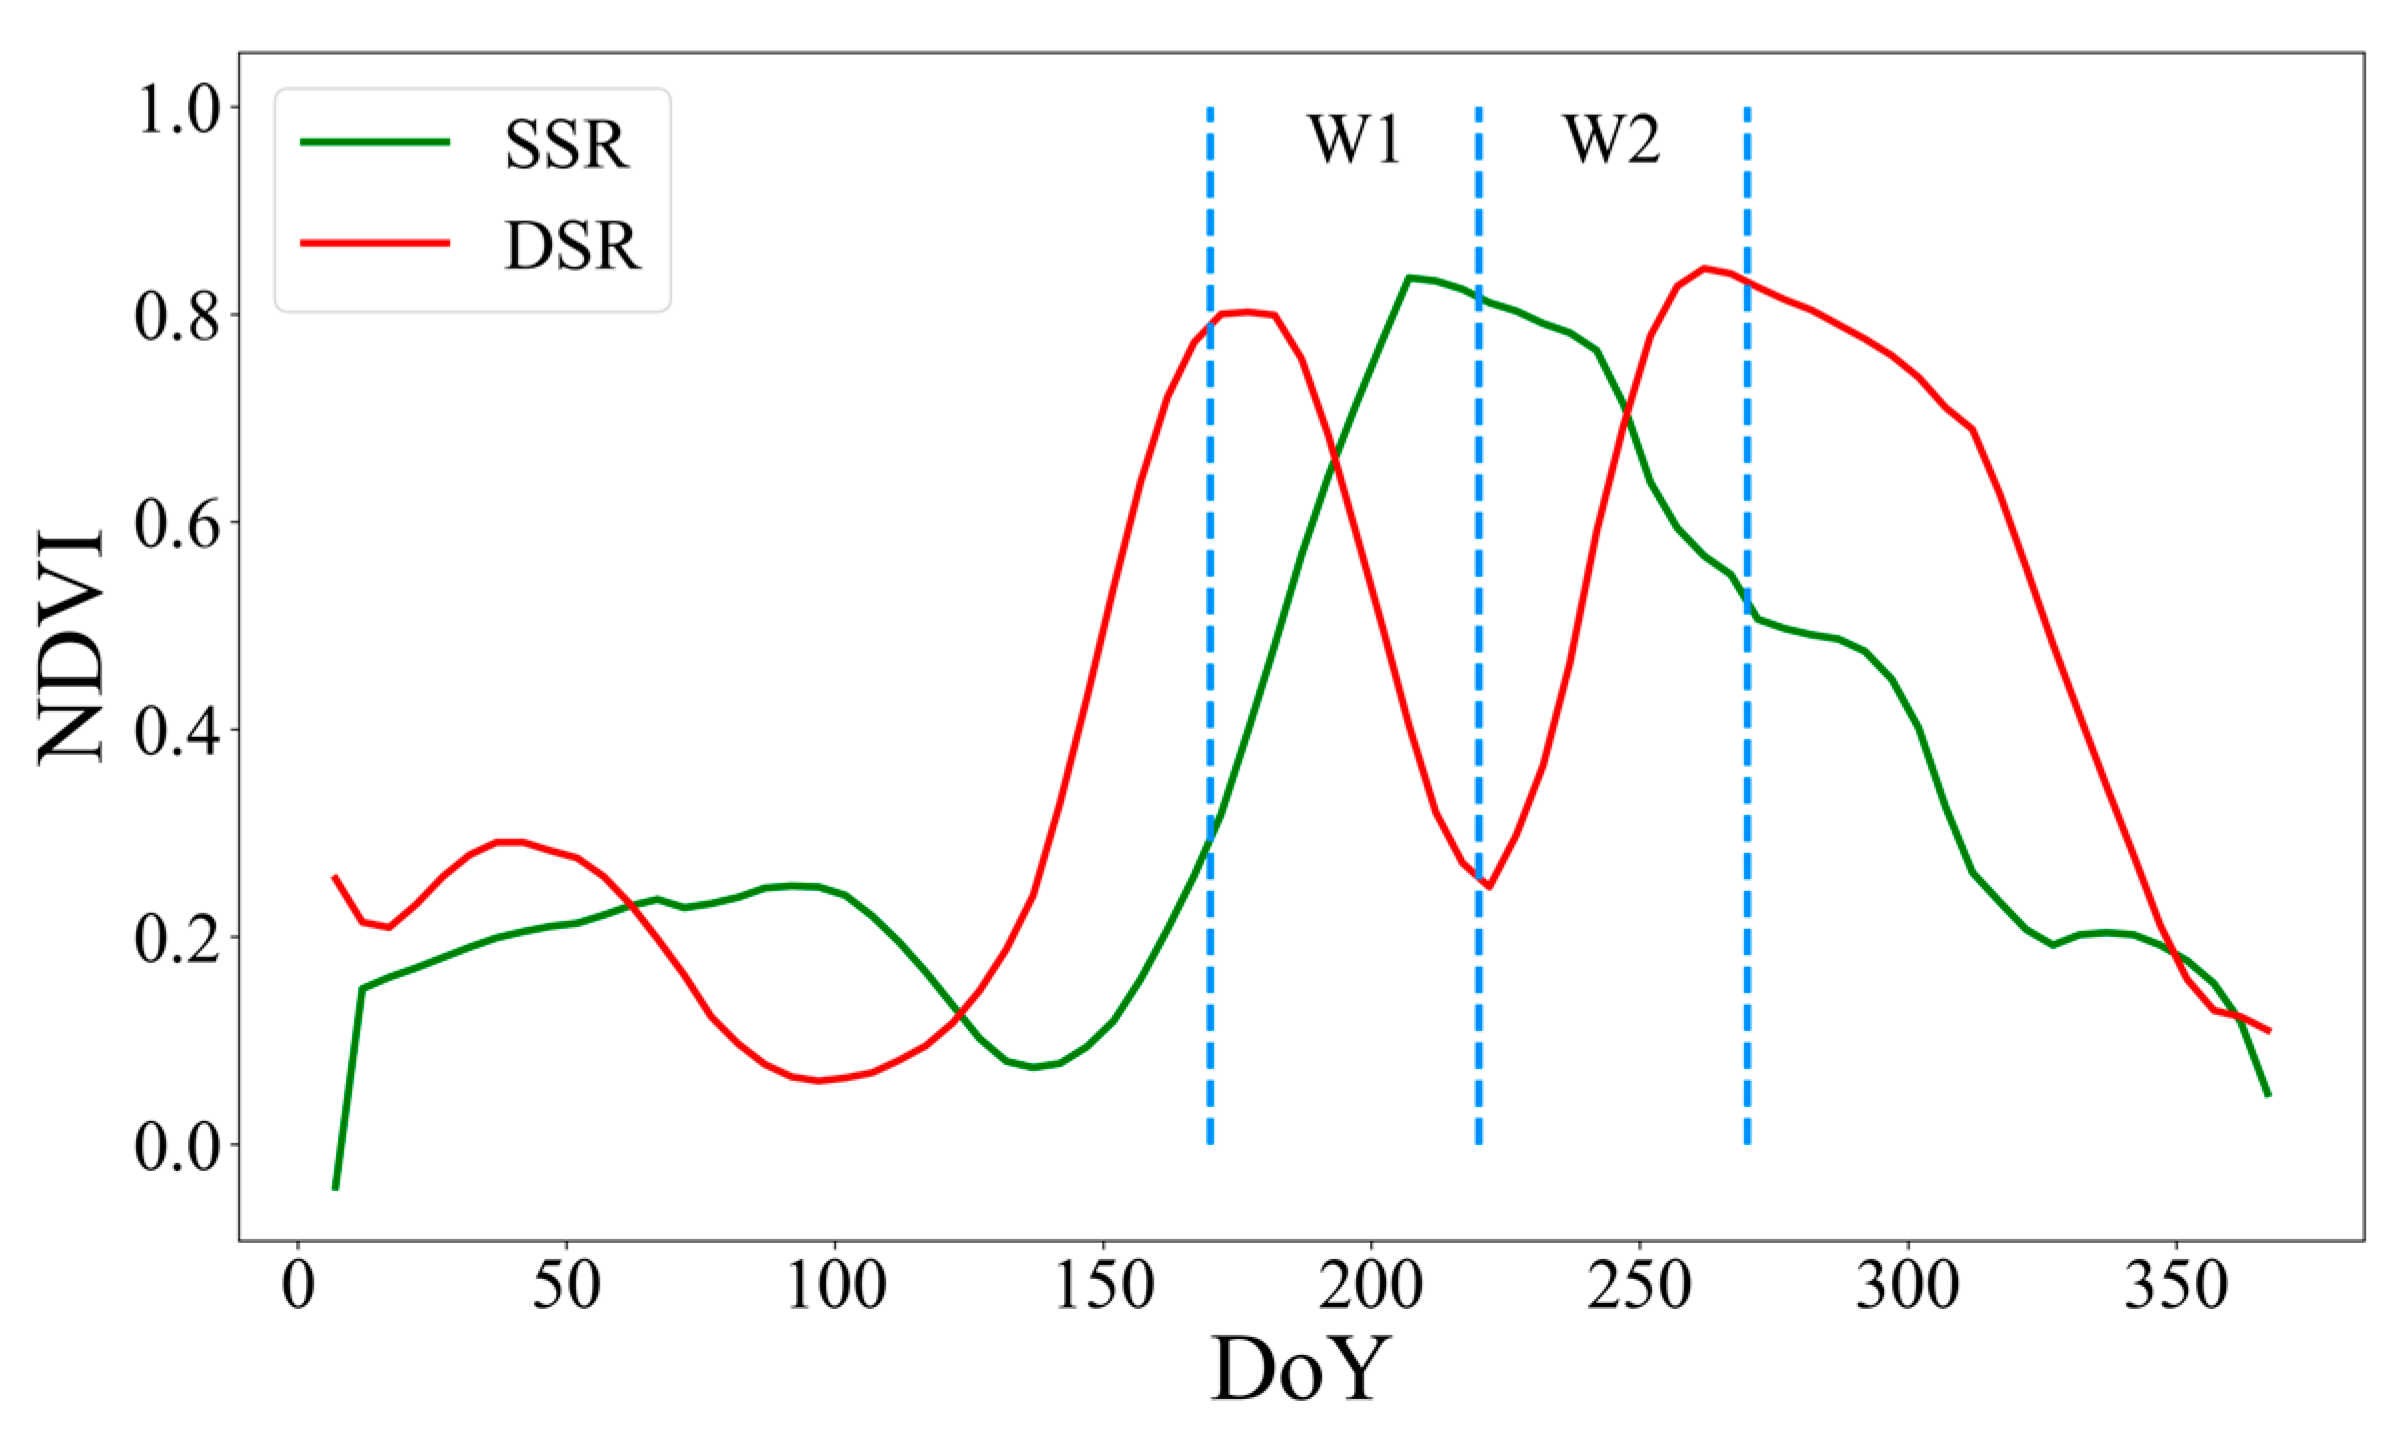
2.3.4. Rice Cropping Pattern Mapping
2.3.5. Validation and Comparison
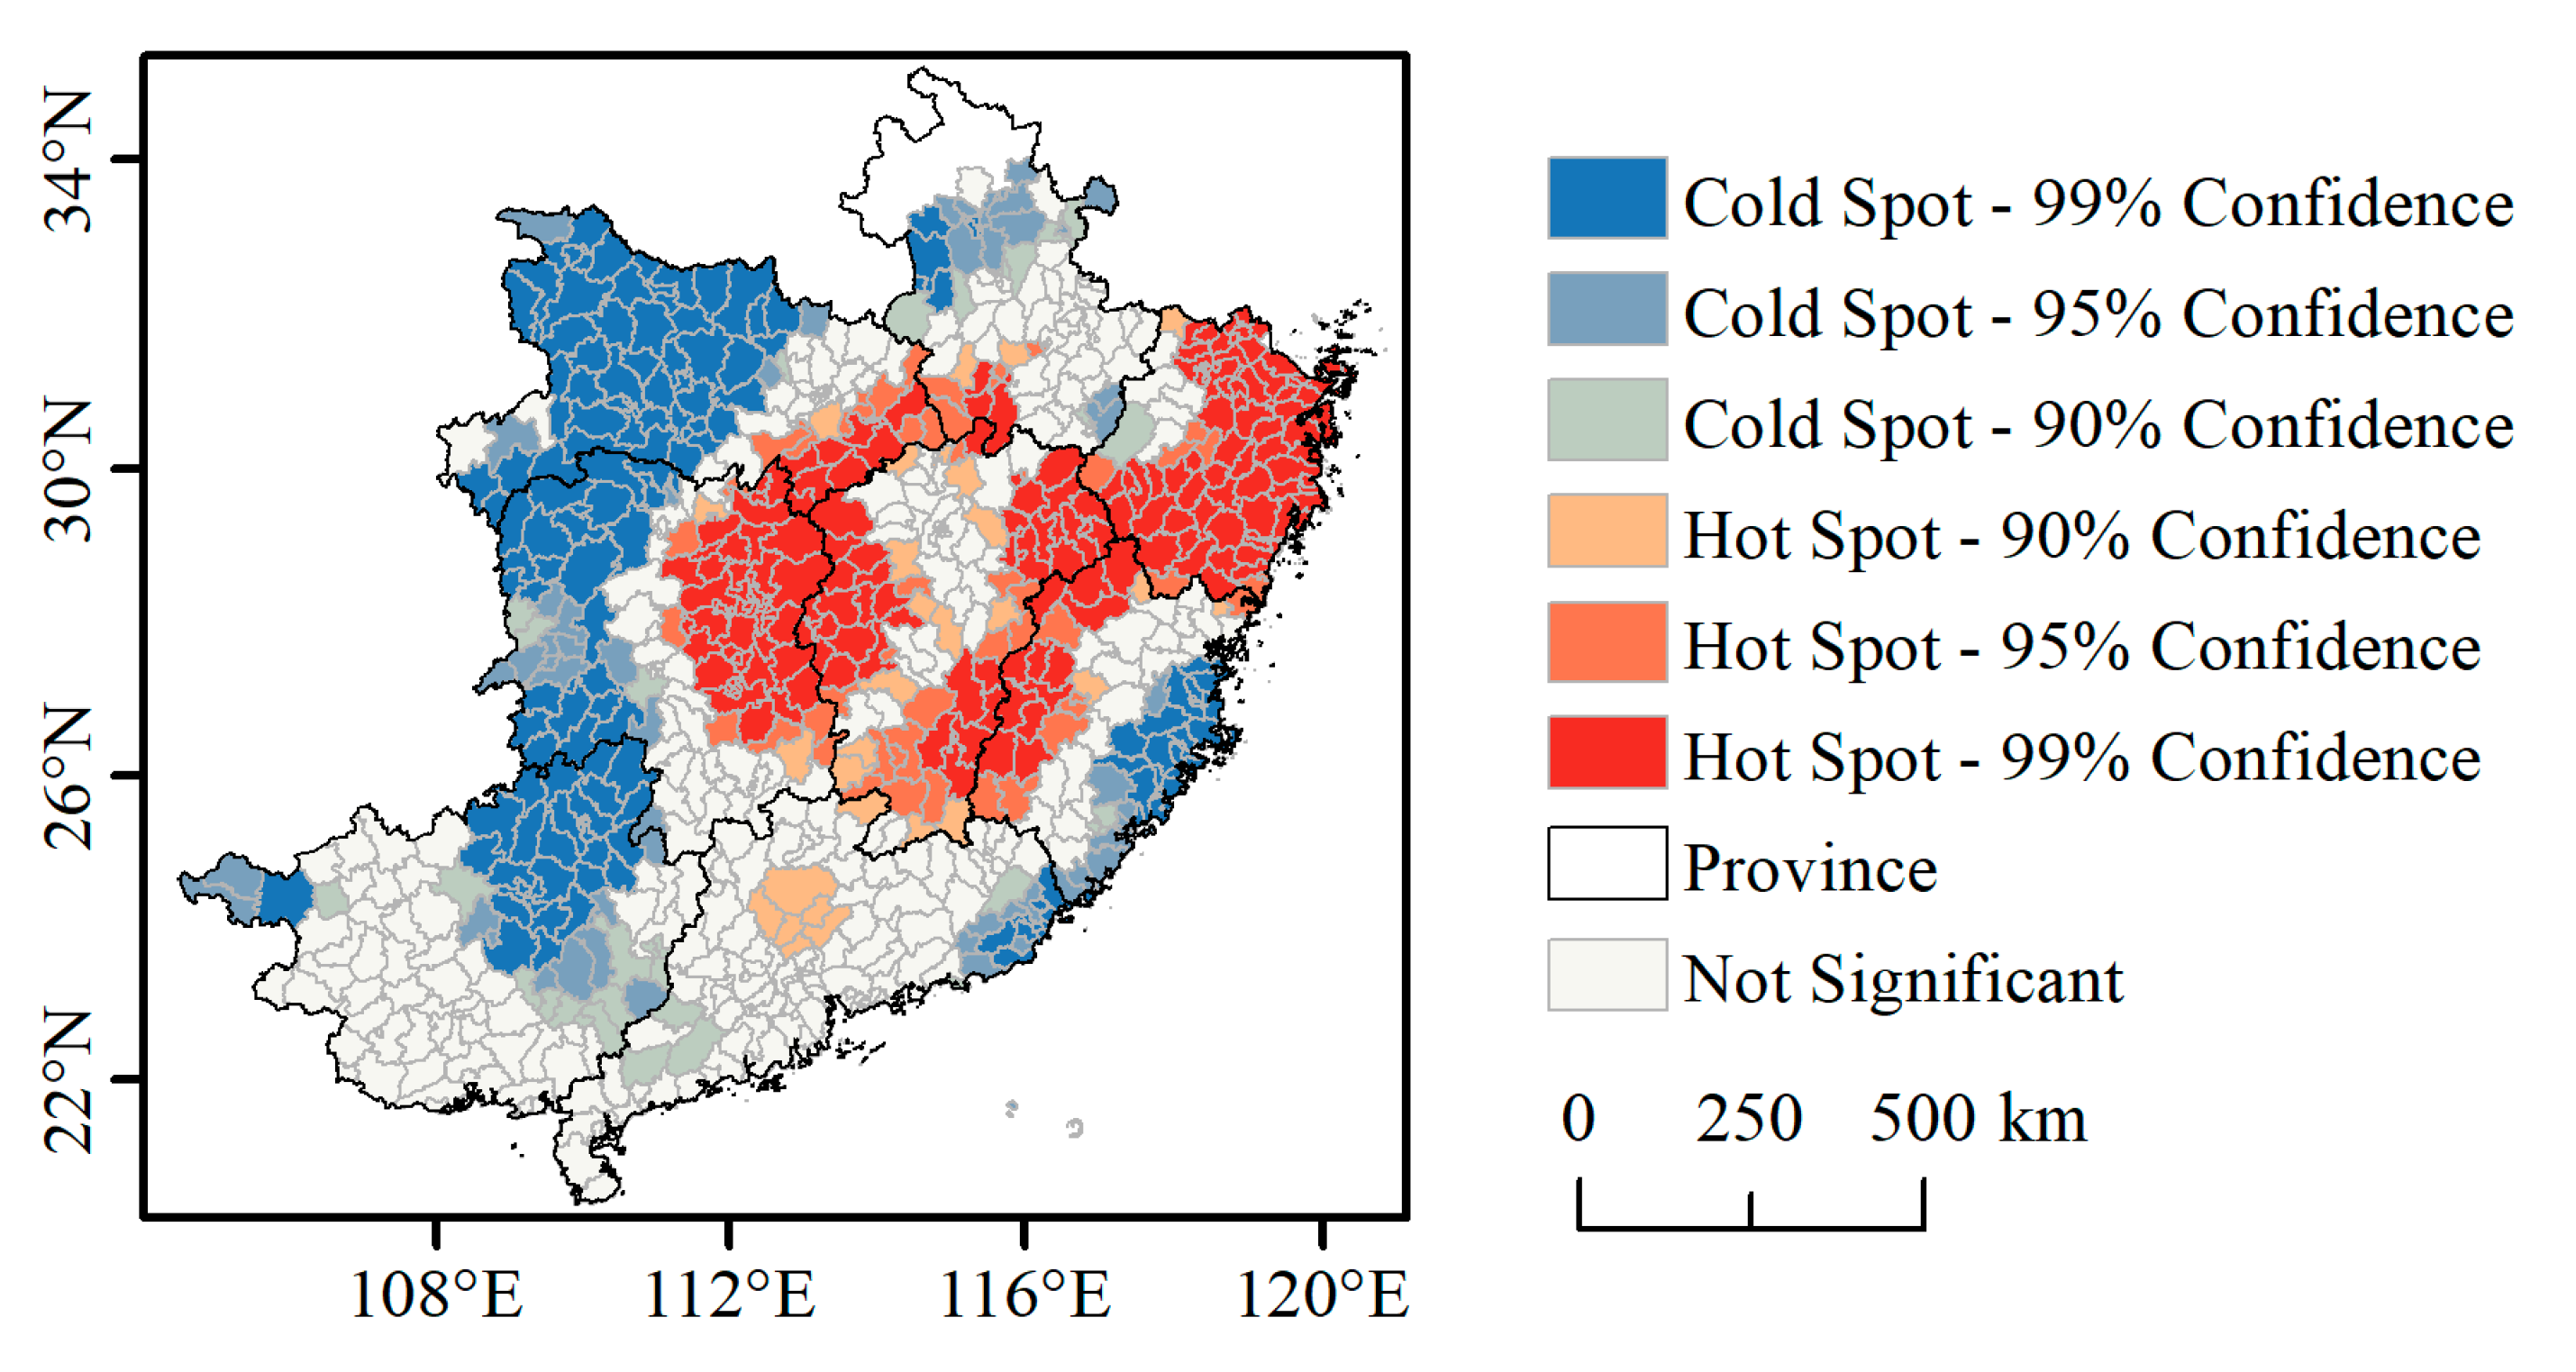
2.3.6. Getis-Ord Gi*
2.3.7. GeoDetector Method
3. Results
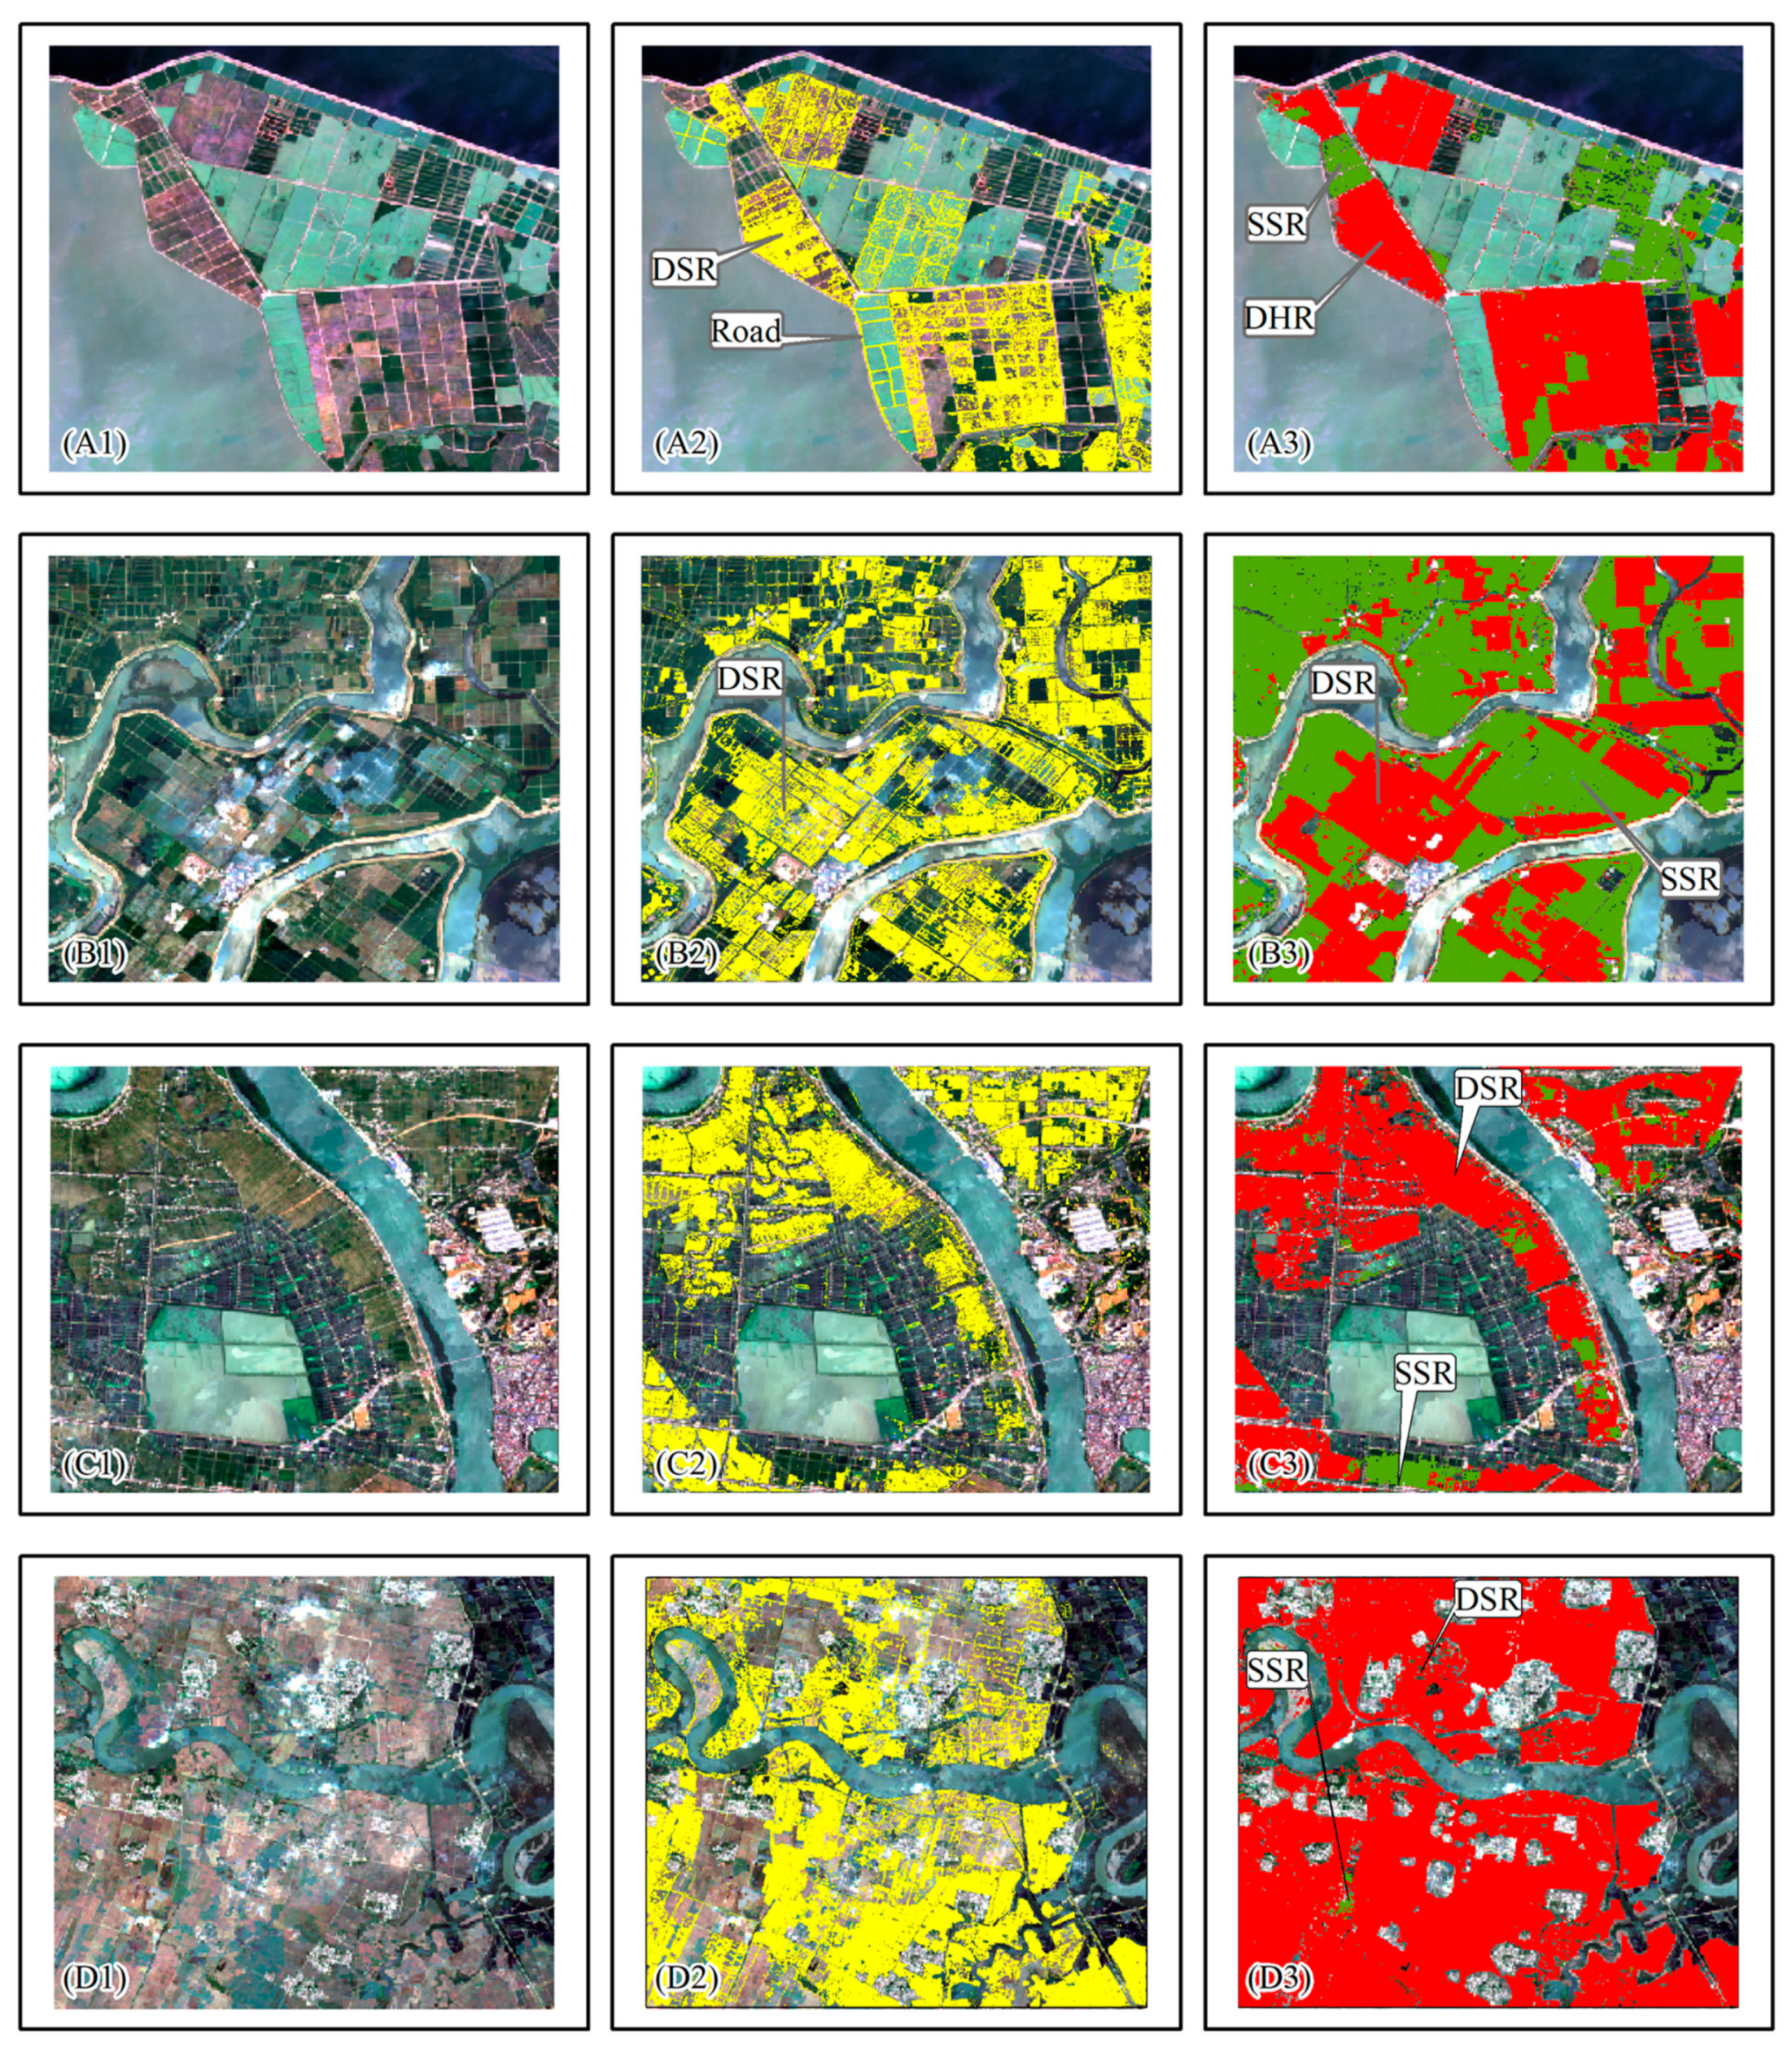
3.1. Spatial Patterns of Rice Cropping Intensity in Southern China
3.2. Accuracy Assessment
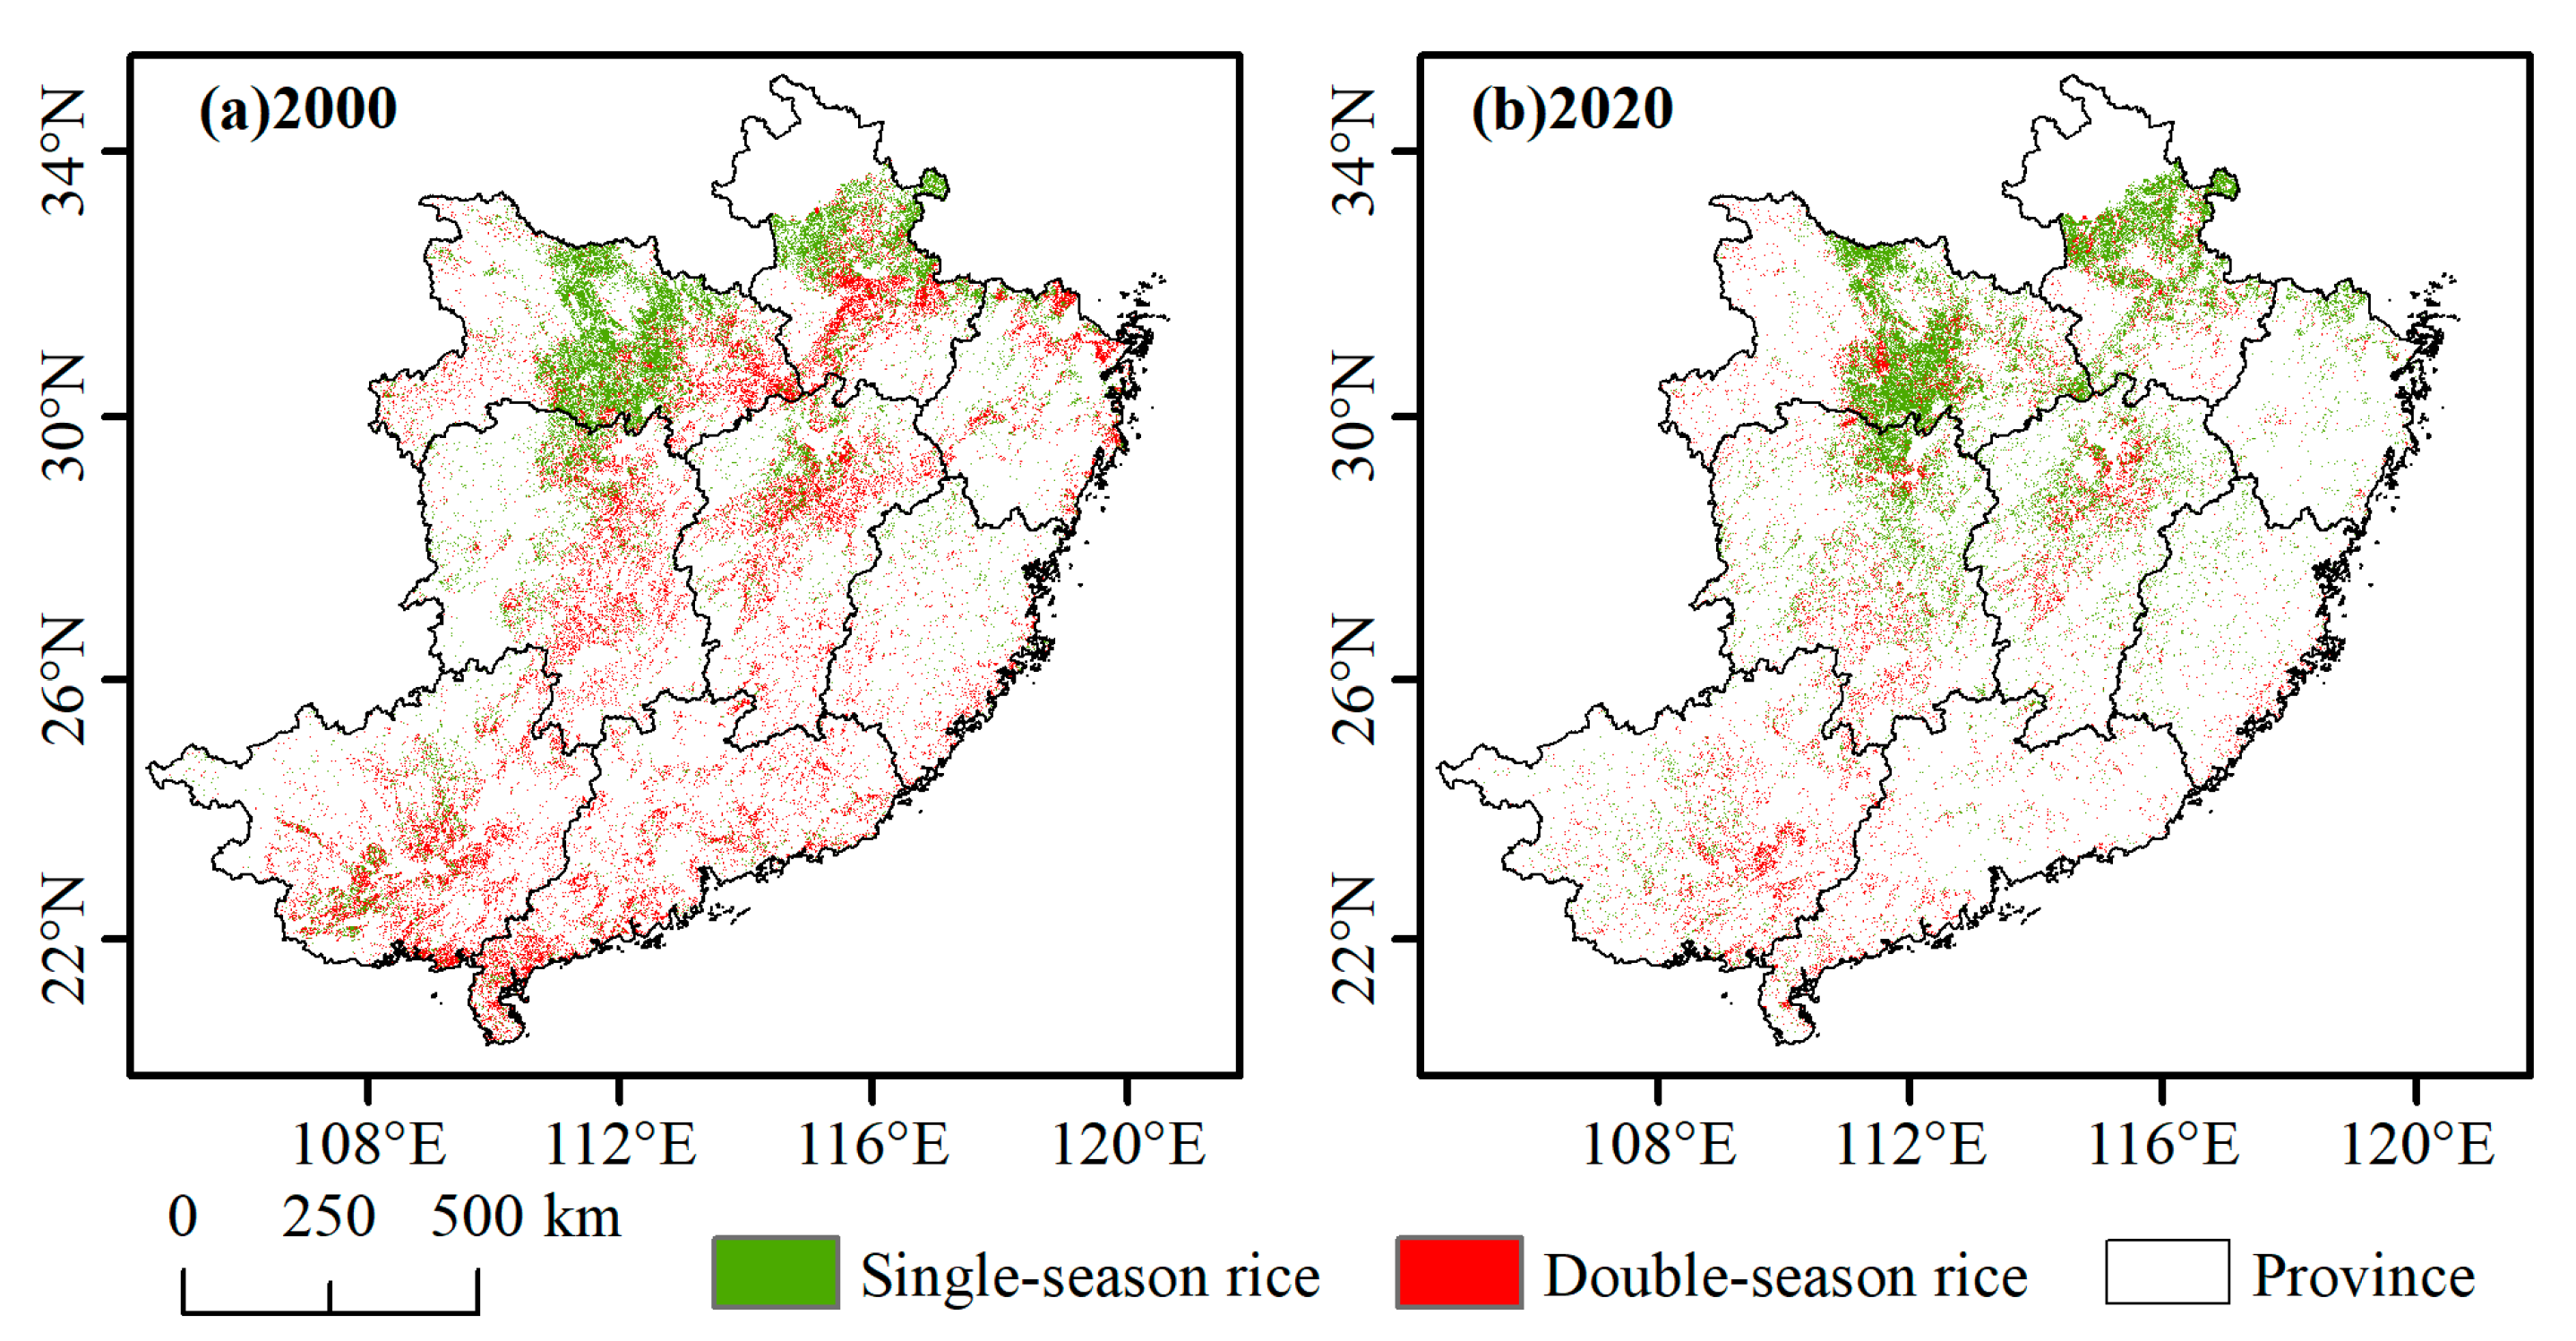
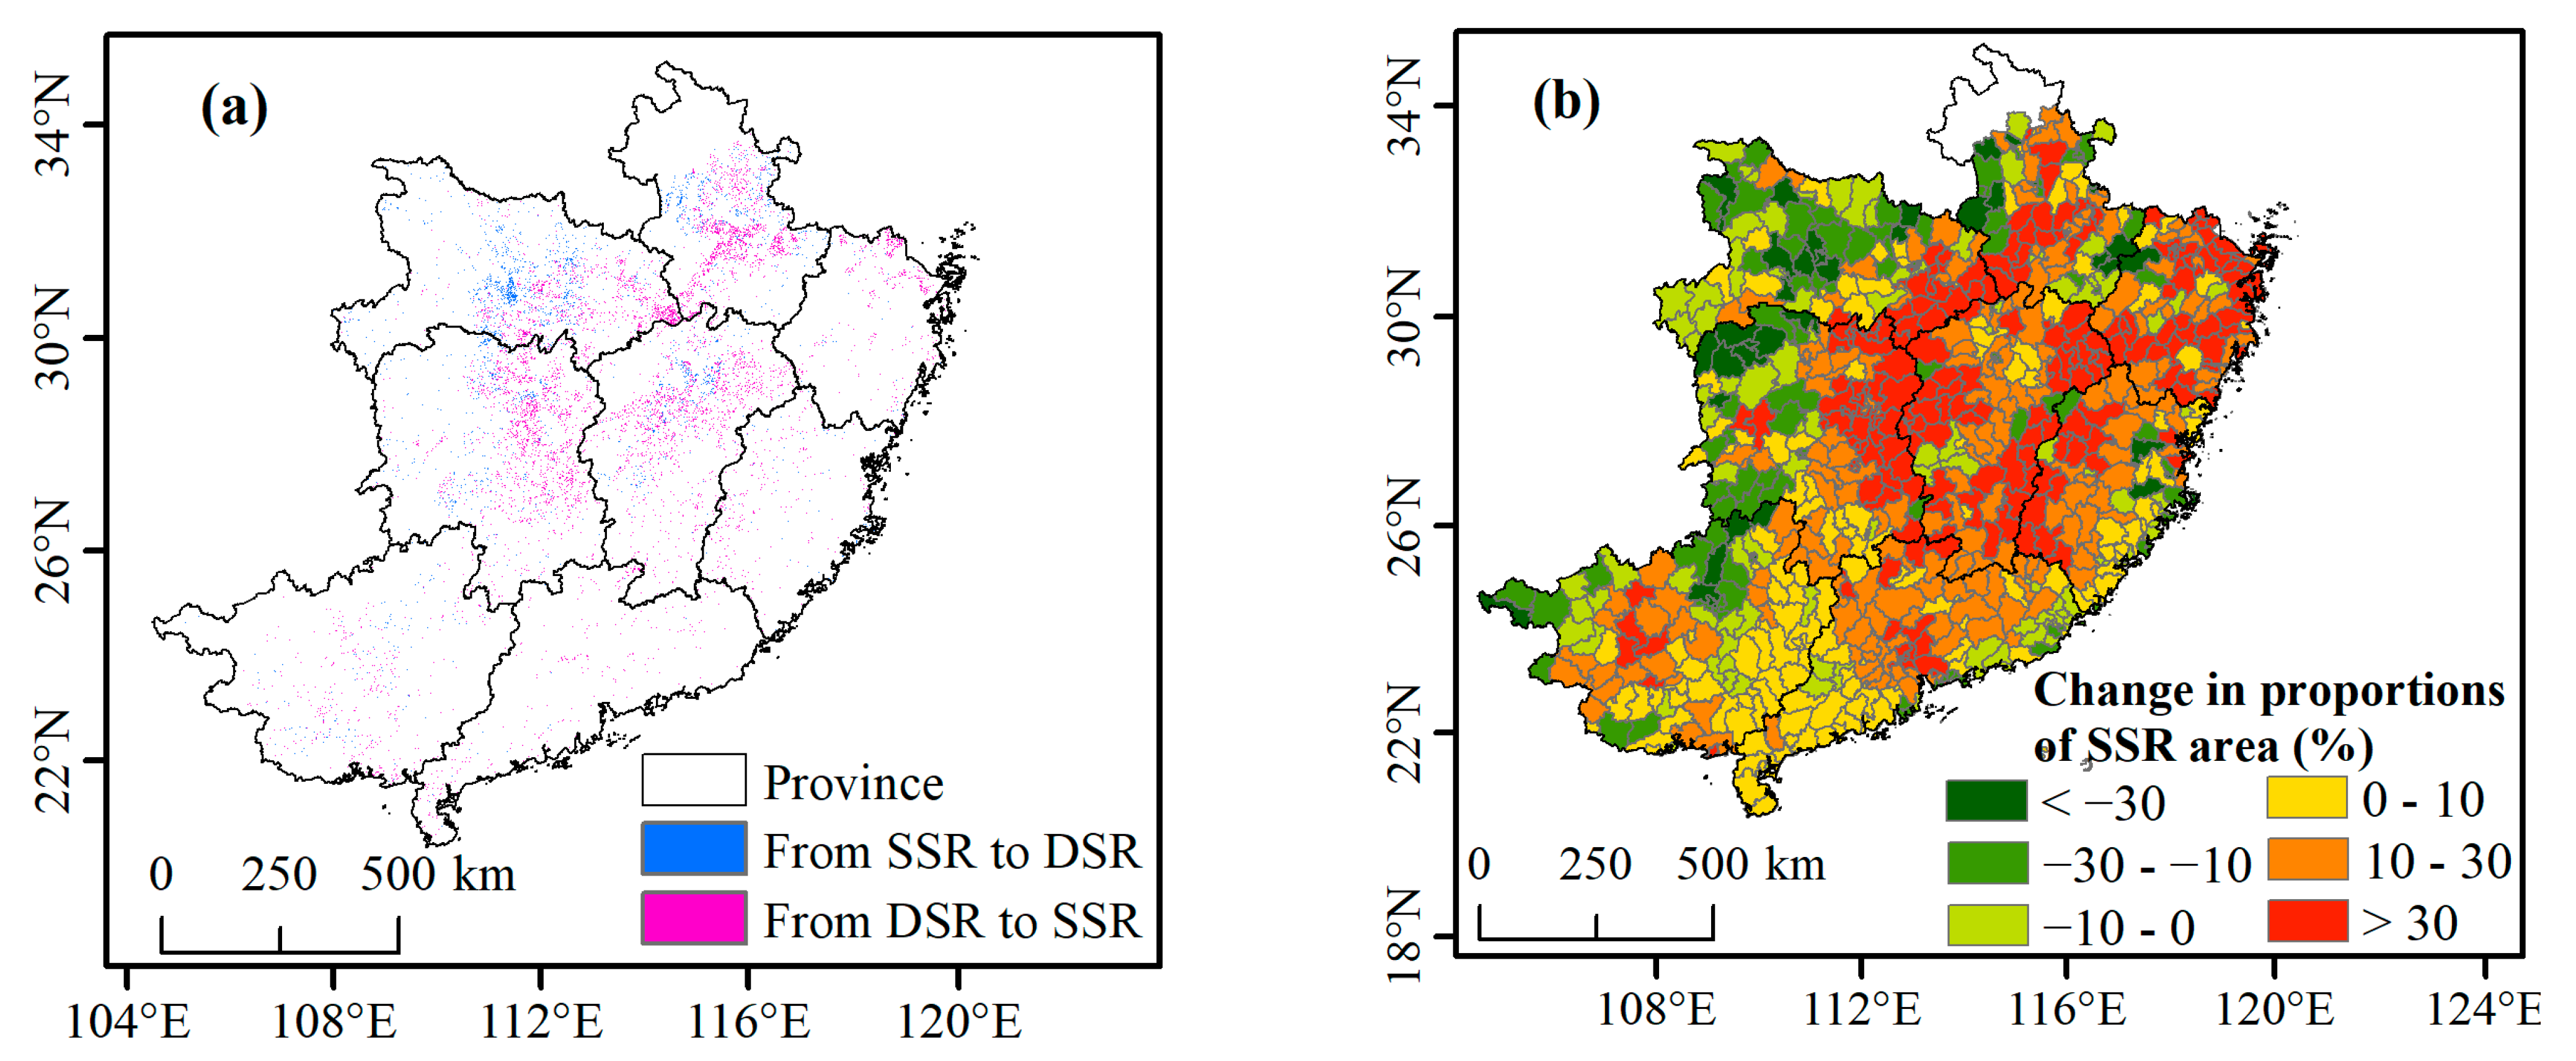
3.3. Spatial–Temporal Change in Rice Cropping Intensity in Southern China
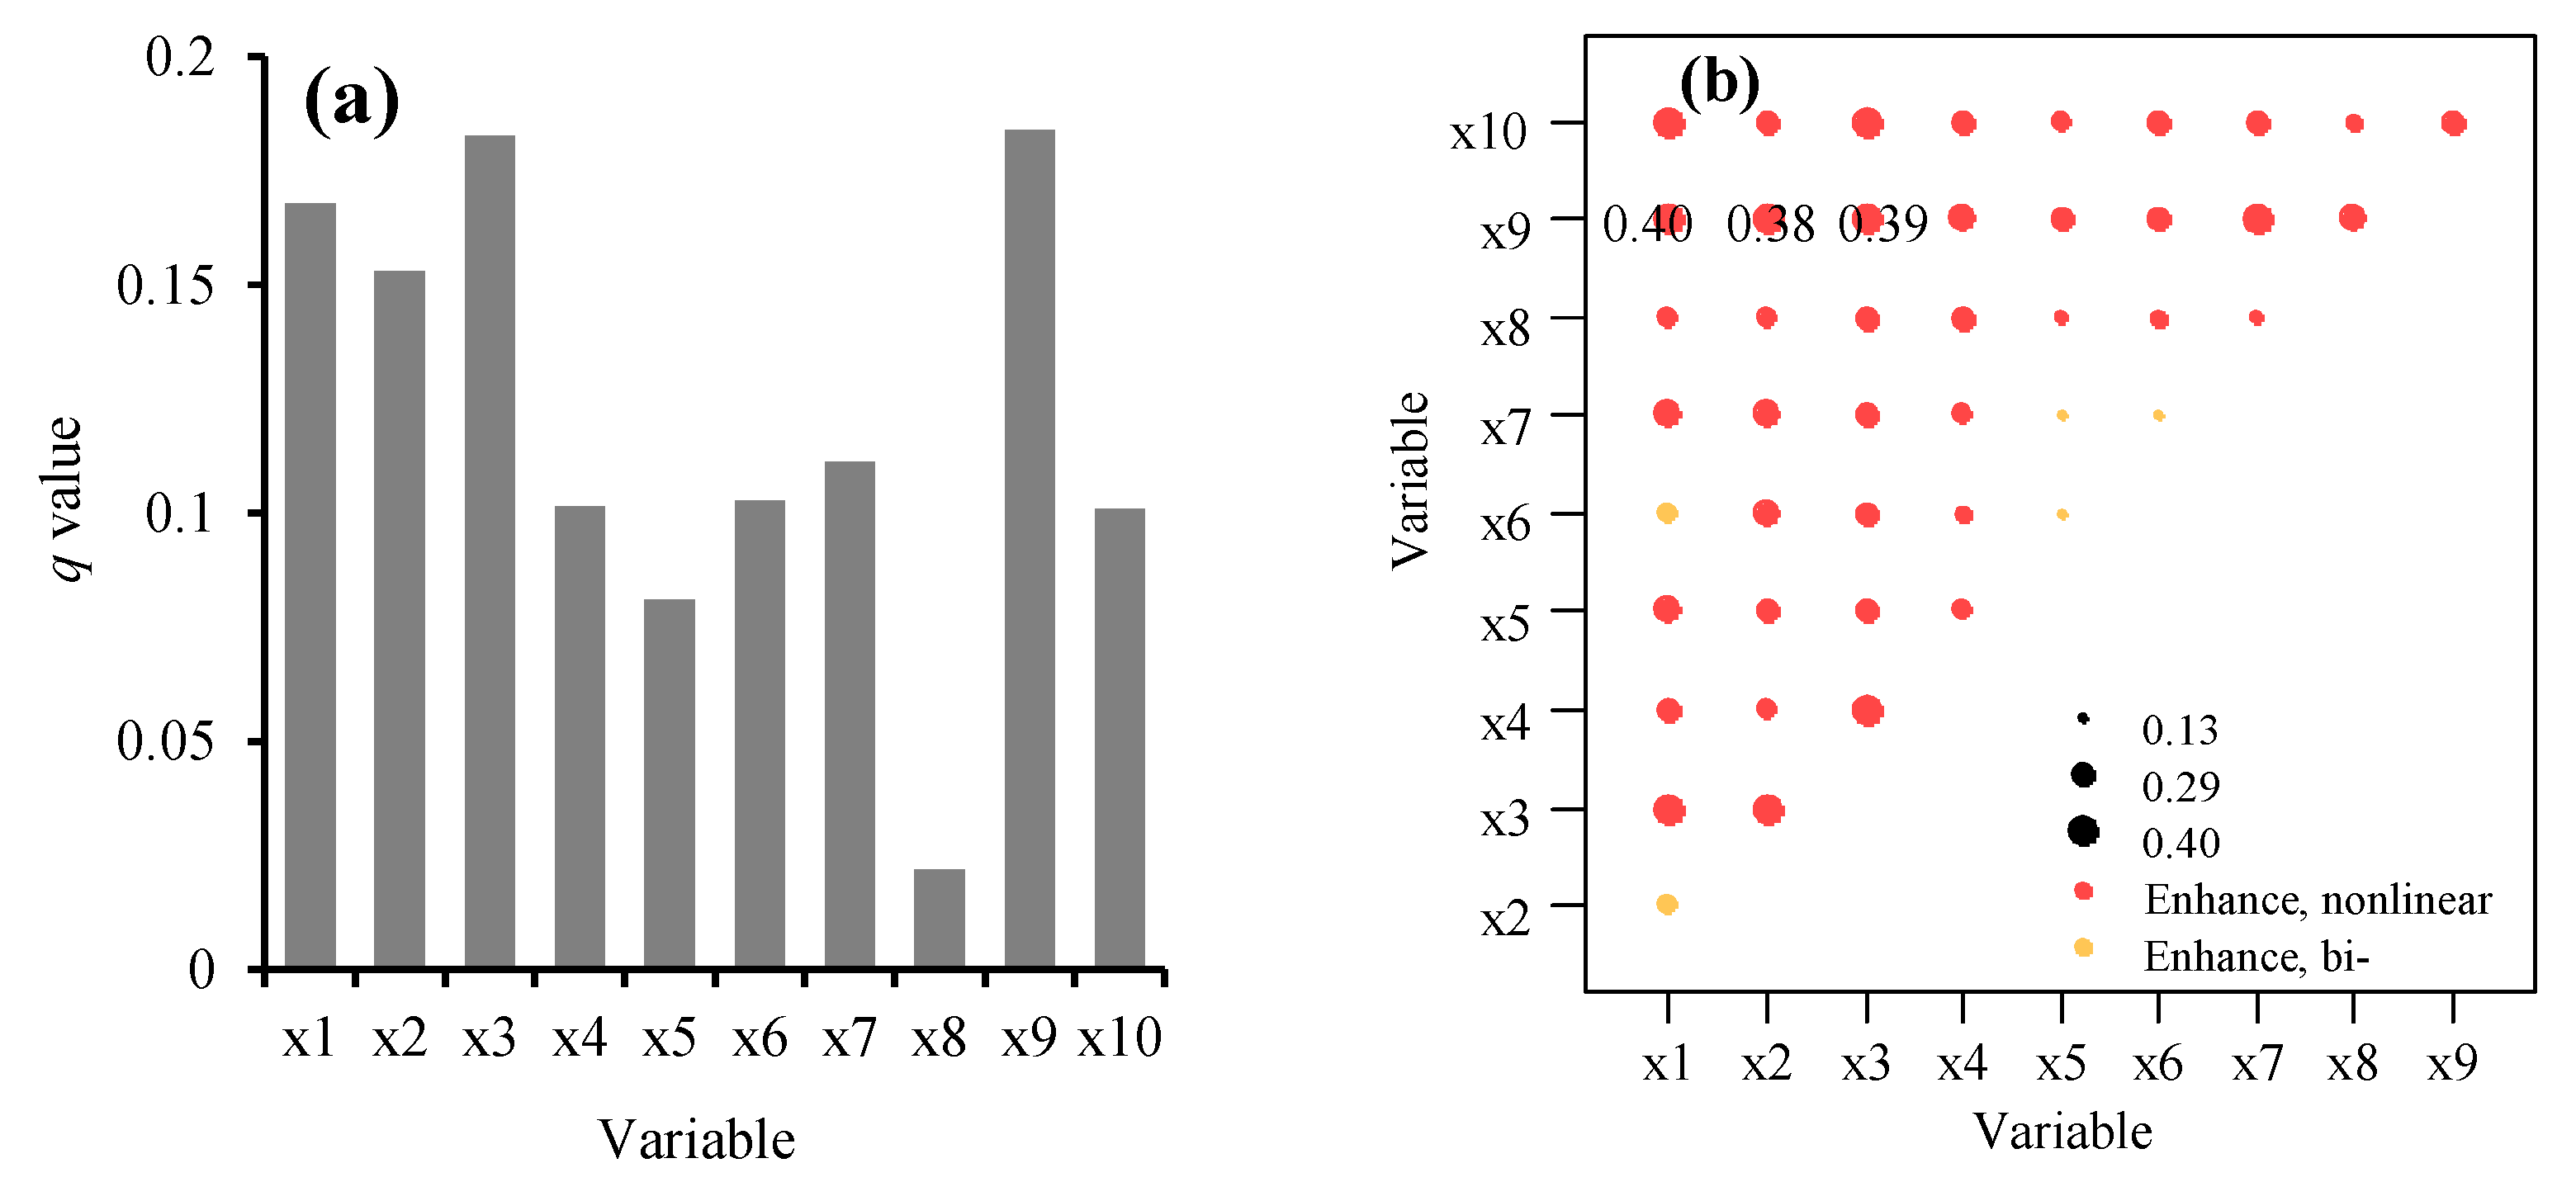
3.4. Driving Factors of the Changes in Rice Cropping Intensity
4. Discussion
5. Conclusions
Supplementary Materials
Author Contributions
Funding
Data Availability Statement
Conflicts of Interest
References
- FAOSTAT. FAO Statistical Databases (Food and Agriculture Organization of the United Nations) Databases-UW-Madison Libraries. 2020. Available online: http://digital.library.wisc.edu/1711.web/faostat (accessed on 16 January 2024).
- Kuenzer, C.; Knauer, K. Remote sensing of rice crop areas. Int. J. Remote Sens. 2013, 34, 2101–2139. [Google Scholar] [CrossRef]
- Elert, E. Rice by the numbers: A good grain. Nature 2014, 514, S50–S51. [Google Scholar] [CrossRef] [PubMed]
- Godfray, H.C.J.; Beddington, J.R.; Crute, I.R.; Haddad, L.; Lawrence, D.; Muir, J.F.; Pretty, J.; Robinson, S.; Thomas, S.M.; Toulmin, C. Food Security: The Challenge of Feeding 9 Billion People. Science 2010, 327, 812–818. [Google Scholar] [CrossRef]
- Deng, N.; Grassini, P.; Yang, H.; Huang, J.; Cassman, K.G.; Peng, S. Closing yield gaps for rice self-sufficiency in China. Nat. Commun. 2019, 10, 1725. [Google Scholar] [CrossRef] [PubMed]
- Guan, C.; Huang, H.; Huang, G.; Sun, D.; Liang, Y. Problems and Countermeasures of Paddy Field Multiple Cropping in Southern China. Crops 2016, 32, 1–7. [Google Scholar]
- Qiu, B.; Lu, D.; Tang, Z.; Song, D.; Zeng, Y.; Wang, Z.; Chen, C.; Chen, N.; Huang, H.; Xu, W. Mapping cropping intensity trends in China during 1982–2013. Appl. Geogr. 2017, 79, 212–222. [Google Scholar] [CrossRef]
- Jiang, M.; Xin, L.; Li, X.; Tan, M.; Wang, R. Decreasing Rice Cropping Intensity in Southern China from 1990 to 2015. Remote Sens. 2019, 11, 35. [Google Scholar] [CrossRef]
- Li, S.; Li, X.; Sun, L.; Cao, G.; Fischer, G.; Tramberend, S. An estimation of the extent of cropland abandonment in mountainous regions of China. Land Degrad. Dev. 2018, 29, 1327–1342. [Google Scholar] [CrossRef]
- Li, L.; Jiang, P.; Liu, W.; Sun, Y.; Dang, Z. Increasing Spatial Mismatch of Cropland-Grain Production-Population in China over the Past Two Decades. Land 2022, 11, 1685. [Google Scholar] [CrossRef]
- Liu, L.; Xiao, X.; Qin, Y.; Wang, J.; Xu, X.; Hu, Y.; Qiao, Z. Mapping cropping intensity in China using time series Landsat and Sentinel-2 images and Google Earth Engine. Remote Sens. Environ. 2020, 239, 111624. [Google Scholar] [CrossRef]
- Weiss, M.; Jacob, F.; Duveiller, G. Remote sensing for agricultural applications: A meta-review. Remote Sens. Environ. 2020, 236, 111402. [Google Scholar] [CrossRef]
- Zhang, M.; Wu, B.; Zeng, H.; He, G.; Liu, C.; Tao, S.; Zhang, Q.; Nabil, M.; Tian, F.; Bofana, J.; et al. GCI30: A global dataset of 30 m cropping intensity using multisource remote sensing imagery. Earth Syst. Sci. Data 2021, 13, 4799–4817. [Google Scholar] [CrossRef]
- Kontgis, C.; Schneider, A.; Ozdogan, M. Mapping rice paddy extent and intensification in the Vietnamese Mekong River Delta with dense time stacks of Landsat data. Remote Sens. Environ. 2015, 169, 255–269. [Google Scholar] [CrossRef]
- Dong, J.; Xiao, X. Evolution of regional to global paddy rice mapping methods: A review. ISPRS J. Photogramm. Remote Sens. 2016, 119, 214–227. [Google Scholar] [CrossRef]
- Qiu, B.; Hu, X.; Chen, C.; Tang, Z.; Yang, P.; Zhu, X.; Yan, C.; Jian, Z. Maps of cropping patterns in China during 2015–2021. Sci. Data 2022, 9, 479. [Google Scholar] [CrossRef] [PubMed]
- Liu, J.; Li, L.; Huang, X.; Liu, Y.; Li, T. Mapping paddy rice in Jiangsu Province, China, based on phenological parameters and a decision tree model. Front. Earth Sci. 2019, 13, 111–123. [Google Scholar] [CrossRef]
- Zhao, S.; Liu, X.; Ding, C.; Liu, S.; Wu, C.; Wu, L. Mapping Rice Paddies in Complex Landscapes with Convolutional Neural Networks and Phenological Metrics. Gisci. Remote Sens. 2020, 57, 37–48. [Google Scholar] [CrossRef]
- Ding, M.; Chen, Q.; Xin, L.; Li, L.; Xiubin, L.I.; Bai, W. Spatial and temporal variations of multiple cropping index in China based on SPOT-NDVI during 1999–2013. Acta Geogr. Sin. 2015, 70, 1080–1090. [Google Scholar]
- Qiu, B.; Qi, W.; Tang, Z.; Chen, C.; Wang, X. Rice cropping density and intensity lessened in southeast China during the twenty-first century. Environ. Monit. Assess. 2016, 188, 5. [Google Scholar] [CrossRef]
- Jain, M.; Mondal, P.; DeFries, R.S.; Small, C.; Galford, G.L. Mapping cropping intensity of smallholder farms: A comparison of methods using multiple sensors. Remote Sens. Environ. 2013, 134, 210–223. [Google Scholar] [CrossRef]
- He, Y.; Dong, J.; Liao, X.; Sun, L.; Wang, Z.; You, N.; Li, Z.; Fu, P. Examining rice distribution and cropping intensity in a mixed single- and double-cropping region in South China using all available Sentinel 1/2 images. Int. J. Appl. Earth Obs. Geoinf. 2021, 101, 102351. [Google Scholar] [CrossRef]
- Pan, B.; Zheng, Y.; Shen, R.; Ye, T.; Zhao, W.; Dong, J.; Ma, H.; Yuan, W. High Resolution Distribution Dataset of Double-Season Paddy Rice in China. Remote Sens. 2021, 13, 4609. [Google Scholar] [CrossRef]
- Tian, H.; Wu, M.; Wang, L.; Niu, Z. Mapping Early, Middle and Late Rice Extent Using Sentinel-1A and Landsat-8 Data in the Poyang Lake Plain, China. Sensors. 2018, 18, 185. [Google Scholar] [CrossRef]
- Gao, F.; Anderson, M.C.; Zhang, X.; Yang, Z.; Alfieri, J.G.; Kustas, W.P.; Mueller, R.; Johnson, D.M.; Prueger, J.H. Toward mapping crop progress at field scales through fusion of Landsat and MODIS imagery. Remote Sens. Environ. 2017, 188, 9–25. [Google Scholar] [CrossRef]
- Zhu, X.; Chen, J.; Gao, F.; Chen, X.; Masek, J.G. An enhanced spatial and temporal adaptive reflectance fusion model for complex heterogeneous regions. Remote Sens. Environ. 2010, 114, 2610–2623. [Google Scholar] [CrossRef]
- Chen, Y.; Cao, R.; Chen, J.; Liu, L.; Matsushita, B. A practical approach to reconstruct high-quality Landsat NDVI time-series data by gap filling and the Savitzky–Golay filter. ISPRS J. Photogramm. Remote Sens. 2021, 180, 174–190. [Google Scholar] [CrossRef]
- Cao, R.; Xu, Z.; Chen, Y.; Chen, J.; Shen, M. Reconstructing High-Spatiotemporal-Resolution (30 m and 8-Days) NDVI Time-Series Data for the Qinghai–Tibetan Plateau from 2000–2020. Remote Sens. 2022, 14, 3648. [Google Scholar] [CrossRef]
- Ma, Y.; Lyu, D.; Sun, K.; Li, S.; Zhu, B.; Zhao, R.; Zheng, M.; Song, K. Spatiotemporal Analysis and War Impact Assessment of Agricultural Land in Ukraine Using RS and GIS Technology. Land 2022, 11, 1810. [Google Scholar] [CrossRef]
- Ding, M.; Guan, Q.; Li, L.; Zhang, H.; Liu, C.; Zhang, L. Phenology-Based Rice Paddy Mapping Using Multi-Source Satellite Imagery and a Fusion Algorithm Applied to the Poyang Lake Plain, Southern China. Remote Sens. 2020, 12, 1022. [Google Scholar] [CrossRef]
- Yin, Q.; Liu, M.; Cheng, J.; Ke, Y.; Chen, X. Mapping Paddy Rice Planting Area in Northeastern China Using Spatiotemporal Data Fusion and Phenology-Based Method. Remote Sens. 2019, 11, 1699. [Google Scholar] [CrossRef]
- Xiao, X.; Boles, S.; Liu, J.; Zhuang, D.; Frolking, S.; Li, C.; Salas, W.; Moore, B. Mapping paddy rice agriculture in southern China using multi-temporal MODIS images. Remote Sens. Environ. 2005, 95, 480–492. [Google Scholar] [CrossRef]
- Dong, J.; Xiao, X.; Kou, W.; Qin, Y.; Zhang, G.; Li, L.; Jin, C.; Zhou, Y.; Wang, J.; Biradar, C.; et al. Tracking the dynamics of paddy rice planting area in 1986–2010 through time series Landsat images and phenology-based algorithms. Remote Sens. Environ. 2015, 160, 99–113. [Google Scholar] [CrossRef]
- Zhang, G.; Xiao, X.; Biradar, C.M.; Dong, J.; Qin, Y.; Menarguez, M.A.; Zhou, Y.; Zhang, Y.; Jin, C.; Wang, J.; et al. Spatiotemporal patterns of paddy rice croplands in China and India from 2000 to 2015. Sci. Total Environ. 2017, 579, 82–92. [Google Scholar] [CrossRef] [PubMed]
- You, N.; Dong, J. Examining earliest identifiable timing of crops using all available Sentinel 1/2 imagery and Google Earth Engine. ISPRS J. Photogramm. Remote Sens. 2020, 161, 109–123. [Google Scholar] [CrossRef]
- Ni, R.; Tian, J.; Li, X.; Yin, D.; Li, J.; Gong, H.; Zhang, J.; Zhu, L.; Wu, D. An enhanced pixel-based phenological feature for accurate paddy rice mapping with Sentinel-2 imagery in Google Earth Engine. ISPRS J. Photogramm. Remote Sens. 2021, 178, 282–296. [Google Scholar] [CrossRef]
- Yan, H.; Liu, F.; Qin, Y. Tracking the spatio-temporal change of cropping intensity in China during 2000–2015. Environ. Res. Lett. 2019, 14, 35008. [Google Scholar] [CrossRef]
- Qiu, B.; Yan, C.; Huang, W. Progress and Prospect on Mapping Cropping Systems Using Time Series Images. J. Geo-Inf. Sci. 2022, 1, 176–188. [Google Scholar]
- Peng, D.; Huete, A.R.; Huang, J.; Wang, F.; Sun, H. Detection and estimation of mixed paddy rice cropping patterns with MODIS data. Int. J. Appl. Earth Obs. Geoinf. 2011, 13, 13–23. [Google Scholar] [CrossRef]
- Li, W. Research on the Spatio-Temporal Pattern and Change of Rice Cropping Systems in the Middle Reaches of Yangtze River; University of Chinese Academy of Sciences: Beijing, China, 2015; Volume D. [Google Scholar]
- Li, P.; Feng, Z.; Jiang, L.; Liu, Y.; Xiao, X. Changes in rice cropping systems in the Poyang Lake Region, China during 2004–2010. J. Geogr. Sci. 2012, 22, 653–668. [Google Scholar] [CrossRef]
- Zhong, F.; Lu, W.; Xu, Z. Is the Outmigration of Rural Labor Force Detrimental to Grain Production?—Analysis of Farmers’ Factor Substitution and Cropping Structure Adjustment Behavior and Its Constraints. Chin. Rural. Econ. 2016, 7, 36–47. [Google Scholar]
- Xie, H.; Liu, G. Spatiotemporal differences and influencing factors of multiple cropping index in China during 1998–2012. J. Geogr. Sci. 2015, 25, 1283–1297. [Google Scholar] [CrossRef]
- Frolking, S.; Qiu, J.; Boles, S.; Xiao, X.; Liu, J.; Zhuang, Y.; Li, C.; Qin, X. Combining remote sensing and ground census data to develop new maps of the distribution of rice agriculture in China. Glob. Biogeochem. Cycles 2002, 16, 31–38. [Google Scholar] [CrossRef]
- Liu, T.; Peng, R.; Zhuo, Y.; Cao, G. China’s changing population distribution and influencing factors: Insights from the 2020 census data. Acta Geogr. Sin. 2022, 77, 381–394. [Google Scholar]
- Deng, F.; Cao, L.; Li, F.; Li, L.; Man, W.; Chen, Y.; Liu, W.; Peng, C. Mapping China’s Changing Gross Domestic Product Distribution Using Remotely Sensed and Point-of-Interest Data with Geographical Random Forest Model. Sustainability 2023, 15, 8062. [Google Scholar] [CrossRef]
- Dong, J.; Wu, W.; Huang, J.; You, N.; He, Y.; Yan, H. State of the Art and Perspective of Agricultural Land Use Remote Sensing Information Extraction. J. Geo-Inf. Sci. 2020, 22, 772–783. [Google Scholar]
- Jin, Q.; Xu, E.; Zhang, X. A Fusion Method for Multisource Land Cover Products Based on Superpixels and Statistical Extraction for Enhancing Resolution and Improving Accuracy. Remote Sens. 2022, 14, 1676. [Google Scholar] [CrossRef]
- Chen, J.; Ban, Y.; Li, S. Open access to Earth land-cover map. Nature 2014, 7523, 434. [Google Scholar]
- Zhang, X.; Liu, L.; Chen, X.; Gao, Y.; Xie, S.; Mi, J. GLC_FCS30: Global land-cover product with fine classification system at 30 m using time-series Landsat imagery. Earth Syst. Sci. Data 2021, 13, 2753–2776. [Google Scholar] [CrossRef]
- Kuang, W.; Liu, J.; Tian, H.; Shi, H.; Dong, J.; Song, C.; Li, X.; Du, G.; Hou, Y.; Lu, D.; et al. Cropland redistribution to marginal lands undermines environmental sustainability. Natl. Sci. Rev. 2022, 9, nwab091. [Google Scholar] [CrossRef]
- Yang, J.; Huang, X. The 30 m annual land cover dataset and its dynamics in China from 1990 to 2019. Earth Syst. Sci. Data 2021, 13, 3907–3925. [Google Scholar] [CrossRef]
- Sun, C.; Zhang, H.; Xu, L.; Ge, J.; Jiang, J.; Zuo, L.; Wang, C. Twenty-meter annual paddy rice area map for mainland Southeast Asia using Sentinel-1 synthetic-aperture-radar data. Earth Syst. Sci. Data 2023, 15, 1501–1520. [Google Scholar] [CrossRef]
- Qiu, B.; Jiang, F.; Chen, C.; Tang, Z.; Wu, W.; Berry, J. Phenology-pigment based automated peanut mapping using sentinel-2 images. Gisci. Remote Sens. 2021, 58, 1335–1351. [Google Scholar] [CrossRef]
- Bera, B.; Saha, S.; Bhattacharjee, S. Estimation of Forest Canopy Cover and Forest Fragmentation Mapping Using Landsat Satellite Data of Silabati River Basin (India). KN-J. Cartogr. Geogr. Inf. 2020, 70, 181–197. [Google Scholar] [CrossRef]
- Xiao, X.; Hollinger, D.; Aber, J.; Goltz, M.; Davidson, E.A.; Zhang, Q.; Moore, B. Satellite-based modeling of gross primary production in an evergreen needleleaf forest. Remote Sens. Environ. 2004, 89, 519–534. [Google Scholar] [CrossRef]
- Gitelson, A.A.; Gritz, Y.; Merzlyak, M.N. Relationships between leaf chlorophyll content and spectral reflectance and algorithms for non-destructive chlorophyll assessment in higher plant leaves. J. Plant Physiol. 2003, 160, 271–282. [Google Scholar] [CrossRef] [PubMed]
- Tucker, C.J. Red and photographic infrared linear combinations for monitoring vegetation. Remote Sens. Environ. 1979, 8, 127–150. [Google Scholar] [CrossRef]
- Huete, A.; Didan, K.; Miura, T.; Rodriguez, E.P.; Gao, X.; Ferreira, L.G. Overview of the radiometric and biophysical performance of the MODIS vegetation indices. Remote Sens. Environ. 2002, 83, 195–213. [Google Scholar] [CrossRef]
- Merzlyak, M.N.; Gitelson, A.A.; Chivkunova, O.B.; Rakitin, V.Y. Non-destructive optical detection of pigment changes during leaf senescence and fruit ripening. Physiol. Plant. 1999, 106, 135–141. [Google Scholar] [CrossRef]
- Zhang, T.; Yang, X.; Wang, H.; Li, Y.; Ye, Q. Climatic and technological ceilings for Chinese rice stagnation based on yield gaps and yield trend pattern analysis. Glob. Change Biol. 2014, 20, 1289–1298. [Google Scholar] [CrossRef]
- Breiman, L. Random forests. Mach. Learn. 2001, 45, 5–32. [Google Scholar] [CrossRef]
- Belgiu, M.; Drăguţ, L. Random forest in remote sensing: A review of applications and future directions. ISPRS J. Photogramm. Remote Sens. 2016, 114, 24–31. [Google Scholar] [CrossRef]
- Chen, A.; Li, Y. Rice recognition of different growth stages based on Sentinel-2 images in mountainous areas of Southwest China. Trans. Chin. Soc. Agric. Eng. 2020, 36, 192–199. [Google Scholar]
- Li, Y.; Zhang, L.; Yan, J.; Wang, P.; Hu, N.; Cheng, W.; Fu, B. Mapping the hotspots and coldspots of ecosystem services in conservation priority setting. J. Geogr. Sci. 2017, 27, 681–696. [Google Scholar] [CrossRef]
- Wang, J.F.; Li, X.H.; Christakos, G.; Liao, Y.L.; Zhang, T.; Gu, X.; Zheng, X.Y. Geographical Detectors-Based Health Risk Assessment and its Application in the Neural Tube Defects Study of the Heshun Region, China. Int. J. Geogr. Inf. Sci. 2010, 24, 107–127. [Google Scholar] [CrossRef]
- Song, Y.; Wang, J.; Ge, Y.; Xu, C. An optimal parameters-based geographical detector model enhances geographic characteristics of explanatory variables for spatial heterogeneity analysis: Cases with different types of spatial data. Gisci. Remote Sens. 2020, 57, 593–610. [Google Scholar] [CrossRef]
- Xu, C.; Li, Y.; Wang, J.; Xiao, G. Spatial-temporal detection of risk factors for bacillary dysentery in Beijing, Tianjin and Hebei, China. BMC Public Health 2017, 17, 743. [Google Scholar] [CrossRef] [PubMed]
- Song, Q.; Hu, Q.; Zhou, Q.; Hovis, C.; Xiang, M.; Tang, H.; Wu, W. In-Season Crop Mapping with GF-1/WFV Data by Combining Object-Based Image Analysis and Random Forest. Remote Sens. 2017, 9, 1184. [Google Scholar] [CrossRef]
- Huang, C.; You, S.; Liu, A.; Li, P.; Zhang, J.; Deng, J. High-Resolution National-Scale Mapping of Paddy Rice Based on Sentinel-1/2 Data. Remote Sens. 2023, 15, 4055. [Google Scholar] [CrossRef]
- Gan, C.; Qiu, B.; Zhang, J.; Yao, C.; Ye, Z.; Huang, G.; Huang, Y.; Peng, Y.; Lin, Y.; Lin, D.; et al. Mapping paddy rice planting patterns based on Sentinel-1/2. J. Geo-Inf. Sci. 2023, 25, 153–162. [Google Scholar]
- Zhang, J.; LIiu, Y.; Zhang, E.; Chen, J.; Tan, Q.; Acharya Nalan, S. Dynamics and driving mechanisms of cultivated land at county level in China. Acta Geogr. Sin. 2023, 78, 2105–2127. [Google Scholar]
- Dong, S.; Xin, L.; Li, S.; Xie, H.; Yuluan, Z.; Xue, W.; Xiubin, L.I.; Hengfei, S.; Yahan, L.U.; Acharya Nalan, S. The extent and spatial distribution of terrace abandonment in China. Acta Geogr. Sin. 2023, 78, 3–15. [Google Scholar] [CrossRef]
- Xie, H.; Wu, Q.; Li, X. Impact of labor transfer differences on terrace abandonment:Evidence from micro-survey of farmers in the mountainous areas of Hunan, Fujian and Jiangxi. Acta Geogr. Sin. 2023, 78, 16–34. [Google Scholar]
- Li, Y.; Qiu, B.; He, Y.; Chen, G.; Ye, Z. Crop intensity based on MODIS data in China during 2001–2018. Prog. Geogr. Sci. 2020, 39, 1874–1883. [Google Scholar] [CrossRef]
- Mansaray, L.R.; Yang, L.; Kabba, V.T.S.; Kanu, A.S.; Huang, J.; Wang, F. Optimising rice mapping in cloud-prone environments by combining quad-source optical with Sentinel-1A microwave satellite imagery. Gisci. Remote Sens. 2019, 56, 1333–1354. [Google Scholar] [CrossRef]


| Name | Sources | Total Accuracy | Reference |
|---|---|---|---|
| GlobeLand30 | www.globallandcover.com (accessed on 16 January 2024) | 85.72% (2020) | Chen et al. [49] |
| GLC_FCS30 | https://data.casearth.cn (accessed on 16 January 2024) | 82.5% | Zhang et al. [50] |
| NLCD-China | https://www.resdc.cn/ (accessed on 16 January 2024) | —— | Kuang et al. [51] |
| CLCD | https://zenodo.org/record/8176941 (accessed on 16 January 2024) | >79% | Yang et al. [52] |
| Indices | Calculation Formulas | Reference |
|---|---|---|
| BSI | BSI = [( + ) − ( + )]/[( + ) + ( + )] | Bera et al. [55] |
| LSWI | LSWI = ( − )/( + ) | Xiao et al. [56] |
| GCVI | GCVI = − 1 | Gitelson et al. [57] |
| NDVI | NDVI = ( − )/( + ) | Tucker [58] |
| EVI | EVI = 2.5 × ( − )/( + 6 + 7.5 + 1) | Huete et al. [59] |
| PSRI | PSRI = ( − )/ | Merzlyak et al. [60] |
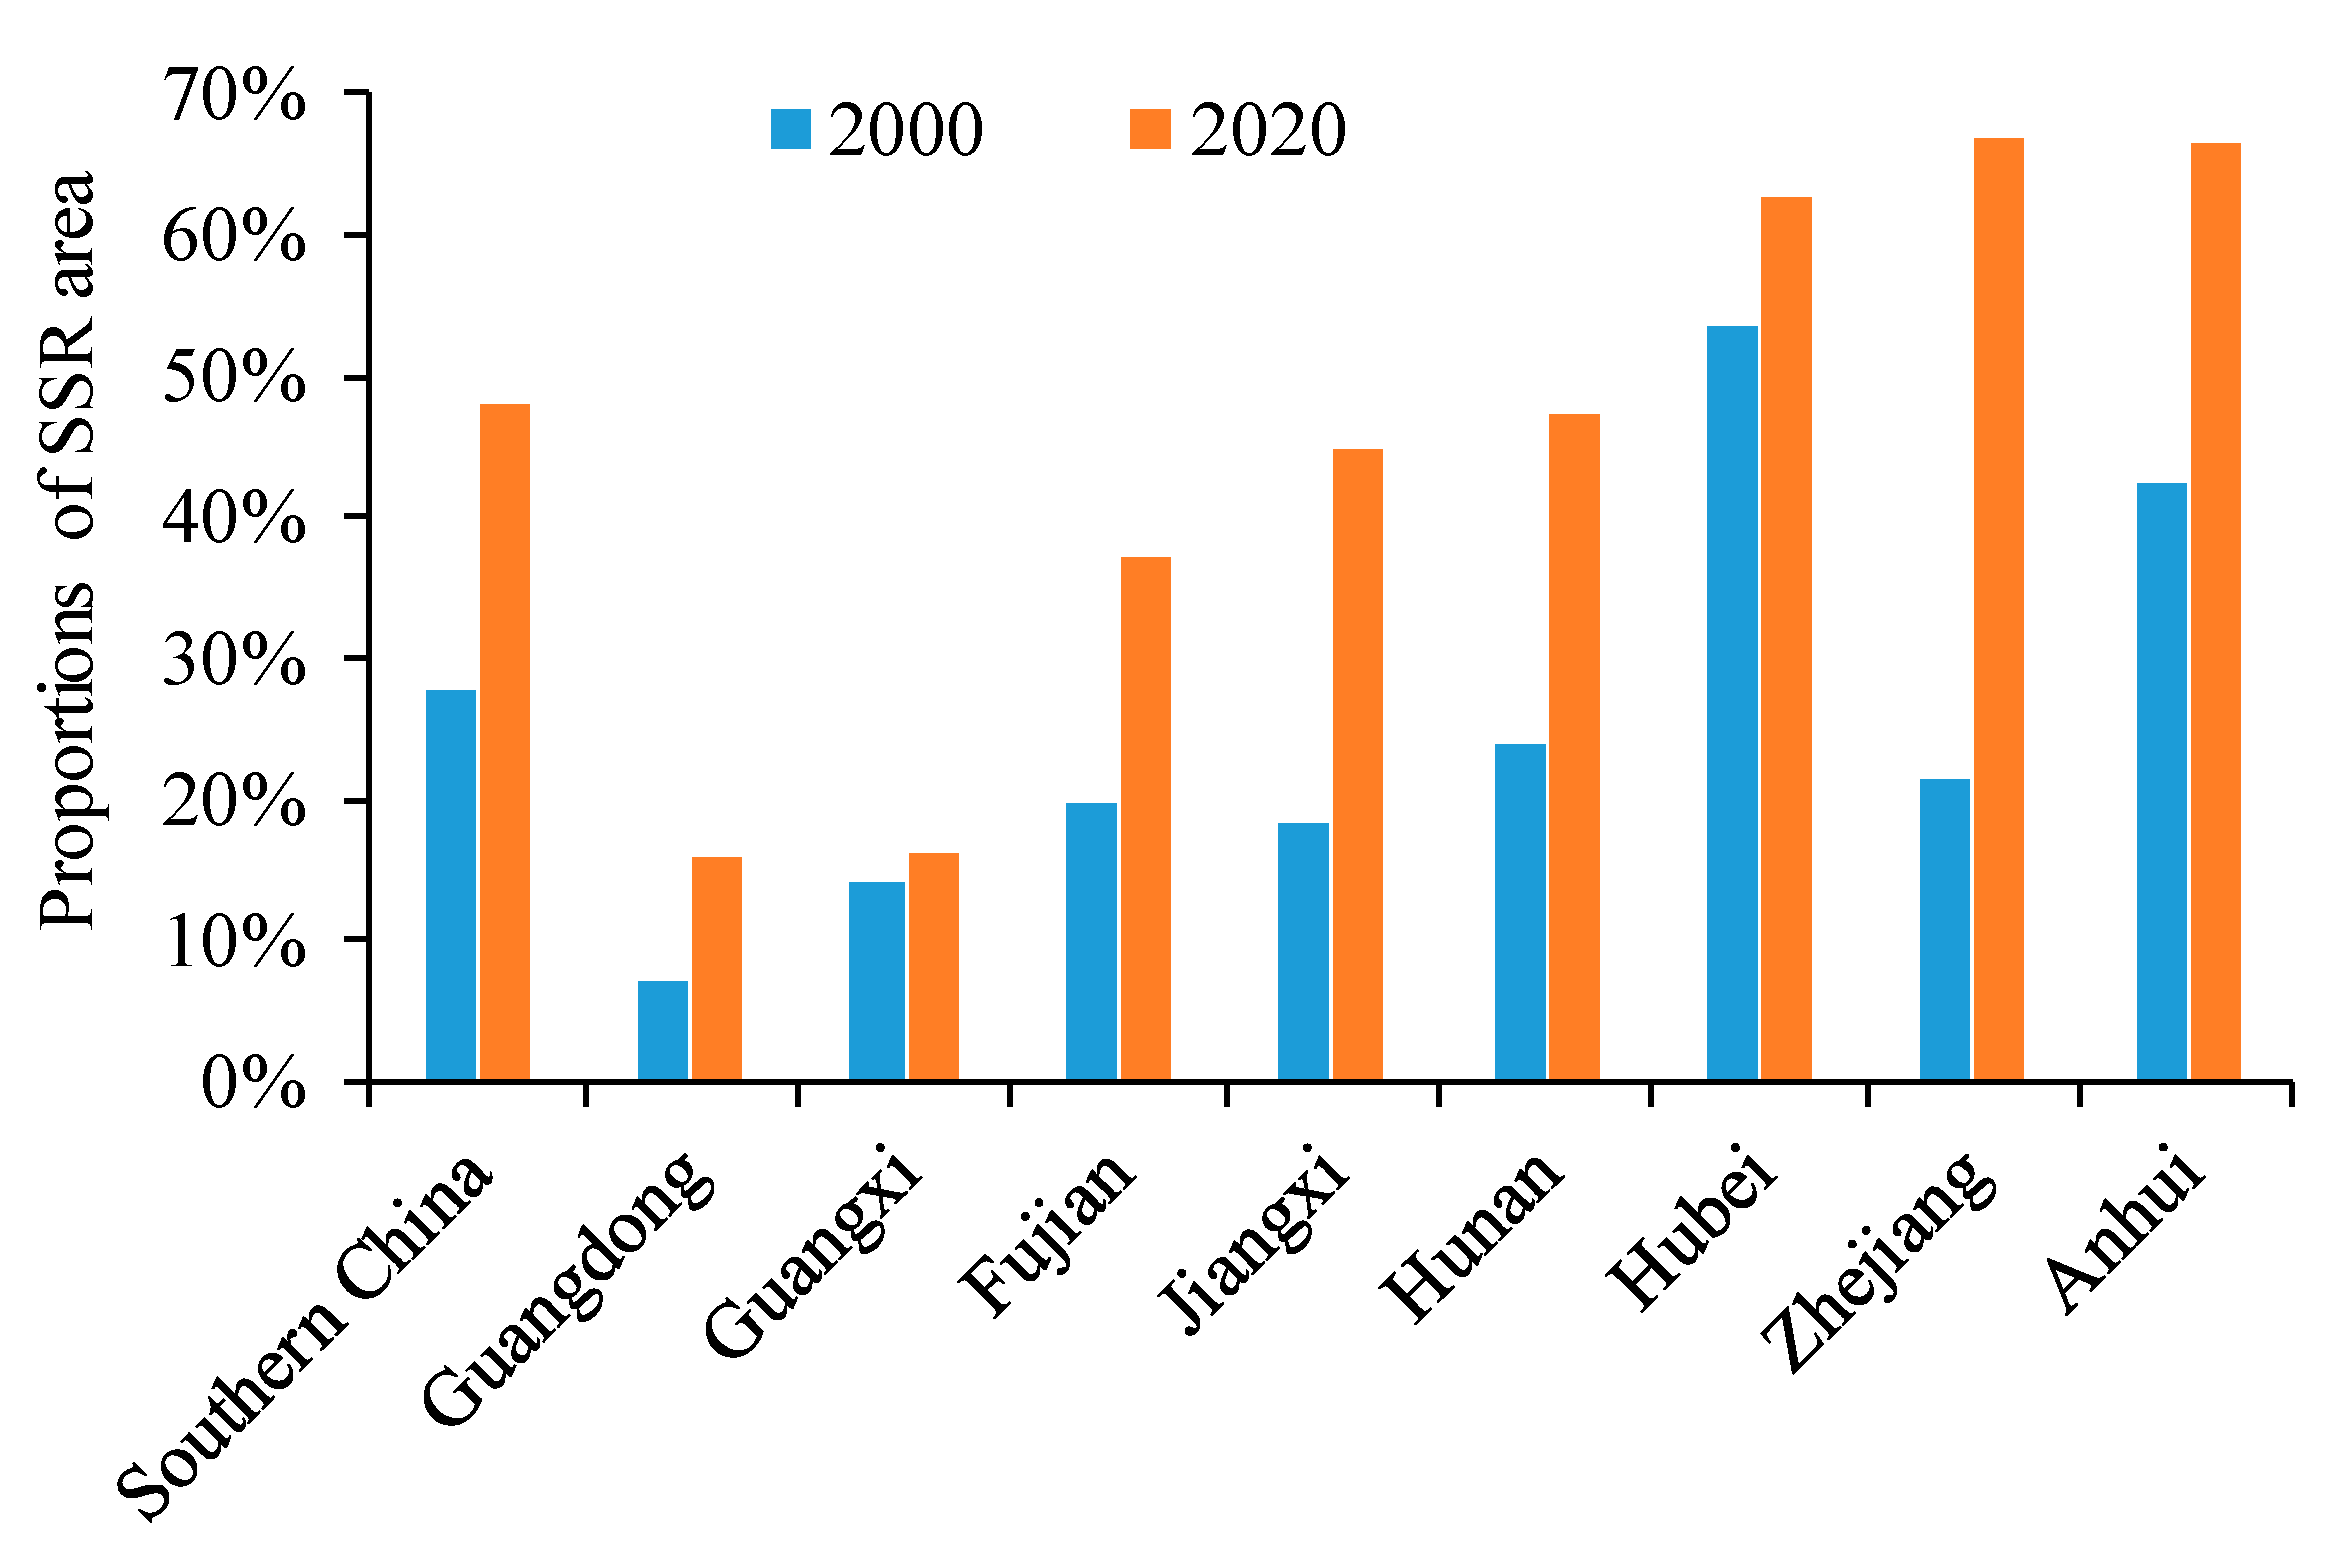
| Regions | 2000 | 2020 | ||
|---|---|---|---|---|
| SSR (104 hm2) | DSR (104 hm2) | SSR (104 hm2) | DSR (104 hm2) | |
| Guangdong | 29.08 | 381.72 | 17.50 | 94.24 |
| Guangxi | 73.57 | 450.24 | 45.50 | 234.08 |
| Fujian | 23.17 | 94.33 | 28.55 | 48.64 |
| Jiangxi | 71.24 | 317.65 | 120.16 | 147.66 |
| Hunan | 101.36 | 325.35 | 176.38 | 196.31 |
| Hubei | 350.49 | 302.78 | 311.20 | 186.52 |
| Zhejiang | 42.46 | 154.60 | 39.93 | 20.02 |
| Anhui | 187.34 | 256.27 | 220.29 | 111.47 |
| Southern China | 878.70 | 2282.94 | 959.51 | 1038.94 |
| Region | 2000 | 2020 | ||||||
|---|---|---|---|---|---|---|---|---|
| Kappa | OA (%) | UA (%) | PA (%) | Kappa | OA (%) | UA (%) | PA (%) | |
| Southern China | 0.81 | 90.67 | 93.55 | 87.69 | 0.85 | 95.68 | 91.95 | 94.82 |
| Guangdong | 0.78 | 89.45 | 96.47 | 82.00 | 0.89 | 98.76 | 83.44 | 96.58 |
| Guangxi | 0.78 | 89.37 | 93.39 | 85.32 | 0.83 | 94.78 | 82.73 | 89.74 |
| Fujian | 0.75 | 87.73 | 91.91 | 83.48 | 0.84 | 91.82 | 88.94 | 93.27 |
| Jiangxi | 0.81 | 90.77 | 93.68 | 87.25 | 0.87 | 94.15 | 90.48 | 91.25 |
| Hunan | 0.83 | 91.79 | 92.78 | 90.90 | 0.84 | 96.1 | 98.63 | 96.83 |
| Hubei | 0.83 | 91.91 | 90.38 | 94.00 | 0.91 | 98.41 | 99.80 | 98.54 |
| Zhejiang | 0.84 | 92.34 | 97.74 | 86.59 | 0.91 | 95.82 | 94.06 | 95.05 |
| Anhui | 0.84 | 92.01 | 92.03 | 92.01 | 0.84 | 95.63 | 97.54 | 97.32 |
Disclaimer/Publisher’s Note: The statements, opinions and data contained in all publications are solely those of the individual author(s) and contributor(s) and not of MDPI and/or the editor(s). MDPI and/or the editor(s) disclaim responsibility for any injury to people or property resulting from any ideas, methods, instructions or products referred to in the content. |
© 2024 by the authors. Licensee MDPI, Basel, Switzerland. This article is an open access article distributed under the terms and conditions of the Creative Commons Attribution (CC BY) license (https://creativecommons.org/licenses/by/4.0/).
Share and Cite
Zhu, W.; Peng, X.; Ding, M.; Li, L.; Liu, Y.; Liu, W.; Yang, M.; Chen, X.; Cai, J.; Huang, H.; et al. Decline in Planting Areas of Double-Season Rice by Half in Southern China over the Last Two Decades. Remote Sens. 2024, 16, 440. https://doi.org/10.3390/rs16030440
Zhu W, Peng X, Ding M, Li L, Liu Y, Liu W, Yang M, Chen X, Cai J, Huang H, et al. Decline in Planting Areas of Double-Season Rice by Half in Southern China over the Last Two Decades. Remote Sensing. 2024; 16(3):440. https://doi.org/10.3390/rs16030440
Chicago/Turabian StyleZhu, Wenchao, Xinqin Peng, Mingjun Ding, Lanhui Li, Yaqun Liu, Wei Liu, Mengdie Yang, Xinxin Chen, Jiale Cai, Hanbing Huang, and et al. 2024. "Decline in Planting Areas of Double-Season Rice by Half in Southern China over the Last Two Decades" Remote Sensing 16, no. 3: 440. https://doi.org/10.3390/rs16030440