Article

Primary Impact Evaluation of Surface Temperature Observations for Microwave Temperature Sounding Data Assimilation over Land

1
Joint Center for Data Assimilation Research and Applications, School of Atmospheric Sciences, Nanjing University of Information Science and Technology, Nanjing 210044, China
2
CMA Earth System Modeling and Prediction Centre, Beijing 100081, China
3
State Key Laboratory of Severe Weather, Chinese Academy of Meteorological Sciences, Beijing 100081, China
*
Author to whom correspondence should be addressed.
Remote Sens. 2024, 16(2), 395; https://doi.org/10.3390/rs16020395
Submission received: 10 November 2023 / Revised: 13 January 2024 / Accepted: 17 January 2024 / Published: 19 January 2024
(This article belongs to the Special Issue Land Surface Temperature Estimation Using Remote Sensing II)

Abstract

:
Observations from the Advanced Microwave Sounding Unit-A (AMSU-A) onboard polar-orbiting satellites are considered to be the most effective satellite data in terms of obviously reducing operational prediction errors. However, there are still significant difficulties in the application of AMSU-A low-level channel data assimilation over land. One of them is the inaccurate surface skin temperature (SKT) of the background on land areas, which leads to significant uncertainty in the accuracy of simulating brightness temperature (BT) in these channels. Therefore, improving the accuracy of SKT in the background field is a direct way to improve the assimilation effect of these low-level channel data over land. In this study, both high-spatio-temporal-resolution automatic weather station (AWS) observation data from China in September 2021 and the AMSU-A observation data from NOAA-15/18/19 and MetOp-A were used. Based on the Advanced Research version of the Weather Research and Forecast model (WRF-ARW) and Gridpoint Statistical Interpolation (GSI) assimilation system, we first analyzed the differences in SKT between AWS observations and model simulations and then attempted to directly replace the simulated SKT with the observation data. On this basis, the differences in BT simulation effects over the land area of Southwest China before and after replacement were meticulously analyzed and compared. In addition, the impacts of SKT replacement in areas with different terrain elevations and in cloudy areas were also evaluated. The results indicate that the SKTs of background fields were generally lower than the surface observations, whereas the diurnal variation in SKT was not well simulated. After replacing the SKT of the background field with station observations, the BT differences between the observation and background (O–B, observation minus background) were remarkably reduced, especially for channels 3–5 and 15 of the AMSU-A. The volume of data passing the GSI quality control significantly increased, and the standard deviation of O–B decreased. Further analysis showed that the improvement effect was better in areas at an elevation above 1600 m. Moreover, introducing SKT observations leads to a significant and stable improvement over BT simulations in cloudy areas over land.

Graphical Abstract

1. Introduction

By the end of the 20th century, the direct assimilation of satellite observations using a variational data assimilation system had effectively addressed the issue of insufficient conventional observations, resulting in continuous improvements in the accuracy of global forecasts [1]. The global observing network, consisting of geostationary and polar-orbiting satellites, has achieved all-day, all-weather, and globe-covering observations with fine resolution. Nowadays, various satellite data are utilized by numerical weather prediction (NWP) centers worldwide, and they have become the major observational data source [2,3,4]. Among the various types of satellite observations, the data from the Advanced Microwave Sounding Unit-A (AMSU-A) onboard polar-orbiting satellites have the longest observation history, constituting the earliest type applied to operational assimilation, significantly improving NWP accuracy [5,6]. Practical evidence has demonstrated the positive impact of AMSU-A data assimilated into NWPs [7,8,9].
Many studies have proved that directly assimilating AMSU-A data can improve the numerical forecasting of high-impact weather, such as heavy rainfall [10,11,12] and tropical cyclones [13,14,15,16]. However, these studies primarily paid attention to the impact of AMSU-A data assimilation over the ocean [17]. For land areas, channels insensitive to land surfaces are more frequently utilized for data assimilation [18,19]. Through improving surface emissivity estimation and mixed surface treatment, the Integrated Forecasting System (IFS) of the European Centre for Medium-Range Weather Forecasts (ECMWF) accomplished the assimilation of some microwave window channels over land. This led to an overall increase in the usage of most actively assimilated microwave channels by 4% to 33%, resulting in pronounced forecast improvements, especially in the Northern Hemisphere, in polar regions, and in the winter [20]. Nevertheless, the users of many operational systems still prefer to avoid assimilating window channels or low-level channels to achieve stable assimilation results. For example, only AMSU-A channels 7–11 are assimilated in the three-dimensional variational data assimilation component of the Global/Regional Assimilation and Prediction System, all of which are atmospheric sounding channels [21]. This preference primarily arises from the poor accuracy of BT simulated using radiative transfer models (RTMs) over land areas, leading to an inadequate representation of model atmospheric temperature characteristics through BT simulation, thus making it impossible for the assimilation system to correctly adjust the model variables based on the observational data.
Different from conventional observations, radiative transfer models are adopted as observation operators during the process of directly assimilating satellite radiance data. In conjunction with data such as temperature and humidity profiles, wind fields, and the SKT of the background field, these model variables are used to simulate satellite observations of BT. The difference between the simulated and observed BT is then calculated. Using the adjoint model of radiative transfer models, this BT difference is further transformed into differences in model variables, which, along with information on observational errors, background field errors, and simulation errors, enable adjustments to the model’s background field. Therefore, to effectively assimilate satellite observation data, it is essential to accurately simulate satellite BT data based on the model background data.
The main factors affecting the accuracy of BT simulations over land areas are surface emissivity and SKT. In comparison to the ocean, land areas exhibit higher surface emissivity. Additionally, temporal and spatial variations in these land surface parameters are much more significant, making it challenging to distinguish the contributions of atmosphere and surface radiation [22,23]. Moreover, both the complexity of weather processes in the atmospheric boundary layer and the varying land surface types make it difficult to estimate surface emissivity over land. Many scientists have proposed numerous improvement strategies for surface emissivity estimation. According to the characteristic wherein surface emissivity varies little at channels with similar frequencies, Karbou et al. [24] used specific window channels to provide real-time surface emissivity values for other channels, thus establishing a method for dynamically retrieving surface emissivity using AMSU data. Compared with climatological surface emissivity, utilizing dynamically varying emissivity allows more satellite observation data over land into the assimilation system, thus significantly improving the model outputs, especially in tropical regions [25]. Lonitz et al. [26], Xing [27], and Xian et al. [28], among others, have all attempted to use dynamic emissivity retrievals to replace fixed surface emissivity in radiative transfer models, giving rise to beneficial impacts on the assimilation. Currently, dynamic emissivity retrieval methods for surface emissivity have been implemented for operational use in the ECMWF assimilation system [29].
Although dynamic retrieval methods provide a viable solution for surface emissivity issues, research involving the assimilation of surface channels over land still encounters challenges due to insufficient SKT accuracy [30,31]. Without adjusting surface emissivity, this study attempts to explore the impact of surface temperature on satellite data assimilation. Acquiring accurate land SKTs is a crucial approach for improving the assimilation effect of satellite microwave low-level channels over land areas. However, due to spatial heterogeneity and rapid temporal variations in SKT, numerical models currently have some limitations in accurately simulating surface variables with fine spatiotemporal resolution [32,33,34,35]. Some scholars have applied satellite data for global SKT retrievals [36,37,38], revealing that the errors in SKT retrieved using thermal infrared data were found to be less than 1.5 K. Nevertheless, current satellite-derived land SKT products continue to face challenges, including substantial errors and spatial discontinuity [39,40]. The experimental results have indicated that the impact of retrieved SKT on assimilation and forecasting is neutral [41].
Although complex and variable SKTs greatly increase the difficulty of temperature retrieval, densely distributed meteorological observation stations can provide us with more accurate SKT observations with high spatiotemporal resolution. Since 2020, China’s surface meteorological observations have been fully automated, with over 65,000 AWSs having been deployed nationwide. This dense observation network enables us to achieve abundant SKT observation data with fine spatiotemporal resolution. Unlike satellite retrievals, conventional observations can be used to directly measure model variables, offering higher resolution and higher quality data for limited geographical regions. Hence, AWSs can supply more accurate SKT data for the assimilation of AMSU-A data over land areas. Meanwhile, more robust quality control measures are also required. Using SKT data from AWS, in this study, we aimed to analyze the impact of accurate SKT readings on the improvement of BT simulation in low-level channels of AMSU-A onboard polar-orbiting satellites.
To better elucidate the impact of SKT, we selected the land area of Southwest China as the study area, where the underlying surface conditions are rather complex. In recent years, extreme weather and climate events have occurred frequently in this region, causing substantial losses affecting the local population in terms of life and property and hindering economic and social development [42]. Therefore, it is crucial to enhance assimilation to obtain improved background fields and further utilize NWPs to reasonably estimate the future changes of meteorological elements in Southwest China. Moreover, the southwestern area of China features significant elevation differences and ranks among the most topographically complex areas worldwide. In such a region, determining whether the assimilation of AMSU-A data contributes to relatively stable improvements in forecast results can help to promote the assimilation of AMSU-A data over land in operational numerical weather forecasting. Hence, we aimed to analyze the influence of AWS observations of the land area of Southwest China on the AMSU-A BT simulation. Furthermore, the biases and errors of the AMSU-A simulation were estimated based on different terrain elevations, thus providing valuable insights for enhancing the assimilation of microwave sounding data over land.
The remainder of this paper is organized as follows. Section 2 introduces the datasets and the assimilation system, along with the method used to match the satellite AMSU-A observations with the AWS data. Section 3 provides the main results of this study, including the differences in SKT between the background field and observations, the influences of SKT on the AMSU-A BT simulation, and the impacts of these factors under different terrain elevations. Section 4 discusses the limitations of this study and the plans for future work. Finally, Section 5 provides our conclusions.

2. Data and Methods

2.1. Overview of the Study Area

Southwest China mainly comprises four provinces (Sichuan, Chongqing, Guizhou, and Yunnan) and is situated in a unique geographical location. It lies east of the Tibetan Plateau and is substantially affected by the thermal and dynamic influences of this plateau. Moreover, Southwest China is situated near the tropical waterbodies of the Bay of Bengal and the South China Sea, where warm–humid air masses from the Indian Ocean and the Pacific Ocean converge, giving the region a complex climate. In addition, Southwest China spans three terrain steps of China, presenting complex and diverse landforms, including plateaus, mountains, basins, hills, and various other land types.
The research area in this study covers 91–111°E and 18–30°N, as shown in Figure 1. As can be seen, the southwestern area of China can be clearly divided into three distinct geographic units: the Sichuan Basin and its surrounding mountainous areas with elevations below 500 m, the Yungui Plateau and its mountain ranges and hills with elevations around 2000 m, and the Tibetan Plateau, with elevations mostly exceeding 4000 m (reaching over 5000 m in some areas). In general, Southwest China exhibits considerable topographical variations, with elevations gradually decreasing from west to east.

2.2. Datasets

The satellite observation data were derived from AMSU-A, carried onboard National Oceanic and Atmospheric Administration (NOAA) series satellites NOAA 15–19 and the European Meteorological Operational satellite-A/B/C (MetOp-A/B/C), and the satellite data assimilated in this study are from NOAA-15/18/19 and MetOp-A. The AMSU-A is a cross-track scanning microwave detector with 30 fields of view (FOVs) on each scan line, and it operates with an 8 s scanning period. The nadir FOV approximates a circular area with a radius of 48 km. The AMSU-A consists of a total of 15 channels, among which channels 1, 2, and 15 are window channels with central frequencies of 23.8, 31.4, and 89 GHz, respectively. These three channels are primarily employed for surface and precipitation observations. Their weighting functions peak near the surface and are notably influenced by factors like surface emissivity, atmospheric liquid water, and water vapor. The frequency of the remaining 12 temperature sounding channels ranges between 50.3 and 57.3 GHz, and they are primarily utilized to retrieve atmospheric temperature information from the surface up to approximately 42 km.
The research area is located in Southwest China. Due to the influence of summer monsoons, there is a pre-flood season and a post-flood season in Southwest China around September, and these periods are prone to short-term heavy rainfall and long-term continuous rainy weather. Therefore, in order to avoid the impact of inaccurate precipitation forecasts on the evaluation results, September, which is associated with a relatively stable weather system, was selected as the research period. Hourly SKT observations of intensive AWS data were obtained from the China Meteorological Administration. The data period used ranges from 0000 UTC on 1 September to 2300 UTC on 15 September 2021.

2.3. Background Field

The background was provided by the Advanced Research version of the Weather Research and Forecast model (WRF-ARW) regional numerical model. The WRF model was developed collaboratively by several institutions, including the National Center of Atmospheric Research (NCAR) and the NCEP, and it is primarily used for medium-range numerical weather forecasting. For this study, WRF v3.9.1 was chosen, and the model horizontal resolution was set to 9 km, with a total of 250 × 240 grid points in two-dimensional space.
To mitigate the influence of redundant assimilation, all of the background fields were set 6 h prior to the assimilation time by using the Final Operational Global Analysis (FNL) data provided by the NCEP as the initial condition. The WRF model generates a 6 h model forecast that serves as the background for the GSI system. Figure 2 shows the spatial distribution of the SKT of the background at 0000 UTC and 1200 UTC on 2 September 2021. By incorporating the information in Figure 1, it is evident that the spatial distribution of SKT is highly correlated with terrain elevation. In the lower-altitude Sichuan Basin, the SKT is higher than that in the surrounding areas, while in the higher-altitude Qinghai–Tibet Plateau region, the SKT is much lower.
Comparing the SKTs at these two times, it can be seen that the SKT in the study area has obvious diurnal variation characteristics. The SKT at 1200 UTC is generally higher than that at 0000 UTC, and the amplitude of diurnal variation is also affected by terrain height. For example, in the middle of the region, the daily temperature variation is not significant, but in the west of the region, the SKT difference between the two times can reach about 6 K, and the SKT difference in the low-temperature area of the plateau in the northern region can also be more than 3 K. These findings indicate that the complex terrain of the study area leads to complex changes in SKT, which can also result in the insufficient accuracy of numerical models in simulating SKT in the area.

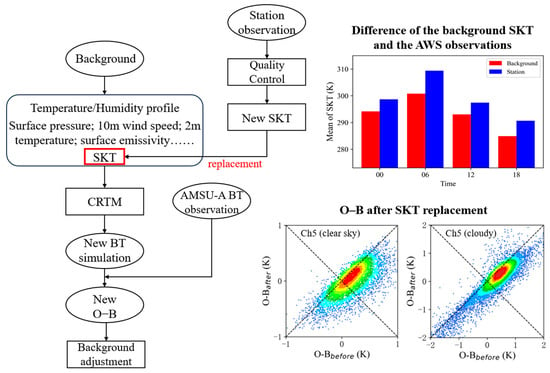
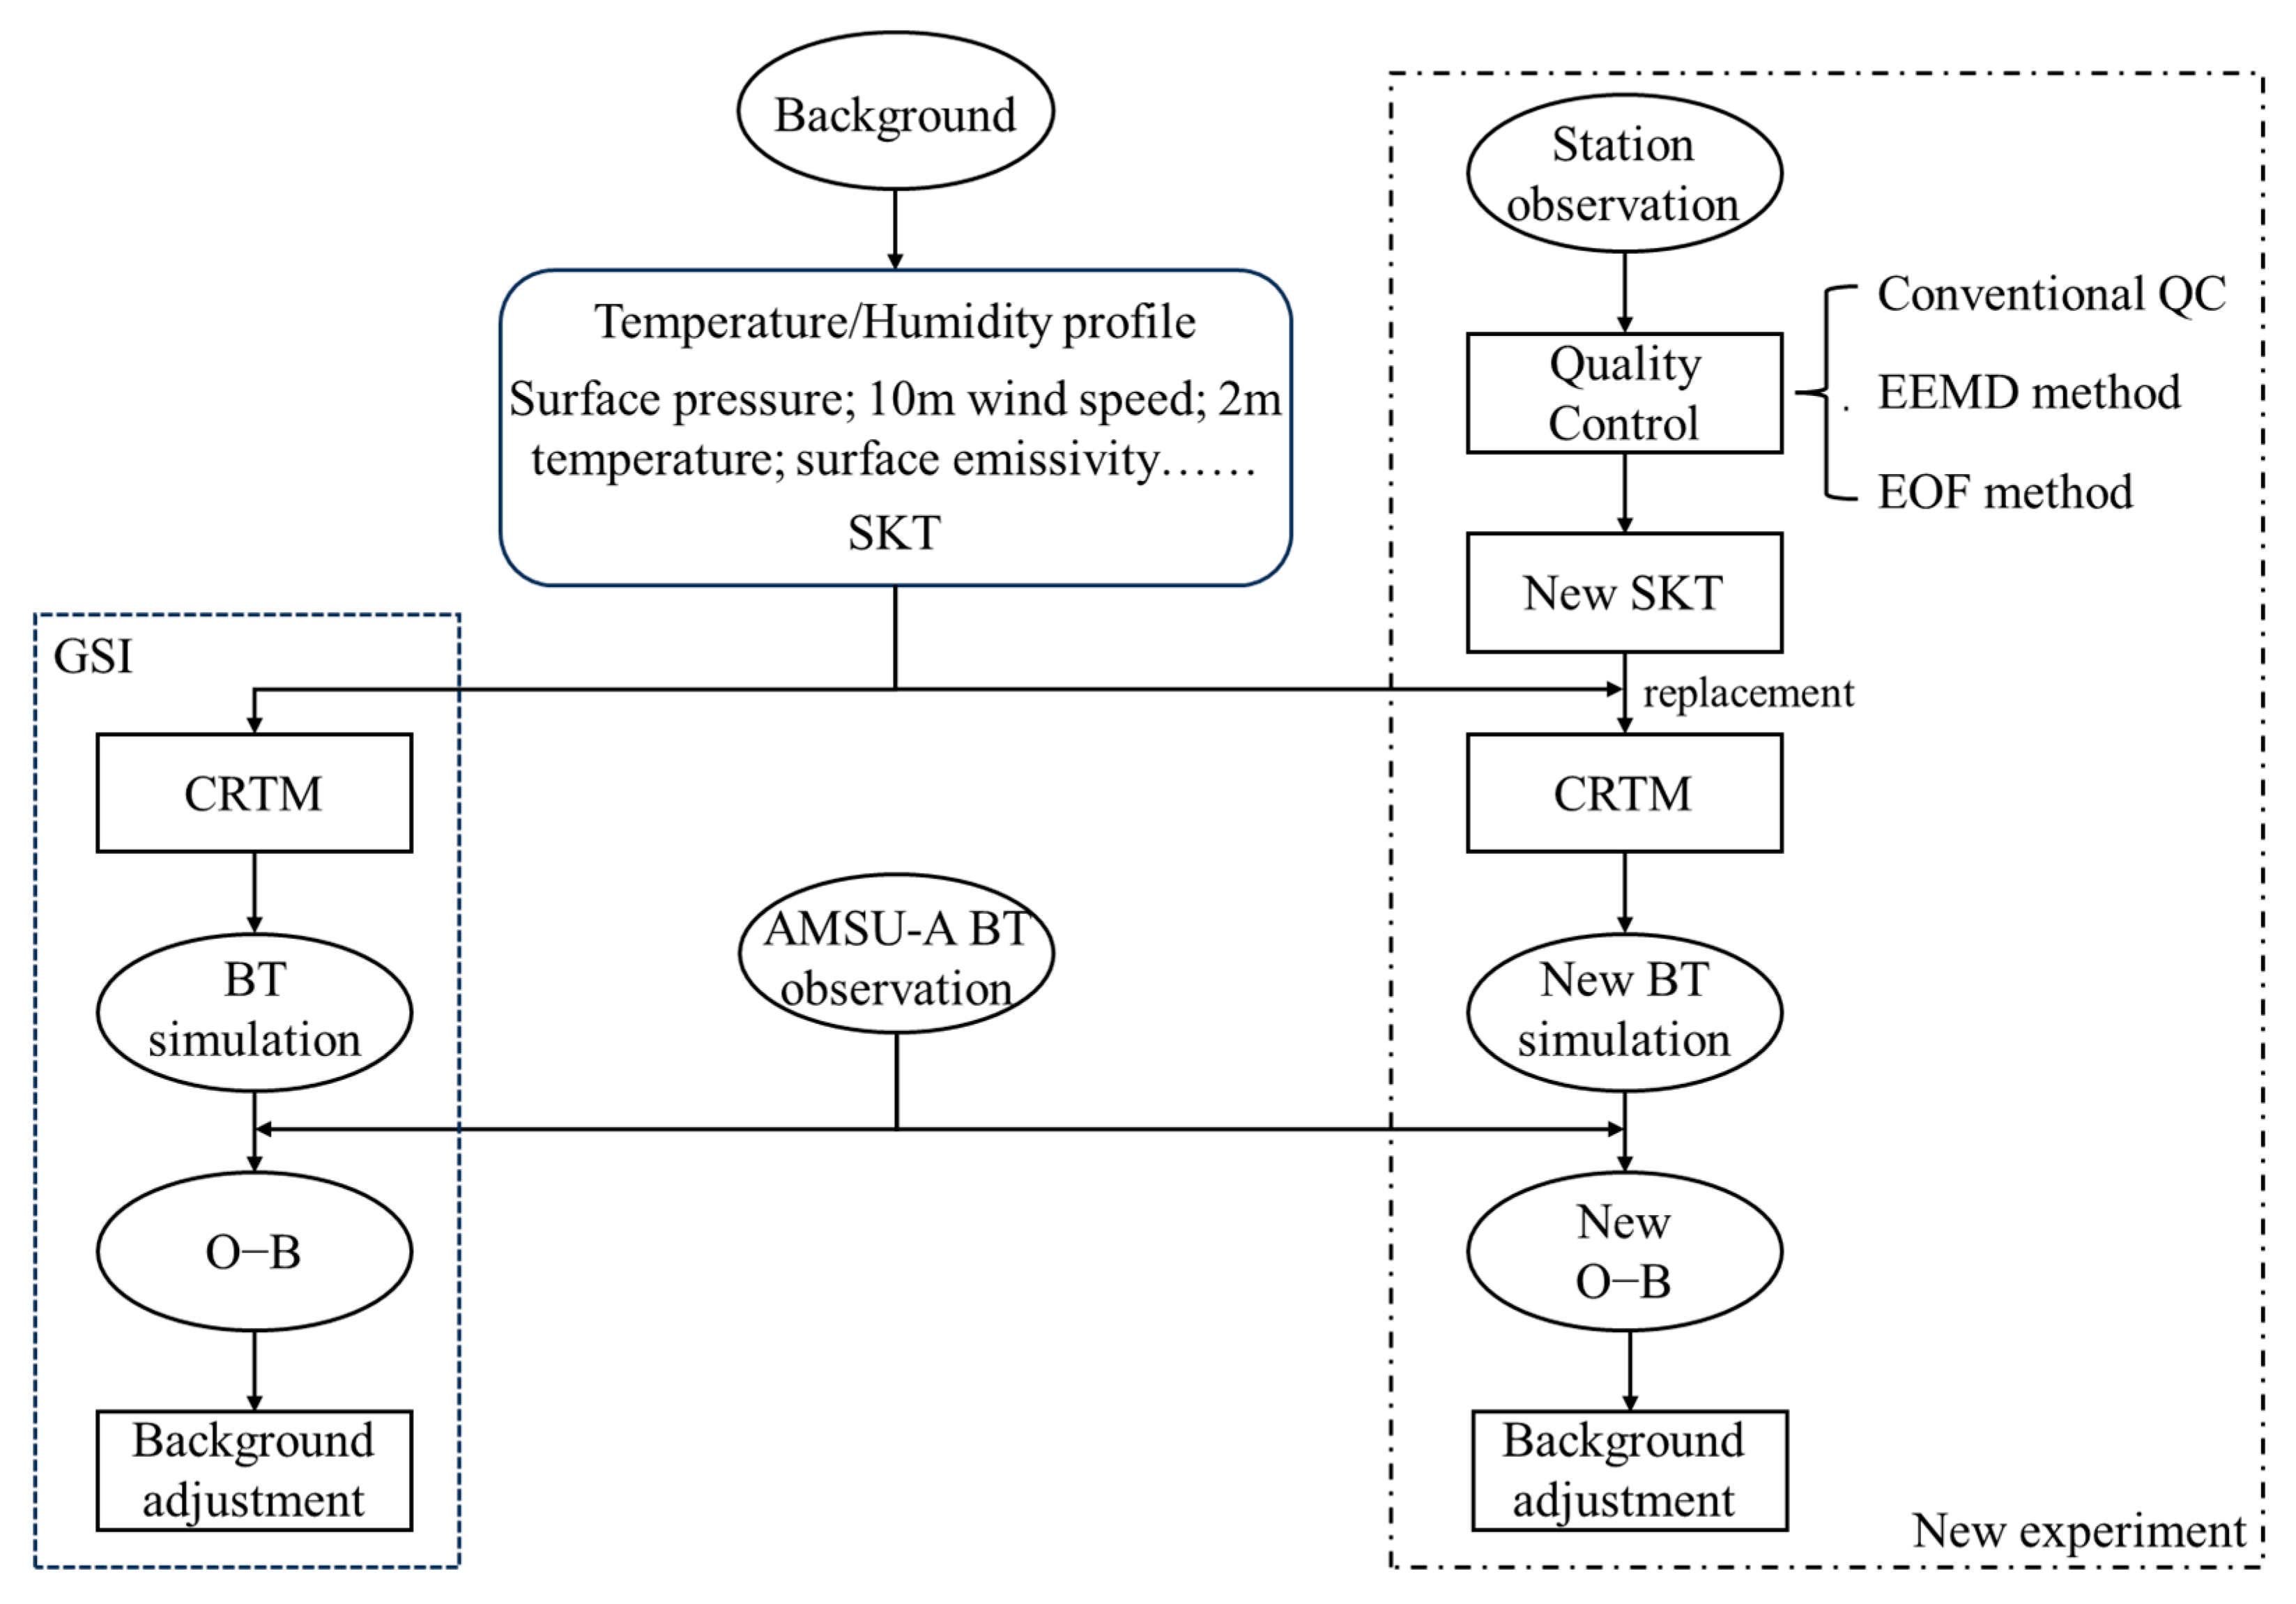
2.4. Modified Data Assimilation System

In order to analyze the impact of the SKT observations on the assimilation of AMSU-A data, the data assimilation system Gridpoint Statistical Interpolation (GSI) v3.3 was selected. The GSI assimilation analysis system was developed based on the Spectral Statistical Interpolation (SSI) system designed by the National Centers for Environmental Prediction (NCEP) in the United States. It incorporates various assimilation schemes, including the three-dimensional variational method and the hybrid ensemble–variational method. Unlike the SSI system, which operates in spectral space, the GSI system conducts optimization analysis in physical space, making it particularly suitable for parallel computing [43].
A flow chart of the GSI data assimilation process used in this paper is shown in Figure 3. In the GSI assimilation system, the Community Radiative Transfer Model (CRTM) uses meteorological elements from the background to simulate BT at AMSU-A observation points. These meteorological variables mainly include atmospheric temperature and humidity profiles, 10 m wind speed, surface pressure, SKT, and so on. The assimilation process of the original GSI system is shown on the left side in Figure 3.
However, due to the complex changes in land surface variables such as terrain height, vegetation type, and soil moisture, numerical models currently face challenges in simulating SKT. Inaccurate SKTs can easily lead to an incorrect simulation of BT. The data assimilation process adjusts the temperature and humidity profile of the background field based on the difference between the simulated and the observed BT, combined with prior knowledge of background error and observation error. The incorrect simulation of BT can easily lead to data assimilation errors in adjusting the temperature and humidity profile of the background. However, replacing the SKT of the background with an accurate SKT observed by an AWS can effectively avoid the negative impact of an incorrect SKT reading on assimilation effects. The assimilation process of the new experiment is shown in the right half of Figure 3.

2.5. Quality Control of Surface Observation Data

Meteorological observation data serve as a vital prerequisite and assurance for meteorological operations and scientific research. Therefore, high-quality meteorological observation data are of great importance. Although AWSs in China have a widespread distribution and high spatio-temporal resolution, the instability of automatic observation technology makes it easier for quality problems to occur. Thus, it is essential to perform data quality control before undertaking scientific research.
In this study, conventional quality control procedures were applied first, including the climatic threshold check, the continuity check, and the dual-weighted standard deviation check. As SKT is influenced by various factors, such as small-scale weather changes in the boundary layer, terrain elevation, and soil type, there are more irregular spatio-temporal changes in SKT. To ensure spatio-temporal continuity for subsequent corrections, the Ensemble Empirical Mode Decomposition (EEMD) method with adaptive features was subsequently used to separate the irregular changes in the SKT time series and the sudden changes caused by incorrect data. The Empirical Orthogonal Function (EOF) method, which also has adaptive features, was used to extract organized spatial structural features of SKT so as to better identify the spatial anomalies caused by erroneous data. Finally, the AWS-derived temperature data that passed through all quality control steps were used for subsequent research.

2.6. Matching AWS with Satellite Observation Points

The time resolution of the surface observation data is 1 h, but the AMSU-A onboard a polar-orbiting satellite can only observe one region twice a day at the same local time. Thus, the matching of the two datasets is required in both the spatial and temporal dimensions. In this study, a simple adjacent-site-matching method was employed. Taking into account the variations in observation time intervals and spatial resolutions between the two datasets, a specific method used was to search for the data with a time interval of less than 1 h between the AWS and satellite observation points. Then, we searched for the AWS that had passed the data quality control process and was closest to the satellite observation point. Afterward, these surface observation data were used to match with the satellite observations. The spatial matching criterion stipulates that the spatial distance between the AWS and the satellite observation point should be less than 25 km.
Figure 4 shows the spatial distribution of the NOAA-19 observation points successfully matched with the AWS data at 0000 UTC and 1200 UTC on 2 September 2021. In Figure 4b,d, it can be seen that the locations of the matched NOAA-19 observation points are consistent with the distribution of AWSs, which are primarily concentrated in the southeastern part of China. Even in the sparsely populated northwestern areas of China, a small number of AMSU-A observations achieved successful matches with AWS observations, providing valuable data support for subsequent research in high-altitude areas.

3. Results

3.1. Evaluation of the SKT of the Background Field

In order to ensure the SKT difference between the observations and simulations from the WRF-ARW model, the spatial distributions of the background SKT at 0000 UTC and 1200 UTC on 2 September 2021, matched with the NOAA-19 satellite observation points, are presented in Figure 5a,b. It can be seen that, apart from the orbit gap around 95°E in the AMSU-A data, there are some missing observation data points after the data-thinning operation was conducted via the GSI assimilation system. This situation differs from that in Figure 4b,d, where some satellite observation data points are missing due to distance and quality control constraints during the matching process.
For the AMSU-A data that could be successfully matched on both occasions, the temperature differences between the observations and simulations are shown in Figure 5c,d. Apparently, the SKTs observed by the AWS are generally higher than the simulations, with the maximum difference exceeding 10 K.
Figure 6 presents the mean values, standard deviations, and data volume of the temperature differences in Southwest China. The satellite-based observations investigated are from the NOAA-15/18/19 and MetOp-A satellites. It can be clearly seen in Figure 5 and Figure 6 that there is a diurnal variation in the mean SKT in Southwest China, with the maximum occurring at 0600 UTC and the minimum at 1800 UTC. In comparison, the SKTs obtained by AWSs are consistently higher than the simulations, and the greatest difference in the average values appears at 0600 UTC (>8 K). Moreover, at 0600 UTC, the standard deviation of the simulations is noticeably lower than that of the observations, indicating that the model struggles to reproduce the diurnal variation of the actual SKT.

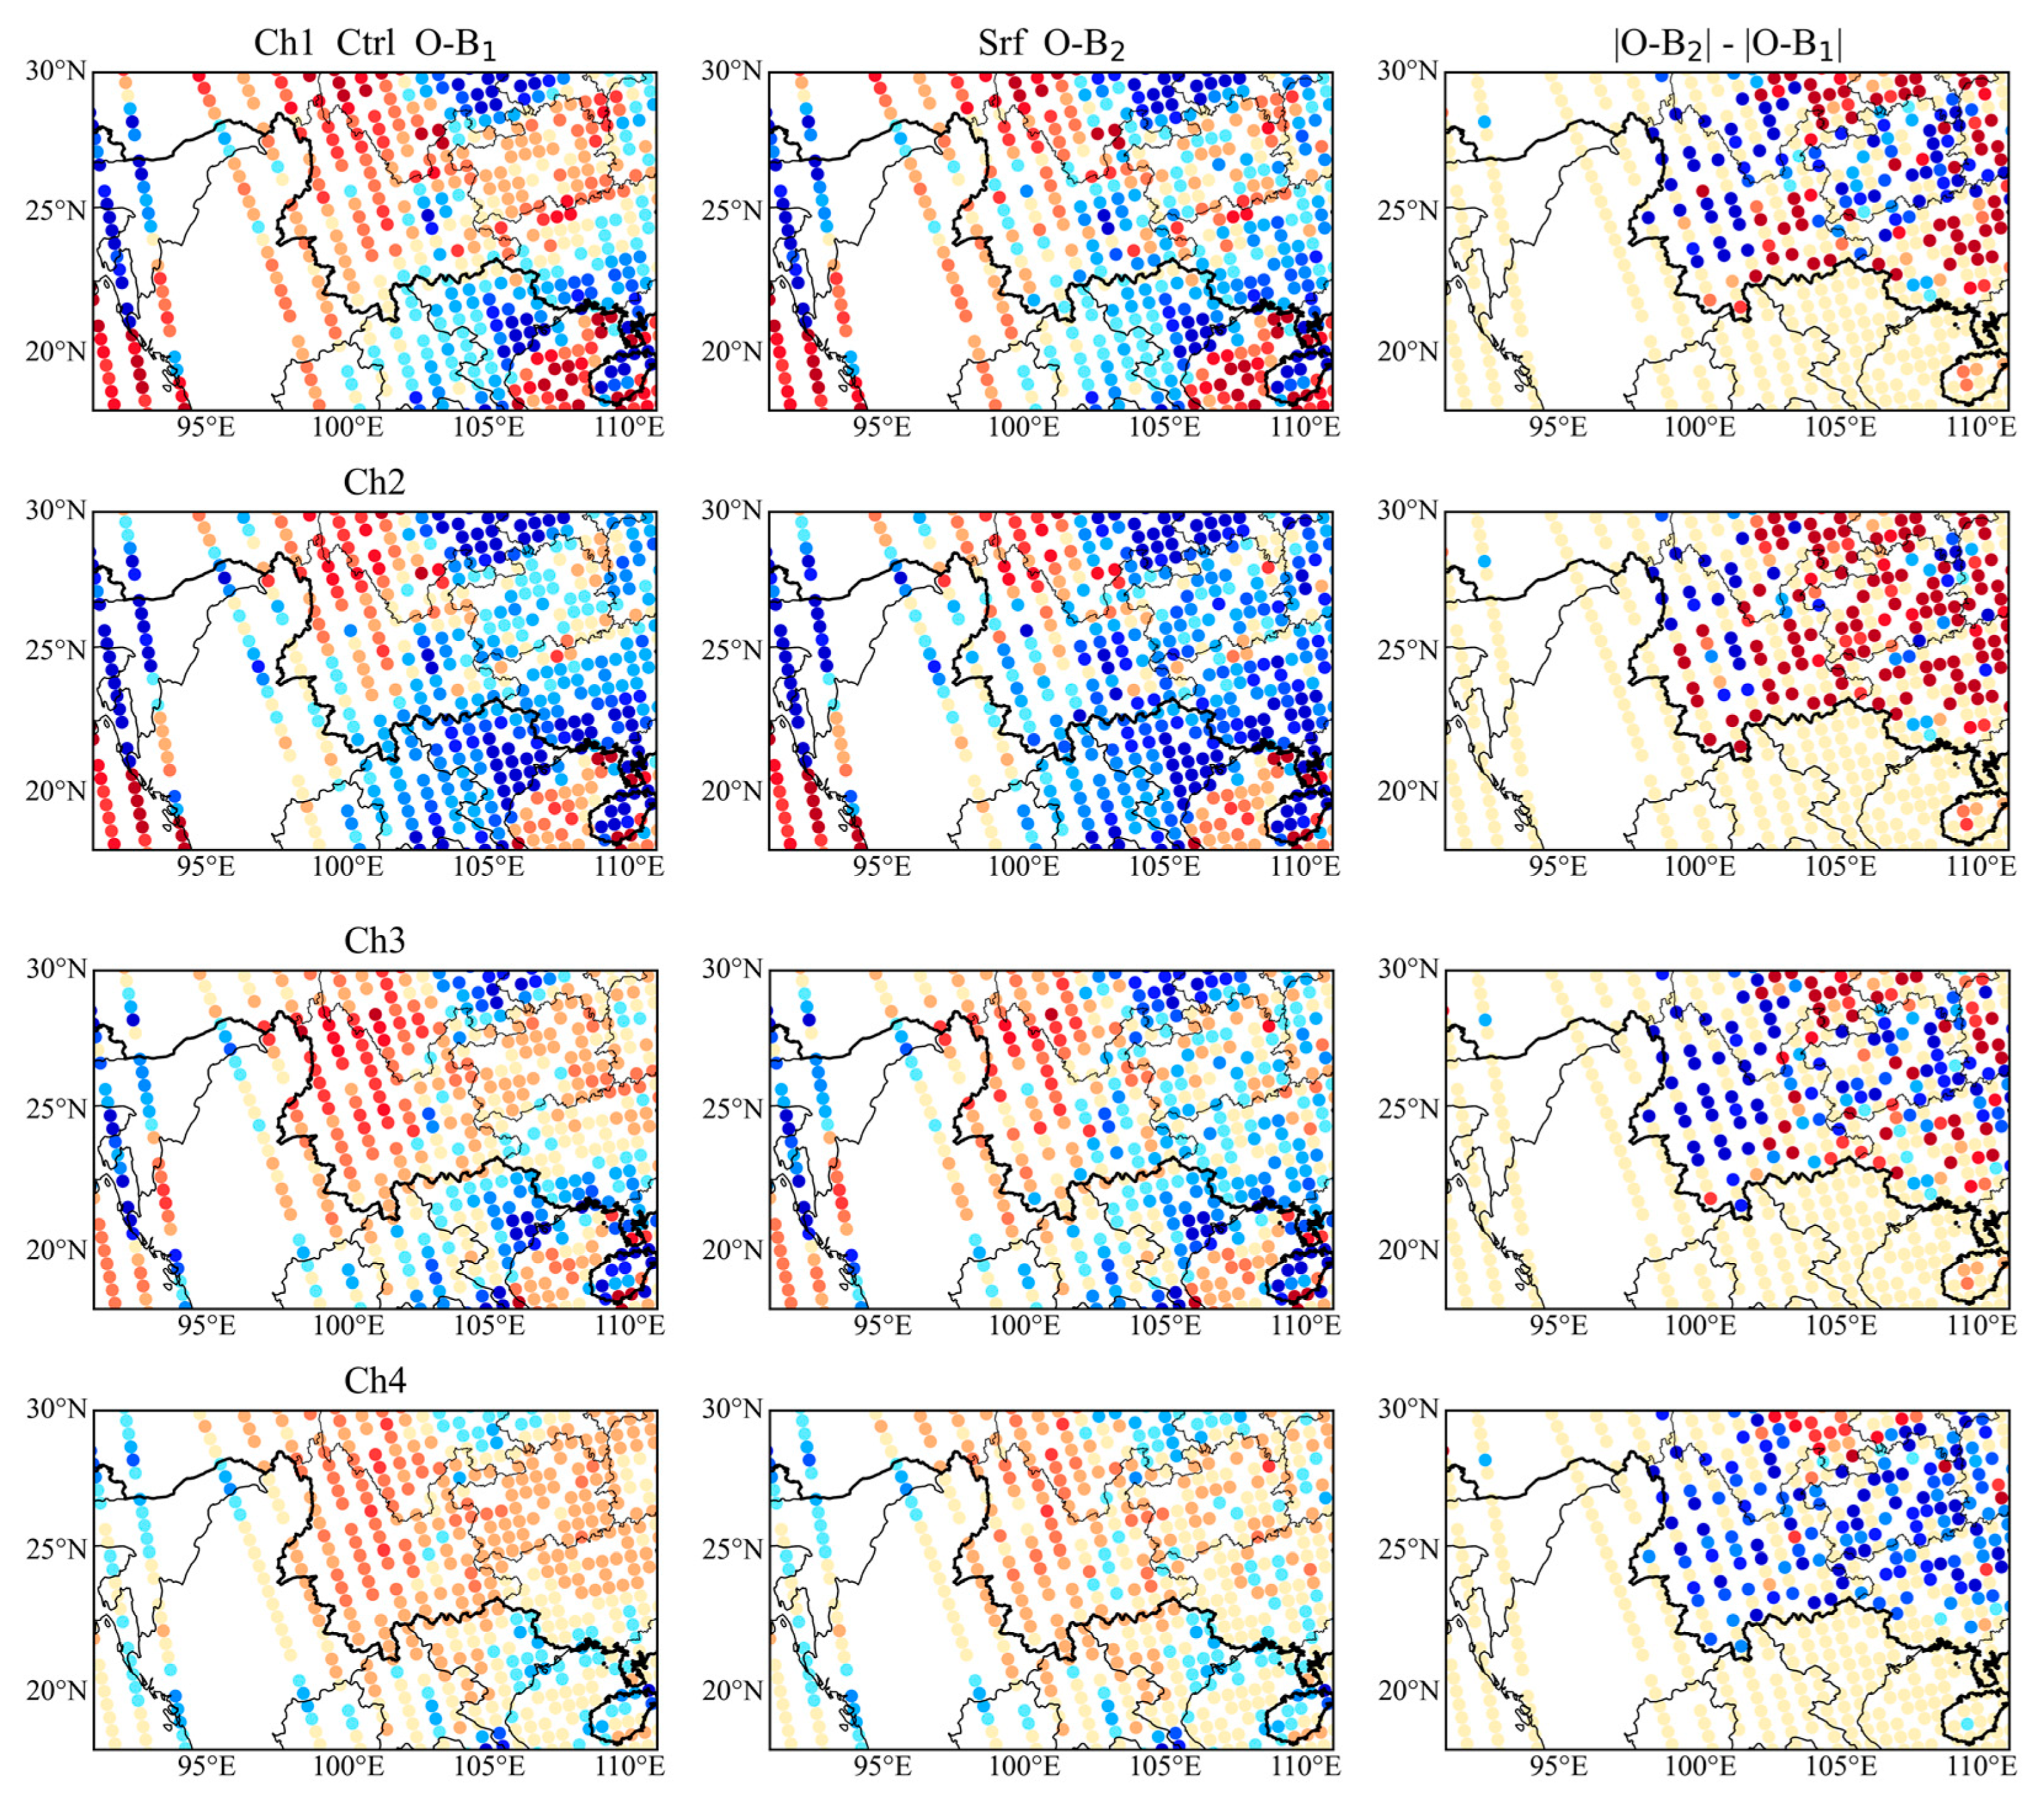
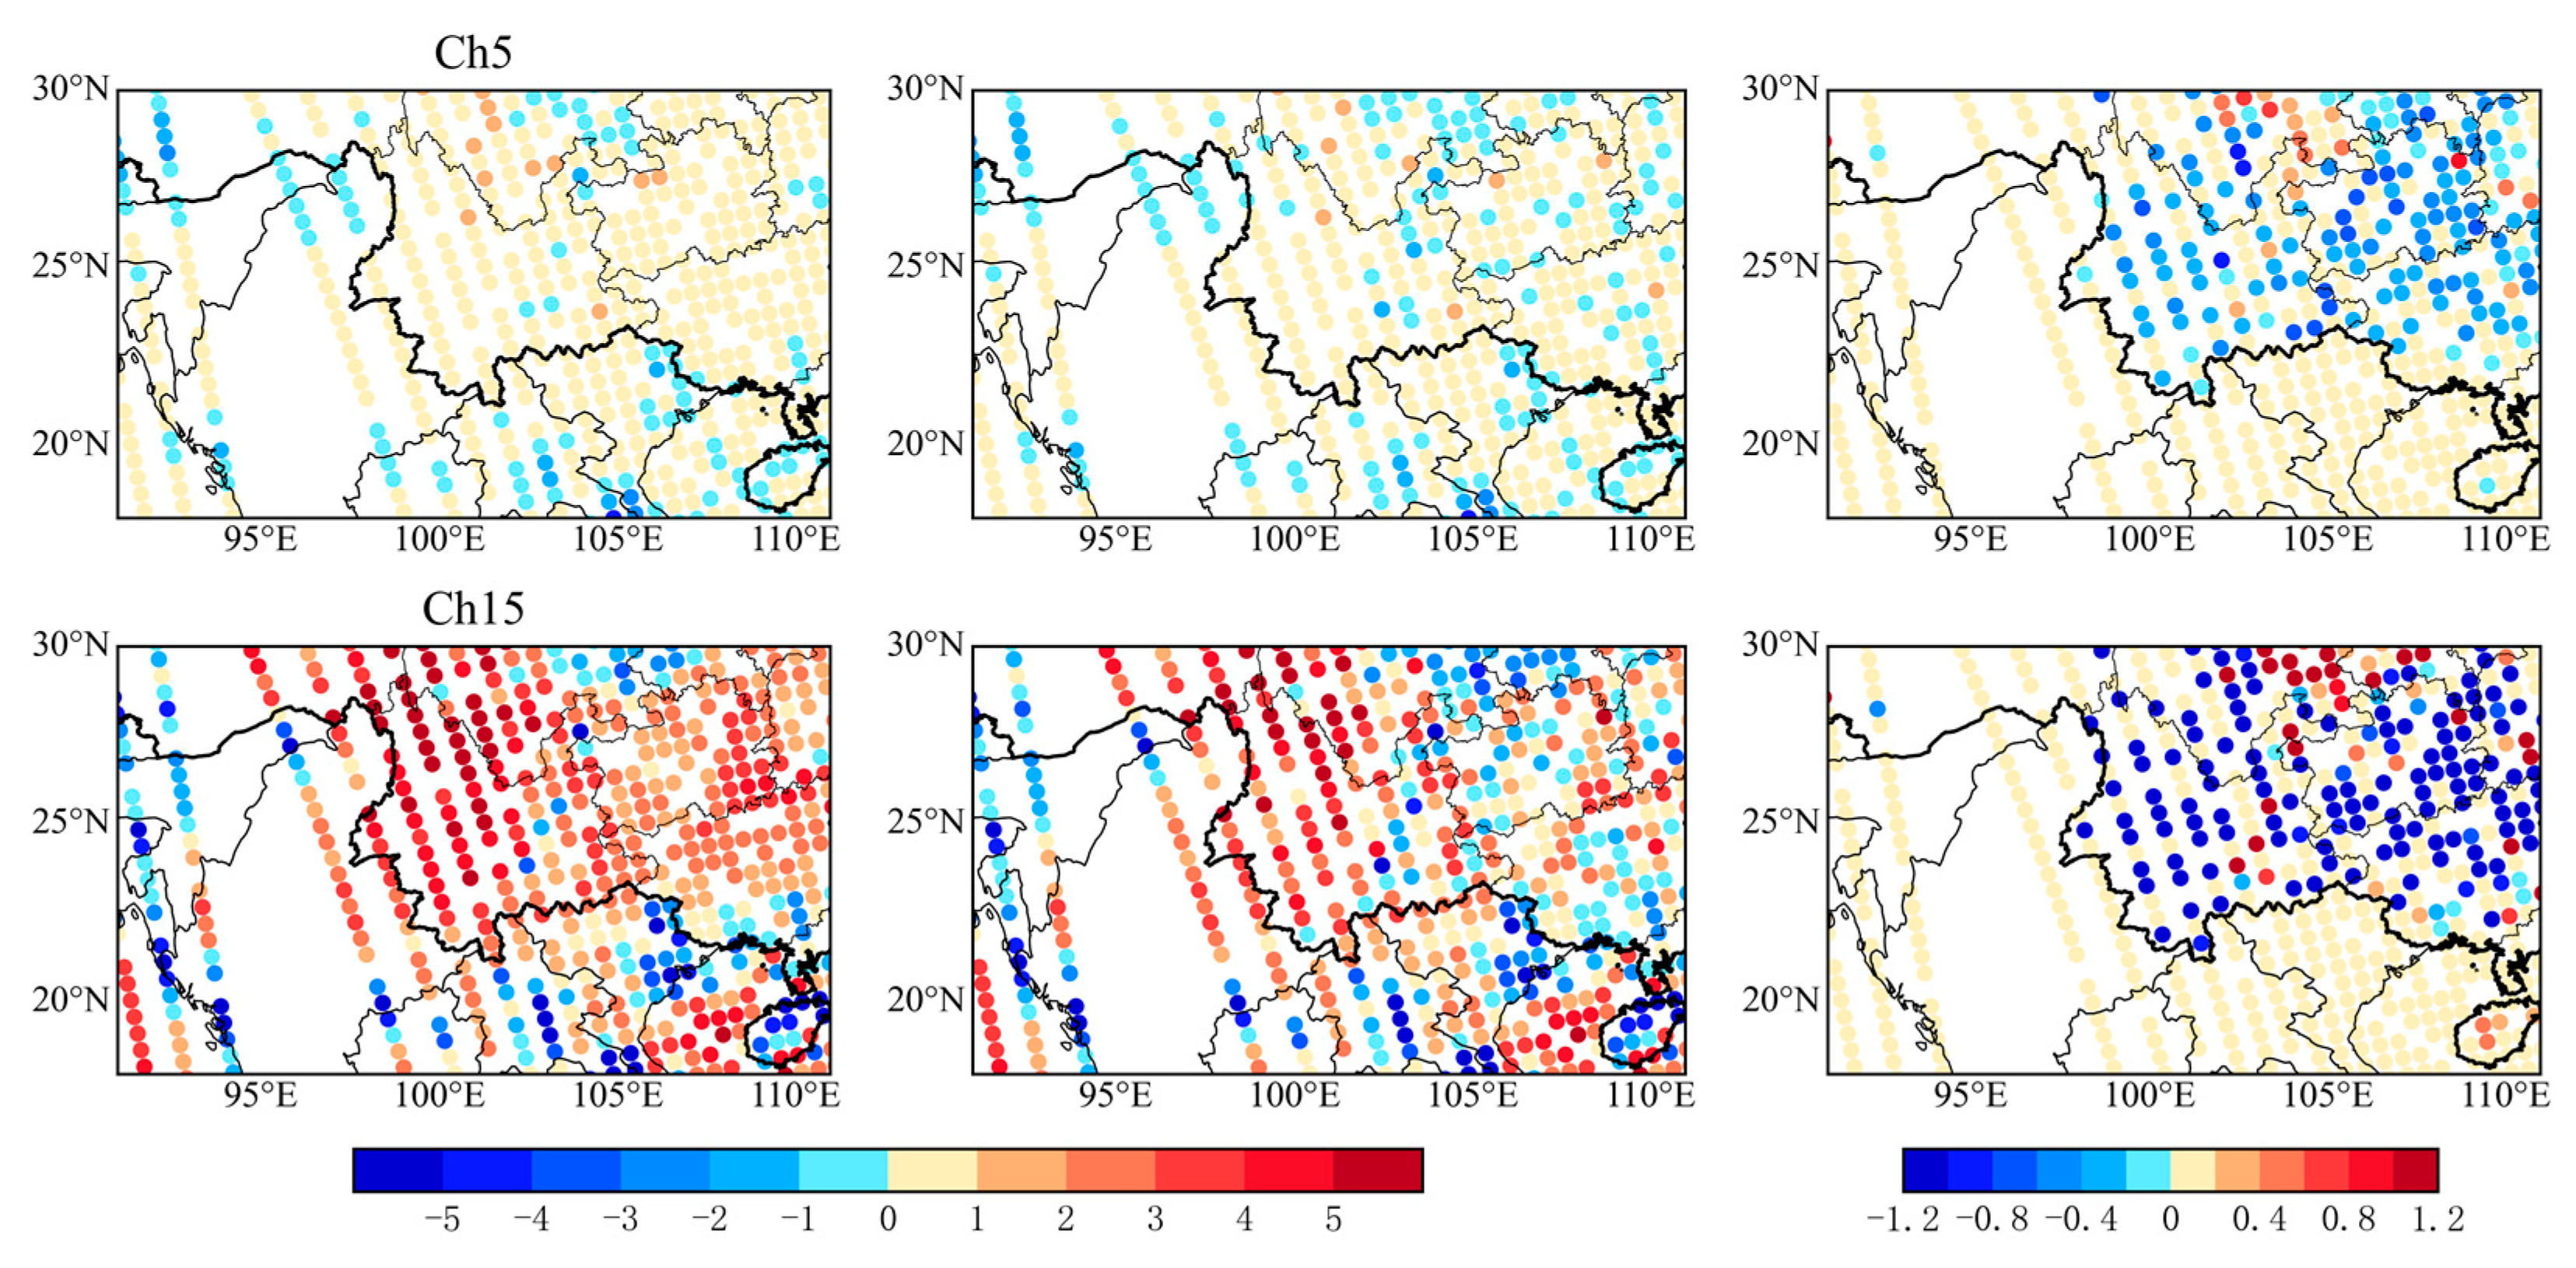
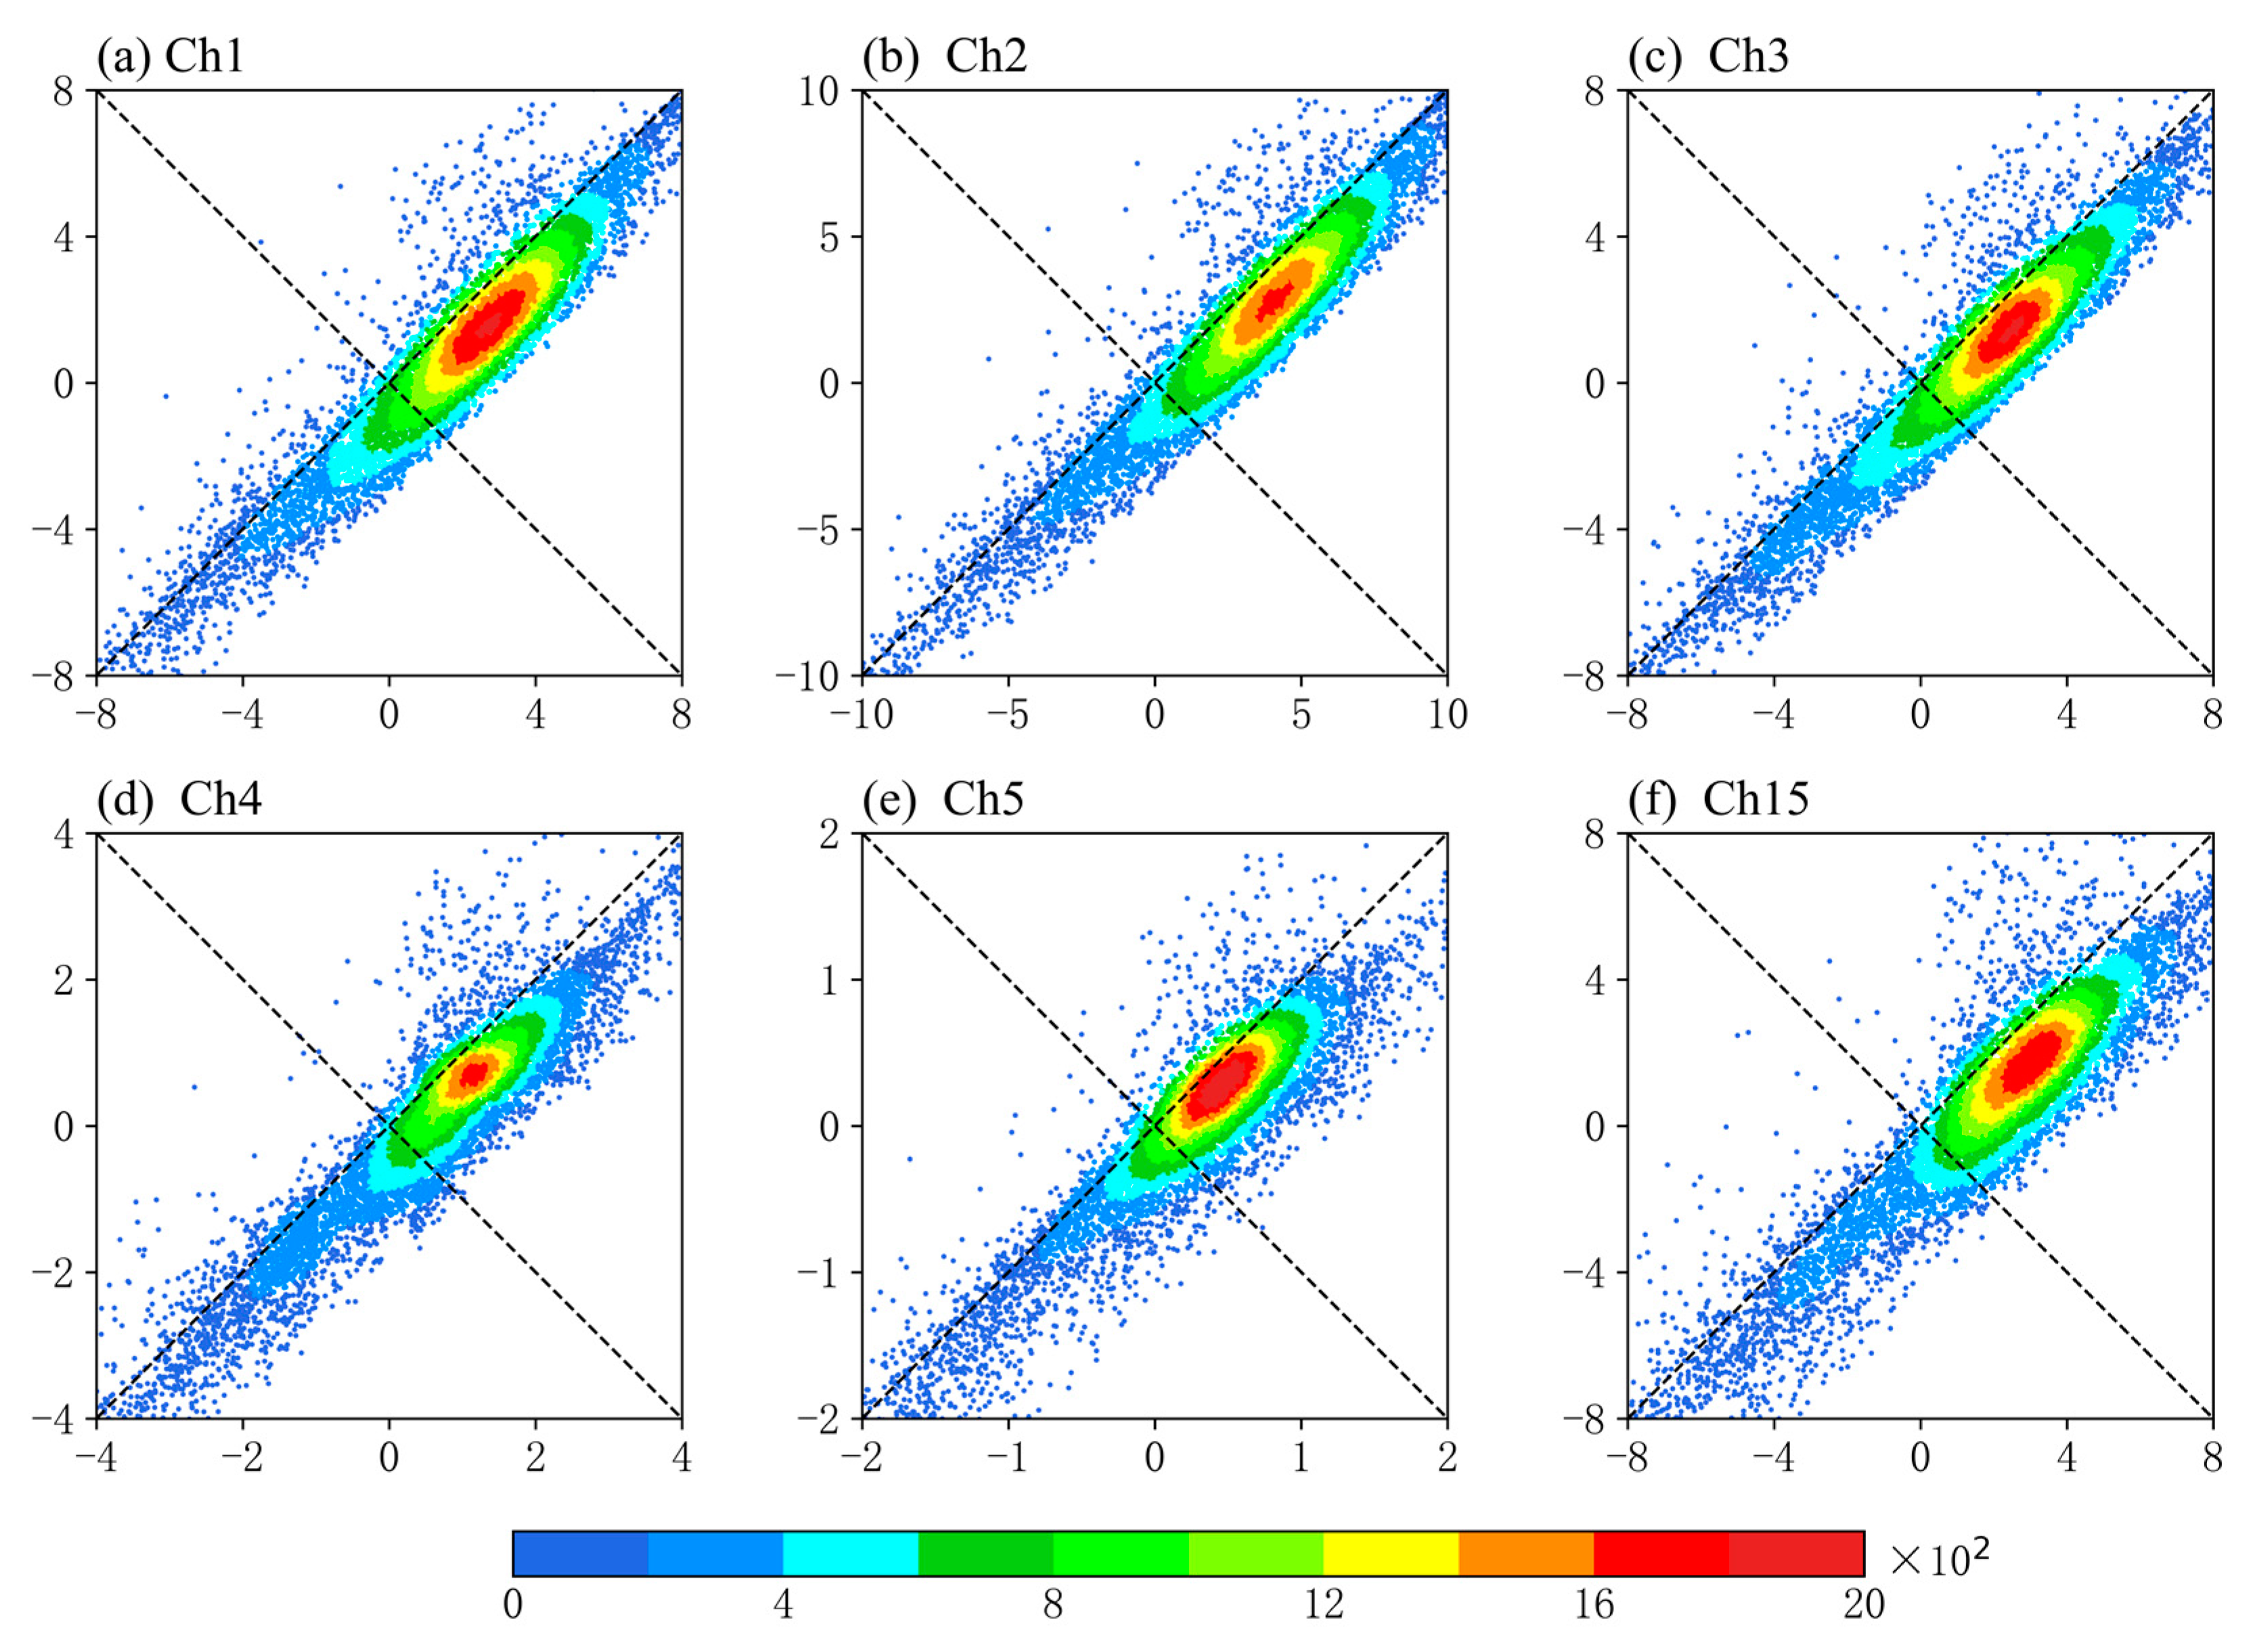
3.2. Effects of SKT on BT Simulation

SKT plays a decisive role in the BT simulation of AMSU-A low-level channels. The above analysis indicates that the SKT in the background field cannot accurately reproduce the values and variability of SKT, which can inevitably affect the BT simulation in low-level channels. In order to quantitatively access the influence of SKT on the BT simulation in the AMSU-A low-level channels, two sets of experiments were designed: a control experiment (Ctrl) and a sensitivity experiment (Srf). This study focuses on channels 1–3 and 15, where the weighting function peaks are at the surface, as well as channels 4 and 5, with weighting function peaks appearing at about 1000 hPa and 700 hPa, respectively. The experimental period lasted from 0000 UTC on 1 September 2021 to 1800 UTC on 15 September 2021.
The specific design of the experiment is presented in Table 1. In the control experiment, the initial field was entirely based on the 6 h forecast results of the WRF-ARW model. In the sensitivity experiment, the SKT observations from the matched AWS were used as the background SKT. Other variables, including the profiles of air temperature, specific humidity and pressure, and 2 m water vapor and 10 m wind fields, were the same as those in the Ctrl experiment.
In order to evaluate the impact of the AWS observations on the BT simulations, the BT bias (observation minus background, i.e., O–B) between the Ctrl and Srf experiments needs to be analyzed. Taking the NOAA-19 satellite data as an example, Figure 7 displays the spatial distribution of the O–B values from both the Ctrl and Srf experiments at channels 1–5 and 15 of the AMSU-A at 1200 UTC on 2 September 2021, as well as the absolute difference between them (|O–B|Srf–|O–B|Ctrl). Obviously, in channels 1–2, most of Southwest China shows positive values. This indicates that the BT simulation results of the Srf experiment deviate from the observations more than those of the Ctrl experiment, revealing a certain negative effect in terms of replacing the AWS data in these two channels. Although channel 3 shows negative values in Yunnan and Guizhou, a slight improvement can be found when considering the AWS data in the entire southwestern area. In terms of channels 4–5 and 15, the |O–B|Srf–|O–B|Ctrl values are negative in all areas except for the eastern part of Sichuan, indicating that the AWS data were able to considerably enhance the accuracy of the BT simulation in these three channels. Furthermore, as the weighting function peaks of the AMSU-A channels shift from the surface (channels 1–3) to 700 hPa (channel 5), the impact of SKT variation on the BT simulation gradually decreases, but it could still continue to improve steadily.
To ensure assimilation effectiveness, we performed a relatively stringent quality control procedure for the data assimilation system to eliminate suspicious data. Figure 8a provides the numerical volume of satellite observations retained after the GSI quality control process was carried out, and the AMSU-A data of the NOAA-15/18/19 and MetOp-A are included here. The Ctrl experiment had fewer observations in the AMSU-A window channels, particularly in channel 2, compared with the sounding channels. The replacement of the SKT with the AWS data resulted in a noticeable overall increase (approximately 30%) in data volume. Figure 8b shows the standard deviation of the O–B values from the Srf experiment for each channel after quality control. As presented in Figure 8b, the O–B standard deviations for each channel in the Srf experiment are remarkably smaller than those in the Ctrl experiment, indicating that the observation error was greatly reduced after replacing the SKT data from the AWS.
Figure 9 presents the scatter plots of the O–B values for the two sets of experiments in each channel after the quality control process was conducted in order to visually assess the impact of AWS observations on the BT simulation in AMSU-A low-level channels. To avoid the influence of systematic biases, independent bias corrections were initially applied to different channels by subtracting the respective O–B mean values. Most of the data points are concentrated below the dashed line y = x, indicating an overall reduction in the O–B of the BT after the replacement of the surface data. The scatter plots in Figure 9 are divided into four quadrants. Among them, the left and right quadrants have smaller O–B (|O–BSrf| < |O–BCtrl|) values, while the upper and lower quadrants exhibit larger values. The scatter for channels 3–5 and 15 is primarily clustered on the right quadrant, showing a significant decrease in the |O–B|. However, in channels 1–2, most of the scatter is concentrated in the lower quadrant. As window channels, AMSU-A channels 1 and 2 are influenced primarily by surface characteristics and slightly by upper-level atmospheric conditions. Thus, the errors of the simulated surface emissivity estimation may result in an increase in |O–B| after replacing AWS observations.
Notably, from Figure 8a, it can be seen that GSI quality control removed a large quantity of data, and channel 2 has the highest removal rate, amounting to approximately 85%. Since the current version of the GSI system primarily focuses on clear-sky radiance data assimilation, the quality control system eliminates a considerable number of observation data from cloudy areas. Considering the increasing importance of all-sky data assimilation as a research focus [44,45,46], this study also provides a separate comparison of the results for cloudy regions.
Figure 10 displays the scatter plots of the O–B values that failed the cloudy data detection section of the GSI quality control in the two experiments. It is notable that the O–B in each channel for cloudy areas shows a remarkable increase compared with that in clear-sky regions, and the O–B of some observation points in channel 2 is even less than −40 K. Scatter for channels 1–5 and 15 is prominently clustered in the right quadrant, indicating a marked improvement in the BT simulation for cloudy areas after bias correction. This result suggests that SKTs observed by AWSs facilitate all-sky data assimilation over land in AMSU-A low-level channels.

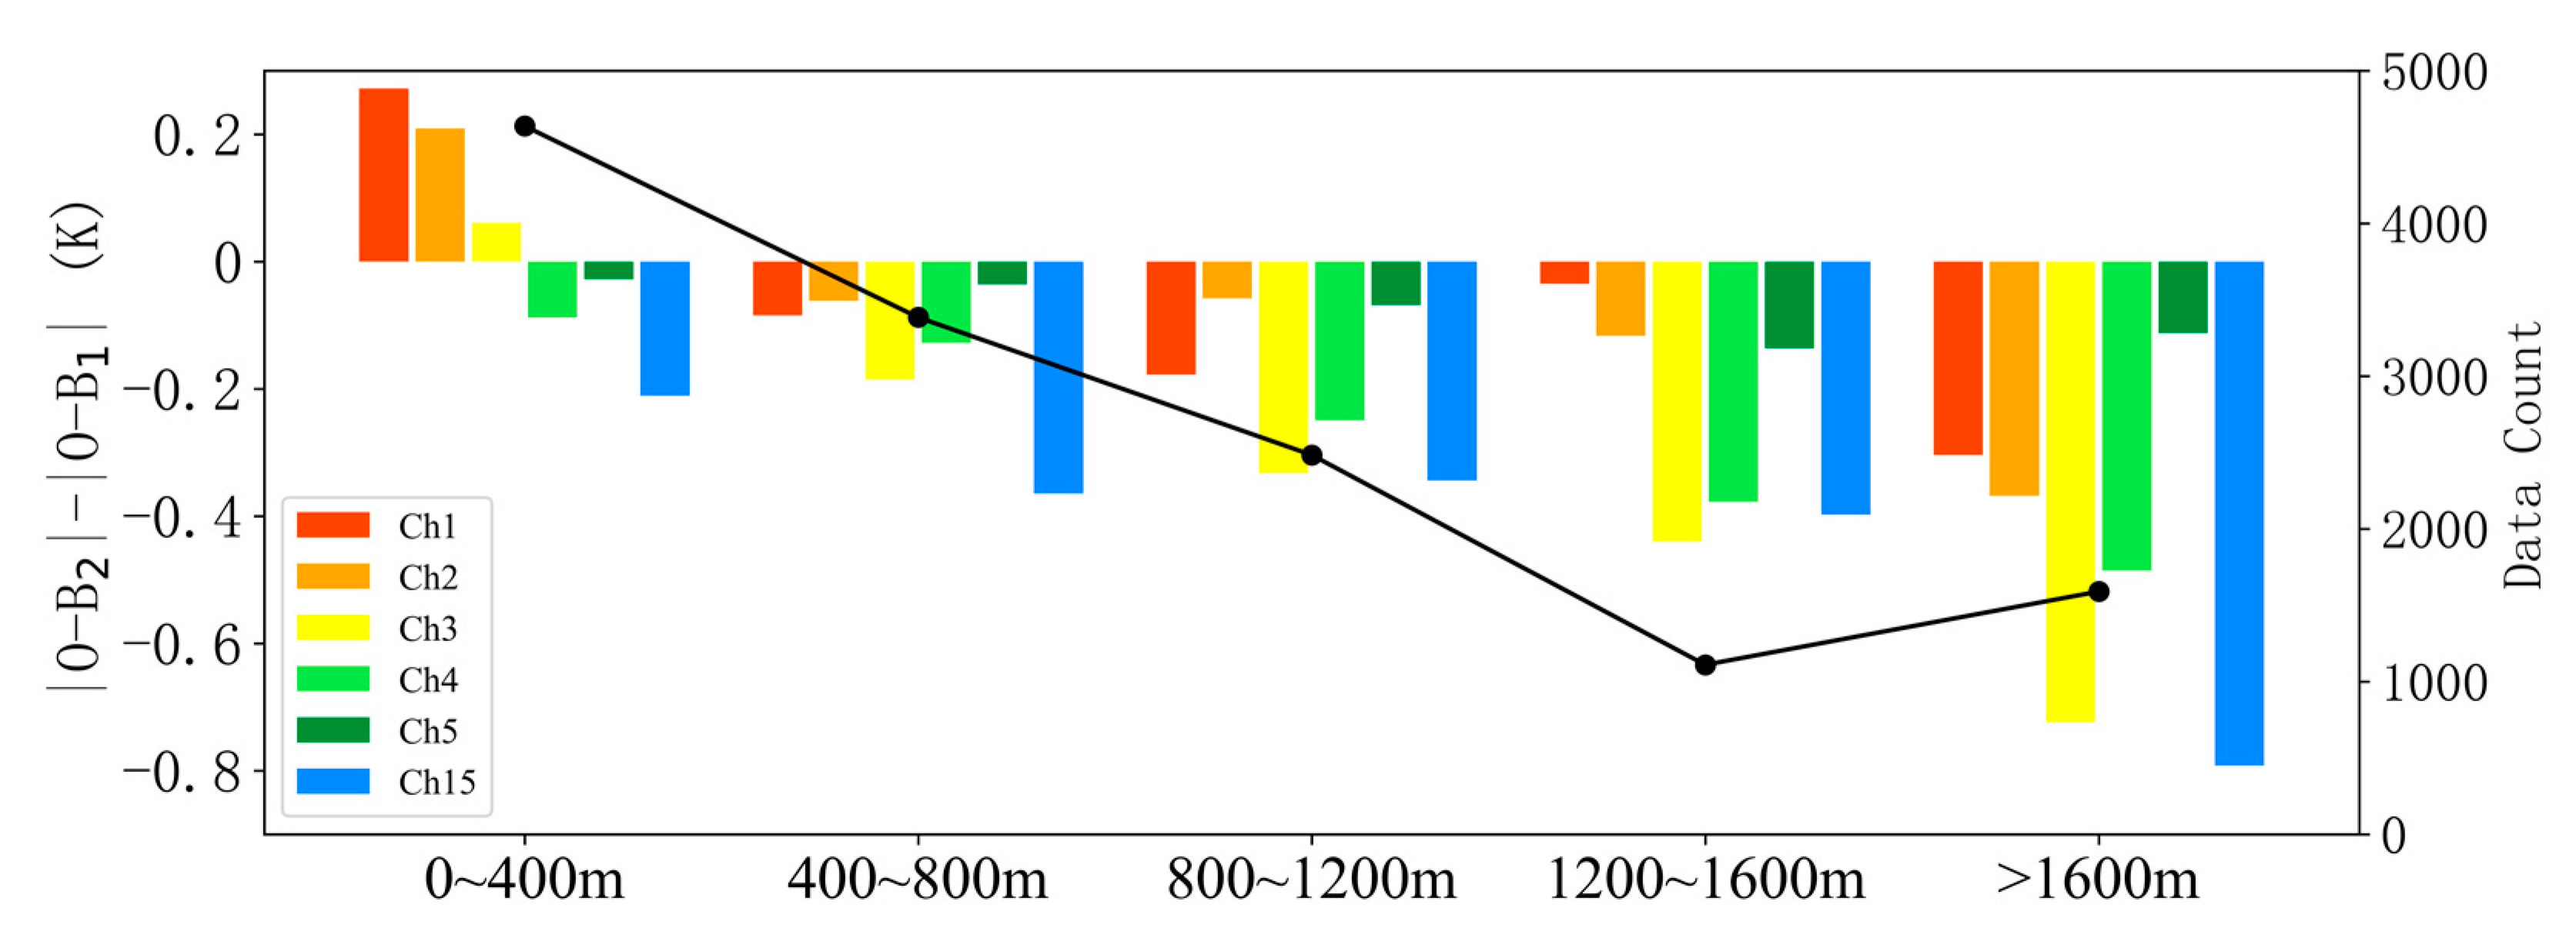
3.3. Impact of Terrain Elevation

Terrain elevation can influence surface features and the geometric relationship between the Sun, the Earth’s surface, and satellite sensors, thereby affecting the accuracy of BT simulation. Southwest China, with the Sichuan Basin at its core and bordered by the Tibetan Plateau to the west and the Yungui Plateau to the south, is one of the world’s most topographically diverse areas. Therefore, this section introduces the influences of the SKT on BT simulation at different terrain elevations in Southwest China.
Figure 11 shows the absolute difference of the O–B between the two experiments (|O–BSrf|–|O–BCtrl|) and the data volume at different terrain elevations. Different channels are indicated by different colors. It is noticeable that the majority of the observations are concentrated below 1200 m. For different terrain elevations, except for channels 1–3 in areas below 400 m, most channels show negative values for the |O–BSrf|–|O–BCtrl|, indicating the positive impact of the replacement of SKT data from AWSs. Furthermore, as the terrain elevation increases, the influence of SKT observations on the BT simulation gradually intensifies; this trend is most pronounced in the results of channels 3 and 4. Particularly, for areas with terrain elevations above 1600 m, almost all channels demonstrate a most pronounced improvement compared with the other areas below 1600 m. Although channel 5 exhibits relatively low variations at different terrain elevations, it shows a slight influence of terrain elevation on the BT simulation compared with the other channels. This could be attributed to a higher weighting function peak in channel 5 despite the overall improvement.

4. Discussion and Future Work

By substituting background SKT with observations from AWSs, this study enhances BT simulations for the low-level channels of AMSU-A, helping to successfully circumvent the negative impacts of inaccurate SKT simulation. This method exhibits a promising outlook for broader applications of data assimilation.
However, since model error varies with time, the direct replacement of the background field’s SKT may not adequately meet the practical assimilation needs. Therefore, it is essential to refine the collaborative assimilation method of AWS data and AMSU-A observations based on the actual variations in BT simulation accuracy over time. In addition, the impact of the SKT replacement method on actual assimilation and forecasting requires validation. Furthermore, the results in this study also suggest that SKTs observed by AWSs facilitate all-sky data assimilation over land in the AMSU-A low-level channels. Assessing the impact of the SKT replacement on the all-sky assimilation of AMSU-A data is also a noteworthy aspect in terms of future research.
It is worth noting that in this study, only SKT observations from AWS were included, without corresponding adjustments of surface emissivity, which could have had an impact on the evaluation. This limitation may result in less satisfactory results in window channels 1 and 2 in clear-sky conditions. At present, we do not recommend assimilation for these two channels in land areas. In future studies, we will incorporate the dynamic estimation of surface emissivity and focus on improving surface emissivity alongside SKT replacement to enhance the assimilation effect of AMSU-A data.
In order to avoid the impact of inaccurate precipitation forecasts on the evaluation results, we used data with a relatively short duration, and this is also an area that needs to be further strengthened. In future research, we will utilize longer periods of satellite data and AWS data to further validate the conclusions of this study under different weather conditions, thereby providing a more solid foundation for the collaborative assimilation research on satellite data and AWS data.

5. Conclusions

AMSU-A data have made a substantial contribution to NWPs by providing observation information on multi-layer atmospheric temperature, which significantly reduces forecast errors in operational numerical prediction systems. The accurate BT simulation of satellite data is a prerequisite for effective assimilation. However, SKT exhibits considerable complex spatio-temporal variations, resulting in noticeable deviations between simulations and actual observations of the BT over land areas. Thus, the data assimilation of low-level AMSU-A channels over land remains challenging. At present, China has fully implemented the automation of meteorological observations and is able to provide high-spatio-temporal-resolution real-time observation data. These data can be utilized to enhance the accuracy of BT simulation over land.
This study takes advantage of hourly observation data from Chinese AWSs obtained in September 2021. By replacing the background SKT in Southwest China with AWS observations, this study explores the ways in which SKT observations are used to improve AMSU-A BT simulation in land areas. The main conclusions are summarized as follows.
The SKTs observed by AWSs show a temporal variation pattern similar to that observed in the WRF-ARW model simulation results. However, the simulated SKT was consistently lower than the observations at different times and failed to represent the observed diurnal variations. Replacing background SKT with AWS observations led to a general increase in the volume of data passing GSI quality control in AMSU-A low-level channels, accompanied by reduced O–B standard deviations. Out scatter plots reveal that the utilization of AWS data brought about improvements in the AMSU-A BT simulations in channels 3–5 and 15 under clear-sky and cloudy conditions.
The improvement effects of AWS data on BT simulation were evaluated under various terrain elevations in Southwest China. The results indicate that as elevation increases, the impact of SKT observations on BT simulations gradually intensifies, and the improvements are more pronounced at elevations above 1600 m.
In summary, improving the accuracy of the SKT of the background based on AWS observations can provide a scientific and practical foundation for directly assimilating AMSU-A low-level channel data in land areas.

Author Contributions

Conceptualization, Z.Q.; data curation, Y.W.; formal analysis, Y.W.; funding acquisition, Z.Q. and J.L.; investigation, Y.W.; methodology, Y.W. and X.B.; project administration, Z.Q. and J.L.; resources, Y.W. and X.B.; software, Z.Q. and Y.W.; validation, Y.W. and Z.Q.; visualization, Y.W.; writing—original draft, Y.W.; writing—review and editing, Z.Q., Y.W. and J.L. All authors have read and agreed to the published version of the manuscript.

Funding

This research was jointly supported by the National Key Research and Development Program of China (2022YFC3004002), the National Natural Science Foundation of China (Grant No. 42375004), and the Fengyun numerical prediction and assimilation applications for ground application systems project (Grant No. FY-3(03)-AS-11.08).

Data Availability Statement

The NCEP FNL Analysis data were freely downloaded from https://rda.ucar.edu/datasets/ds083.2/ and accessed on 21 July 2023. Observations from the AMSU-A onboard polar-orbiting satellites were provided by NCEP GDAS Satellite Data, available at https://rda.ucar.edu/datasets/ds735.0/, accessed on 21 July 2023. The analytical results for this study have been uploaded to https://pan.baidu.com/s/1G8gdZgOoAYjkyBEzYbrl9w?pwd=fo5f, accessed on 21 July 2023.

Acknowledgments

The numerical calculations in this paper have been carried out on the supercomputing system in the Supercomputing Center of the Nanjing University of Information Science & Technology.

Conflicts of Interest

The authors declare no conflicts of interest.

References

  1. Bauer, P.; Thorpe, A.; Brunet, G. The quiet revolution of numerical weather prediction. Nature 2015, 525, 47–55. [Google Scholar] [CrossRef] [PubMed]
  2. Bouttier, F.; Courtier, P. Data Assimilation Concepts and Methods; Meteorological Training Course Lecture Series; European Centre for Medium-Range Weather Forecasts: Reading, UK, 2002; pp. 1–59. [Google Scholar]
  3. Kelly, G.; Thépaut, J. Evaluation of the Impact of the Space Component of Global Observing System through Observing System Experiment; ECMWF Publication: Reading, UK, 2007; pp. 327–346. [Google Scholar]
  4. Eyre, J.R.; English, S.J.; Forsythe, M. Assimilation of satellite data in numerical weather prediction. Part I: The early years. Q. J. R. Meteorol. Soc. 2020, 146, 49–68. [Google Scholar] [CrossRef]
  5. English, S.J.; McNally, A.; Niels, B.; Kirsti, S.; Marco, M.; Andras, H.; Michael, R.; Marta, J.; Michele, S.D.; Alan, J.G.; et al. Impact of Satellite Data. In Technical Memoradum ECMWF; ECMWF: Reading, UK, 2013; p. 46. [Google Scholar]
  6. English, S.J.; Renshaw, R.J.; Dibben, P.C.; Smith, A.J.; Rayer, P.J.; Poulsen, C.; Saunders, F.W.; Eyre, J.R. A comparison of the impact of TOVS and ATOVS satellite sounding data on the accuracy of numerical weather forecast. Q. J. R. Meteorol. Soc. 2000, 126, 2911–2931. [Google Scholar]
  7. Andersson, E.; Pailleux, J.; Thépaut, J.-N.; Eyre, J.R.; McNally, A.P.; Kelly, G.A.; Courtier, P. Use of cloud-cleared radiances in three/four-dimensional variational data assimilation. Q. J. R. Meteor. Soc. 1994, 120, 627–653. [Google Scholar]
  8. Derber, J.C.; Wu, W.-S. The use of TOVS cloud-cleared radiances in the NCEP SSI analysis system. Mon. Weather Rev. 1998, 126, 2287–2299. [Google Scholar] [CrossRef]
  9. Tomaso, E.; Bormann, N. Assimilation of ATOVS Radiances at ECMWF: First Year EUMETSAT Fellowship Report. In EUMETSAT/ECMWF Fellowship Programme Research Report 22; ECMWF: Reading, UK, 2010; p. 27. [Google Scholar]
  10. Bouchard, A.; Rabier, F.; Guidard, V.; Karbou, F. Enhancements of satellite data assimilation over Antarctica. Mon. Weather Rev. 2010, 138, 2149–2173. [Google Scholar] [CrossRef]
  11. Munchak, S.J.; Skofronick-Jackson, G. Evaluation of precipitation detection over various surfaces from passive microwave imagers and sounders. Atmos. Res. 2013, 131, 81–94. [Google Scholar] [CrossRef]
  12. Zou, X.; Qin, Z.; Weng, F. Impact of dawn-dusk satellite AMSU-A data on quantitative precipitation forecasts and the implications for three-orbit constellation. Chin. J. Atmos. 2016, 40, 46–62. (In Chinese) [Google Scholar] [CrossRef]
  13. Karbou, F.; Rabier, F.; Lafore, J.; Redelsperger, J.; Bock, O. Global 4DVAR assimilation and forecast experiments using AMSU observations over land. Part II: Impacts of assimilating surface-sensitive channels on the African monsoon during AMMA. Weather. Forecast. 2010, 25, 20–36. [Google Scholar] [CrossRef]
  14. Moradi, I.; Evans, K.F.; Mccarty, W. Assimilation of satellite microwave observations over the rainbands of tropical cyclones. Mon. Weather Rev. 2020, 148, 4729–4745. [Google Scholar] [CrossRef]
  15. Duncan, D.; Bormann, N.; Geer, A. All-sky Assimilation of AMSU-A Window Channels. In EUMETSAT/ECMWF Fellowship Programme Research Report 59; ECMWF: Reading, UK, 2022; p. 34. [Google Scholar]
  16. Li, J.; Zou, X. Impact of FY-3A MWTS radiances on prediction in GRAPES with comparison of two quality control schemes. Front. Earth Sci. 2014, 8, 251–263. [Google Scholar] [CrossRef]
  17. Kazumori, M.; English, S. Use of the ocean surface wind direction signal in microwave radiance assimilation. Q. J. R. Meteor. Soc. 2015, 141, 1354–1375. [Google Scholar] [CrossRef]
  18. Krzeminski, B.; Bormann, N.; Karbou, F.; Bauer, P. Towards a better use of AMSU over land at ECMWF. In Proceedings of the 16th International TOVS Study Conference, International TOVS Working Group, Angra dos Reis, Brazil, 7–13 May 2008; pp. 157–165. [Google Scholar]
  19. Bormann, N.; Fouilloux, A.; Bell, W. Evaluation and assimilation of ATMS data in the ECMWF system. J. Geophys. Res. Atoms. 2013, 118, 12970–12980. [Google Scholar] [CrossRef]
  20. Geer, A.; Lonitz, K.; Duncan, D.; Bormann, N. Improved Surface Treatment for All-Sky Microwave Observations; ECMWF Technical Memorandum 894; ECMWF: Reading, UK, 2022; p. 57. [Google Scholar]
  21. Wang, J.; Gong, J.; Wang, R. Estimation of background error for brightness temperature in GRAPES 3DVar and its application in radiance data background quality control. Acta Meteorol. Sin. 2016, 74, 397–409. (In Chinese) [Google Scholar]
  22. Sobrino, J.; Raissouni, N.; Li, Z. A comparative study of land surface emissivity retrieval from NOAA data. Remote Sens. Environ. 2001, 75, 256–266. [Google Scholar] [CrossRef]
  23. English, S. The Importance of Accurate Skin Temperature in Assimilating Radiances from Satellite Sounding Instruments. IEEE Trans. Geosci. Remote Sens. 2008, 46, 403–408. [Google Scholar] [CrossRef]
  24. Karbou, F.; Gérard, É.; Rabier, F. Microwave land emissivity and skin temperature for AMSU-A and -B assimilation over land. Q. J. R. Meteor. Soc. 2006, 132, 2333–2355. [Google Scholar] [CrossRef]
  25. Karbou, F.; Gérard, E.; Rabier, F. Global 4DVAR assimilation and forecast experiments using AMSU observations over land. Part I: Impacts of various land surface emissivity parameterizations. Weather Forecast. 2010, 25, 5–19. [Google Scholar] [CrossRef]
  26. Lonitz, K.; Geer, A.; Bormann, N. Towards Assimilating Surface Sensitive Microwave Channels over Land; EUMETSAT/ECMWF Fellowship Programme Research Report 58; ECMWF: Reading, UK, 2022; p. 23. [Google Scholar]
  27. Xing, D. The Study of Remote-Sensing Satellite Microwave Observation Data Assimilation Over Land; National University of Defense Technology: Changsha, China, 2019. (In Chinese) [Google Scholar]
  28. Xian, Z.; Chen, K.; Zhu, J. All-sky assimilation of the MWHS-2 observations and evaluation the impacts on the analyses and forecasts of binary typhoons. J. Geophys. Res. Atmos. 2019, 124, 6359–6378. [Google Scholar] [CrossRef]
  29. Bormann, N.; Lupu, C.; Geer, A.; Lawrence, H.; Weston, P.; English, S. Assessment of the Forecast Impact of Surface-Sensitive Microwave Radiances over Land and Sea-Ice; ECMWF Technical Memorandum 804; ECMWF: Reading, UK, 2017; p. 37. [Google Scholar]
  30. Zheng, W.; Wei, H.; Wang, Z.; Zeng, X.; Meng, J.; Ek, M.; Mitchell, K.; Derber, J. Improvement of daytime land surface skin temperature over arid regions in the NCEP GFS model and its impact on satellite data assimilation. J. Geophys. Res. 2012, 117, D06117. [Google Scholar] [CrossRef]
  31. Qin, Z.; Zou, X. Impact of AMSU-A data assimilation over high terrains on QPFs downstream of the Tibetan Plateau. J. Meteorol. Soc. Jan. Ser. II 2019, 97, 1137–1154. [Google Scholar] [CrossRef]
  32. Prigent, C.; Aires, F.; Rossow, W. Land surface microwave emissivity over the globe for a decade. Bull. Am. Meteor. Soc. 2006, 87, 1573–1584. [Google Scholar] [CrossRef]
  33. Fu, S.; Nie, S.; Luo, Y.; Chen, X. Implications of diurnal variations in land surface temperature to data assimilation using MODIS LST data. J. Geogr. Sci. 2020, 30, 18–36. [Google Scholar] [CrossRef]
  34. Eyre, J.R.; Bell, W.; Cotton, J.; English, S.J.; Forsythe, M.; Healy, S.B.; Pavelin, E.G. Assimilation of satellite data in numerical weather prediction. Part II: Recent years. Q. J. R. Meteorol. Soc. 2022, 148, 521–556. [Google Scholar] [CrossRef]
  35. Ma, X.; He, J.; Zhou, B.; Li, L.; Ji, Y.; Guo, H. Effect of variation quality control of Non-Gaussian distribution observation error on heavy rainfall prediction. Trans. Atmos. Sci. 2017, 40, 170–180. (In Chinese) [Google Scholar] [CrossRef]
  36. Wan, Z.; Li, Z. A physics-based algorithm for retrieving land-surface emissivity and temperature from EOS/MODIS data. IEEE Trans. Geosci. Remote Sens. 1997, 35, 980–996. [Google Scholar]
  37. Guedj, S.; Karbou, F.; Rabier, F. Land surface temperature estimation to improve the assimilation of SEVIRI radiances over land. J. Geophys. Res. Atmos. 2011, 116. [Google Scholar] [CrossRef]
  38. Jiménez-Muñoz, J.C.; Sobrino, J.A.; Skoković, D.; Mattar, C.; Cristóbal, J. Land Surface Temperature Retrieval Methods from Landsat-8 Thermal Infrared Sensor Data. IEEE Geosci. Remote Sens. Lett. 2014, 11, 1840–1843. [Google Scholar] [CrossRef]
  39. Prigent, C.; Jimenez, C.; Aires, F. Toward “all weather”, long record, and real-time land surface temperature retrievals from microwave satellite observations. J. Geophys. Res. Atmos. 2016, 121, 5699–5717. [Google Scholar] [CrossRef]
  40. Li, Z.L.; Wu, H.; Duan, S.B.; Zhao, W.; Ren, H.; Liu, X.; Leng, P.; Tang, R.; Ye, X.; Zhu, J.; et al. Satellite Remote Sensing of Global Land Surface Temperature: Definition, Methods, Products, and Applications. Rev. Geophys. 2023, 61, e2022RG000777. [Google Scholar] [CrossRef]
  41. Massart, S.; Bormann, N.; Bonavita, M.; Lupu, C. Multi-sensor analyses of the skin temperature for the assimilation of satellite radiances in the European Centre for Medium-Range Weather Forecasts (ECMWF) Integrated Forecasting System (IFS, cycle 47R1). Geosci. Model Dev. 2021, 14, 5467–5485. [Google Scholar] [CrossRef]
  42. He, J.; Zhang, M.; Wang, P.; Wang, S.; Wang, X. Climate Characteristics of the Extreme Drought Events in Southwest China during Recent 50 Years. Acta Geogr. Sin. 2011, 66, 1179–1190. (In Chinese) [Google Scholar]
  43. Kleist, D.T.; Parrish, D.F.; Derber, J.C.; Treadon, R.; Wu, W.-S.; Lord, S. Introduction of the GSI into the NCEP Global Data Assimilation System. Weather. Forecast. 2009, 24, 1691–1705. [Google Scholar] [CrossRef]
  44. Geer, A.J.; Baordo, F.; Bormann, N.; Chambon, P.; English, S.J.; Kazumori, M.; Lawrence, H.; Lean, P.; Lonitz, K.; Lupu, C. The growing impact of satellite observations sensitive to humidity, cloud and precipitation. Q. J. R. Meteorol. Soc. 2017, 143, 3189–3206. [Google Scholar] [CrossRef]
  45. Weston, P.; Geer, A.; Bormann, N. Investigations into the Assimilation of AMSU-A in the Presence of Cloud and Precipitation; EUMETSAT/ECMWF Fellowship Programme Research Report 50; ECMWF: Reading, UK, 2019; p. 42. [Google Scholar]
  46. Duncan, D.I.; Bormann, N.; Geer, A.J.; Weston, P. Assimilation of AMSU-A in All-Sky Conditions. Mon. Weather Rev. 2022, 150, 1023–1041. [Google Scholar] [CrossRef]
Figure 1. Spatial distribution of terrain elevations (unit: m) in Southwest China.
Remotesensing 16 00395 g001
Figure 2. Spatial distribution of SKT (unit: K) of the background at (a) 0000 UTC and (b) 1200 UTC on 2 September 2021.
Remotesensing 16 00395 g002
Figure 3. Flow chart of the original and modified data assimilation process in the GSI system.
Remotesensing 16 00395 g003
Figure 4. Spatial distribution of SKT (unit: K) observed by (a,c) AWS and (b,d) matched NOAA-19 observation points at 0000 UTC (upper panels) and 1200 UTC (lower panels) on 2 September 2021.
Remotesensing 16 00395 g004
Figure 5. Spatial distribution of (a,b) background SKT (unit: K) on the NOAA-19 observation points and (c,d) its difference (unit: K) with AWS observation at 0000 UTC (left panels) and 1200 UTC (right panels) on 2 September 2021.
Remotesensing 16 00395 g005
Figure 6. (a) Mean,(b) standard deviation (Std) and data volume values (solid lines in (b)) of the background SKT (red) and the AWS observations (blue) at satellite observation points at different times from 1 to 15 September 2021.
Remotesensing 16 00395 g006
Figure 7. Spatial distribution of O–B (observation minus background) values (unit: K) in experiment Ctrl (O–BCtrl, left column) and Srf (O–BSrf, middle column) experiments, and the |O–B| difference (unit: K) between two experiments (|O–B|Srf–|O–B|Ctrl, right column) at 1200 UTC on 2 September 2021.
Remotesensing 16 00395 g007aRemotesensing 16 00395 g007b
Figure 8. (a) Data volume and (b) O–B standard deviation (Std) for the Ctrl (red) and Srf (blue) experiments in AMSU-A channels 1–5 and 15 after GSI quality control.
Remotesensing 16 00395 g008
Figure 9. Scatter plots of the O–B values between the Ctrl (x axis) and Srf (y axis) experiments in AMSU-A channels 1–5 and 15. Only observations passing the GSI quality control are shown; colors indicate the data volume values.
Remotesensing 16 00395 g009
Figure 10. Same as Figure 9, except for data in cloudy areas.
Remotesensing 16 00395 g010
Figure 11. Histograms of the average |O–BSrf|–|O–BCtrl| in AMSU-A channels 1–5 and 15 at different terrain elevations. The circle marks indicate the data volume values at different terrain elevations.
Remotesensing 16 00395 g011
Table 1. Experiments design.
SKTOther Background Variables
CtrlWRF-ARW 6 h forecast resultWRF-ARW 6 h forecast result
SrfAWS observationWRF-ARW 6 h forecast result
Disclaimer/Publisher’s Note: The statements, opinions and data contained in all publications are solely those of the individual author(s) and contributor(s) and not of MDPI and/or the editor(s). MDPI and/or the editor(s) disclaim responsibility for any injury to people or property resulting from any ideas, methods, instructions or products referred to in the content.

