Article

SatellStitch: Satellite Imagery-Assisted UAV Image Seamless Stitching for Emergency Response without GCP and GNSS

Institute of Geospatial Information, The PLA Strategic Support Force Information Engineering University, Zhengzhou 450001, China
*
Author to whom correspondence should be addressed.
Remote Sens. 2024, 16(2), 309; https://doi.org/10.3390/rs16020309
Submission received: 31 October 2023 / Revised: 24 December 2023 / Accepted: 8 January 2024 / Published: 11 January 2024

Abstract

:
Rapidly stitching unmanned aerial vehicle (UAV) imagery to produce high-resolution fast-stitch maps is key to UAV emergency mapping. However, common problems such as gaps and ghosting in image stitching remain challenging and directly affect the visual interpretation value of the imagery product. Inspired by the data characteristics of high-precision satellite images with rich access and geographic coordinates, a seamless stitching method is proposed for emergency response without the support of ground control points (CGPs) and global navigation satellite systems (GNSS). This method aims to eliminate stitching traces and solve the problem of stitching error accumulation. Firstly, satellite images are introduced to support image alignment and geographic coordinate acquisition simultaneously using matching relationships. Then a dynamic contour point set is constructed to locate the stitching region and adaptively extract the fused region of interest (FROI). Finally, the gradient weight cost map of the FROI image is computed and the Laplacian pyramid fusion rule is improved to achieve seamless production of the fast-stitch image map with geolocation information. Experimental results indicate that the method is well adapted to two representative sets of UAV images. Compared with the Laplacian pyramid fusion algorithm, the peak signal-to-noise ratio (PSNR) of the image stitching results can be improved by 31.73% on average, and the mutual information (MI) can be improved by 19.98% on average. With no reliance on CGPs or GNSS support, fast-stitch image maps are more robust in harsh environments, making them ideal for emergency mapping and security applications.

Graphical Abstract

1. Introduction

Emergency mapping is known as the “eyes over the disaster area”, providing the first access to the latest video, imagery and various thematic maps of the scene. It plays an important role in understanding the situation and responding to the disaster. With the advantages of rapid response and low cost, an unmanned aerial vehicle (UAV) is able to observe the target area in real time and is widely used in all types of emergency mapping tasks [1]. However, UAV imagery is notable for its small image size and insufficient degree of overlap. Therefore, rapid and reliable stitching of imagery to produce large-format UAV fast-stitch maps is key to the effectiveness of UAV emergency mapping.
In emergency mapping scenarios, current image stitching strategies have some limitations. Aerial triangulation methods and traditional tools, such as Pix4Dmapper and Photoscan, are capable of stitching high-quality seamless orthophotos but require complex levelling at ground control points (GCPs). This is time-consuming and does not allow for emergency response. Strategies based on simultaneous localization and mapping (SLAM) [2,3,4] and inter-frame transformation [5,6,7,8,9,10] offer significant speed advantages but suffer from serious cumulative error problems. Currently, it typically relies on global navigation satellite systems (GNSS) and position orientation system (POS) for rectification and geographic coordinates acquisition [5,6], but this method is less reliable for emergency mapping tasks in extreme environments, such as GNSS denial. Another approach [7,8,9,10] is to minimize cumulative error through a keyframe selection strategy and multiple optimization strategies to achieve greater robustness. In addition, with the rapid development of deep learning, many researchers have attempted to use end-to-end deep neural networks to learn frame-to-frame transformation relationships to avoid error accumulation [11,12,13]. However, current algorithms based on deep learning can only take two images as input and are not able to process a sequence of drone images. The analysis shows that a fast and reliable framework for seamless stitching of UAV fast-stitch image maps is still worth investigating in emergency mapping scenarios.
High-precision orthorectified satellite imagery entails every pixel containing geo-coordinate information. Inspired by this, if image stitching is supported by establishing a matching relationship between UAV images and satellite reference images, not only can error accumulation be avoided, but the stitched products also have pixel-to-pixel corresponding absolute geographic coordinate information. Although in emergency response scenarios it is difficult to predict the location of the required satellite image and prepare the image data due to factors such as GNSS rejection and time constraints, satellite imagery is characterized by easy access to open data channels and rich sources. In emergencies, relevant emergency departments can be contacted to quickly assess the approximate region of the disaster or incident, and satellite imagery resources within that region can be obtained through various platforms such as the Internet, local government or mapping agencies. Under the condition that no CGPs and GNSS support are needed, the method has greater robustness and reliability, which well compensates for the limitations of most methods in emergency mapping scenarios.
However, in practice, influenced by factors such as UAV capture time, position and lens distortion, the overlap of adjacent UAV images is irregular, and there are large geometric and hue differences at the stitch boundary. This results in obvious gaps in the fast-stitch image map [14], which directly affects the visual interpretation value of UAV emergency mapping products. In order to obtain high-quality UAV fast-stitch maps and provide an effective geographic information guarantee for emergency mapping, it is necessary to perform seamless processing during image stitching. Image stitching seamless processing methods have been the object of more in-depth research, mainly divided into three kinds of ideas. We will introduce each of these methods below.

1.1. Optimal Stitch Line

The first idea is to avoid the generation of gaps, and the optimal stitch line method is one of the representative methods [15], such as the snake model [16], Dijkstra’s algorithm [17,18], the dynamic programming (DP) algorithm [19,20], graph cut algorithms [21,22] and ant colony optimization [23]. In addition, with the rapid development of deep learning convolutional neural networks (CNNs) over the last few years [24,25,26,27,28], Li et al. [29] proposed to combine the semantic segmentation information of CNNs [30,31] to calculate the difference and search for the optimal stitching seam. By constructing different calculation rules, this method automatically searches for a stitch seam with the minimum difference in the image overlap region, which can effectively avoid the generation of gaps and has been adopted by many commercial software [32]. However, this method has high requirements on the overlap between image frames and is not applicable in emergency response scenarios when the overlap between UAV image frames is very small.

1.2. Image Feature Information-Based Method

The second idea is to correct gaps, and the method based on image feature information is one of the representative methods [33,34]. The method is inspired by the formation of the gap. By analyzing the image characteristics of the region near the stitch boundary, a certain area on both sides of the gap is identified as the region of interest (ROI). An optimization function is constructed within the ROI to correct the pixel differences to achieve seamless stitching. Zhu. et al. [33] propose a forced correction method with a simple function that is easy to implement but has limited effect on the processing of images with large differences. Chen. et al. [34] enhance the function according to the visual characteristics of the human eye, which improves the ability to process color images.
These methods have the advantage of not being limited by the size of the image overlap area. They are also effective in the case of very small image overlaps and are robust to UAV image data with irregular overlaps between frames. However, to position gaps, existing methods require pixel-level coordinate computation and direction determination, which is cumbersome and difficult to respond to in real time. With the introduction of satellite reference image assistance, image alignment is able to obtain the absolute coordinates of each pixel, and the relationship between the front and rear frame boundaries is a known quantity.
Aiming at the limitations of the above methods, this paper designs a dynamic contour-based fusion ROI (FROI) adaptive extraction method, which makes full use of the boundary information and image contour features to achieve the direct accurate positioning of the gap. Without increasing the complexity of the algorithm, the efficiency is significantly improved.

1.3. Image Fusion

The third idea is to fuse gaps, and image fusion is one of the representative methods. It can be seen that the disparity optimization function in the image feature information-based method only supports smoothing in two fixed directions, horizontal and vertical. As the method does not take into account the fusion of information between frames, it is easy to lose detailed information in the image. The image fusion algorithm, on the other hand, achieves a smooth transition in hue and exposure by performing a weighted fusion process on all pixels in the overlapping region. This method is also not limited by the degree of overlap between frames and better preserves inter-frame information. The weighted averaging method [35] is a simple algorithm with short processing times. Szeliski [36] proposed a fade-in and fade-out fusion algorithm to achieve a natural transition of pixel gray values in overlapping regions, and a number of studies have been carried out by many scholars [37,38]. The above method is very effective when the geometric alignment accuracy is high (geometric stitching error within one pixel). However, in emergency response scenarios where the task content is random and complex, it is preferable to quickly obtain the image stitching map of the target area at the cost of an acceptable loss of accuracy to capture the real-time geographic dynamics. Therefore, due to a variety of factors, it is difficult to ensure that the geometric alignment accuracy of the image is within one pixel. If there is a large alignment error, the stitched image will be prone to ghosting, resulting in lower image quality.
To solve the ghosting problem caused by the above methods, Brown, M. et al. [39] applied the idea of multi-resolution to the smoothing process of image stitching and achieved good results in image fusion. Aslantas, V. et al. [40] compared the fusion effects of multi-resolution image fusion algorithms, such as the Laplacian pyramid, contrast pyramid, gradient pyramid and morphological pyramid, which showed that the Laplacian pyramid was more effective. The Laplacian pyramid fusion algorithm proposed by Burt, P.J. et al. [41] is a classical algorithm to deal with the exposure difference problem, which can achieve a smooth and uniform fusion effect. A large number of tools have been optimized and integrated based on the above algorithms, including OpenCV and Photoshop. However, this method may produce problems such as image blurring and quality degradation, and the processing of computer memory overhead is time-consuming. If the fusion process is only carried out in a certain range on both sides of the gap, it can effectively reduce the workload and improve the processing efficiency. Therefore, in this paper, the joint application of the image feature information-based method and image fusion methods is carried out. It is also designed to introduce the gradient weight cost map to optimize the traditional Laplace pyramid fusion algorithm, taking into account the high quality and efficiency of image stitching in emergency response scenarios.
Based on the above analyses, most of the current image stitching seamless processing methods have higher requirements for the overlap between image frames and alignment accuracy, which seriously affects the production and application of emergency mapping image products. Against this background, this paper comprehensively considers the quality and efficiency of UAV image stitching and proposes a seamless stitching strategy for UAV fast-stitch maps in emergency response with the assistance of satellite imagery. With the aim of eliminating gaps, a dynamic contour-based FROI adaptive extraction method is designed to solve the problem of direct and fast positioning of gaps. The gradient weight cost map is introduced to optimize the traditional Laplacian image fusion method, and the quality of the stitched image is effectively enhanced. Under the condition that the position parameter information, such as GCPs and GNSS, is not required, the seamless fast-stitch image map with geolocation information can be automatically outputted. The main contributions of the method proposed in this paper are as follows:
  • Using high-precision satellite imagery without the need for GCP and GNSS support overcomes the problem of error accumulation in traditional image stitching strategies and achieves absolute positioning and fast stitching of UAV images;
  • A dynamic fast positioning and elimination method of gap is proposed. It breaks through the technical bottleneck that the effect of the traditional seamless processing method is limited by the degree of overlap between frames and alignment accuracy and improves the quality of stitched images.
The rest of the paper is structured as follows: Our method for the seamless stitching of UAV fast-stitch image maps is described in Section 2, the experimental results are given in Section 3 and the discussion is given in Section 4. Finally, conclusions are given in Section 5.

2. Methodology

We design a method for UAV fast-stitch image maps assisted by satellite reference images, which avoids the problem of image drift and distortion caused by the accumulation of errors in the traditional stitching strategy. Without relying on positional information, such as GCPs and GNSS, the incremental output of UAV fast-stitch image maps with geographic coordinates is achieved. The process of stitching technology is shown in Figure 1.

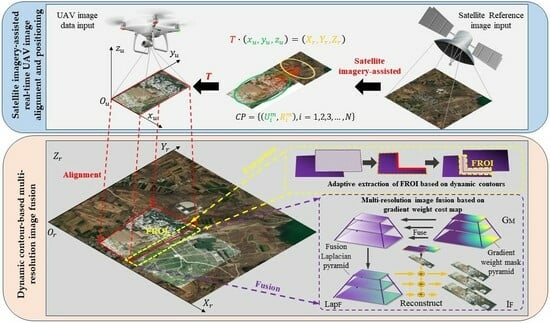
2.1. Satellite Imagery-Assisted Real-Time UAV Image Alignment and Positioning

To ensure the quality and efficiency of UAV fast-stitch image maps for emergency response, the reliability and real-time nature of image alignment are critical. The introduction of satellite imagery to support rapid alignment and stitching eliminates the accumulation of errors without the need for levelling iterations. At the same time, absolute positioning can be achieved through direct acquisition of geographic coordinates. The schematic diagram of satellite imagery-assisted real-time UAV image alignment and positioning is shown in Figure 2.
Firstly, using the highly accurate orthorectified satellite image as a reference, the UAV image is subjected to feature extraction and matching with the satellite imagery on a frame-by-frame basis. Given the differences between UAV and satellite imagery [42,43], the feature extraction was performed using the self-supervised framework SuperPoint [44], which has better real-time performance and stronger generalization ability. Feature matching is performed with SuperGlue [45], an algorithm based on a graphical neural network that mimics human vision to create an attention mechanism to identify features and compute the optimal match through an optimal transfer problem.
After each frame of the UAV image is successfully matched with the satellite imagery, the alignment transformation model is computed based on the corresponding multiple matching point pairs to realize the conversion of the UAV image coordinate space to the satellite image coordinate space. The pair of matching points obtained by the feature matching between the UAV image frame m and the satellite reference image is defined as C P = U i m , R i m ,   i = 1 ,   2 ,   3 ,   ,   N , where U i m = x u , y u , z u and R i m = X r , Y r , Z r denote the matching points on the UAV image frame and the satellite reference image, respectively. Then the transformation model from the UAV image to the satellite reference image at this time can be obtained as T R H × W × 2 , satisfying T x u , y u , z u = X r , Y r , Z r . Common transformation models T include perspective transformation models, polynomial models, etc.
In this part of the method, each frame of the UAV image alignment is an independent operation, and the frames do not affect each other, allowing synchronization of image data input and processing. In emergency response scenarios, incremental real-time stitching is typically used with frame-by-frame image data input. In addition, the stitching quality is not limited by the degree of image overlap, which avoids the matching difficulties and alignment errors caused by the lack of inter-frame overlap in the traditional method.
However, due to imaging characteristics, hue and exposure differences between UAV image frames are unavoidable, and pixel gray values are rearranged during the image alignment process. Therefore, after the satellite imagery-assisted rapid alignment, obvious gaps will be formed at the stitching boundary of the UAV images, which need to be further smoothed using the methods proposed in Section 2.2 and Section 2.3.

2.2. Adaptive Extraction of FROI Based on Dynamic Contours

2.2.1. Dynamic Contour-Based Geometric Positioning of the Stitching Area

To meet the real-time requirements of UAV fast-stitch maps, the strategy developed in Section 2.1 uses frame-by-frame incremental stitching. However, significant gaps in the stitched areas often require further processing as pixels are rearranged during the image rectification process. The usual method [15,16,17,18,19,20,21,22] is to re-segment the image by solving the difference optimization function for the overlapping region of the image, but the segmentation quality of this method is limited by the degree of overlap between frames and the accuracy of the alignment. At the same time, it ignores the information about the boundaries of the front and back frames. The external contour of the image is a high-level feature, independent of low-level features, such as grayscale and texture, and is much more robust. Therefore, by using the boundary contour information and the dynamically updated inter-frame boundary relationship, we can directly localize the gaps and use them as stitching area localization lines. This can produce good visual effects without increasing the complexity of the algorithm. The steps are as follows:
  • Region initialization. Assign the region using the position information obtained from the alignment. The pixels in the overlapping area are judged according to the inter-frame boundary relationship, and the pixels are assigned a value of 0 to obtain the boundary contour polygon area;
  • Contour point set extraction. The initialized polygon area is binarized and geometrically analyzed to extract a set of contour points including the gap boundary points, which can be expressed as
    C l = i = 1 n C l p i d l = i = 1 n C b p i + C s p i d l
    where C l indicates the set of extracted contour points, p i indicates the contour line point, C b p i and C s p i represent the non-gap and gap parts of the boundary contour, respectively and d l represents the integration along the boundary contour;
  • Dynamic geometric positioning. The acquired set of contour points C l is aligned with the image frames to be stitched, and the gaps C s are positioned directly according to the boundary geometry. This process is repeated for each frame to be stitched to achieve dynamic and fast positioning of the stitched area between frames.

2.2.2. Adaptive FROI Extraction

After the stitching area positioning, the positioning line is the red solid line segment O 1 O 2 O 3 as shown in Figure 2. I u i 1 and I u i indicate the stitching of two adjacent images, respectively, and I o indicates the image overlap area. There are often hue and brightness jumps in the adjacent two images that need to be fused and smoothed due to the independent capture environment of each frame. Conventional methods usually process the entire overlapping area I o . This increases the computational complexity of the fusion and the risk of losing image detail information. In contrast, the need for uniform hue and exposure can be better met by fusing only in the outer rectangular area extending on either side of the localization line since hue differences are usually most pronounced near this line.
Define ξ as the width of the outer rectangle; the smaller ξ , the less processing required for the fusion and the better the real-time performance; the larger ξ , the larger the hue smoothing interval and the stronger the fusion effect. In order to take into account the real-time and image quality of the UAV fast-stitch image map, the width Δ ξ needs to be determined adaptively according to different inter-frame situations to delineate the FROI. The FROI and related details are shown in Figure 3.
Because of the UAV’s capture characteristics, the overlap between frames is irregular and dynamically changing. To achieve a natural and uniform visual effect, the more overlap there is, the wider the fusion smoothing interval required under certain conditions of hue and exposure difference. Therefore, in this paper, the solution of the adaptation factor Δ ξ is based on the dynamic change of overlap between frames. Under the premise of ensuring the fusion effect, the fusion workload is reduced as much as possible to improve the image stitching efficiency. The steps for solving the adaptation factor Δ ξ are as follows:
  • The coordinates of the four image corner points are obtained using the matching relationship established with satellite reference images. By means of boundary intersection, the adjacent image boundary intersection O c ( c = 0, 1, …, n ) is obtained, where n is the number of boundary intersection points;
  • The area of the single image S u and the area of the overlapping area between adjacent images S o are calculated separately. The formula for calculating the area is given as follows:
    S = 1 2 j = 1 k 1 ( x j y j + 1 x j + 1 y j )
    where x j ( j = 0, 1, …, k 1 ) and x j + 1 ( j = 0, 1, …, k 1 ) is the horizontal coordinate of the adjacent corner point, y j ( j = 0, 1, …, k 1 ) and y j + 1 ( j = 0, 1, …, k 1 ) is the vertical coordinate of the adjacent corner point, and k is the number of corner points;
  • Solve for the degree of overlap between adjacent images, which is calculated as follows:
    θ = S o S u i
    where S u i is the area of the ith image to be stitched. Since the stitching method uses incremental stitching, in practice the previous frame of the stitching is the group of images, so for simplicity, the overlap solution is based directly on the area of the image to be stitched;
  • Solve for the adaptation factor Δ ξ based on θ . The formula is as follows:
    Δ ξ = m a x ( x o c + 1 x o c ) , ( y o c + 1 y o c ) × θ
    where x o c ( c = 0, 1, …, n ) and x o c + 1 ( c = 0, 1, …, n ) are the horizontal coordinates of the corner points adjacent to the image overlap region I o , and y o c ( c = 0, 1, …, n ) and y o c + 1 ( c = 0, 1, …, n ) are the vertical coordinates of the corner points adjacent to the image overlap region I o . The adaptive factor Δ ξ is solved by taking the maximum overlap length in the fore-and-aft overlap and side overlap, ensuring that it can meet the fusion requirements in both directions at the same time.

2.3. Multi-Resolution Image Fusion Based on Gradient Weight Cost Map

2.3.1. Gradient Weight Cost Map Calculation

To achieve a seamless visual effect of the UAV fast-stitch image map, the hue and exposure differences within the FROI extracted also need to be smoothed using the image fusion algorithm. Since UAV sequence images are usually center-projected images, the closer the image is to the center of projection, the less the projection distortion and the better the image quality. Thus, to make the image results retain richer image details and further improve the performance of the fusion algorithm, this paper constructs an image gradient weight cost map based on the image characteristics of the center projection. We calculate the distance between each pixel within the FROI and the background (the region containing no valid image information is defined as Ω 1 ), and pre-process the pixels in the FROI by weighting them in the following steps:
  • Image binarization processing. The image to be fused is converted to HSV color space, and the HSV threshold is extracted by an adjuster to decide on the trade-off of image information to obtain a binary image on a two-dimensional plane. This binary image can be considered to contain only two types of pixels: the target (the region containing the valid image information is defined as Ω 2 , where the FROI region is defined as Ω 3 , Ω 3 Ω 2 ) and the background, where the target pixel value is set to 255 and the background pixel value is set to 0. The formula for the binarization process is as follows:
    p i , j = 255           p i , j Ω 2 0                     p i , j Ω 1
  • Noise reduction filtering. Noise reduction is completed by using a Gaussian filter to process the noise points that appear after the image binarization processing;
  • Distance transformation calculation. The distance of each non-zero pixel in the image from its own nearest zero is calculated using the distance transformation function as shown in Figure 4. At this time, the gray value in the pixel represents the distance between the pixel and the nearest background pixel. Common distance transformation functions are as follows:
    D p ( i , j ) = ( x i x b i ) 2 + ( y j y b i ) 2
    where ( x b i , y b i ) is the nearest background pixel; i.e., ( x b i , y b i ) Ω 1 ; ( x i , y j ) is the target pixel within the FROI, and ( x i , y j ) Ω 3 , D p ( i , j ) is the distance factor of pixel p ( i , j ) . The schematic diagram of D p ( i , j ) is shown in Figure 5;
  • Weight normalization. The distance grayscale map obtained from the calculation is normalized; i.e., the distance value is replaced by a pixel value to achieve a smooth transition of the pixel value within the stitching seam [ 0 , Δ ξ ] , to obtain a gradient weight cost map of the image to be fused. The normalization process is as follows:
    ρ i , j = φ i , j , Δ ξ p i , j = [ 1 log Δ ξ ( D p + 1 ) ]   p i , j
    where ρ i , j is the normalized pixel weight, φ i , j , Δ ξ is the weight function, and a graph of the weight function is shown in Figure 6. The larger the value of Δ ξ , the smoother the trend of the weights. φ is determined by both the distance factor D p and the adaptive factor Δ ξ , making the weights suitable for both limiting image detail loss and eliminating exposure differences. A schematic diagram of the normalized weight result is shown in Figure 7.

2.3.2. Improved Multi-Resolution Pyramid Fusion

The traditional Laplacian pyramid image fusion algorithm decomposes the target image into different spatial frequency bands, and the fusion process is performed in each spatial frequency layer separately. It can effectively eliminate ghosting caused by misalignment, effectively eliminate stitching gaps and achieve natural and smooth visual effects. The most critical aspect of the multi-resolution image fusion algorithm is the selection and design of the mask, which is the determination of the image fusion weighting rules. However, a traditional algorithm usually uses a fixed weighted mask, i.e., a value of 0 and 255 on each side of the stitching area, which is directly weighted for fusion. Due to the lack of selectivity for fused pixels, it is easy to cause poor fusion quality away from the stitched area. Based on the image gradient weight cost map constructed in Section 2.3.1, an effective improvement of the Laplacian pyramid fusion algorithm can be achieved. In order to make the UAV fast-stitch image products contain more image detail information and achieve uniform and seamless visual effects, this paper improves the fusion rules of the traditional algorithm to achieve performance optimisation. The specific steps are as follows:
  • Extract the FROI of the image to be stitched and the group of stitched images, which perform a Gaussian pyramid decomposition to obtain G U and G R , respectively, with the following decomposition rules:
    I l ( i , j ) = m = 2 2 n = 2 2 w ( m , n ) I l 1 ( 2 i + m , 2 j + n ) ( 0 i H l , 0 j W l , 1 l N )
    where I l ( i , j ) is the lth layer image, H l and W l are the height and width of the lth layer image, N is the total number of Gaussian pyramid levels, and w ( m , n ) is a two-dimensional weight function;
  • Laplacian pyramid decomposition is performed on the FROIs of the image to be stitched and the group of stitched images to obtain L a p U and L a p R . The decomposition rules are:
    I l * ( i , j ) = 4 m = 2 2 n = 2 2 w ( m , n ) I l [ m + i 2 , n + j 2 ] ( 0 i H l , 0 j W l , 1 l N )
    where I l * is the interpolated enlargement of the lth layer image I l , and the interpolated image I l * is the same size as the l-1st layer image I l 1 . Subtracting I l 1 from its interpolated image I l * yields the corresponding Laplacian pyramid layer l-1 image L a p l , which can be expressed as follows:
    L a p l = I l I l + 1 * , 0 l < N L a p N = I N , l = N
  • The gradient weight cost map of the FROI is solved as mask input, Gaussian pyramid decomposition is performed to obtain G M , and at this time the Gaussian image G M has the same number of layers as the Laplacian image L a p U and L a p R to be fused;
  • On each layer, L a p U , L a p R are fused according to the fusion rules of the current layer G M to achieve a smooth transition of pixel values in the FROI and to obtain a Laplacian pyramid L a p F of the fused image, where the fusion rules are as follows:
    L a p F l = G M l i , j L a p U l + 255 G M l i , j L a p R l
    where L a p F l is the fused image Laplacian pyramid lth layer image, G M l is the gradient weight cost map mask Gaussian pyramid lth layer image, L a p U l and L a p R l are the FROIs Laplacian pyramid lth layer image of the image to be stitched and the group of stitched images;
  • The reconstruction of the high-resolution fused image is repeated by interpolating and expanding the fused Laplacian pyramid L a p F from the top layer and summing the images from the lower layers. The reconstruction process can be expressed as follows:
    I F l = L a p F l + I F l + 1 , 0 l < N I F N = L a p F l , l = N
    where I F l is the reconstructed fused image pyramid lth layer image, L a p F l is the fused image Laplacian pyramid lth layer image, and I F l + 1 is the image I F l + 1 interpolation enlargement result.

3. Experiments and Results

3.1. Data Sets

To fully verify the performance advantages of the algorithm in this paper, we use DJI UAVs to capture two sets of aerial UAV images of a location in Henan Province in different seasons as experimental data. Both images are 1280 × 720 pixels in size and contain typical feature elements such as lakes, roads, buildings and forests. The types of landform features likely to be encountered in most emergency mapping scenarios are covered. Among them, Data I are winter UAV aerial photography data acquired in October 2020, flying at an altitude of about 400 m, with an uneven flight speed, ranging from about 5–7 km/h. The number of images is 61, with a high overlap between images of around 40–60 per cent. Moreover, the presence of more severe haze increases the difficulty of processing. Partial zooms of the Data I image are shown in Figure 8. Data II are the summer aerial image data from the UAV, acquired in June 2021, flying at an altitude of approximately 500 m and an odd speed, ranging from about 25–30 km/h. The number of images is 25, with an overlap between images of around 10–15 per cent. Partial zooms of the Data II image are shown in Figure 9. The two datasets differ significantly in terms of data amount, overlap between frames, landform and hue. It can better represent the imagery characteristics of UAV emergency mapping.
In the method of this paper, the satellite image data region is the approximate region, which only needs to include the UAV flight area to support the feature matching between UAV images and the satellite image. Therefore, the satellite image data selected in the experiments of this paper are based on the assumption of a known approximate mission region rather than being based on the precise positioning information from GNSS. Its partial zooms are shown in Figure 10. The size of the image is 896 × 1024 pixels. There are significant differences between the satellite reference imagery and the UAV imagery, both in terms of feature type and exposure. It well represents the fast-stitch scenario of UAV imagery in most emergency response situations.

3.2. Experimental Details

The SuperPoint and SuperGlue deep learning models in this experiment were implemented using the PyTorch framework. The hardware platform used for the experiments was a laptop with an I7 CPU and a GeForce RTX 2060 graphics card (6 GB video memory) (US AI company NVIDIA, Santa Clara, CA, USA). The chosen programming language was Python, and the system environment was Ubuntu 18.04.
At present, the evaluation of fusion algorithms falls mainly into two categories. The first is the qualitative description by visual discrimination, which directly judges whether the hue, exposure and sharpness of the image are consistent. However, the evaluation results of this method are more subjective, and reliability is difficult to guarantee. The second is a quantitative evaluation through statistical fusion of various image parameters. The data analysis is used to measure whether the fused image meets the basic requirements, such as the uniformity of exposure and the richness of the image information. Based on this, we use a combination of qualitative and quantitative evaluation methods to conduct an experimental comparison study with commonly used fusion stitching algorithms in terms of stitched image quality, algorithm processing time and other aspects.
Five classical evaluation metrics were selected for quantitative evaluation, including grayscale mean value ( u ), peak signal-to-noise ratio (PSNR), structural similarity index measure (SSIM), mutual information (MI) and correlation coefficient (CC). The evaluation metrics evaluate image quality from three dimensions: pixel statistics, information theory and structural information. They can complement and cross-check one another, increasing the objectivity and reliability of the evaluation results. Among them, the evaluation control criteria for PSNR are shown in Table 1. If R ( i , j ) is the image to be evaluated, F ( i , j ) is the original image and the image sizes are all M × N , the above evaluation criteria are defined as follows:
u = 1 M N i = 1 M   j = 1 N   R ( i , j )
P S N R = 10 log M N m a x F m i n F / i = 1 M j = 1 N R i , j F i , j 2
S S I M ( R , F ) = [ l ( R , F ) ] α [ c ( R , F ) ] β [ s ( R , F ) ] γ l ( R , F ) = 2 μ R μ F + C 1 μ R 2 + μ F 2 + C 1 c ( R , F ) = 2 σ R σ F + C 2 σ R 2 + σ F 2 + C 2 s ( R , F ) = σ R F + C 3 σ R σ F + C 3
M I R , F = H R + H F H R , F H R = i = 0 N 1   p i log p i   H ( R , F ) = r , f   p R F ( r , f ) l o g p R F ( r , f )
C C = x = 0 M 1 y = 0 N 1 R ( x , y R ¯ ( x , y ) ) ( F x , y F ¯ ( x , y ) ) x = 0 M 1 y = 0 N 1 R ( x , y R ¯ ( x , y ) ) 2 x = 0 M 1 y = 0 N 1 F ( x , y F ¯ ( x , y ) ) 2

3.3. FROI Adaptive Experiment

The experiments aim to validate the adaptive performance of the proposed FROI. In both datasets, we performed image fusion experiments using adaptive Δ ξ and different fixed values of ξ , respectively. For a more intuitive comparison of their fusion smoothing effects, image frames with great differences in exposure and more challenging fusion smoothing were selected for zoom-in analysis, where the zoomed area is the image block near the inter-frame stitching positioning line. The image blocks are all 150 × 150 pixels in size, as shown in Figure 11 and Figure 12. When directly superimposed ( ξ = 0 ), there is a clear difference in exposure on either side of the stitching positioning line.
For the quantitative analysis, we used the mean grayscale line plot to evaluate the image fusion effect at different values of ξ . We blocked the analyzed image blocks again uniformly and numbered them from top to bottom and from left to right; the blocking and numbering methods are shown in Figure 13. To further analyze the degree of uniformity of hue and exposure within the image, the u within each block was calculated separately and a line graph was plotted. As shown in Figure 14, the horizontal axis indicates the block number, and the vertical axis indicates the u of each block. The flatter the line, the more uniform the grayscale distribution within the image block and the better the fusion effect. As ξ increases, the grayscale distribution line of the image block tends to become flatter, and the hue difference of the fusion image is smoothed compared to the grayscale distribution line of the original image ( ξ = 0 ). There is a positive correlation between ξ and the degree of fusion. However, when ξ is increased to a certain threshold, the grayscale distribution folds of the image blocks tend to become more similar as ξ increases. When using the adaptive Δ ξ calculated from Formula (4), the grayscale distribution of both data image blocks is flatter. This shows that Δ ξ can adequately meet the requirements of inter-frame fusion and the fused images have good grayscale consistency.
For qualitative analysis, the fusion results using adaptive Δ ξ and different fixed ξ for the zoomed analysis image blocks are shown in Figure 15 and Figure 16. The red circles mark the areas of the figures with the greatest differences in hue and exposure. From Figure 15a–c and Figure 16a–d, it can be seen that when using fixed ξ , the larger the ξ , the larger the hue smoothing interval of the fusion, the stronger the fusion effect, and the exposure uniformity within the image is significantly improved.
However, comparing (d) and (e) of Figure 15, it can be seen that after ξ has been increased to a certain threshold, the hue within the image is relatively uniform. As ξ increases, the fusion smoothing results are closer together, and the visual effects are similar. However, as the fixed ξ rises, the fusion processing becomes more demanding and time-consuming. In practice, to ensure the smoothing effect of different image frames, it is usually necessary to artificially set a larger fixed ξ value for fusion processing, which inevitably generates an additional workload and is not conducive to emergency response.
As can be seen in Figure 15d and Figure 16e, when using adaptive Δ ξ , it can be seen that the fused image results have a more uniform distribution of hue in the fore-and-aft and side directions. Uniform visual results are achieved for both sets of data with the more challenging image blocks. Since the adaptive Δ ξ can be dynamically adjusted according to different inter-frame difference situations, it maximises the processing efficiency under the premise of guaranteeing the fusion effect and has obvious advantages in emergency response.

3.4. Fusion Experiment

The experiments were designed to verify the advantages of the proposed fusion method. We selected six pairs of images containing typical features as test data in two sets of experimental data. Comparisons were made with the weighted average fusion algorithm (WA), the maximum flow/minimum cut algorithm (Maxflow/Mincut) [17,18] and the Laplacian pyramid fusion algorithm (LAP) based on an OpenCV implementation. Of these, WA is the most commonly used image fusion algorithm, Maxflow/Mincut is a representative algorithm based on optimal stitching, and both the LAP and SatellStitch in this paper are based on FROI. The PSNR, SSIM, MI, CC and experimental time (Time) statistics for the fused image results of the four methods are shown in Table 2.
As can be seen from Table 2 and Figure 17, WA takes the longest time, has the worst real-time performance and has difficulty adapting to UAV imagery data with large differences in hue and exposure between the frames. The algorithms all have a PSNR below 30 dB. This indicates significant image distortion problems in the fusion images. The Maxflow/Mincut shows some advantages in terms of time consumption, but its PSNR fluctuates around 30 dB, indicating that the image quality after fusion is still unsatisfactory. Compared with the LAP, the PSNR of SatellStitch is improved by an average of 31.73%, and the MI is improved by an average of 19.98%, indicating that our algorithm has effectively improved the quality of the fused image, and the fused image is very similar to the original image and inherits the spectral radiation information of the original image better. In terms of algorithm processing efficiency, since SatellStitch and the LAP need to construct different spatial frequency layers for fusion, it takes slightly longer than Maxflow/Mincut but has good real-time performance compared to WA.
For a more visual comparison of the performance of different fusion algorithms, a local zoom analysis was performed on images containing typical features and significant hue differences in the test data, as shown in Figure 18 and Figure 19. The first column is the original alignment image, and different colored boxes are used to indicate the area of the image where the corresponding color represents the algorithm for the zoomed comparison.
Figure 18 contains vertical structural features, such as trees and buildings, and it can be seen that WA has produced significant ghosting and blurring around the structural features and that the images are severely distorted. Maxflow/Mincut avoids the appearance of blur, but due to the differences in hue and exposure between frames, there are gaps in the blended image where hue and brightness jump around. With less hue and exposure variation, the LAP and SatellStitch achieve more natural blending results not only on flatland areas but also on vertical structures, such as buildings and trees.
Figure 19 shows the results of the more challenging image blending. There is color degradation at the edges of the image due to the effects of hazy weather, producing more significant hue differences. It can be seen that both WA and Maxflow/Mincut struggle to achieve the desired visual effect and distortions and misalignments appear in geometric features such as roads. The LAP has limited ability to process images with large hue differences, and its fused images result in significant halos on the lake. SatellStitch shows greater robustness, and the fused image is clear and tonally consistent.

3.5. Image Stitching Experiment

Due to the high altitude of the UAV, the ground in the survey area is not very undulating and can be approximately flat. Therefore, this paper estimates the transformation relationship T between the UAV image and the satellite reference image as a perspective transformation model within a certain accuracy range to achieve fast alignment and stitching of the image frames. Figure 20 shows the UAV fast-stitch image maps of Data I and Data II. It can be seen that the overall visual effect of the stitched image results of SatellStitch is satisfactory, with good adaptability and robustness to UAV image data with different hues and irregular overlaps between frames.
To quantitatively assess the quality of the UAV fast-stitch image maps, 50 points were randomly selected by hand from the stitching results of the two datasets and compared with the satellite reference image. Table 3 shows the statistical results of the mean pixel errors in the x and y directions. As can be seen from Table 3 and Figure 21, SatellStitch effectively solves the problem of error accumulation in traditional stitching methods, with the majority of pixel errors in all directions of the image being within three pixels.
Table 4 shows the average time spent per frame per step in the stitching flow of SatellStitch. It compares it with the well-known commercial software Pix4DMapper V4.5.6 [46]. It can be seen that the processing time of Pix4DMapper increases sharply as the number of image frames increases. In contrast, SatellStitch introduces satellite reference image assistance, and each frame of the UAV image can be directly corrected without iteration and overall levelling, with low computational complexity, so that large-scale image data can be processed smoothly and quickly, with an average time of 2.36 s per frame of image stitching and an approximately linear computational complexity. In the image Data I stitching experiments with a large amount of image data, the stitching efficiency was improved by 62.31% compared to Pix4DMapper.

4. Discussion

In extreme scenarios such as disaster relief, UAV image stitching can be affected by various factors, such as image distortion and drastic changes in terrain. Therefore, in order to better support emergency mapping tasks, a stitching algorithm needs to meet special requirements, such as stability, adaptivity, and real-time performance. This paper is focused on the theoretical and experimental study of the stitching method for UAV fast-stitch image maps, which provides a new idea to meet the special requirements for stitching UAV images in emergency response situations, such as disaster rescue and risk assessment. The effectiveness of the SatellStitch is verified through experiments on two UAV image datasets. It can produce high-quality and seamless fast-stitch image maps in a variety of terrain scenarios and remains robust under large hue differences caused by hazy weather.
First of all, Satellstitch has a high degree of stability. Since the satellite reference image is a ground orthographic projection, each pixel has absolute geographic coordinates. Therefore, with the help of the satellite image, each frame of the UAV image is able to directly achieve absolute positioning after rapid alignment using the points obtained by feature matching to calculate the transformation model. In addition, the transformation model calculation is performed only between the UAV image and the satellite image, which effectively solves the problem of cumulative error in the traditional inter-frame transformation method of the UAV image. Furthermore, the stitching quality is not limited by the degree of image overlap, which avoids the matching difficulty and stitching failure problem caused by insufficient overlap between frames in the traditional method. It is highly reliable in extreme conditions, such as GNSS denial, and the pixel error statistics in Table 3 show that the average pixel error of Satellstitch is controlled within three pixels.
In addition, Satellstitch also has excellent adaptability. We tested the advantages of the adaptive FROI. By comparing the fusion results of the two datasets, it can be seen that the ξ to achieve a more desirable fusion effect between different image frames is different. In practice, if the fusion smoothing requirement between different image frames is only satisfied by increasing ξ , it will incur a high time cost when faced with a huge amount of UAV image data, and it is difficult to ensure a real-time emergency response. The fusion method based on Δ ξ proposed in this paper can fully satisfy the fusion needs between different frames. Moreover, it improves the fusion efficiency while ensuring the fusion effect. At the same time, Satellstitch achieves an effective improvement over traditional fusion algorithms. It is able to adapt to different environmental conditions and feature types. We analyze and compare with the current commonly used image fusion algorithms. Compared with the single image fusion algorithm WA and the representative algorithm Maxflow/Mincut based on optimal stitching, SatellStitch effectively avoids gaps and ghosting. The gradient weight cost map designed in this paper also effectively enhances the performance of the LAP and reduces the loss of image details, improving the quality of the stitched images with an average improvement of 31.73% in PSNR, 19.98% in MI and greater than 0.99 in both CC and SSIM. In terms of real-time performance, compared to the well-known commercial software Pix4DMapper, Satellstitch can significantly increase the processing speed with little loss of stitching accuracy and can process large-scale image data smoothly and quickly, which is of practical value in emergency mapping scenarios, such as risk assessment and disaster relief.
In actual emergency mapping missions, in order to capture as comprehensive a picture as possible of the disaster area, including damage to buildings, casualty locations, road traffic conditions, etc., UAVs usually have a high flight altitude. Under this premise, Satellstitch has an obvious advantage in fast stitching of extensive image maps, and the simple perspective transformation model can fully meet the application standards. However, when the UAV is flying at a low altitude, the assumptions of the perspective transformation model may be violated, affecting the stitching accuracy of individual image frames, so the flight altitude parameter must be taken into account. In future work, we will work on solving the difficult problem of stitching fast UAV images in more diverse and complex emergency mapping scenarios and further improve the robustness and applicability of the algorithm.

5. Conclusions

Seamless stitching of UAV fast-stitch image maps is a key technology for providing real-time geographic information services for emergency mapping and is of great social and practical importance. This paper focuses on the problems of inter-frame drift distortion, ghosting and gaps that tend to occur in fast-stitch image maps. We integrate the advantages of two methods, image feature information-based method and image fusion, and apply them jointly. It also introduces the assistance of satellite reference images and proposes a seamless and autonomous method for producing UAV fast-stitch image maps for emergency response. Experiments have been conducted on two sets of UAV image data with different seasons and features, and the following conclusions have been reached:
  • The UAV fast-stitch image map stitching strategy assisted by satellite reference images effectively solves the cumulative error problem of the traditional method. Without the support of GCPs and GNSS, the UAV image alignment can be absolutely positioned, which can meet the application requirements of UAV emergency mapping;
  • The dynamic contour-based multi-resolution image fusion algorithm achieves the simultaneous resolution of stitching-gap and ghosting problems. The smoothing ability of hue and exposure differences is remarkable, and the quality of the stitched image is effectively improved.
In summary, the SatellStitch proposed in this paper can provide new technical support for UAV emergency mapping and has important application value in activities such as disaster rescue and risk assessment.

Author Contributions

Methodology, Z.W. and Q.X.; Software, Z.W.; Validation, Z.W., C.L., Q.X. and H.H.; Formal analysis, Z.W., T.G. and F.Y.; Resources, L.W.; Data curation, L.W.; Writing—original draft, Z.W.; Writing—review & editing, C.L., Q.X. and L.W.; Supervision, C.L. All authors have read and agreed to the published version of the manuscript.

Funding

This research received no external funding.

Data Availability Statement

Data will be available upon request to the first author.

Conflicts of Interest

The authors declare no conflict of interest.

References

  1. Yao, H.; Qin, R.; Chen, X. Unmanned Aerial Vehicle for Remote Sensing Applications—A Review. Remote Sens. 2019, 11, 1443. [Google Scholar] [CrossRef]
  2. Bu, S.; Zhao, Y.; Wan, G.; Liu, Z. Map2DFusion: Real-Time Incremental UAV Image Mosaicing Based on Monocular SLAM. In Proceedings of the 2016 IEEE/RSJ International Conference on Intelligent Robots and Systems (IROS), Daejeon, Republic of Korea, 9–14 October 2016; IEEE: Daejeon, Republic of Korea, 2016; pp. 4564–4571. [Google Scholar]
  3. Zhao, Y.; Cheng, Y.; Zhang, X.; Xu, S.; Bu, S.; Jiang, H.; Han, P.; Li, K.; Wan, G. Real-Time Orthophoto Mosaicing on Mobile Devices for Sequential Aerial Images with Low Overlap. Remote Sens. 2020, 12, 3739. [Google Scholar] [CrossRef]
  4. Xu, B.; Zhang, L.; Liu, Y. Robust hierarchical structure from motion for large-scale unstructured image sets. ISPRS J. Photogramm. Remote Sen. 2021, 181, 367–384. [Google Scholar] [CrossRef]
  5. Zhu, D.; Zhang, K.; Sun, P. Homogenization of daily precipitable water vapor time series derived from GNSS observations over China. Adv. Space Res. 2023, 72, 1751–1763. [Google Scholar] [CrossRef]
  6. Ren, M.; Li, J.; Song, L.; Li, H.; Xu, T. MLP-Based Efficient Stitching Method for UAV Images. IEEE Geosci. Remote Sens. Lett. 2022, 19, 1–5. [Google Scholar] [CrossRef]
  7. Zeng, W.; Deng, Q.; Zhao, X. A method for stitching remote sensing images with Delaunay triangle feature constraints. Geocarto. Int. 2023, 38, 2285356. [Google Scholar] [CrossRef]
  8. Cui, Z.; Tang, R.; Wei, J. UAV Image Stitching With Transformer and Small Grid Reformation. IEEE Geosci. Remote Sen. Lett. 2023, 20, 1–5. [Google Scholar] [CrossRef]
  9. Tang, W.; Jia, F.; Wang, X. An improved adaptive triangular mesh-based image warping method. Front. Neurorobot. 2023, 16, 1042429. [Google Scholar] [CrossRef]
  10. Li, R.; Gao, P.; Cai, X.; Chen, X.; Wei, J.; Cheng, Y.; Zhao, H. A Real-Time Incremental Video Mosaic Framework for UAV Remote Sensing. Remote Sens. 2023, 15, 2127. [Google Scholar] [CrossRef]
  11. Nie, L.; Lin, C.; Liao, K.; Liu, S.; Zhao, Y. Unsupervised Deep Image Stitching: Reconstructing Stitched Features to Images. IEEE Trans. Image Process. 2021, 30, 6184–6197. [Google Scholar] [CrossRef]
  12. Huang, C.; Pan, X.; Cheng, J.; Song, J. Deep Image Registration With Depth-Aware Homography Estimation. IEEE Signal Process. Lett. 2023, 30, 6–10. [Google Scholar] [CrossRef]
  13. Yan, N.; Mei, Y.; Xu, L. Deep learning on image stitching with multi-viewpoint images: A survey. Neural Process. Lett. 2023, 55, 3863–3898. [Google Scholar] [CrossRef]
  14. Zhang, W.; Guo, B.; Li, M.; Liao, X.; Li, W. Improved Seam-Line Searching Algorithm for UAV Image Mosaic with Optical Flow. Sensors 2018, 18, 1214. [Google Scholar] [CrossRef] [PubMed]
  15. Pan, W.; Li, A.; Wu, Y. Research on seamless image stitching based on fast marching method. IET Image Process. 2023, 12, 885–893. [Google Scholar] [CrossRef]
  16. Kass, M.; Witkin, A.; Terzopoulos, D. Snakes: Active Contour Models. Int. J. Comput. Vis. 1988, 1, 321–331. [Google Scholar] [CrossRef]
  17. Dijkstra, E.W. A Note on Two Problems in Connexion with Graphs. Numerische Mathematik. 1959, 1, 269–271. [Google Scholar] [CrossRef]
  18. Dong, Q.; Liu, J. Seamline Determination Based on PKGC Segmentation for Remote Sensing Image Mosaicking. Sensors 2017, 17, 1721. [Google Scholar] [CrossRef]
  19. Duplaquet, M.-L. Building Large Image Mosaics with Invisible Seam Lines. In Visual Information Processing VII, Proceedings of the Aerospace/Defense Sensing and Controls, Orlando, FL, USA, 13–17 April 1998; Park, S.K., Juday, R.D., Eds.; SPIE: Bellingham, WA, USA, 1998; pp. 369–377. [Google Scholar]
  20. Li, X.; Hui, N.; Shen, H.; Fu, Y.; Zhang, L. A Robust Mosaicking Procedure for High Spatial Resolution Remote Sensing Images. ISPRS J. Photogramm. Remote Sens. 2015, 109, 108–125. [Google Scholar] [CrossRef]
  21. Kwata, V.; Schödl, A.; Essa, I.; Turk, G.; Bobick, A. Graphcut Textures: Image and Video Synthesis Using Graph. ACM Trans. Graph. 2003, 22, 277–286. [Google Scholar] [CrossRef]
  22. Qu, Z.; Wang, T.; An, S.; Liu, L. Image Seamless Stitching and Straightening Based on the Image Block. IET Image Process. 2018, 12, 1361–1369. [Google Scholar] [CrossRef]
  23. Wang, Q.; Zhou, G.; Song, R.; Xie, Y.; Luo, M.; Yue, T. Continuous Space Ant Colony Algorithm for Automatic Selection of Orthophoto Mosaic Seamline Network. ISPRS J. Photogramm. Remote Sens. 2022, 186, 201–217. [Google Scholar] [CrossRef]
  24. Gao, K.; Liu, B.; Yu, X. Unsupervised meta learning with multiview constraints for hyperspectral image small sample set classification. IEEE Trans. Image Process. 2022, 31, 3449–3462. [Google Scholar] [CrossRef] [PubMed]
  25. Xue, Z.; Tan, X.; Yu, X. Deep hierarchical vision transformer for hyperspectral and LiDAR data classification. IEEE Trans. Image Process. 2022, 31, 3095–3110. [Google Scholar] [CrossRef]
  26. Huang, W.; Sun, Q.; Yu, A. Leveraging Deep Convolutional Neural Network for Point Symbol Recognition in Scanned Topographic Maps. ISPRS Int. J. Geo-Inf. 2023, 12, 128. [Google Scholar] [CrossRef]
  27. Li, J.; Guo, W.; Liu, H. Predicting User Activity Intensity Using Geographic Interactions Based on Social Media Check-In Data. ISPRS Int. J. Geo-Inf. 2021, 10, 555. [Google Scholar] [CrossRef]
  28. Yu, A.; Guo, W.; Liu, B. Attention aware cost volume pyramid based multi-view stereo network for 3d reconstruction. ISPRS J. Photogramm. Remote Sens. 2021, 175, 448–460. [Google Scholar] [CrossRef]
  29. Li, L.; Yao, J.; Liu, Y.; Yuan, W.; Shi, S.; Yuan, S. Optimal Seamline Detection for Orthoimage Mosaicking by Combining Deep Convolutional Neural Network and Graph Cuts. Remote Sens. 2017, 9, 701. [Google Scholar] [CrossRef]
  30. Yu, A.; Quan, Y.; Yu, R. Deep Learning Methods for Semantic Segmentation in Remote Sensing with Small Data: A Survey. Remote Sens. 2023, 15, 4987. [Google Scholar] [CrossRef]
  31. Gao, K.; Yu, A.; You, X. Cross-Domain Multi-Prototypes with Contradictory Structure Learning for Semi-Supervised Domain Adaptation Segmentation of Remote Sensing Images. Remote Sens. 2023, 15, 3398. [Google Scholar] [CrossRef]
  32. Yang, J.; Jiang, Y.; Yang, X.; Guo, G.M. A Fast Mosaic Algorithm of UAV Images Based on Dense SIFT Feature Matching. J. Geo-Inf. Sci. 2019, 21, 588–599. [Google Scholar]
  33. Zhu, S.; Qian, Z. The Seam-line Removal under Mosaicking of Remotely Sensed Images. J. Remote Sens. 2002, 6, 183–187. [Google Scholar]
  34. Chen, Y.; Zhan, D. Image Seamline Removal Method Based on JND Model. J. Electron. Inf. Technol. 2017, 39, 2404–2412. [Google Scholar]
  35. Bai, X.; Gu, S.; Zhou, F.; Xue, B. Weighted Image Fusion Based on Multi-Scale Top-Hat Transform: Algorithms and a Comparison Study. Optik 2013, 124, 1660–1668. [Google Scholar] [CrossRef]
  36. Szeliski, R. Video Mosaics for Virtual Environments. IEEE Comput. Graph. Appl. 1996, 16, 22–30. [Google Scholar] [CrossRef]
  37. Cai, H.; Wu, X.; Zhuo, L.; Huang, Z.; Wang, X. Fast SIFT Image Stitching Algorithm Combining Edge Detection. Infrared Laser Eng. 2018, 47, 449–455. [Google Scholar]
  38. Wang, D.; Liu, H.; Li, K.; Zhou, W. An Image Fusion Algorithm Based on Trigonometric Functions. Infrared Technol. 2017, 39, 53–57. [Google Scholar]
  39. Brown, M.; Lowe, D.G. Automatic Panoramic Image Stitching Using Invariant Features. Int. J. Comput. Vis. 2007, 74, 59–73. [Google Scholar] [CrossRef]
  40. Aslantas, V.; Bendes, E.; Toprak, A.N.; Kurban, R. A Comparison of Image Fusion Methods on Visible, Thermal and Multi-Focus Images for Surveillance Applications. In Proceedings of the 4th International Conference on Imaging for Crime Detection and Prevention 2011 (ICDP 2011), London, UK, 3–4 November 2011; IET: London, UK, 2011; pp. 1–6. [Google Scholar]
  41. Burt, P.J.; Adelson, E.H. A Multiresolution Spline with Application to Image Mosaics. ACM Trans. Graph. 1983, 2, 217–236. [Google Scholar] [CrossRef]
  42. Liu, Y.; Mo, F.; Tao, P. Matching multi-source optical satellite imagery exploiting a multi-stage approach. Remote Sens. 2017, 9, 1249. [Google Scholar] [CrossRef]
  43. Fan, Z.; Liu, Y.; Liu, Y. 3MRS: An Effective Coarse-to-Fine Matching Method for Multimodal Remote Sensing Imagery. Remote Sens. 2022, 14, 478. [Google Scholar] [CrossRef]
  44. DeTone, D.; Malisiewicz, T.; Rabinovich, A. SuperPoint: Self-Supervised Interest Point Detection and Description. In Proceedings of the 2018 IEEE/CVF Conference on Computer Vision and Pattern Recognition Workshops (CVPRW), Salt Lake City, UT, USA, 18–22 June 2018; IEEE: Salt Lake City, UT, USA, 2018; pp. 337–33712. [Google Scholar]
  45. Sarlin, P.-E.; DeTone, D.; Malisiewicz, T.; Rabinovich, A. SuperGlue: Learning Feature Matching with Graph Neural Networks. In Proceedings of the 2020 IEEE/CVF Conference on Computer Vision and Pattern Recognition (CVPR), Seattle, WA, USA, 13–19 June 2020; IEEE: Seattle, WA, USA, 2020; pp. 4937–4946. [Google Scholar]
  46. Vallet, J.; Panissod, F.; Strecha, C.; Tracol, M. Photogrammetric Performance of an Ultra Light Weight Swinglet “UAV”. Int. Arch. Photogramm. Remote Sens. Spat. Inf. Sci. 2012, XXXVIII-1/C22, 253–258. [Google Scholar] [CrossRef]
Figure 1. Workflow diagram of the seamless stitching technique for UAV fast-stitch image maps using satellite reference images. (1) UAV image data input. (2) Satellite imagery-assisted real-time alignment and positioning. Establish the matching relationship between satellite imagery and UAV imagery to help align UAV imagery and capture geographic coordinates. (3) Adaptive extraction of FROI based on dynamic contours. Construct dynamic contour point sets to locate gaps and adaptively extract FROIs. (4) Multi-resolution image fusion based on gradient weight cost map. Construct FROI with gradient weight cost map, perform Laplacian pyramid image fusion and incrementally stitch UAV fast-stitch map.
Remotesensing 16 00309 g001
Figure 2. The schematic diagram of satellite imagery-assisted real-time UAV image alignment and positioning where O u x u y u z u coordinate system is the UAV image coordinate system, O r X r Y r Z r coordinate system is the satellite image coordinate system, C P denotes the matched point set obtained by feature matching between the UAV image and the satellite reference image, and T denotes the transformation model from the UAV image to the satellite image coordinate space.
Remotesensing 16 00309 g002
Figure 3. FROI and related details. I u i 1 and I u i indicate the adjacent images, respectively, I o indicates the image overlap area, the red solid line segment O 1 O 2 O 3 indicates the stitching area positioning line, and Δ ξ indicates the adaptively determined width of the FROI. The basis of the coordinate system defined above is the geographic coordinate system in which the high-precision ortho-satellite reference image is located.
Remotesensing 16 00309 g003
Figure 4. Schematic diagram of distance transformation calculation. The region containing no valid image information is defined as Ω 1 . The region containing the valid image information is defined as Ω 2 , where the FROI region is defined as Ω 3 . Regions Ω 1 , Ω 2 and Ω 3 are interrelated: Ω 1 Ω 2 = 0 , Ω 1 Ω 2 = 1 , Ω 3 Ω 2 . D p indicates the distance of the pixel ( x i , y j ) from its nearest background pixel.
Remotesensing 16 00309 g004
Figure 5. Heat map of distance factor D p calculation results. Different colors correspond to different D p values on the color bar. D p M a x denotes the maximum value of the distance factor D p . The more yellow the color, the larger the D p . Different colors correspond to different D p values on the color bar; the more yellow the color, the larger the D p .
Remotesensing 16 00309 g005
Figure 6. Graph of the weight function. Different colors correspond to different values of Δ ξ on the color bar for the weight function.
Remotesensing 16 00309 g006
Figure 7. Schematic diagram of normalized weighting result. Weight normalization result when Δ ξ = 30 . Different values in the color bar indicate different gray values.
Remotesensing 16 00309 g007
Figure 8. Partial zooms of images from Data I, containing typical features such as (a) lake, (b) building and (c) farm. The scale of the image in Data I is about 1:1000.
Remotesensing 16 00309 g008
Figure 9. Partial zooms of images from Data II, containing typical features such as (a) calibration field, (b) road and (c) forest. The scale of the image in Data II is about 1:1250.
Remotesensing 16 00309 g009
Figure 10. Partial zooms of satellite imagery, containing typical features such as (a) lake, (b) building, (c) farm, (d) calibration field, (e) road and (f) forest. The scale of the satellite imagery is about 1:3000.
Remotesensing 16 00309 g010
Figure 11. Data I zoomed analysis image block.
Remotesensing 16 00309 g011
Figure 12. Data II zoomed analysis image block.
Remotesensing 16 00309 g012
Figure 13. Methods of image blocking and numbering.
Remotesensing 16 00309 g013
Figure 14. Zoomed analysis of image block mean grayscale line graphs from (a) Data I and (b) Data II.
Remotesensing 16 00309 g014
Figure 15. The fusion results of Data I zoomed analysis image blocks when using adaptive Δ ξ and different fixed ξ . (a) ξ = 10, (b) ξ = 20, (c) ξ = 30, (d)   Δ ξ = 34, (e) ξ = 40.
Remotesensing 16 00309 g015
Figure 16. The fusion results of Data II zoomed analysis image blocks when using adaptive Δ ξ and different fixed ξ . (a) ξ = 10, (b) ξ = 20, (c) ξ = 30, (d) ξ = 40, (e)   Δ ξ = 47.
Remotesensing 16 00309 g016
Figure 17. Visual analysis of test data fusion results. (The shape of the different markers in the line graph indicates different evaluation metrics, whereas the star-shaped markers all indicate the results of the evaluation metrics of the algorithms in this paper. Different colors indicate the evaluation results of different fusion algorithms).
Remotesensing 16 00309 g017
Figure 18. Enlarged view of the fusion results of different algorithms for a typical feature containing vertical structural features. (a) Alignment, (b) WA, (c) Maxflow/Mincut, (d) LAP, (e) SatellStitch.
Remotesensing 16 00309 g018
Figure 19. Enlarged view of the fusion results of different algorithms for typical features in hazy weather. (a) Alignment, (b) WA, (c) Maxflow/Mincut, (d) LAP, (e) SatellStitch.
Remotesensing 16 00309 g019
Figure 20. The results of the UAV fast-stitch image maps with data from (a) Data I and (b) Data II.
Remotesensing 16 00309 g020
Figure 21. Statistical results of pixel errors in x and y directions of the UAV fast-stitch image maps. (a) Statistical results of pixel errors in x direction of Data I. (b) Statistical results of pixel errors in the y direction of Data I. (c) Pixel error statistics in the x direction of Data II. (d) Pixel error statistics in the y direction of Data II.
Remotesensing 16 00309 g021
Table 1. Image quality standards evaluated by PSNR.
PSNR/dBImage Quality Standards
PSNR ≥ 40Superb picture quality, virtually the same as the original
30 PSNR < 40 Good picture quality, very similar to the original
20 PSNR < 30 Poor picture quality with significant distortion
PSNR < 20 Very poor picture quality with unacceptable image distortion
Table 2. Quantitative evaluation of test data fusion results.
Evaluation
Indicators
MethodForestCalibration FieldBuildingRoadFarmLake
PSNR/dBWA29.20228.31926.80629.56929.50727.438
Maxflow/Mincut30.69526.84627.14828.66529.22427.684
LAP39.58940.54231.98533.75237.99234.369
SatellStitch43.15550.75132.91651.13154.18754.695
SSIMWA0.9330.9430.9470.9660.9550.965
Maxflow/Mincut0.9590.9450.9580.9670.9480.967
LAP0.9960.9980.9850.9920.9920.990
SatellStitch0.9970.9990.9890.9990.9940.999
MIWA1.5402.0781.9951.8361.4111.291
Maxflow/Mincut1.8612.1412.0911.7911.3781.298
LAP3.1773.7392.9892.4352.5902.013
SatellStitch3.3234.1593.0433.0843.1672.844
CCWA0.9850.9840.9790.9840.9840.980
Maxflow/Mincut0.9900.9760.9800.9830.9820.977
LAP0.9980.9980.9920.9930.9970.993
SatellStitch0.9990.9990.9930.9990.9980.999
Time/sWA2.9033.2043.1472.8852.4892.571
Maxflow/Mincut0.6520.6210.6370.4820.6060.571
LAP1.1901.2211.1311.1961.1891.276
SatellStitch1.1981.1291.1051.2911.1641.256
Table 3. Statistical results of the mean pixel error in the x and y direction of the UAV fast-stitch image maps. The results were obtained by manually selecting 50 points at random on the UAV fast-stitch image maps. The statistics were visually compared with the satellite reference image.
DataNumber of Images σ ¯ x (pixels) σ ¯ y (pixels)
Data I611.261.14
Data II251.281.74
Table 4. Comparison of the average time taken for each step in the stitching flow of the fast-stitch image maps and the time taken for Pix4DMapper stitching.
DataSatellStitchPix4DMapper
T ¯ M a t c h i n g (s) T ¯ A l i g n m e n t (s) T ¯ F u s i o n (s) T ¯ S t i t c h i n g / T S t i t c h i n g (s)
Data I0.930.271.282.48/151.376.58/401
Data II0.910.221.122.25/56.252.76/69
Disclaimer/Publisher’s Note: The statements, opinions and data contained in all publications are solely those of the individual author(s) and contributor(s) and not of MDPI and/or the editor(s). MDPI and/or the editor(s) disclaim responsibility for any injury to people or property resulting from any ideas, methods, instructions or products referred to in the content.

