Article

A Lightweight Arbitrarily Oriented Detector Based on Transformers and Deformable Features for Ship Detection in SAR Images

1
Department of Space Microwave Remote Sensing System, Aerospace Information Research Institute, Chinese Academy of Sciences, Beijing 100190, China
2
School of Electronic, Electrical and Communication Engineering, University of Chinese Academy of Sciences, Beijing 100049, China
*
Author to whom correspondence should be addressed.
Remote Sens. 2024, 16(2), 237; https://doi.org/10.3390/rs16020237
Submission received: 29 November 2023 / Revised: 29 December 2023 / Accepted: 31 December 2023 / Published: 7 January 2024

Abstract

:
Lightweight ship detection is an important application of synthetic aperture radar (SAR). The prevailing trend in recent research involves employing a detection framework based on convolutional neural networks (CNNs) and horizontal bounding boxes (HBBs). However, CNNs with local receptive fields fall short in acquiring adequate contextual information and exhibit sensitivity to noise. Moreover, HBBs introduce significant interference from both the background and adjacent ships. To overcome these limitations, this paper proposes a lightweight transformer-based method for detecting arbitrarily oriented ships in SAR images, called LD-Det, which excels at promptly and accurately identifying rotating ship targets. First, light pyramid vision transformer (LightPVT) is introduced as a lightweight backbone network. Built upon PVT v2-B0-Li, it effectively captures the long-range dependencies of ships in SAR images. Subsequently, multi-scale deformable feature pyramid network (MDFPN) is constructed as a neck network, utilizing the multi-scale deformable convolution (MDC) module to adjust receptive field regions and extract ship features from SAR images more effectively. Lastly, shared deformable head (SDHead) is proposed as a head network, enhancing ship feature extraction with the combination of deformable convolution operations and a shared parameter structure design. Experimental evaluations on two publicly available datasets validate the efficacy of the proposed method. Notably, the proposed method achieves state-of-the-art detection performance when compared with other lightweight methods in detecting rotated targets.

1. Introduction

Synthetic aperture radar (SAR) is a type of active microwave imaging radar. Being an active microwave sensor, SAR is not affected by factors such as daylight and weather conditions, making it capable of conducting observations of the Earth’s surface under all-day and all-weather conditions. Additionally, SAR has the ability to gather information that is concealed beneath the surface and vegetation. SAR finds wide-ranging applications across various fields [1]. One important application of SAR is object detection based on SAR ships, which is extensively employed in areas including maritime traffic control [2], ship surveillance [3], and fishery monitoring [4].
SAR ship detection can be categorized into two main methods: traditional methods and modern methods based on deep learning. Traditional SAR ship detection methods generally involve several components, including land masking, preprocessing, prescreening, and discrimination [5]. These methods mainly include constant false alarm rate (CFAR)-based methods [6], visual saliency-based methods [7], global threshold-based methods [8], polarimetry-based methods [9], and wavelet transform-based methods [10]. The main characteristic of these methods is that all of them require manual feature extraction, which leads to redundancy and lack of transferability in algorithms, thereby hindering the real-time characteristic and effectiveness of detection. Therefore, traditional SAR ship detection methods cannot adapt to current detection requirements. In recent years, deep learning [11] has achieved remarkable achievements and significant breakthroughs in areas such as object detection, enabling the extraction of object features for detection without human intervention. The release of multiple SAR ship datasets has promoted the widespread application of deep learning in the field of end-to-end SAR ship detection, and modern detection performance surpasses traditional methods [12]. This paper investigates ship detection based on SAR images using deep learning as the foundation. The field of object detection, including SAR ship detection, relies on two important indicators [13]: accuracy and speed. In the field of deep learning, the neural network architectures used for image processing are divided into convolutional neural networks (CNNs) [14] and transformers [15].
The high accuracy of detection results is the goal pursued by many researchers in SAR ship detection. In terms of CNN-based algorithms, Li et al. [16] analyzed the advantages of Faster R-CNN [17] in computer vision and its limitations in SAR ship detection and proposed improvement strategies. In addition, they also released the first publicly available SAR ship detection dataset, called SSDD. Kang et al. [18] combined multiple feature layers and introduced a region proposal network to achieve multi-layer fusion based on contextual regions, thereby improving ship detection performance. Fu et al. [19] proposed the feature-balanced pyramid network and the feature-refined head network, achieving effective detection with the anchor-free method. Zhao et al. [20] achieved multi-scale feature fusion and calibration by improving the neck and head network, thus realizing high-accuracy ship detection. Li et al. [21] constructed the long-term dependency relationship between ships and backgrounds using global contextual information, proposed an attention module to reduce noise, and finally reduced the impact of anchor points using a keypoint-based method. In terms of transformer-based algorithms, Xia et al. [22] were the pioneers in applying a transformer to SAR ship detection. They proposed a transformer framework that incorporates context-aware joint representation learning, combining it with the local representation ability of CNNs to achieve ship detection. Zhou et al. [23] first introduced the transformer into rotating SAR ship detection. They proposed an improved multi-scale transformer structure which combines feature fusion modules and new loss functions to enhance the detection capability of small ships. Zhao et al. [24] proposed a domain adaptive transformer to address the matching problem of trained models on new SAR datasets, which differs from traditional supervised learning methods. Zhou et al. [25] created a new module and integrated it with the feature layer using the transformer, resulting in high-precision detection in nearshore scenes. These mentioned CNN- and transformer-based methods primarily focus on achieving high-precision SAR ship detection. However, the incorporation of complex models in these approaches leads to significant computational costs, which limits their practicality for high-speed ship detection and engineering deployment.
In order to achieve high-speed detection of ship targets in SAR images, researchers have explored some lightweight models. In terms of CNN-based algorithms, Yu et al. [26] proposed a ship detection scheme that combines multiple attention mechanisms, reducing the model’s complexity while enhancing its applicability. Yang et al. [27] proposed a scheme based on the YOLOv5 algorithm [28], improving the backbone and neck networks to reduce the number of model parameters while enhancing feature extraction and fusion capabilities. Ren et al. [29] also utilized YOLOv5 as the basic framework, designing a lightweight feature enhancement backbone network and multi-scale feature fusion network. In addition, they employed a new loss function to achieve a low computational lightweight model. Zhao et al. [30] first designed a multi-scale denoising network based on a Laplacian and then connected it with an improved model based on Yolox [31] to obtain a lightweight detection model. Xiong et al. [32] proposed a lightweight method based on YOLOv5 which optimizes the pyramid pooling structure and introduces different attention mechanisms to detect rotated multi-class ship targets. The studies that presented the CNN-based methods described above have focused on developing lightweight models to detect horizontal bounding boxes (HBBs) and oriented bounding boxes (OBBs), with many of these approaches being enhancements of the YOLO architecture. However, there has been limited research on lightweight SAR ship detection using transformers. In terms of transformer-based algorithms, Xie et al. [33] designed a lightweight detector with noise resistance capability by combining YOLOv5 with a transformer encoder. Zhou et al. [34] used a knowledge distillation technique called teacher–student model to create a global relationship distillation method based on transformers. This method reduces the number of parameters while improving both model accuracy and robustness. Notably, the transformer-based methods mentioned above have only discussed lightweight approaches to detecting HBBs and have not explored strategies for detecting OBBs.
Conclusions can be drawn from the discussion above regarding different approaches. Firstly, it is noteworthy that there is limited research on lightweight SAR ship detection using the transformer model. Most researchers prefer utilizing CNN-based architectures to extract image features through locality and translation equivariance. However, the receptive field obtained by the CNN-based model is local, which limits the utilization of contextual information [35]. In contrast, the transformer-based model can effectively capture long-range dependencies [36] and demonstrate strong robustness against perturbations, occlusions, and domain shifts [37]. Secondly, there is currently a lack of research on lightweight arbitrarily oriented SAR ship detection using transformers. In coastal and port scenes, SAR ship images often involve densely arranged ships with larger aspect ratios. The use of HBBs may lead to interference from both the neighboring ships and the background. On the contrary, OBBs can accurately reflect the directionality of ship targets, thereby mitigating the aforementioned issues and being more suitable for SAR ship detection. Therefore, it is important to study lightweight arbitrarily oriented methods based on transformers.
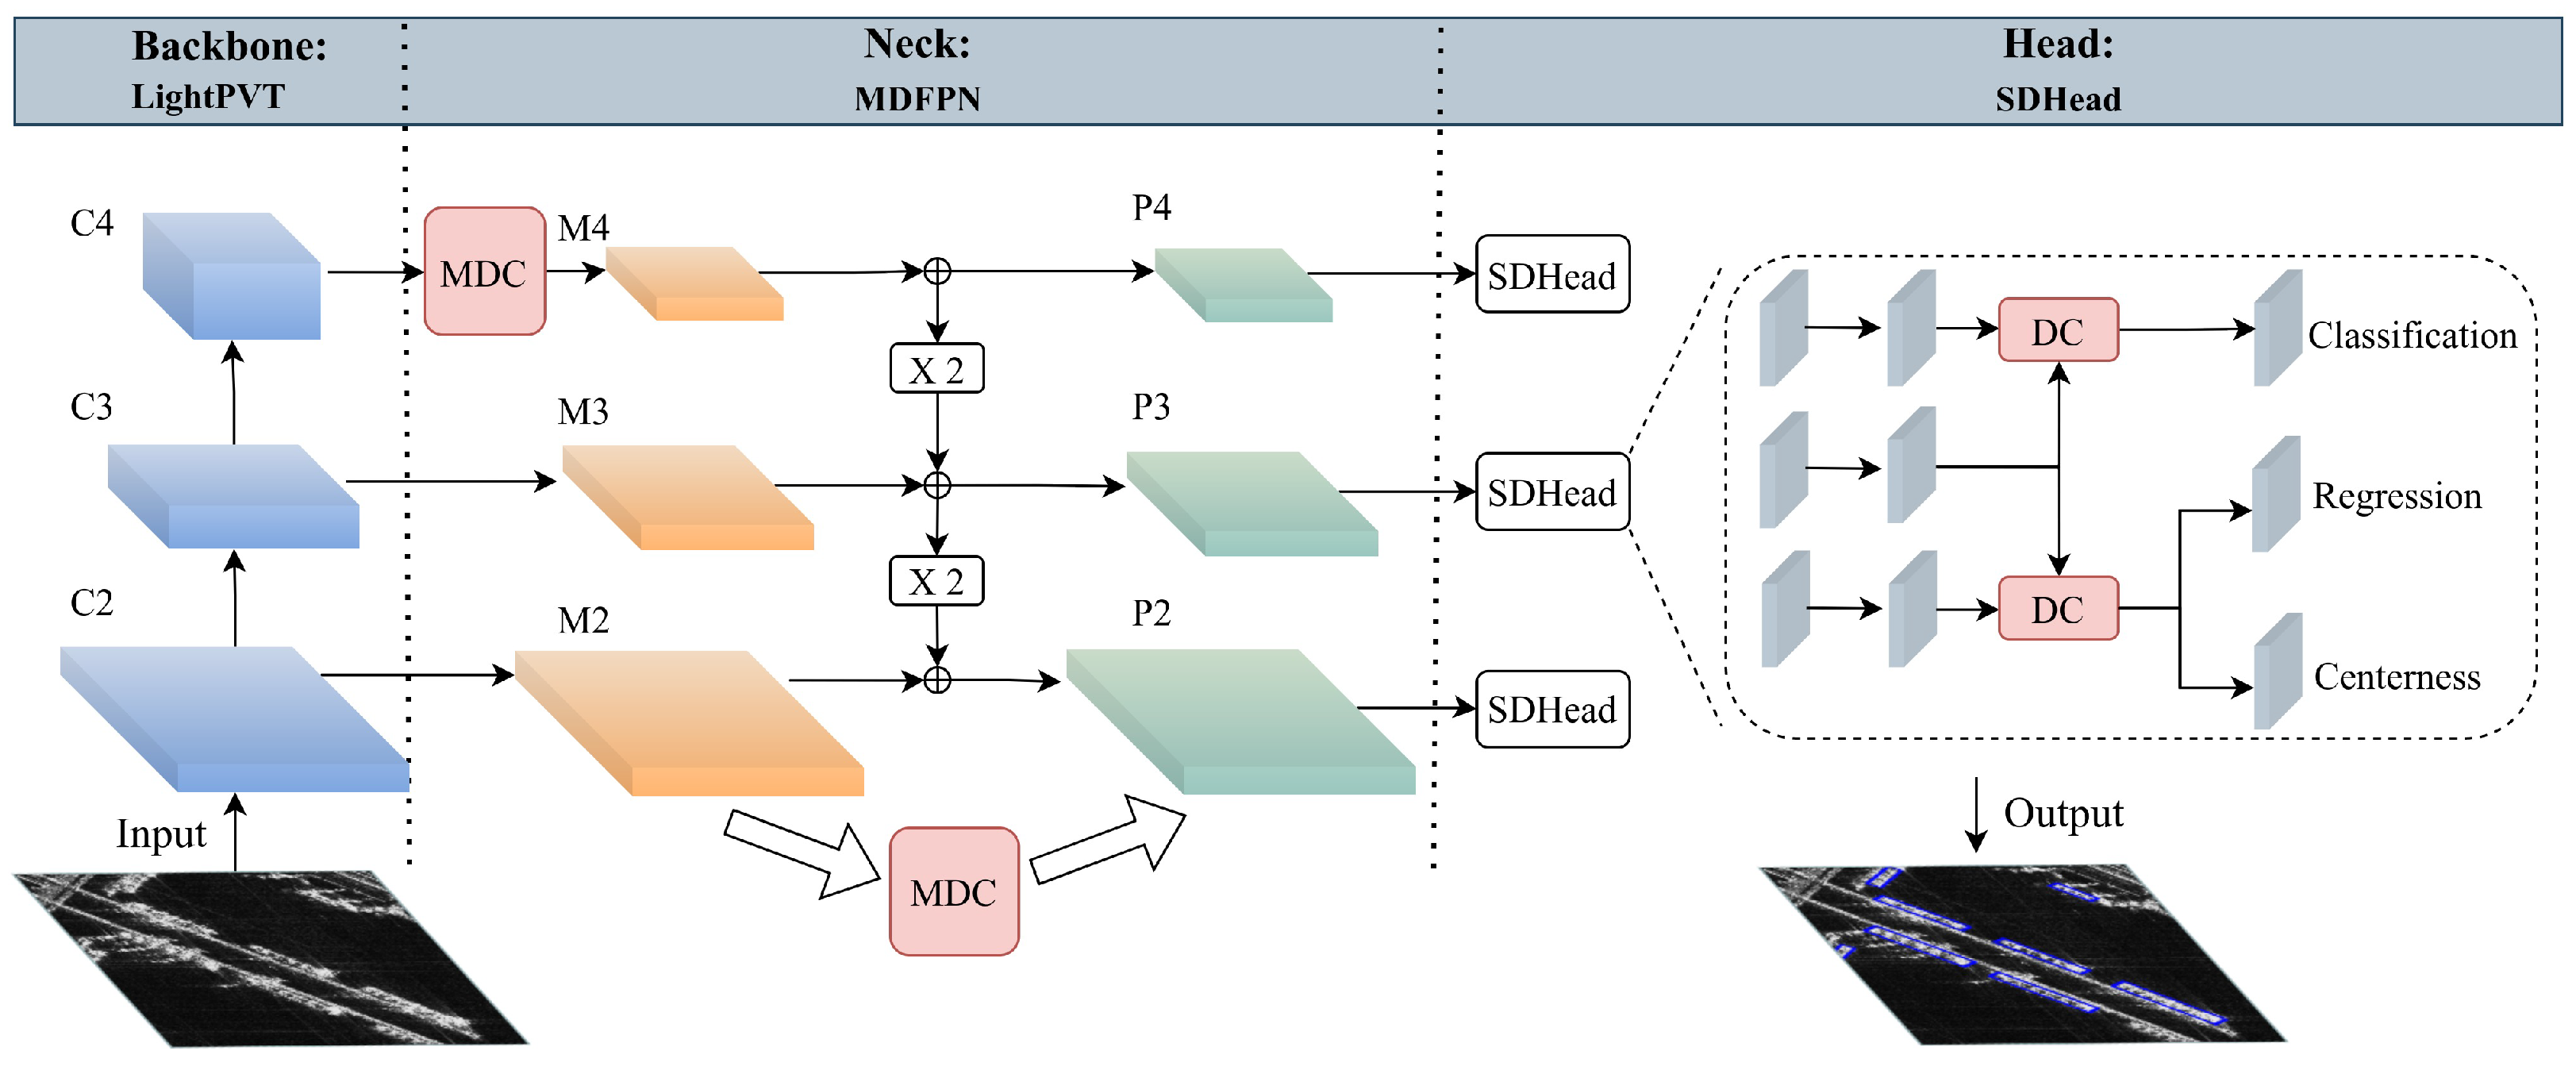
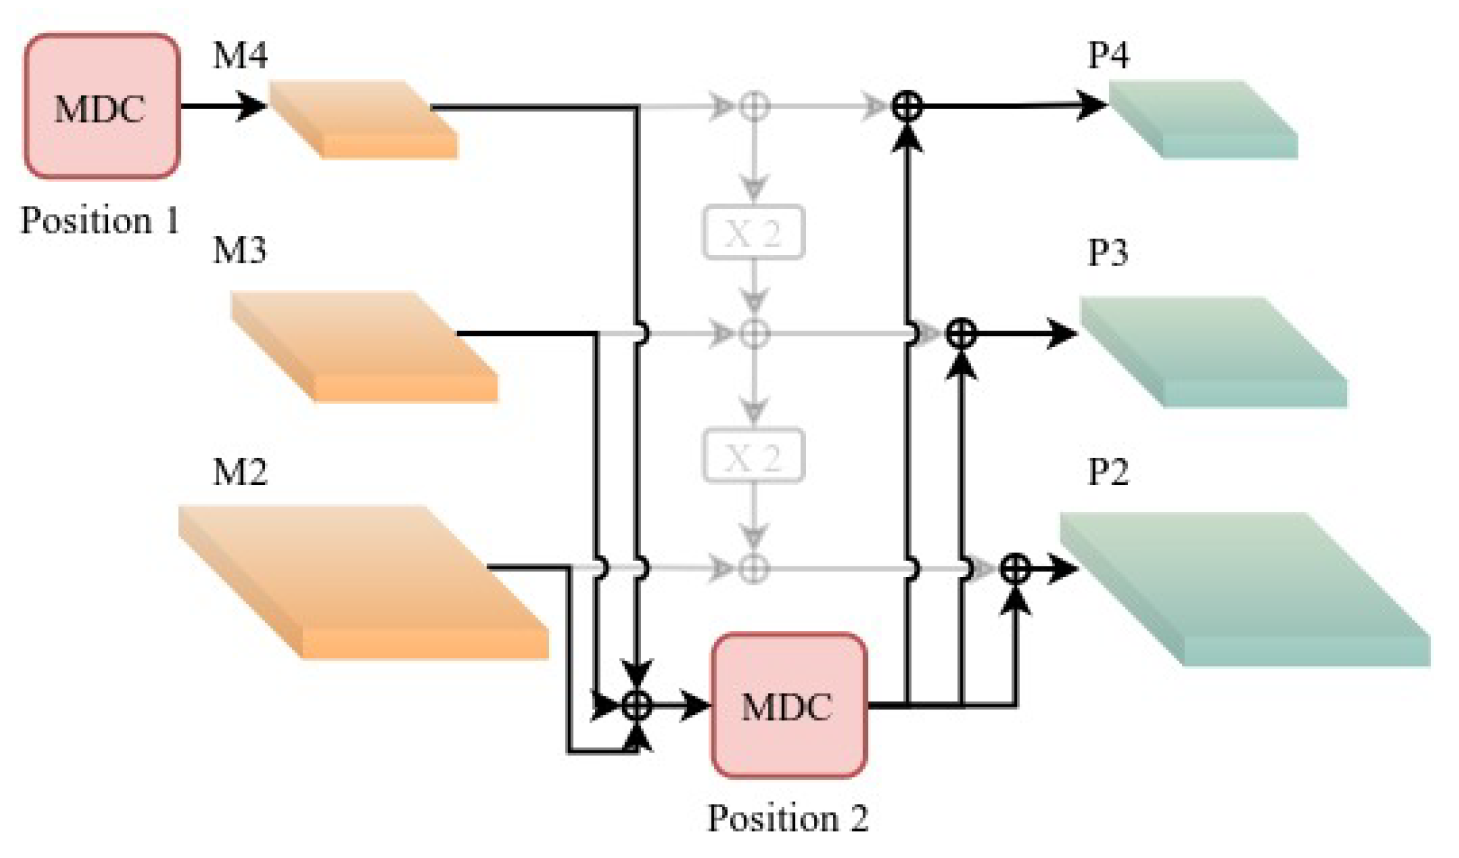
Based on the analysis presented above, this paper proposes LD-Det, a lightweight arbitrarily oriented detector based on transformers and deformable features for ship detection in SAR images. This method introduces a transformer into a lightweight arbitrarily oriented ship detection approach for SAR images for the first time. Firstly, we propose light pyramid vision transformer (LightPVT) as a lightweight backbone network. It effectively captures long-range dependencies of ships in SAR images and enhances detection performance by obtaining sufficient contextual information. Secondly, we introduce multi-scale deformable feature pyramid network (MDFPN), which integrates our proposed multi-scale deformable convolution (MDC) module into the feature pyramid network (FPN) [
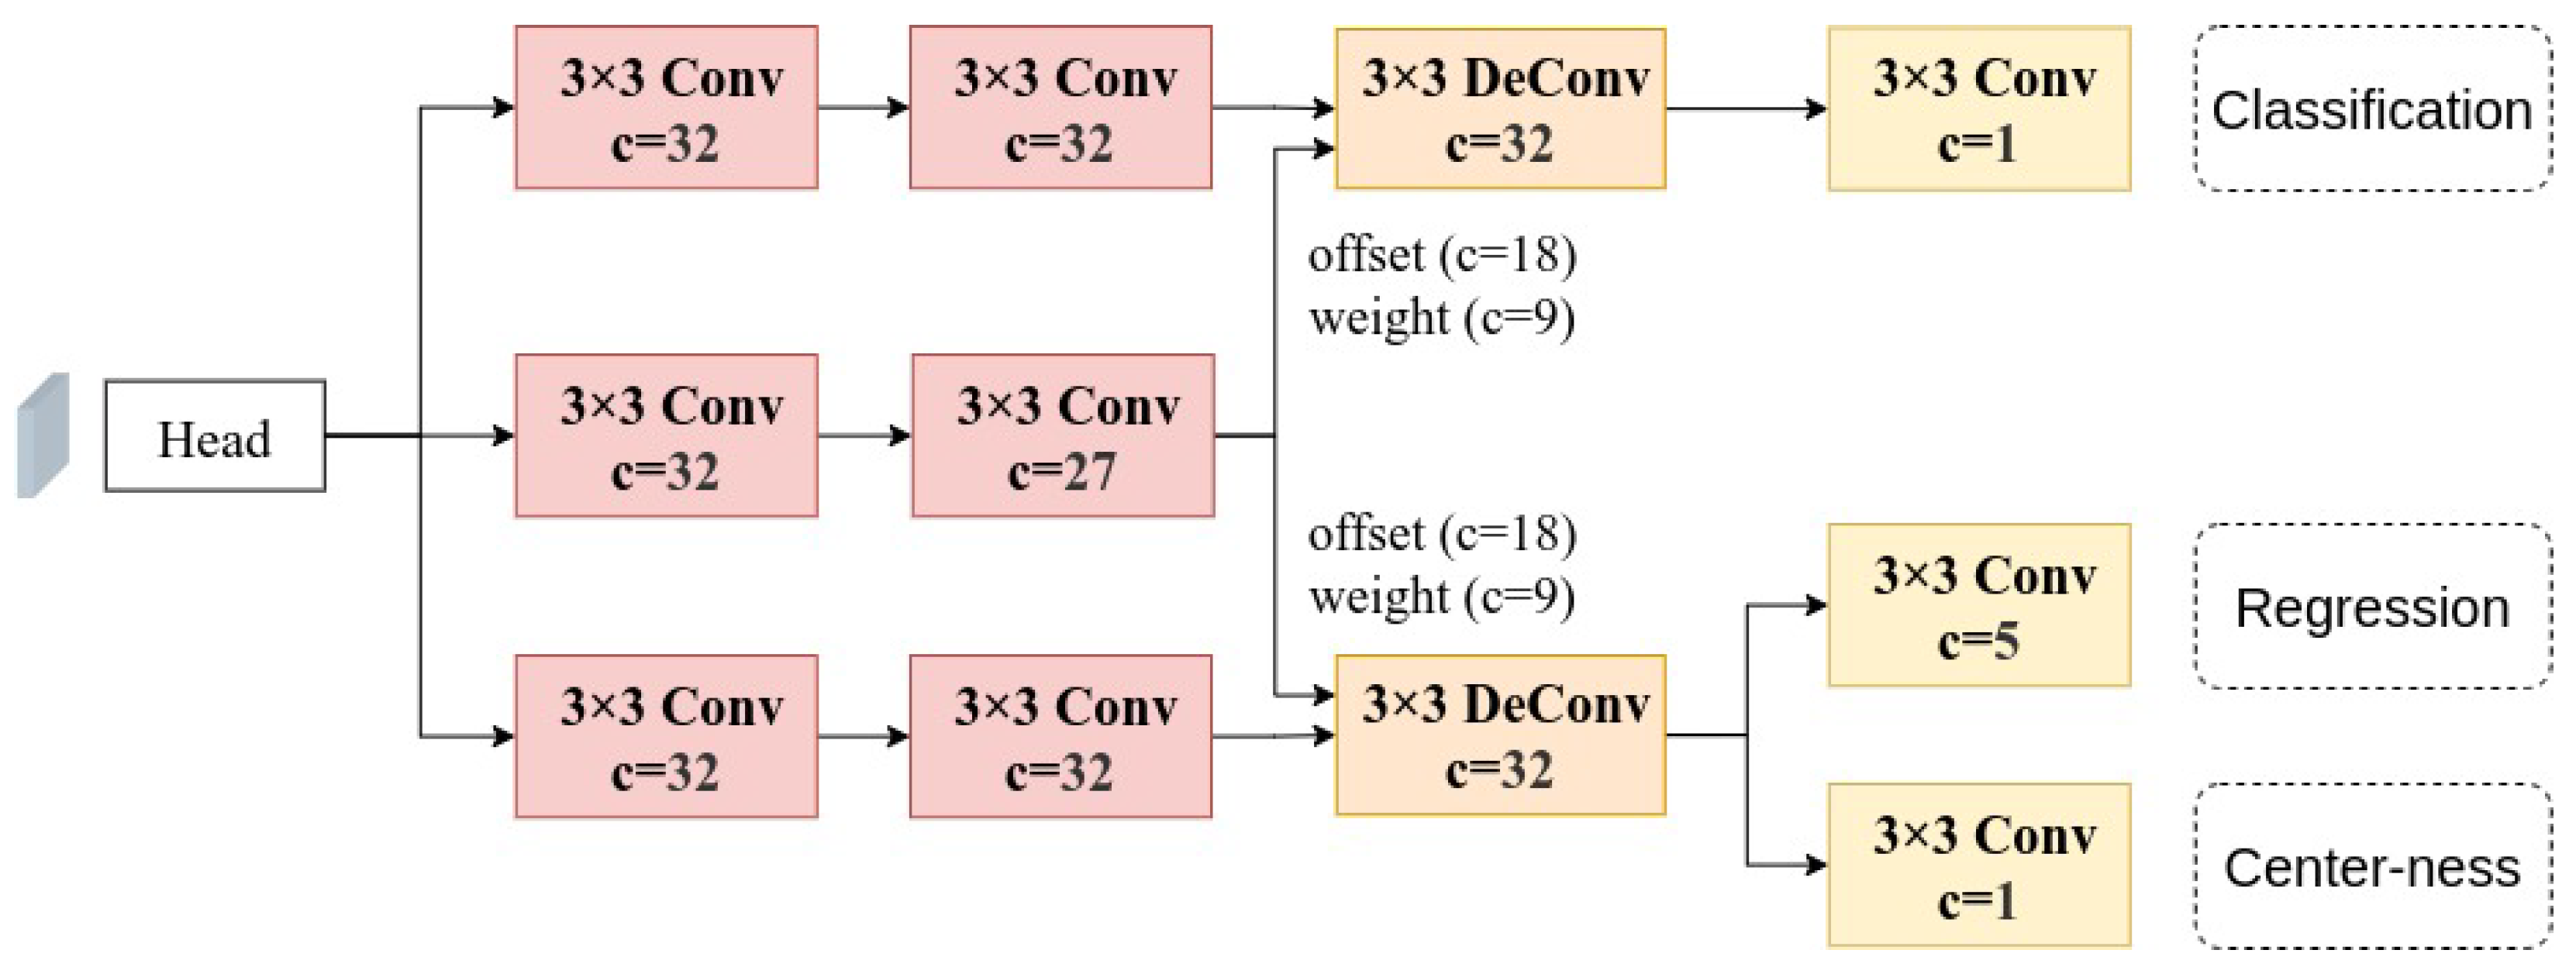
38]. This network adjusts the receptive field area for ship features in SAR images, improving the extraction of ship features. Thirdly, we design shared deformable head (SDHead), which optimizes ship feature extraction by combining deformable convolution and shared parameters. We validate the effectiveness of the proposed method using two publicly available datasets and a large-scene SAR image. Compared with other methods for detecting rotated objects, our approach achieves optimal detection accuracy while maintaining a low level of spatial and temporal complexity in the model.
The main contributions of this paper are as follows:
  • A lightweight arbitrarily oriented detector for ship detection in SAR images based on transformers and deformable features called LD-Det is proposed. LD-Det is a hybrid structure of a transformer and a CNN, introducing a transformer into a lightweight arbitrarily oriented ship detection approach for SAR images for the first time. LD-Det achieves state-of-the-art detection performance when compared with other lightweight methods for detecting rotated targets.
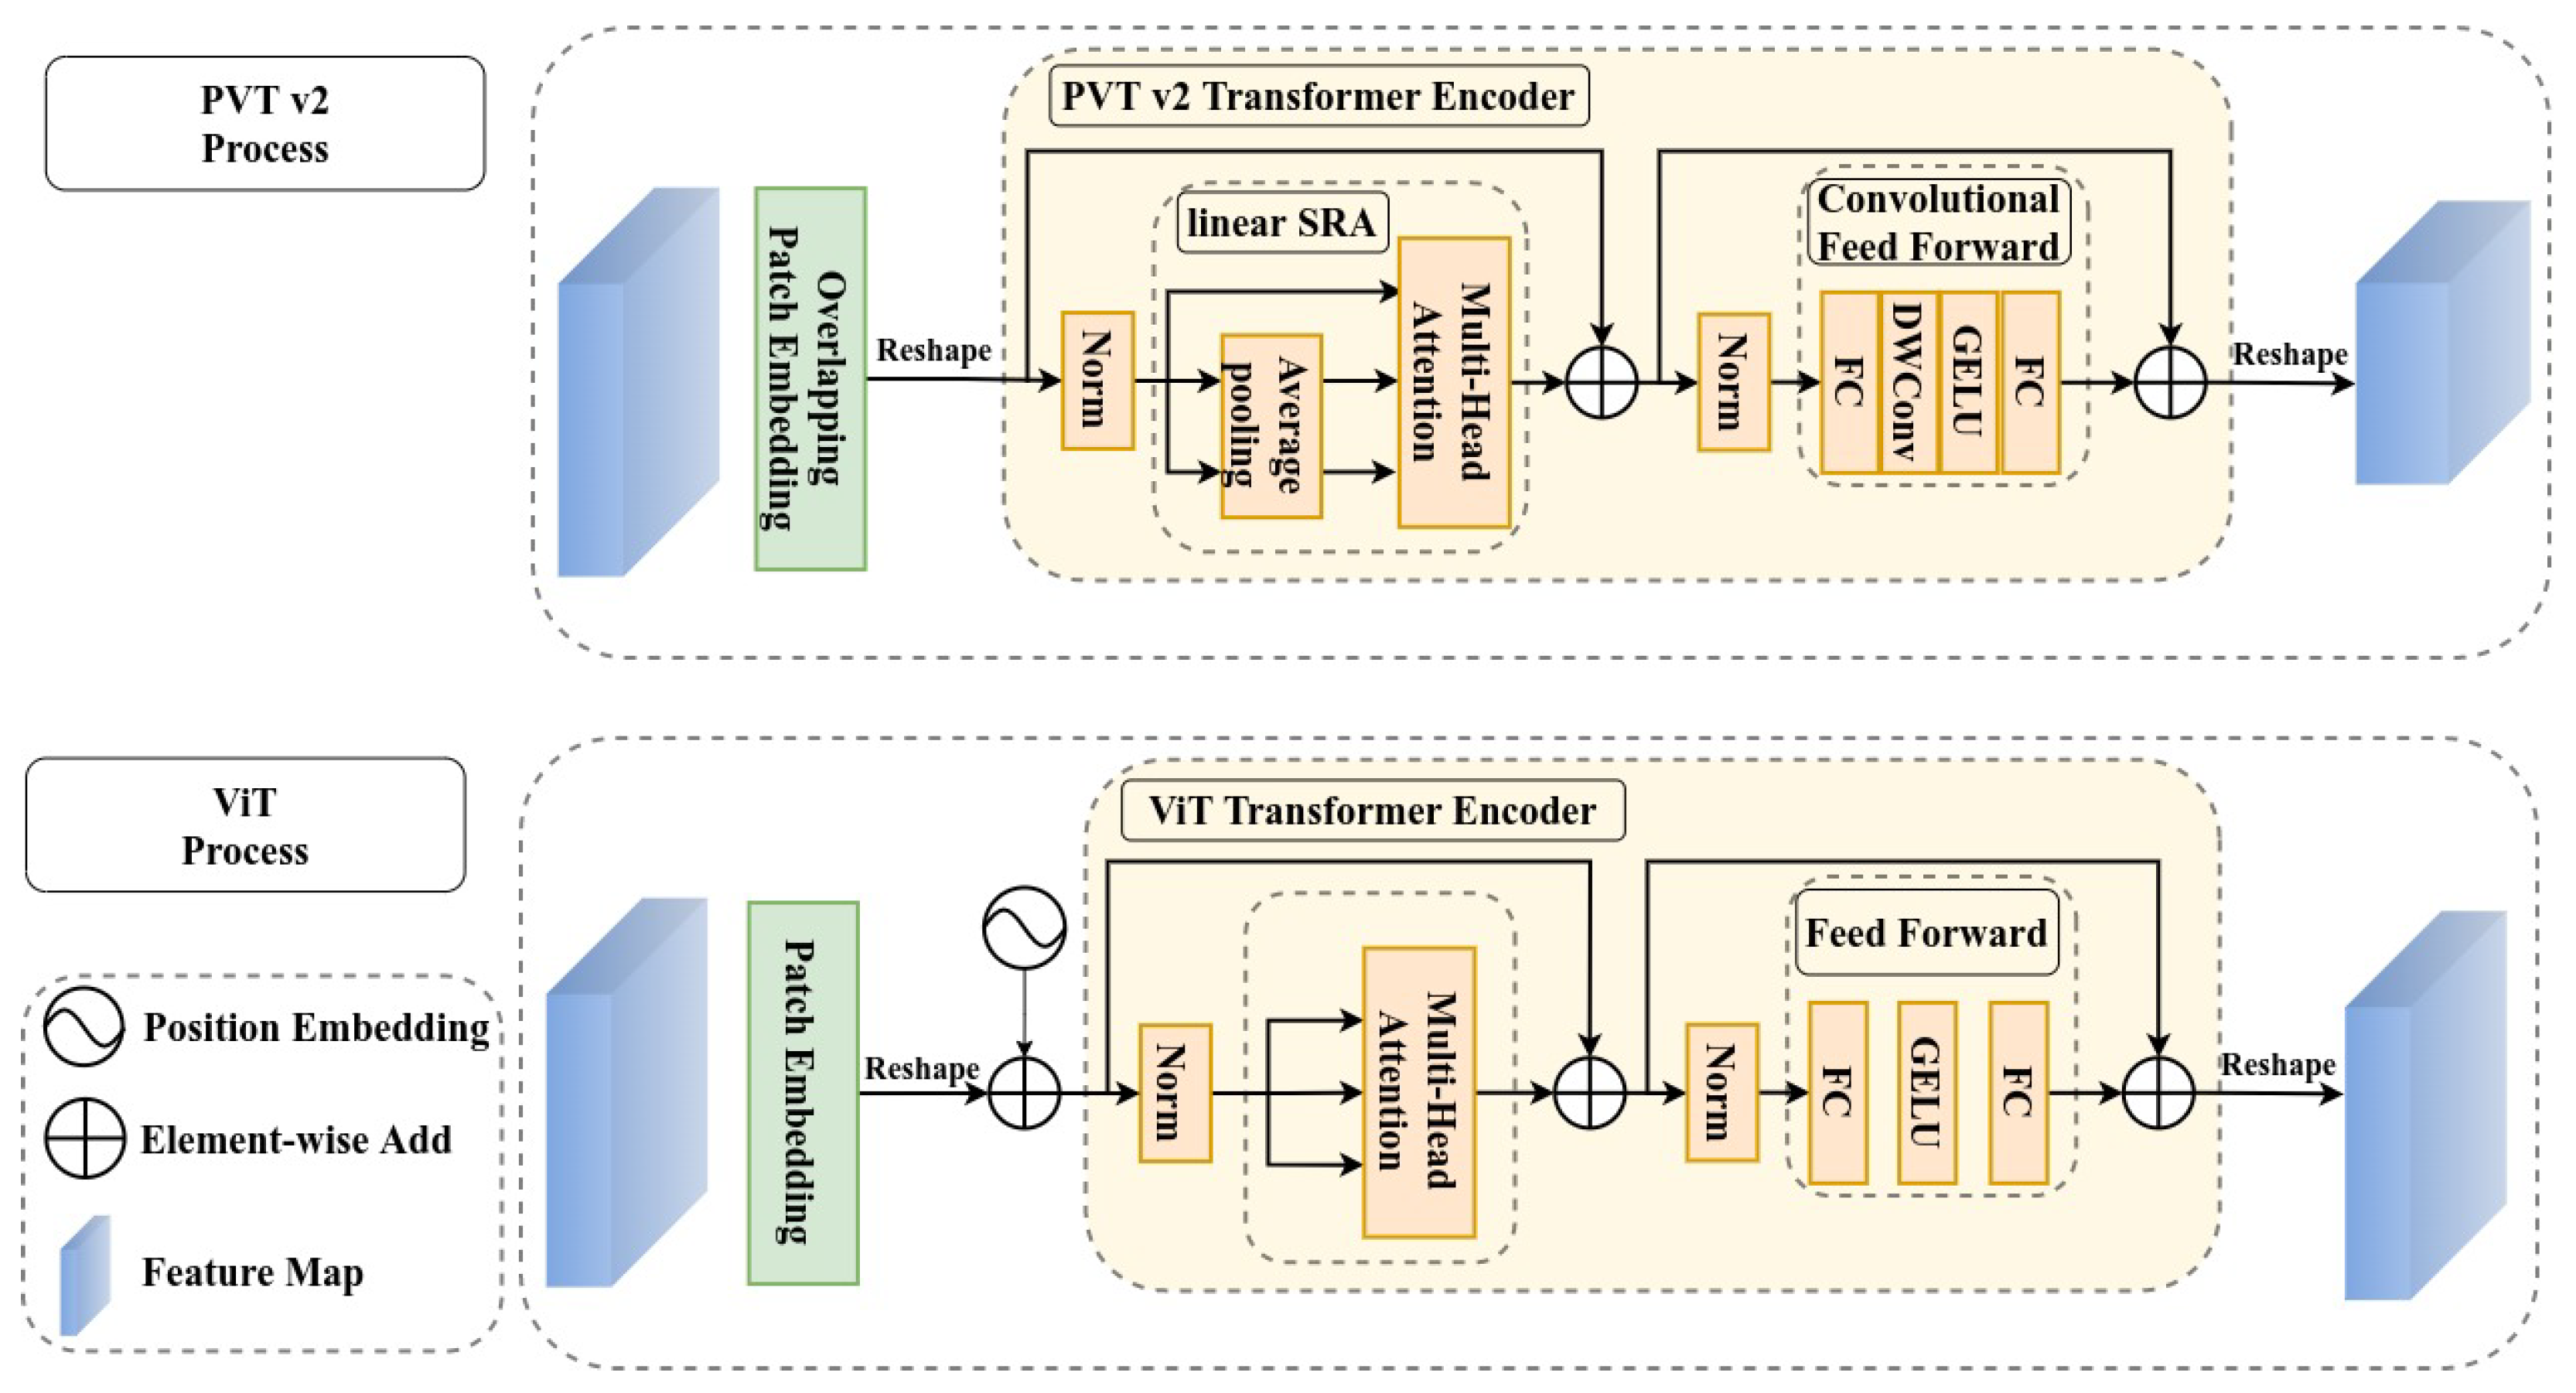
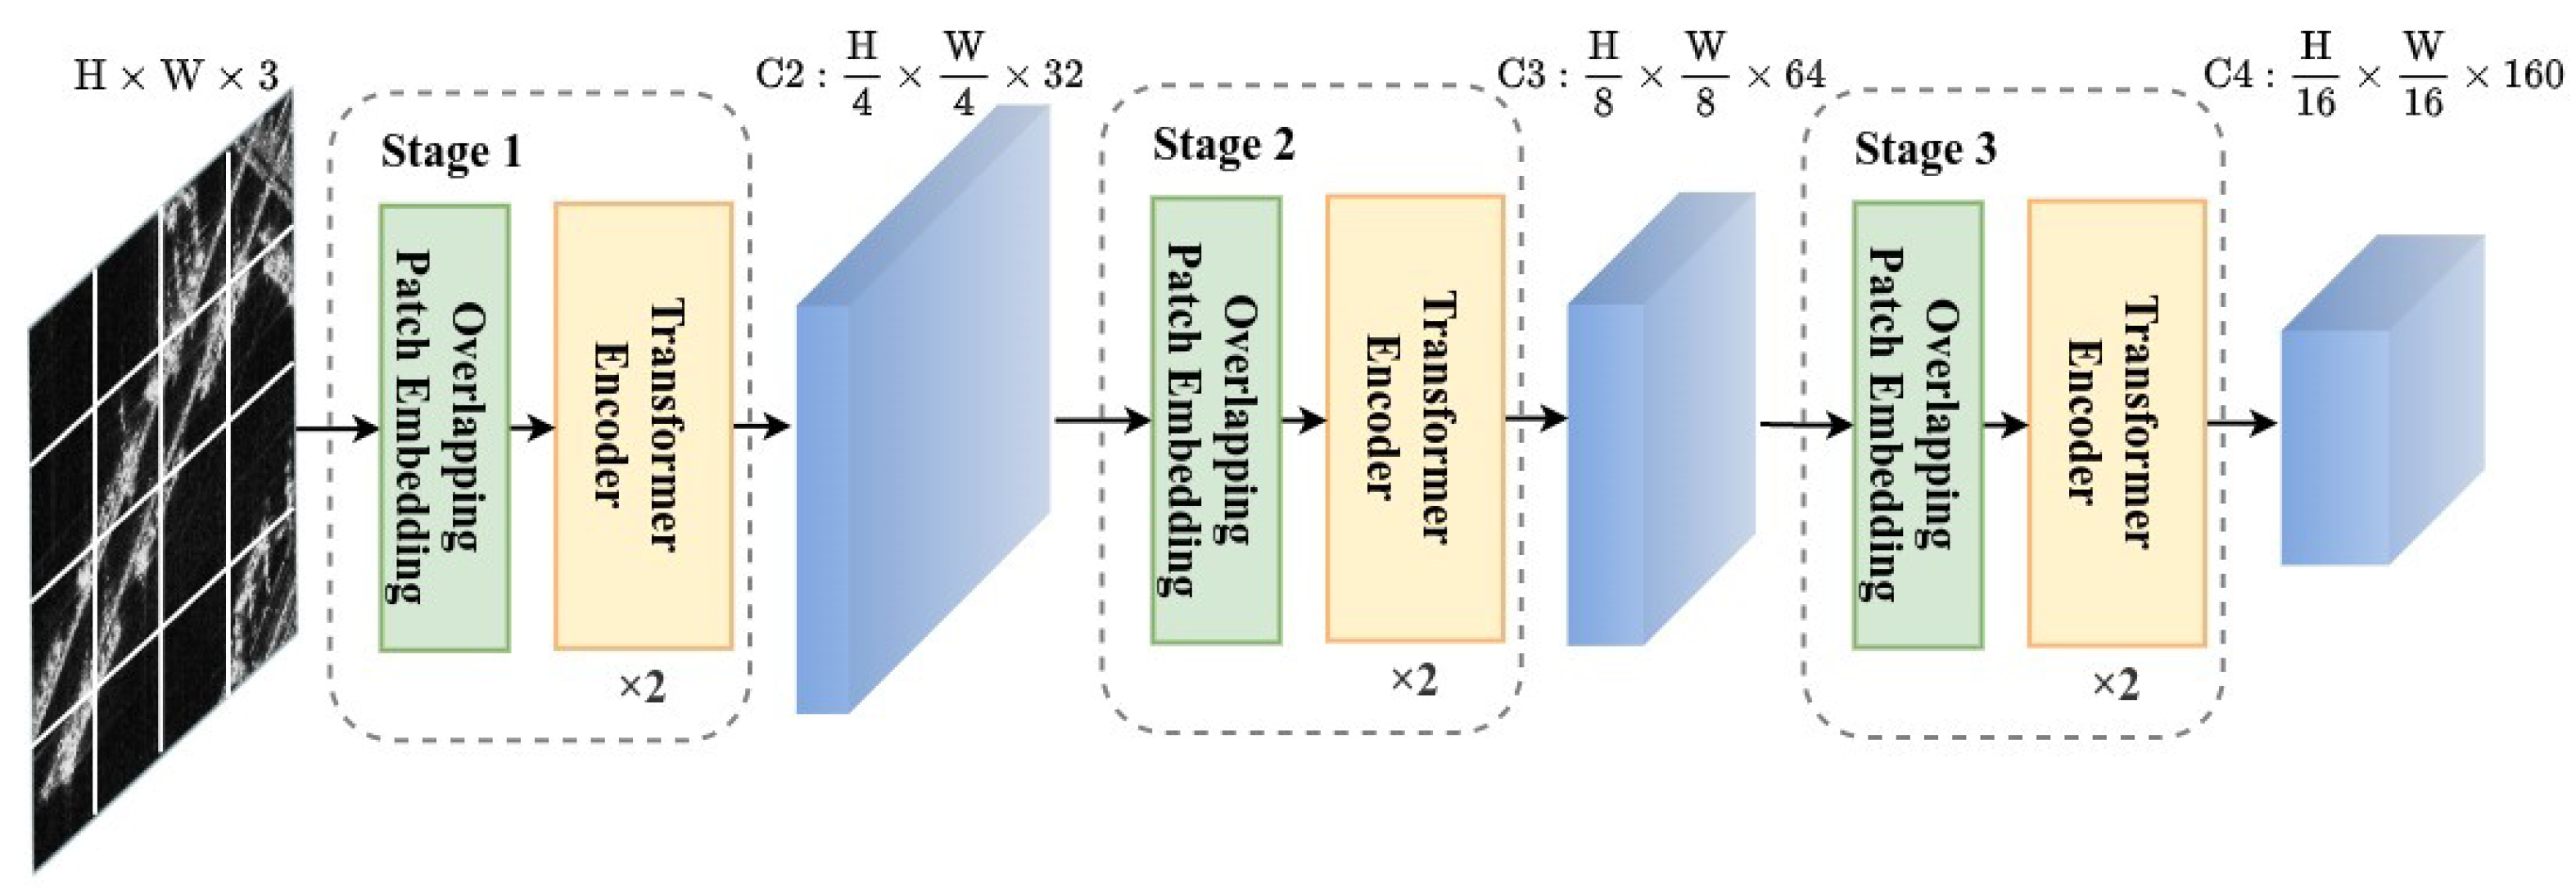
  • Firstly, we introduce light pyramid vision transformer (LightPVT) by modifying PVT v2-B0-Li and discarding the highest-level feature map. This modification results in a lightweight backbone network capable of capturing long-range dependencies of ships in SAR images. We then propose multi-scale deformable feature pyramid network (MDFPN), which incorporates our proposed multi-scale deformable convolution (MDC) module into two positions of the FPN. This allows the detector to adjust the receptive field regions for ship features in SAR images and improve the extraction of ship features. Finally, we present shared deformable head (SDHead), which combines deformable convolution and shared parameter structure design to optimize the feature extraction of ships.
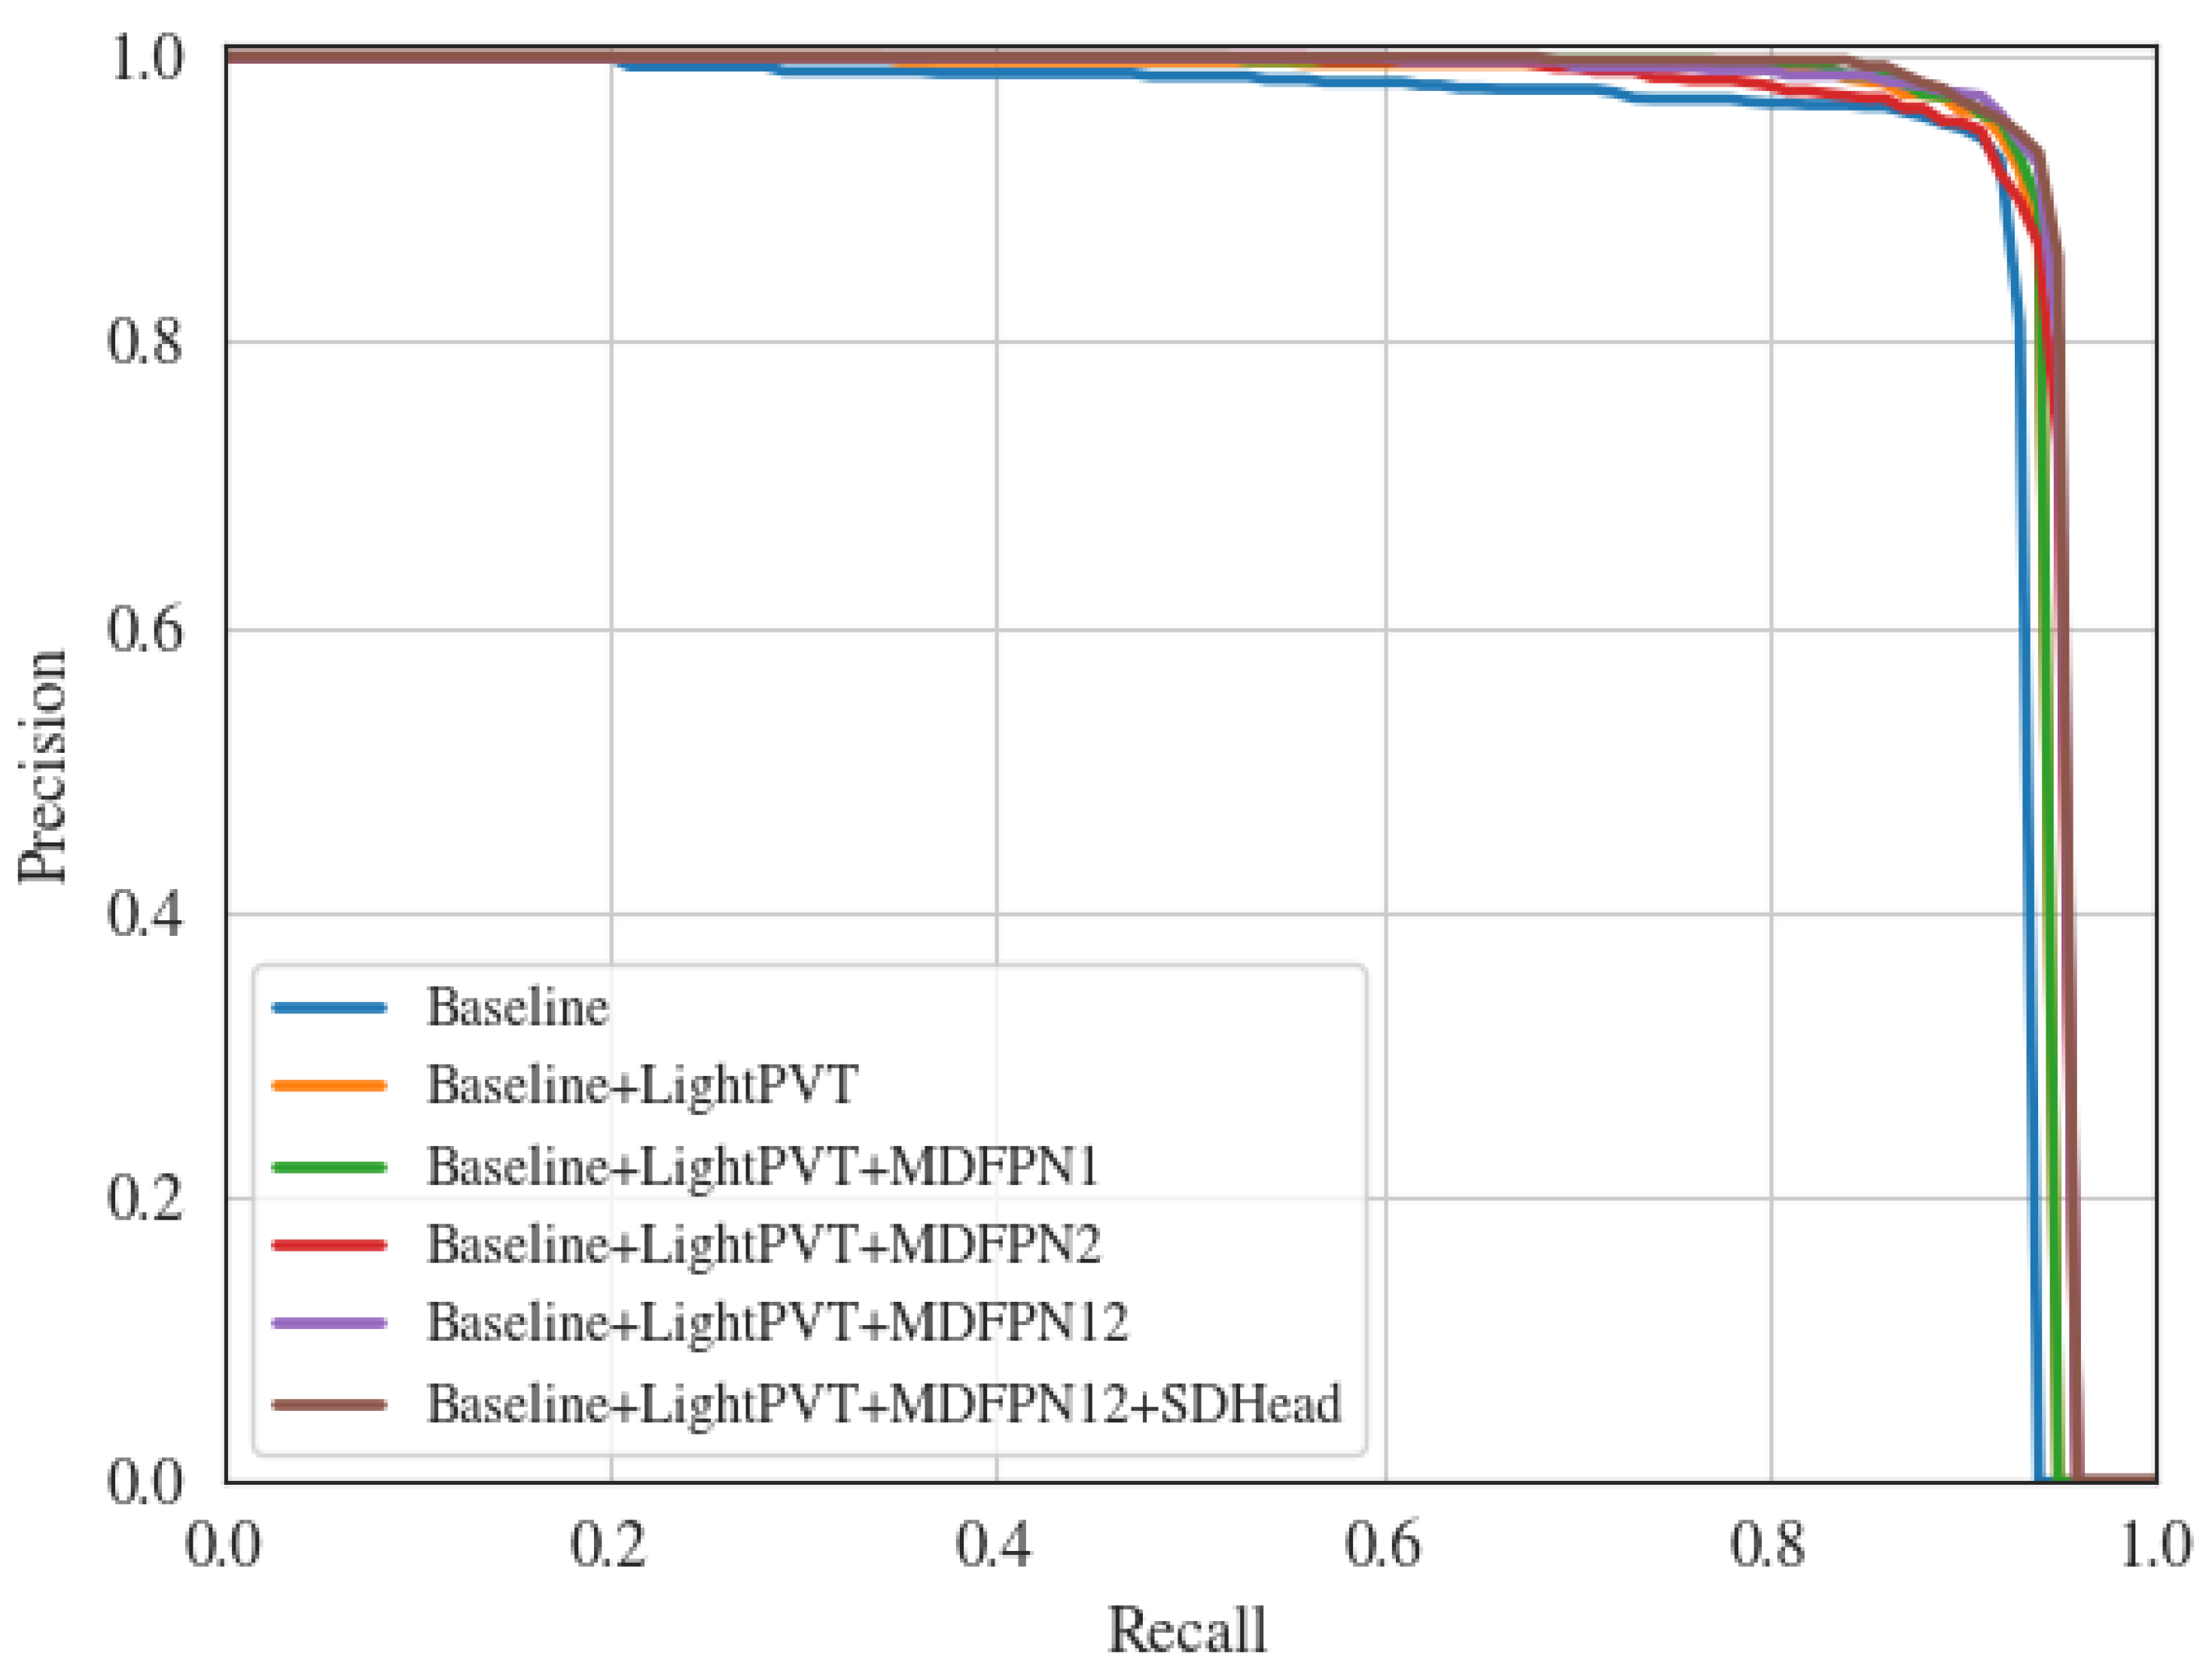
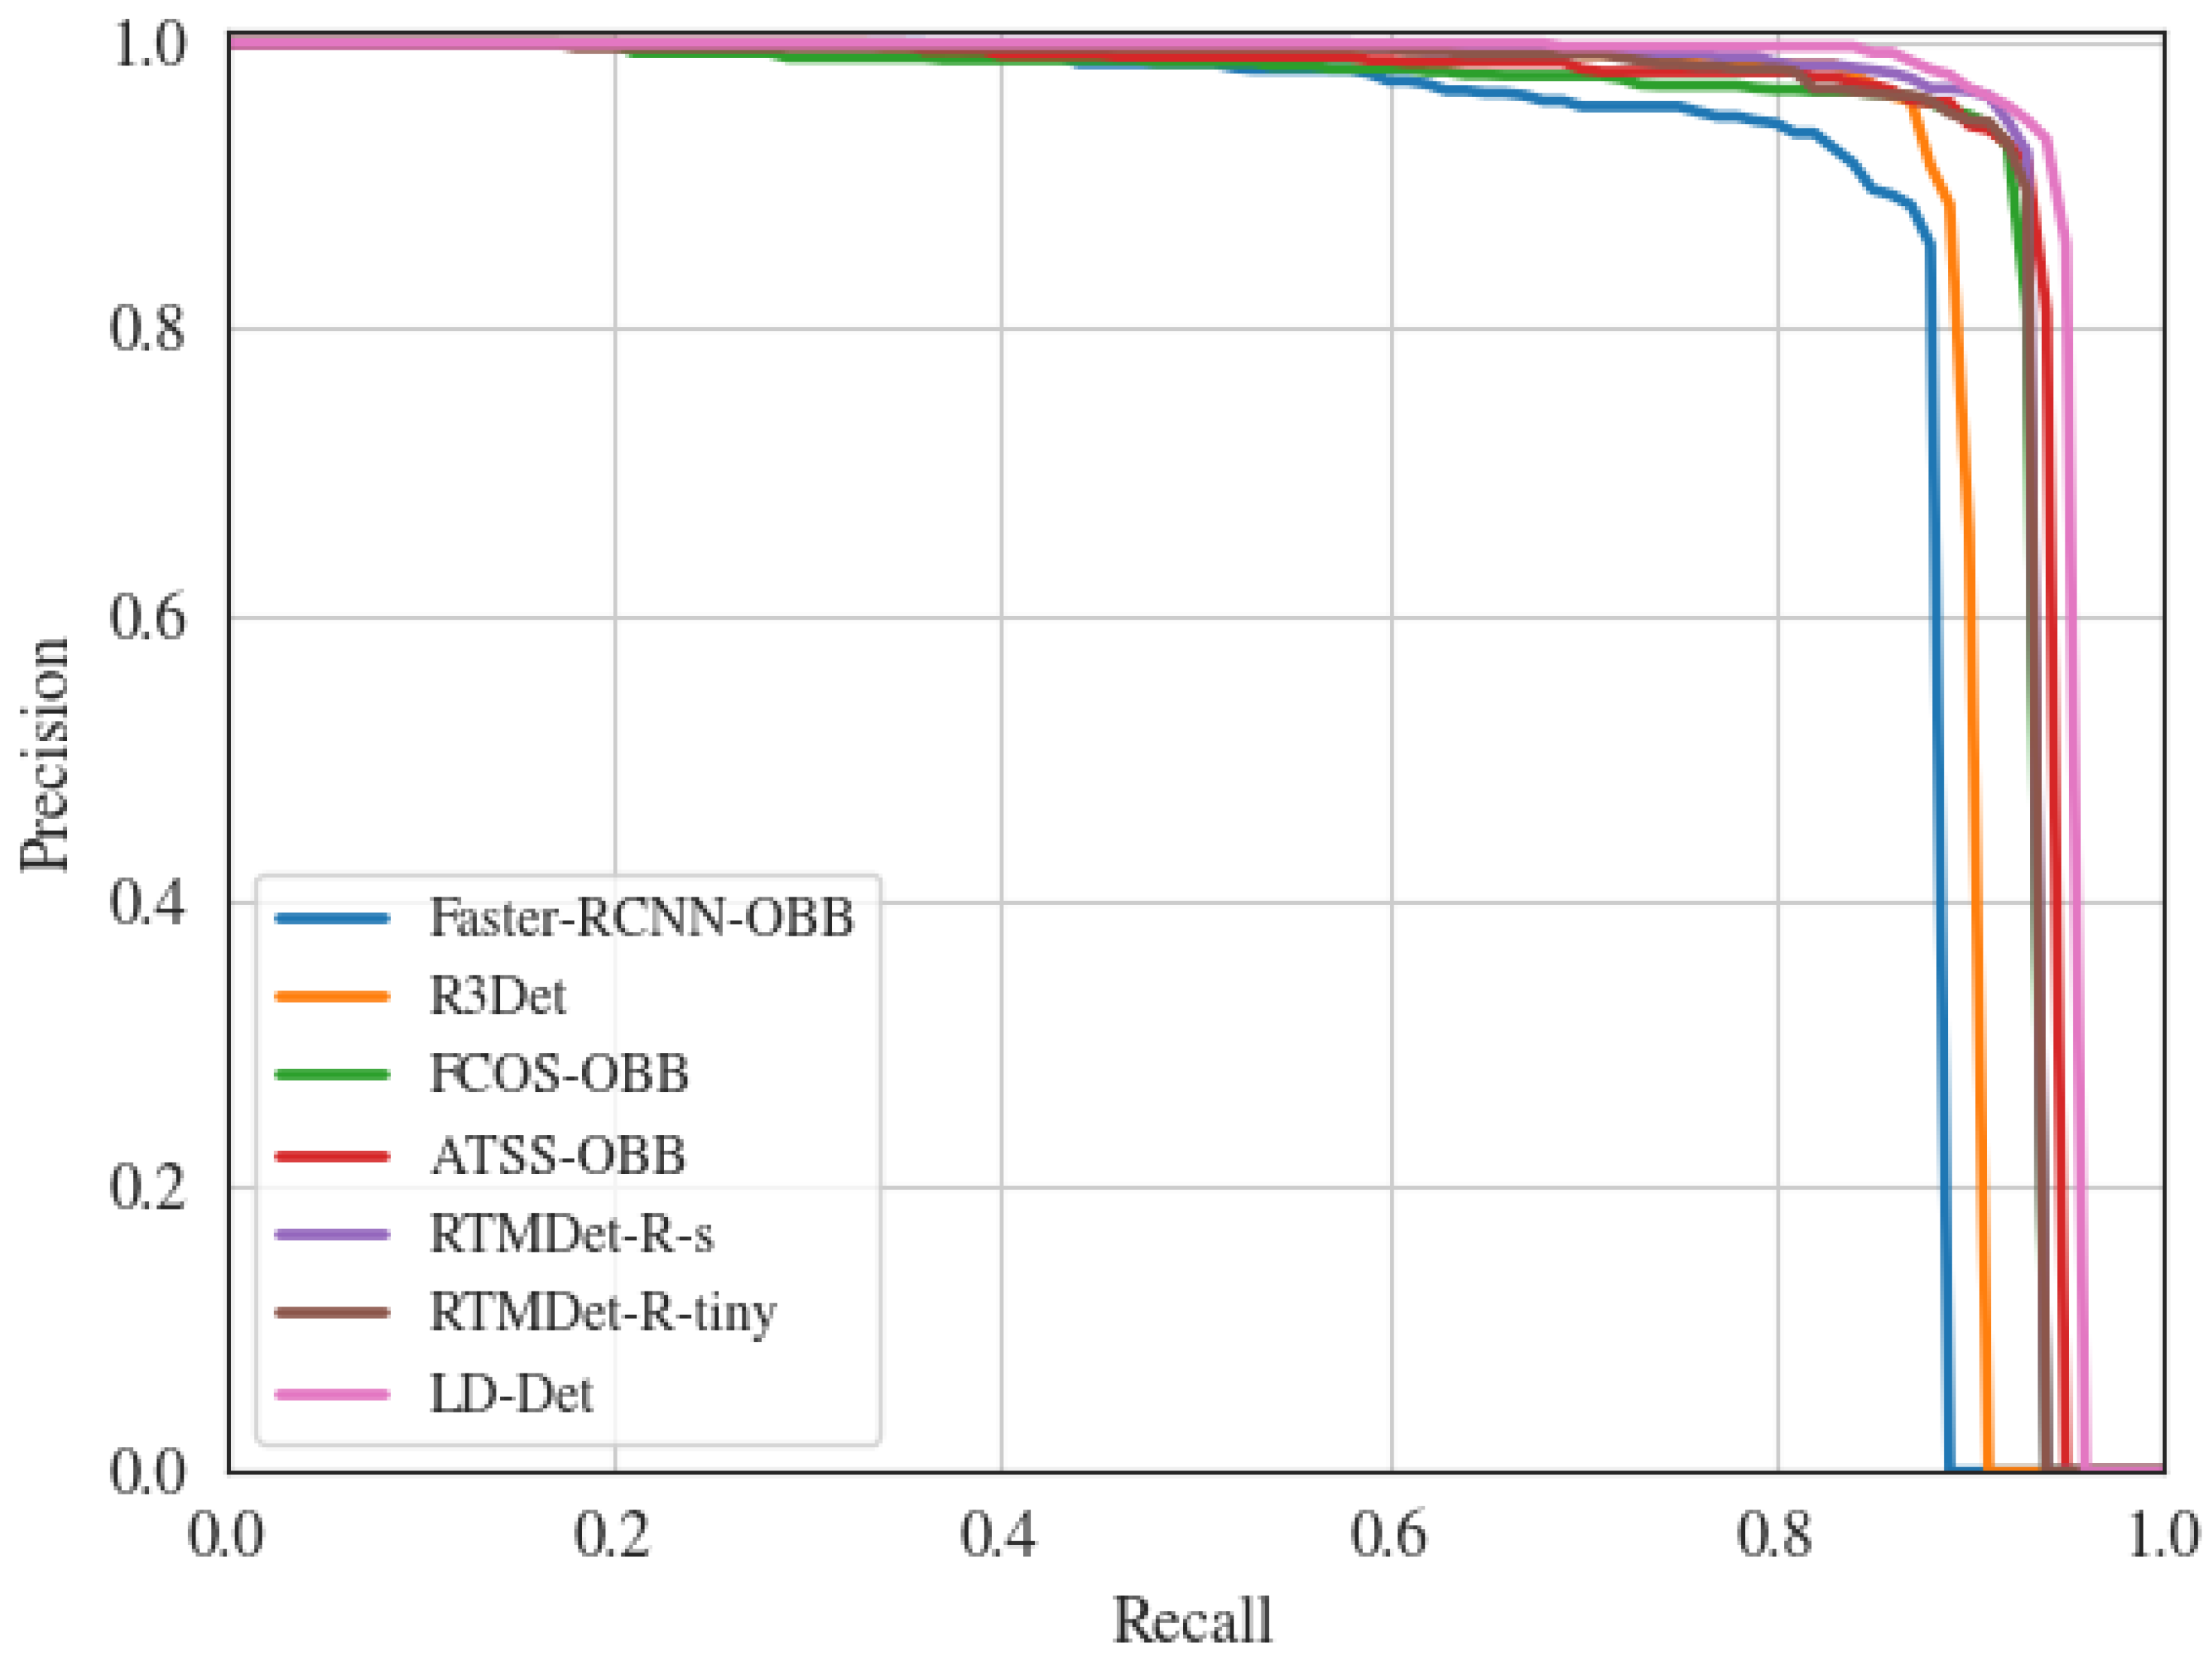
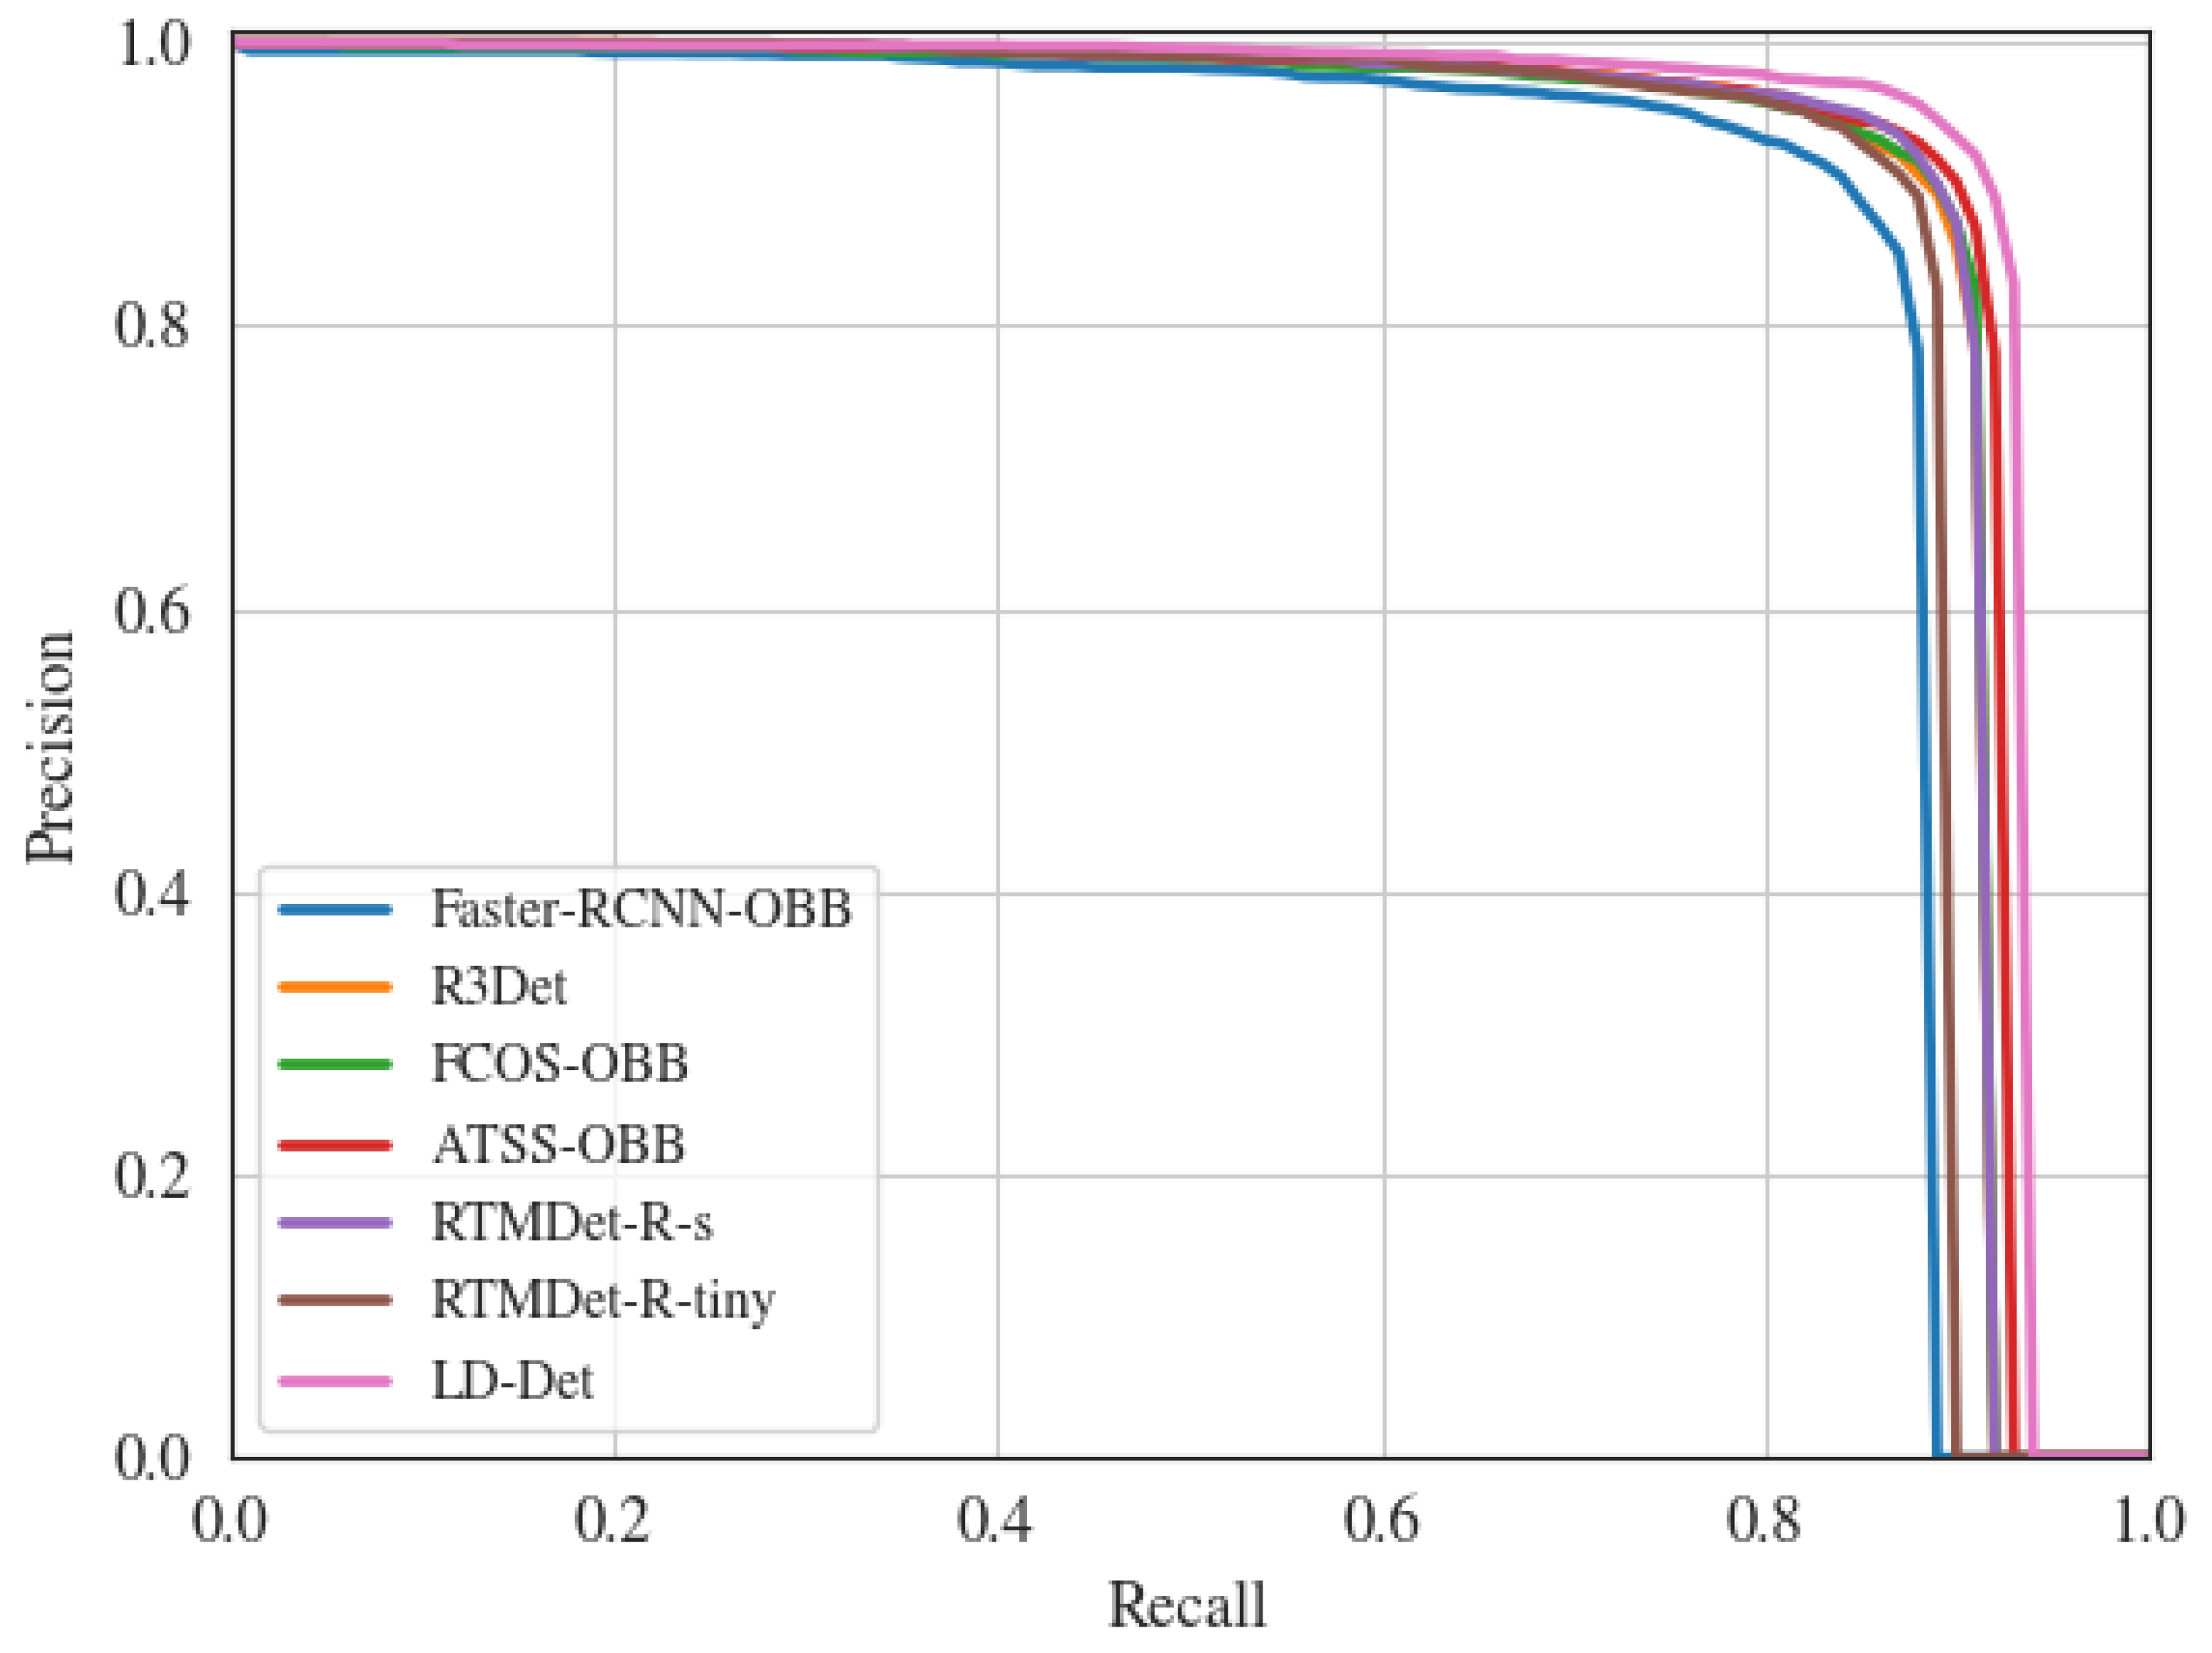
  • Extensive experiments on SAR ship detection dataset (SSDD) and rotated ship detection dataset in SAR images (RSDD-SAR) are conducted to demonstrate the effectiveness of our proposed modules. The comparative analysis with other arbitrarily oriented object detection methods shows that LD-Det achieves optimal performance.
The remaining parts of this paper are as follows: In Section 2, the proposed method is described in detail. In Section 3, extensive experiments are conducted with the proposed method. In Section 4, the impact of the three proposed modules is discussed. In Section 5, a conclusion is summarized.

2. Methodology

2.1. Overall Architecture

This article introduces an algorithm for ship detection called LD-Det, and the overall architecture of the algorithm is presented in Figure 1. The backbone network employed is called LightPVT and is based on PVT v2-B0-Li, excluding the topmost feature map. The resulting feature maps are denoted by {C2, C3, C4}, represented by blue cubes. The neck network proposed is called MDFPN. Initially, a new feature map is obtained by passing feature map C4 through the newly proposed MDC module. Next, lateral connections are used to adjust these feature maps to {M2, M3, M4}, ensuring they have the same number of channels, as depicted by the orange cubes. Another instance of MDC is introduced in the neck network, and feature fusion is performed with the FPN. Finally, output feature maps {P2, P3, P4} are obtained through convolution operations, represented by the green cubes. The head network is referred to as SDHead, which optimizes the extraction of feature maps by incorporating deformable convolution (DC) operations and new structural designs. The loss function comprises three components: classification, regression, and centerness.

2.2. Light Pyramid Vision Transformer (LightPVT)

Recently, transformers have made significant advancements in various fields. The introduction of vision transformer (ViT) [39] expands the use of transformers beyond natural language processing into computer vision. ViT outperforms many CNN-based algorithms in image classification and has also made significant contributions to the progress of downstream tasks such as object detection, semantic segmentation, and instance segmentation.
Pyramid vision transformer (PVT) [40] is the first fully transformer-based backbone network specifically designed for object detection tasks. Unlike previous designs, PVT adopts a hierarchical design based on ViT, utilizing multiple independent transformer encoders without convolution operations. To address the challenge of high computational complexity, PVT v2 [41] was proposed. PVT v2 introduces several modifications in comparison to ViT, as illustrated in Figure 2. Firstly, PVT v2 incorporates an overlapping patch embedding layer, utilizing convolution with zero padding to extract overlapped features for richer detailed information. Additionally, through parameter adjustments, PVT v2 reduces the length and width of feature maps while the length and width of the feature map remain unchanged in ViT. Secondly, PVT v2 implements a linear spatial reduction attention (SRA) layer by utilizing average pooling to decrease spatial dimensions and minimize computational costs. Lastly, PVT v2 employs a convolutional feed-forward layer, adding a 3 × 3 depth-wise convolution operation between the first fully connected (FC) layer and GELU, while also removing the position embedding.
PVT v2 offers various network structures with different parameters. To fulfill the requirements of lightweight and high-speed performance, we have selected PVT v2-B0-Li as the backbone network for our proposed method. PVT v2-B0-Li is divided into four stages, each comprising an overlapping patch embedding layer and two transformer encoder layers. The overlapping patch embedding layer halves the length and width of the feature map while increasing the number of channels, creating a pyramid structure. Table 1 presents the specific parameter settings of PVT v2-B0-Li. In Stage i (i = 1, 2, 3, 4), the parameter settings are as follows: S i represents the overlapping patch embedding layers’ stride; C i denotes the output channels’ number; P i signifies the linear SRA’s adaptive average pooling size; N i denotes the effective self-attention heads’ number; E i represents the convolutional feed-forward layer’s expansion ratio; and L i denotes the transformer encoder layers’ number. Consequently, the output feature map of the PVT v2-B0-Li backbone network consists of {C2, C3, C4, C5}.
The utilization of a pyramid structure in PVT v2-B0-Li results in a decrease in the length and width of the feature map as the number of stages increases, while the number of channels increases. The larger receptive field of the C5 layer in the feature map includes more ship information about large-scale objects, but it may lead to the loss of detailed features of small-scale objects. Considering that the sizes of ships in SAR images are mostly small and for the purpose of reducing computational cost, we discard the C5 layer of PVT v2-B0-Li and name it LightPVT. Finally, the output feature maps of the LightPVT backbone network consist of {C2, C3, C4}, as shown in Figure 3.

2.3. Multi-Scale Deformable Feature Pyramid Network (MDFPN)

Ships in SAR images exhibit distinct characteristics compared with those in natural scene images. Firstly, ship targets in SAR images possess multi-scale features, which researchers typically capture using the FPN [38]. However, the FPN employs a simple element-wise addition or concatenation of features in the channel dimension, resulting in a rudimentary operation. To address this limitation, the atrous spatial pyramid pooling (ASPP) module [42] leverages parallel atrous rates to capture multi-scale target features effectively. Secondly, ships tend to have a larger aspect ratio compared with other targets. The conventional approach employed by researchers involves using standard convolution operations that sample the input feature map with a fixed receptive field. However, current approach is inadequate in meeting the precise requirements for SAR ship detection and lacks the ability to dynamically adjust the size of the receptive field for accurate positioning. Deformable convolution (DC) [43,44] offers a solution to this issue. By featuring a receptive field that can automatically adapt its shape, deformable convolution enables sampling positions that more closely align with the shape of objects. In conclusion, to enhance the extraction of ship features from SAR images, we propose multi-scale deformable feature pyramid network (MDFPN) with a neck network. To minimize computational costs, we set the channel number of each convolutional layer in MDFPN to 32.
Firstly, by incorporating the distinctive characteristics of ASPP and DC, we propose the multi-scale deformable convolution (MDC) module, as visually presented in Figure 4. The MDC module comprises three deformable convolution operations with varying atrous rates, accompanied by a residual connection. Initially, the input feature map undergoes three deformable convolution operations with kernel size of 3 × 3, employing atrous rates of 1, 2, and 3, correspondingly. Subsequently, the resulting feature maps are concatenated using the concat operation and are subjected to a convolution with kernel sizes of 1 × 1 to adjust the channel dimensions. Finally, the obtained feature maps are element-wise added to the input feature map, forming a residual connection that yields the output feature map.
Next, To illustrate the application of MDC, we conduct experiments on two positions in the neck network, as depicted in Figure 5. In order to highlight the relevant operations of MDC, we reduce the emphasis on the operations of the FPN. Firstly, to enhance ship information in deep feature maps, we introduce MDC at position 1 between feature maps C4 and M4. Secondly, to improve multi-scale ship information, we introduce MDC at position 2 between feature maps M and P. Specifically, we resize M3 and M4 using linear interpolation to match the size of M2. These three feature maps are then summed up and input into MDC. Subsequently, different degrees of pooling are applied to the output feature map of MDC, followed by element-wise addition with the three feature layers output by the FPN. This produces the final output of the neck network. In summary, the process of the MDFPN neck network can be defined using the following equations:
C l = M D C ( C l ) , l = 4
M l = C o n v 1 × 1 ( C l ) , l = 2 , 3 , 4
R l = M D C ( M l ) , l = 2 , 3 , 4
M l = M l + U p s a m p l e ( M l + 1 ) , l = 2 , 3
R l = M l + D o w n s a m p l e ( R l ) , l = 2 , 3 , 4
P l = C o n v 3 × 3 ( R l ) , l = 2 , 3 , 4
where C o n v 1 × 1 and C o n v 3 × 3 designate convolutional layers with kernel sizes of 1 × 1 and 3 × 3 , respectively. M D C denotes the parameter passing process through the MDC module. U p s a m p l e represents nearest-neighbor interpolation, while D o w n s a m p l e represents max pooling. Finally, the output feature maps of the MDFPN neck network are {P2, P3, P4}.

2.4. Shared Deformable Head (SDHead)

As previously mentioned, ship targets in SAR images often exhibit a large aspect ratio. In the design of the head network, we draw inspiration from deformable convolution and introduce shared deformable head (SDHead), as shown in Figure 6. In comparison to the head network of FCOS [45], one common feature is the shared network settings for different feature layers. Additionally, SDHead incorporates several targeted settings, which are described as follows. Each layer of the head network is composed of two branches: one for predicting the classification task, and another for predicting the regression and centerness tasks, with the inclusion of an additional task to predict the angle merged into the regression task. The input feature map undergoes processing through two branches. Each branch passes through two 3 × 3 convolutional layers with 32 channels, and the results are used as the input feature map for the deformable convolutional layers. Furthermore, the input feature map is passed through a 3 × 3 convolutional layer with 32 channels, as well as another 3 × 3 convolutional layer with 27 channels, in order to predict the learnable offsets and modulation scalars for different sampling points. The obtained results are utilized as the input offsets and input weights for the deformable convolutional layers in the two branches. Lastly, the feature map is individually subjected to 3 × 3 convolutional layers with 1, 5, and 1 channels in order to correspond to the classification task, regression task, and centerness task.

2.5. Loss Function

The loss function in the entire training process comprises classification loss, regression loss, and centerness loss. The specific formula is as follows:
L o s s = 1 N p o s L c l s + λ 1 N p o s L r e g + λ 2 N p o s L c t r n e s s
where L c l s denotes the classification loss and L c t r n e s s signifies the centerness loss, adhering to the design of the FCOS algorithm, which utilizes the focal loss function [46] and cross-entropy loss function [47], respectively. L r e g represents the regression loss, wherein the task of predicting angles is incorporated into the regression task, necessitating the use of the rotated IoU loss function [48]. Moreover, N p o s represents the number of positive samples. λ 1 and λ 2 represent the balance weights for L r e g and L c t r n e s s , both defaulting to 1.

3. Experiments

3.1. Datasets

This study utilized two publicly available datasets, namely, SSDD [16,49] and RSDD-SAR [50].
SSDD is the pioneering openly accessible dataset for ship detection in SAR images and has been published in two distinct versions. The version released in 2021, which includes uniform OBB annotations, was selected for experiments. The dataset contains 1160 images, with a total of 2456 ships. The dataset covers a wide range of resolutions, image sizes, and polarization modes. To maintain consistency, all input images were uniformly adjusted to a size of 500 × 350 pixels prior to training. Furthermore, the images were randomly divided into a training set and a test set in an 8:2 ratio. SSDD is frequently employed as a fundamental tool for assessing the performance of various methods in ship detection using SAR images. For additional details, please consult Table 2.
RSDD-SAR is another ship dataset that specifically concentrates on OBB annotations in SAR images. This dataset encompasses 7000 images and includes a total of 10,263 ships. The dataset covers a variety of resolutions, polarization modes, and imaging modes. To promote consistency, the input image size was set to 512 × 512 pixels, and subsequently, the images were randomly divided into a training set and a test set in a 5:2 ratio. This dataset allows for testing the generalization capability of the proposed model and evaluating ship detection performance based on OBB annotations. For more information, please refer to Table 2.

3.2. Experimental Settings

For model training using SSDD, there were 120 epochs, and the learning rate was decreased by a factor of 10 at the 60th, 90th, and 110th epochs. For model training using RSDD-SAR, there were 36 epochs, and the learning rate was decreased by a factor of 10 at the 24th and 33rd epochs. The AdamW optimizer was utilized in the experiments involving the proposed methods. The initial learning rate was 0.0001; the weight decay was 0.0005; and the batch size was 8. The hardware configuration consisted of two Nvidia GeForce RTX 3090 GPUs and an Intel Core i9-12900KF processor. The software configuration included the MMRotate [51] toolbox based on the PyTorch framework and the Ubuntu 22.04 operating system.

3.3. Evaluation Metrics

To quantitatively evaluate the performance of the proposed methods, average precision (AP), AP50, and AP75 metrics from the MS COCO evaluation metrics [52] were employed to assess the accuracy performance of the models. Additionally, parameters (Params) was employed to evaluate the space complexity of the models, and floating-point operations (FLOPs) were employed to evaluate the time complexity of the models.
Precision represents the proportion of correctly detected ship samples to all predicted positive ship samples, while recall represents the proportion of correctly detected ship samples to all annotated positive ship samples. The formulas for both are as follows:
P r e c i s i o n = T P T P + F P
R e c a l l = T P T P + F N
where TP represents true positives, or the number of correctly detected positive samples. FP represents false positives, or the number of incorrectly detected positive samples. FN represents false negatives, or the number of incorrectly detected negative samples. A precision–recall curve can be obtained by setting a specific threshold for Intersection Over Union (IoU) and plotting recall as the x-axis and precision as the y-axis.
Average precision (AP) is defined as the area under the precision–recall curve. The formula for calculating AP is provided below:
A P = 0 1 P ( R ) d R
where P represents precision, while R represents recall. In the MS COCO evaluation metrics, AP50 corresponds to the average precision for an IoU of 0.5; AP75 indicates the average precision for an IoU of 0.75; AP denotes the average precision when considering IoU ranges from 0.5 to 0.95 with a step of 0.05. Generally, a higher AP value corresponds to greater accuracy of the model being evaluated.

3.4. Ablation Experiments

Ablation experiments were conducted to validate the performance of each module in the proposed method by incrementally incorporating the proposed modules into the baseline network. Please refer to Table 3 for specific details. The FCOS(OBB) framework was utilized as the baseline network in this study, distinguishing itself from FCOS by introducing an angle branch for detecting rotated ship targets. Unless otherwise stated, the SSDD dataset was employed for performance evaluation.
According to Table 3, each module we propose contributes to the overall method’s accuracy and speed compared with the baseline network. In terms of accuracy, the addition of the proposed modules leads to varying degrees of improvement in metrics such as AP, AP50, and AP75. Specifically, there are increases of 2.2%, 3.2%, and 3.2%, respectively, demonstrating the higher accuracy of the proposed modules. As for speed, the proposed method replaces the backbone network of the baseline network from ResNet50 with LightPVT and reduces the number of channels from 256 to 32. This results in a significant decrease in the FLOPs and Params values of the proposed method. Additionally, the gradual inclusion of MDFPN and SDHead does not lead to a significant increase in the FLOPs and Params values, indicating the lightweight character of these proposed modules. Figure 7 visually illustrates the gains of each module we propose by plotting precision–recall curves of the overall method with different modules added when the IoU is 0.5.

3.5. Comparison with Other Arbitrarily Oriented Object Detection Methods

In this section, we compare LD-Det with other methods for detecting arbitrarily oriented objects on the SSDD dataset and RSDD-SAR dataset to further validate the performance of the proposed method. The alternative methods encompass general arbitrarily oriented object detection methods such as Faster R-CNN(OBB) [17], R3Det [53], FCOS(OBB) [45], and ATSS(OBB) [54], as well as lightweight arbitrarily oriented object detection methods such as RTMDet-R-tiny and RTMDet-R-s [55].
We conducted a quantitative analysis of various arbitrarily oriented detection methods using the SSDD dataset, and the specific detection results are presented in Table 4. The table indicates that our proposed method, LD-Det, achieved the highest values in terms of AP50, AP75, and AP, with respective scores of 94.6%, 60.5%, and 54.4%. For example, in terms of AP50, LD-Det outperformed RTMDet-R-tiny, RTMDet-R-s, and ATSS(OBB) by 2.5%, 2.1%, and 1.7%, respectively, demonstrating the superior accuracy of our proposed method. Additionally, LD-Det showcased considerably lower FLOPs and Params, 3.78 G and 2.50 M, respectively, compared with other methods. In particular, when compared with the popular lightweight method RTMDet-R-tiny, LD-Det achieved a nearly halved value for Params while maintaining similar FLOPs, thus illustrating fewer parameters in our proposed method. In summary, our proposed method achieves excellent performance by obtaining the highest accuracy in multiple metrics while keeping low spatial and temporal complexity. To visually highlight these differences, Figure 8 showcases the corresponding precision–recall curves for an IoU of 0.5, further demonstrating the advantages of LD-Det from a different viewpoint.
In order to assess the generalizability of the proposed method, we conducted an analysis of various arbitrarily oriented detection methods on the RSDD-SAR dataset. The specific detection results can be found in Table 5. It is evident from the table that the proposed method, LD-Det, consistently achieved the highest values across multiple metrics, including AP, AP50, and AP75, which correspond to 49.5%, 91.9%, and 49.3%, respectively. For instance, when considering the AP50 value, LD-Det outperformed RTMDet-R-tiny, RTMDet-R-s, and ATSS(OBB) by margins of 4.2%, 2.4%, and 1.5%, respectively, thereby providing evidence of the superior accuracy of the proposed method. Furthermore, LD-Det demonstrated the lowest values in terms of FLOPs and Params, 5.50 G and 2.50 M, respectively. These results indicate that the proposed method operates with remarkable efficiency. Figuratively, Figure 9 illustrates the corresponding precision–recall curves of these methods at an IoU value of 0.5, offering a more intuitive representation of the proposed method’s accuracy advantages when compared with other approaches.
We conducted a qualitative analysis of typical scenarios selected from the SSDD dataset to compare different methods, and the results are visualized in Figure 10. The figure showcases two offshore scenes and two inshore scenes. Figure 10a,b depict sparse and small ship targets in the open sea. In comparison, FCOS(OBB) exhibits more missed detections, while RTMDet-R-tiny has a few false alarms. Notably, LD-Det and other methods accurately detect all ship targets, demonstrating the effectiveness of our proposed method in detecting sparse and small targets in the open sea. Figure 10c displays dense and large ship targets near the coast. It is evident that all algorithms exhibit varying degrees of false alarms, highlighting the persisting challenge of detecting dense targets near the coast in SAR images. On the other hand, LD-Det exhibits a number of false alarms comparable to that of other methods, implying a similar anti-interference ability. However, there is still room for improvement. Figure 10d presents additional dense and large ship targets near the coast. Our proposed method eliminates false alarms and missed detections, substantiating its capability to mitigate interference.
We also conducted a qualitative analysis on the RSDD-SAR dataset, and the visualization results are presented in Figure 11. The figure showcases an offshore scene and three inshore scenes. Scenes (a) and (b) captured in Figure 11 illustrate small ship targets amidst high-sea states. LD-Det successfully detected all the targets in these scenes, while other methods exhibited false alarms or missed detections for these small ship targets. This observation highlights the superior detection capability and resistance to interference of the proposed method in high-sea states compared with other methods. Scenes (c) and (d) captured in Figure 11 illustrate the presence of densely packed ship targets near the coastline. Unlike the other methods, which encountered a higher number of false alarms or missed detections, LD-Det consistently identified all the targets within these scenes, with the exception of two missed detections. This further solidifies the evidence that the proposed method outperforms other methods in terms of resistance to interference and detection capability in coastal scenes.

3.6. Experiment on a Large-Scale SAR Image

An experiment was performed in this section using a large-scale ALOS-2 SAR image to further validate the robustness of the proposed method. This image does not belong to the images in the SSDD and RSDD-SAR datasets. It encompasses both nearshore and offshore scenes, with dimensions of 10,389 × 6487 pixels and a resolution of 3 m. The image was acquired using the HH polarization mode, operating within the L-band. The model weights of the proposed method trained on the SSDD dataset were used to test this image, and the results are shown in Figure 12. The top of the figure demonstrates that the majority of ship targets in the offshore scene were successfully detected, with only one instance of false detection. Additionally, the bottom of the figure shows that there were more missed detections for small ship targets and more false detections for onshore facilities in the nearshore scene. We analyzed the reasons behind this situation. First, the nearshore scene is more complex with various artificial facilities causing interference. Second, the SSDD dataset lacks large-scale land scenes that are available for training. In summary, the proposed method accurately detects some ship targets, and further improvements are needed to enhance detection capability in complex nearshore scenes.

4. Discussion

The proposed method, LD-Det, consists of three modules: LightPVT, MDFPN, and SDHead. In the preceding sections, we conducted ablative experiments to evaluate LD-Det, compared it to other object detection methods, and validated its performance on a large-scale SAR image. This section aims to discuss the specific impact that each of these three modules has on LD-Det.

4.1. The Effect of LightPVT

In this section, we present the conducted ablation study and further discussion on LightPVT. We compared its performance with other lightweight backbone networks, such as ResNet-18, Swin-T, PVT v1-Tiny, and PVT v2-B0-Li, as shown in Table 6. In these experiments, the neck network used the FPN; the head network used the FCOS(OBB) head; and the number of channels of the convolutional layer was set to 32. Additionally, we obtained LightPVT by excluding the deepest feature layer of PVT v2-B0-Li. Analyzing the table shows that both PVT v2-B0-Li and LightPVT, which are based on PVT v2, achieved better accuracy and speed compared with other backbone networks, like ResNet-18, Swin-T, and PVT v1-Tiny. In terms of accuracy, PVT v2-B0-Li outperformed LightPVT with 0.2% and 0.1% higher performance in AP and AP50, respectively, reaching 53.0% and 93.5%. In terms of speed, LightPVT exhibited faster performance than PVT v2-B0-Li, with lower FLOPs and Params of 0.9 G and 2.43 M, respectively, achieving 2.05 G and 1.11 M. Consequently, although LightPVT made a slight sacrifice in terms of accuracy, it contributed significantly toward enhancing speed.

4.2. The Effect of MDFPN

In this section, we present the conducted ablation study and further discussion on the MDFPN. The performance disparities between the MDFPN and other neck networks, namely, FPN, PAFPN, and BiFPN, are analyzed and presented in Table 7. In these experiments, the backbone network employed was LightPVT, while the head network utilized the FCOS(OBB) head, and the number of channels in the convolutional layers was 32. The table reveals that PAFPN and BiFPN exhibited inferior performance compared with the FPN in metrics like AP50, AP75, and AP. This discrepancy can be attributed to the intricate operations within these neck networks, potentially leading to the loss of critical ship feature information and consequent detection accuracy degradation. In contrast, MDFPN consistently achieved the highest AP50, AP75, and AP scores among the neck networks, reaching 94.4%, 60.5%, and 54.3%, respectively. Furthermore, the incorporation of MDC in two specific locations of MDFPN resulted in increased FLOPs and Params values. Compared with the FPN, these values increased by 1.48 G and 1.37 M, respectively, slightly amplifying the model’s complexity but remaining within an acceptable margin.

4.3. The Effect of SDHead

In this section, we present the conducted ablation study and further discussion on SDHead. The performance differences between SDHead and the baseline network were analyzed, and the detection results are shown in Table 8. We used the FCOS(OBB) head as the baseline. In these experiments, LightPVT served as the backbone network; the FPN was employed as the neck network; and the convolutional layers had a channel count of 32. The table reveals that SDHead demonstrated improvements in metrics like AP and AP75 compared with the baseline network, with respective increases of 1.0% and 0.3%. Introducing DC also resulted in some increase in values like FLOPs and Params, with respective increases of 0.26 G and 0.03 M. Nevertheless, these changes do not impact the overall detection performance of the network.

5. Conclusions

This paper presents LD-Det, which is a lightweight arbitrarily oriented ship detector for SAR images based on transformers and deformable features. LD-Det is a hybrid model that combines transformers and CNNs, marking the first application of transformers in lightweight and arbitrarily oriented ship detection in SAR images. The method consists of three key components: LightPVT, MDFPN, and SDHead. LightPVT is a novel lightweight backbone network that captures long-range dependencies of ship targets in SAR images, providing contextual information to enhance ship detection performance. MDFPN is a neck network that incorporates the MDC module into the FPN, allowing for better adjustment of the receptive field region and the extraction of ship features from SAR images more effectively. SDHead is a head network that leverages deformable convolution and shared parameters to optimize ship feature extraction. To evaluate the proposed method, experiments were conducted on two datasets and a large-scale ALOS-2 SAR image. The results demonstrate that LD-Det achieved superior detection accuracy on arbitrarily oriented ship targets while maintaining low spatial and temporal complexity. Therefore, this method could be used for the high-speed detection of ship targets in SAR images. However, it should be noted that the adopted datasets have certain limitations, as the proposed method is only capable of ship localization and cannot distinguish among ship types. In future research, we plan to explore transformer-based high-speed methods for ship detection and classification in SAR images.

Author Contributions

Conceptualization, B.C. and H.S.; methodology, B.C.; software, B.C.; validation, B.C.; formal analysis, B.C.; investigation, B.C.; resources, F.X.; data curation, B.C.; writing—original draft preparation, B.C.; writing—review and editing, F.X.; visualization, B.C.; supervision, F.X.; project administration, H.S.; funding acquisition, H.S. All authors have read and agreed to the published version of the manuscript.

Funding

This work was supported by the National Natural Science Foundation of China under grant 62201548.

Institutional Review Board Statement

Not applicable.

Informed Consent Statement

Not applicable.

Data Availability Statement

Not applicable.

Conflicts of Interest

The authors declare no conflicts of interest.

References

  1. Moreira, A.; Prats-Iraola, P.; Younis, M.; Krieger, G.; Hajnsek, I.; Papathanassiou, K.P. A tutorial on synthetic aperture radar. IEEE Geosci. Remote Sens. Mag. 2013, 1, 6–43. [Google Scholar] [CrossRef]
  2. Greidanus, H.; Kourti, N. Findings of the DECLIMS project—Detection and classification of marine traffic from space. In Proceedings of the SEASAR 2006, Frascati, Italy, 23–26 January 2006. [Google Scholar]
  3. Brusch, S.; Lehner, S.; Fritz, T.; Soccorsi, M.; Soloviev, A.; van Schie, B. Ship Surveillance With TerraSAR-X. IEEE Trans. Geosci. Remote Sens. 2011, 49, 1092–1103. [Google Scholar] [CrossRef]
  4. Petit, M.; Stretta, J.M.; Farrugio, H.; Wadsworth, A. Synthetic aperture radar imaging of sea surface life and fishing activities. IEEE Trans. Geosci. Remote Sens. 1992, 30, 1085–1089. [Google Scholar] [CrossRef]
  5. Crisp, D.J. The State-of-the-Art in Ship Detection in Synthetic Aperture Radar Imagery; Defence Science and Technology Organisation Salisbury (Australia) Info Sciences Lab: Edinburgh, Austalia, 2004. [Google Scholar]
  6. Gao, G. Statistical Modeling of SAR Images: A Survey. Sensors 2010, 10, 775–795. [Google Scholar] [CrossRef] [PubMed]
  7. Li, L.; Du, L.; Wang, Z. Target Detection Based on Dual-Domain Sparse Reconstruction Saliency in SAR Images. IEEE J. Sel. Top. Appl. Earth Obs. Remote Sens. 2018, 11, 4230–4243. [Google Scholar] [CrossRef]
  8. Renga, A.; Graziano, M.D.; Moccia, A. Segmentation of Marine SAR Images by Sublook Analysis and Application to Sea Traffic Monitoring. IEEE Trans. Geosci. Remote Sens. 2019, 57, 1463–1477. [Google Scholar] [CrossRef]
  9. Liu, T.; Yang, Z.; Jiang, Y.; Gao, G. Review of Ship Detection in Polarimetric Synthetic Aperture Imagery. J. Radars 2021, 10, 1–19. [Google Scholar] [CrossRef]
  10. Schwegmann, C.P.; Kleynhans, W.; Salmon, B.P. Synthetic Aperture Radar Ship Detection Using Haar-Like Features. IEEE Geosci. Remote Sens. Lett. 2017, 14, 154–158. [Google Scholar] [CrossRef]
  11. LeCun, Y.; Bengio, Y.; Hinton, G. Deep learning. Nature 2015, 521, 436–444. [Google Scholar] [CrossRef]
  12. Li, J.; Xu, C.; Su, H.; Gao, L.; Wang, T. Deep Learning for SAR Ship Detection: Past, Present and Future. Remote Sens. 2022, 14, 2712. [Google Scholar] [CrossRef]
  13. Zou, Z.; Chen, K.; Shi, Z.; Guo, Y.; Ye, J. Object Detection in 20 Years: A Survey. Proc. IEEE 2023, 111, 257–276. [Google Scholar] [CrossRef]
  14. O’Shea, K.; Nash, R. An Introduction to Convolutional Neural Networks. arXiv 2015, arXiv:1511.08458. [Google Scholar]
  15. Vaswani, A.; Shazeer, N.; Parmar, N.; Uszkoreit, J.; Jones, L.; Gomez, A.N.; Kaiser, L.; Polosukhin, I. Attention is All you Need. In Proceedings of the Advances in Neural Information Processing Systems, Long Beach, CA, USA, 4–9 December 2017; Volume 30. [Google Scholar]
  16. Li, J.; Qu, C.; Shao, J. Ship detection in SAR images based on an improved faster R-CNN. In Proceedings of the 2017 SAR in Big Data Era: Models, Methods and Applications (BIGSARDATA), Beijing, China, 13–14 November 2017; pp. 1–6. [Google Scholar] [CrossRef]
  17. Ren, S.; He, K.; Girshick, R.; Sun, J. Faster R-CNN: Towards Real-Time Object Detection with Region Proposal Networks. In Proceedings of the Advances in Neural Information Processing Systems, Montreal, QC, Canada, 7–12 December 2015; Volume 28. [Google Scholar]
  18. Kang, M.; Ji, K.; Leng, X.; Lin, Z. Contextual Region-Based Convolutional Neural Network with Multilayer Fusion for SAR Ship Detection. Remote Sens. 2017, 9, 860. [Google Scholar] [CrossRef]
  19. Fu, J.; Sun, X.; Wang, Z.; Fu, K. An Anchor-Free Method Based on Feature Balancing and Refinement Network for Multiscale Ship Detection in SAR Images. IEEE Trans. Geosci. Remote Sens. 2021, 59, 1331–1344. [Google Scholar] [CrossRef]
  20. Zhao, S.; Liu, Q.; Yu, W.; Lv, J. A Single-Stage Arbitrary-Oriented Detector Based on Multiscale Feature Fusion and Calibration for SAR Ship Detection. IEEE J. Sel. Top. Appl. Earth Obs. Remote Sens. 2022, 15, 8179–8198. [Google Scholar] [CrossRef]
  21. Bai, L.; Yao, C.; Ye, Z.; Xue, D.; Lin, X.; Hui, M. A Novel Anchor-Free Detector Using Global Context-Guide Feature Balance Pyramid and United Attention for SAR Ship Detection. IEEE Geosci. Remote Sens. Lett. 2023, 20, 1–5. [Google Scholar] [CrossRef]
  22. Xia, R.; Chen, J.; Huang, Z.; Wan, H.; Wu, B.; Sun, L.; Yao, B.; Xiang, H.; Xing, M. CRTransSar: A Visual Transformer Based on Contextual Joint Representation Learning for SAR Ship Detection. Remote Sens. 2022, 14, 1488. [Google Scholar] [CrossRef]
  23. Zhou, Y.; Jiang, X.; Xu, G.; Yang, X.; Liu, X.; Li, Z. PVT-SAR: An Arbitrarily Oriented SAR Ship Detector With Pyramid Vision Transformer. IEEE J. Sel. Top. Appl. Earth Obs. Remote Sens. 2023, 16, 291–305. [Google Scholar] [CrossRef]
  24. Zhao, S.; Luo, Y.; Zhang, T.; Guo, W.; Zhang, Z. A domain specific knowledge extraction transformer method for multisource satellite-borne SAR images ship detection. ISPRS J. Photogramm. Remote Sens. 2023, 198, 16–29. [Google Scholar] [CrossRef]
  25. Zhou, Y.; Zhang, F.; Yin, Q.; Ma, F.; Zhang, F. Inshore Dense Ship Detection in SAR Images Based on Edge Semantic Decoupling and Transformer. IEEE J. Sel. Top. Appl. Earth Obs. Remote Sens. 2023, 16, 4882–4890. [Google Scholar] [CrossRef]
  26. Yu, N.; Ren, H.; Deng, T.; Fan, X. A Lightweight Radar Ship Detection Framework with Hybrid Attentions. Remote Sens. 2023, 15, 2743. [Google Scholar] [CrossRef]
  27. Yang, Y.; Ju, Y.; Zhou, Z. A Super Lightweight and Efficient SAR Image Ship Detector. IEEE Geosci. Remote Sens. Lett. 2023, 20, 1–5. [Google Scholar] [CrossRef]
  28. Jocher, G. YOLOv5 by Ultralytics. 2020. Available online: https://zenodo.org/records/7347926 (accessed on 7 September 2023).
  29. Ren, X.; Bai, Y.; Liu, G.; Zhang, P. YOLO-Lite: An Efficient Lightweight Network for SAR Ship Detection. Remote Sens. 2023, 15, 3771. [Google Scholar] [CrossRef]
  30. Zhao, C.; Fu, X.; Dong, J.; Feng, C.; Chang, H. LPDNet: A Lightweight Network for SAR Ship Detection Based on Multi-Level Laplacian Denoising. Sensors 2023, 23, 6084. [Google Scholar] [CrossRef] [PubMed]
  31. Ge, Z.; Liu, S.; Wang, F.; Li, Z.; Sun, J. YOLOX: Exceeding YOLO Series in 2021. arXiv 2021, arXiv:2107.08430. [Google Scholar] [CrossRef]
  32. Xiong, B.; Sun, Z.; Wang, J.; Leng, X.; Ji, K. A Lightweight Model for Ship Detection and Recognition in Complex-Scene SAR Images. Remote Sens. 2022, 14, 6053. [Google Scholar] [CrossRef]
  33. Xie, F.; Luo, H.; Li, S.; Liu, Y.; Lin, B. Using Clean Energy Satellites to Interpret Imagery: A Satellite IoT Oriented Lightweight Object Detection Framework for SAR Ship Detection. Sustainability 2022, 14, 9277. [Google Scholar] [CrossRef]
  34. Zhou, Y.; Jiang, X.; Chen, L.; Liu, X. GRD: An Ultra-Lightweight SAR Ship Detector Based on Global Relationship Distillation. IEEE Geosci. Remote Sens. Lett. 2023, 20, 1–5. [Google Scholar] [CrossRef]
  35. Aleissaee, A.A.; Kumar, A.; Anwer, R.M.; Khan, S.; Cholakkal, H.; Xia, G.; Khan, F.S. Transformers in Remote Sensing: A Survey. Remote Sens. 2023, 15, 1860. [Google Scholar] [CrossRef]
  36. Park, N.; Kim, S. How Do Vision Transformers Work? arXiv 2022, arXiv:2202.06709. [Google Scholar] [CrossRef]
  37. Naseer, M.M.; Ranasinghe, K.; Khan, S.H.; Hayat, M.; Shahbaz Khan, F.; Yang, M.H. Intriguing Properties of Vision Transformers. In Proceedings of the Advances in Neural Information Processing Systems, Online, 6–14 December 2021; Volume 34, pp. 23296–23308. [Google Scholar]
  38. Lin, T.Y.; Dollar, P.; Girshick, R.; He, K.; Hariharan, B.; Belongie, S. Feature Pyramid Networks for Object Detection. In Proceedings of the IEEE Conference on Computer Vision and Pattern Recognition (CVPR), Honolulu, HI, USA, 21–26 July 2017. [Google Scholar]
  39. Dosovitskiy, A.; Beyer, L.; Kolesnikov, A.; Weissenborn, D.; Zhai, X.; Unterthiner, T.; Dehghani, M.; Minderer, M.; Heigold, G.; Gelly, S.; et al. An Image is Worth 16x16 Words: Transformers for Image Recognition at Scale. arXiv 2020, arXiv:2010.11929. [Google Scholar] [CrossRef]
  40. Wang, W.; Xie, E.; Li, X.; Fan, D.; Song, K.; Liang, D.; Lu, T.; Luo, P.; Shao, L. Pyramid Vision Transformer: A Versatile Backbone for Dense Prediction Without Convolutions. In Proceedings of the IEEE/CVF International Conference on Computer Vision (ICCV), Montreal, QC, Canada, 11–17 October 2021; pp. 568–578. [Google Scholar]
  41. Wang, W.; Xie, E.; Li, X.; Fan, D.; Song, K.; Liang, D.; Lu, T.; Luo, P.; Shao, L. Pvt v2: Improved baselines with pyramid vision transformer. Comput. Vis. Media 2022, 8, 415–424. [Google Scholar] [CrossRef]
  42. Chen, L.C.; Papandreou, G.; Kokkinos, I.; Murphy, K.; Yuille, A.L. DeepLab: Semantic Image Segmentation with Deep Convolutional Nets, Atrous Convolution, and Fully Connected CRFs. IEEE Trans. Pattern Anal. Mach. Intell. 2018, 40, 834–848. [Google Scholar] [CrossRef] [PubMed]
  43. Dai, J.; Qi, H.; Xiong, Y.; Li, Y.; Zhang, G.; Hu, H.; Wei, Y. Deformable Convolutional Networks. In Proceedings of the IEEE International Conference on Computer Vision (ICCV), Venice, Italy, 22–29 October 2017. [Google Scholar]
  44. Zhu, X.; Hu, H.; Lin, S.; Dai, J. Deformable ConvNets V2: More Deformable, Better Results. In Proceedings of the IEEE/CVF Conference on Computer Vision and Pattern Recognition (CVPR), Long Beach, CA, USA, 16–20 June 2019. [Google Scholar]
  45. Tian, Z.; Shen, C.; Chen, H.; He, T. FCOS: A Simple and Strong Anchor-Free Object Detector. IEEE Trans. Pattern Anal. Mach. Intell. 2022, 44, 1922–1933. [Google Scholar] [CrossRef] [PubMed]
  46. Lin, T.Y.; Goyal, P.; Girshick, R.; He, K.; Dollar, P. Focal Loss for Dense Object Detection. In Proceedings of the IEEE International Conference on Computer Vision (ICCV), Venice, Italy, 22–29 October 2017. [Google Scholar]
  47. Sukhbaatar, S.; Bruna, J.; Paluri, M.; Bourdev, L.; Fergus, R. Training Convolutional Networks with Noisy Labels. arXiv 2014, arXiv:1406.2080. [Google Scholar] [CrossRef]
  48. Zhou, D.; Fang, J.; Song, X.; Guan, C.; Yin, J.; Dai, Y.; Yang, R. IoU Loss for 2D/3D Object Detection. In Proceedings of the 2019 International Conference on 3D Vision (3DV), Quebec City, QC, Canada, 16–19 September 2019; pp. 85–94. [Google Scholar] [CrossRef]
  49. Zhang, T.; Zhang, X.; Li, J.; Xu, X.; Wang, B.; Zhan, X.; Xu, Y.; Ke, X.; Zeng, T.; Su, H.; et al. SAR Ship Detection Dataset (SSDD): Official Release and Comprehensive Data Analysis. Remote Sens. 2021, 13, 3690. [Google Scholar] [CrossRef]
  50. Xu, C.; Su, H.; Li, J.; Liu, Y.; Yao, L.; Gao, L.; Yan, W.; Wang, T. RSDD-SAR: Rotated Ship Detection Dataset in SAR Images. J. Radars 2022, 11, 581. [Google Scholar] [CrossRef]
  51. Zhou, Y.; Yang, X.; Zhang, G.; Wang, J.; Liu, Y.; Hou, L.; Jiang, X.; Liu, X.; Yan, J.; Lyu, C.; et al. MMRotate: A Rotated Object Detection Benchmark Using PyTorch. In Proceedings of the 30th ACM International Conference on Multimedia, Lisboa, Portugal, 10–14 October 2022; Association for Computing Machinery: New York, NY, USA, 2022; pp. 7331–7334. [Google Scholar] [CrossRef]
  52. Lin, T.Y.; Maire, M.; Belongie, S.; Hays, J.; Perona, P.; Ramanan, D.; Dollár, P.; Zitnick, C.L. Microsoft COCO: Common Objects in Context. In Proceedings of the Computer Vision—ECCV 2014, Zurich, Switzerland, 6–12 September 2014; pp. 740–755. [Google Scholar]
  53. Yang, X.; Yan, J.; Feng, Z.; He, T. R3Det: Refined Single-Stage Detector with Feature Refinement for Rotating Object. Proc. AAAI Conf. Artif. Intell. 2021, 35, 3163–3171. [Google Scholar] [CrossRef]
  54. Zhang, S.; Chi, C.; Yao, Y.; Lei, Z.; Li, S.Z. Bridging the Gap Between Anchor-Based and Anchor-Free Detection via Adaptive Training Sample Selection. In Proceedings of the IEEE/CVF Conference on Computer Vision and Pattern Recognition (CVPR), Seattle, WA, USA, 13–19 June 2020. [Google Scholar]
  55. Lyu, C.; Zhang, W.; Huang, H.; Zhou, Y.; Wang, Y.; Liu, Y.; Zhang, S.; Chen, K. RTMDet: An Empirical Study of Designing Real-Time Object Detectors. arXiv 2022, arXiv:2212.07784. [Google Scholar] [CrossRef]
Figure 1. The overall framework of LD-Det.
Remotesensing 16 00237 g001
Figure 2. Process comparison between ViT and PVT v2.
Remotesensing 16 00237 g002
Figure 3. The structure of LightPVT.
Remotesensing 16 00237 g003
Figure 4. The structure of MDC.
Remotesensing 16 00237 g004
Figure 5. The specific locations of MDC in the neck.
Remotesensing 16 00237 g005
Figure 6. The structure of SDHead.
Remotesensing 16 00237 g006
Figure 7. The precision–recall curves with IoU = 0.5 when adding different modules.
Remotesensing 16 00237 g007
Figure 8. The precision–recall curves of different arbitrarily oriented methods on SSDD when IoU = 0.5.
Remotesensing 16 00237 g008
Figure 9. The precision–recall curves of different arbitrarily oriented methods on RSDD-SAR when IoU = 0.5.
Remotesensing 16 00237 g009
Figure 10. Some visual results on SSDD. From top to bottom, the methods are ground truth, Faster R-CNN(OBB), R3Det, FCOS(OBB), ATSS(OBB), RTMDet-R-s, RTMDet-R-tiny, LD-Det. (a) Simple View 1, (b) Simple View 2, (c) Complex View 1, (d) Complex View 2. In the figures, the blue rectangles represent annotations of the ground truth; the red rectangles represent annotations of TP; the light-blue ellipses represent annotations of FN; and the orange ellipses represent annotations of FP.
Remotesensing 16 00237 g010
Figure 11. Some visual results on RSDD-SAR. From top to bottom, the methods are ground truth, Faster R-CNN(OBB), R3Det, FCOS(OBB), ATSS(OBB), RTMDet-R-s, RTMDet-R-tiny, LD-Det. (a) Simple View 1, (b) Complex View 1, (c) Complex View 2, (d) Complex View 3. In the figures, the blue rectangles represent annotations of the ground truth; the red rectangles represent annotations of TP; the light-blue ellipses represent annotations of FN; and the orange ellipses represent annotations of FP.
Remotesensing 16 00237 g011
Figure 12. Visual results of the proposed method on a large-scale ALOS-2 SAR image. In the figures, the red rectangles represent annotations of TP; the light-blue ellipses represent annotations of FN; and the orange ellipses represent annotations of FP.
Remotesensing 16 00237 g012
Table 1. Detailed settings for PVT v2-B0-Li.
StageFeature MapOutput SizeLayer NamePVT v2-B0
Stage 1C2 H 4 × W 4 Overlapping patch embedding S 1 = 4
C 1 = 32
Transformer encoder P 1 = 7
N 1 = 1
E 1 = 8
L 1 = 2
Stage 2C3 H 8 × W 8 Overlapping patch embedding S 2 = 2
C 2 = 64
Transformer encoder P 2 = 7
N 2 = 2
E 2 = 8
L 2 = 2
Stage 3C4 H 16 × W 16 Overlapping patch embedding S 3 = 2
C 3 = 160
Transformer encoder P 3 = 7
N 3 = 5
E 3 = 4
L 3 = 2
Stage 4C5 H 32 × W 32 Overlapping patch embedding S 4 = 2
C 4 = 256
Transformer encoder P 4 = 7
N 4 = 8
E 4 = 4
L 4 = 2
Table 2. Specific parameters of SSDD and RSDD-SAR.
DatasetSSDDRSDD-SAR
Date2017 or 20212022
SensorsRadarSat-2, TerraSAR-X, Sentinel-1TerraSAR-X, Gaofen-3
PolarizationHH, HV, VH, VVHH, HV, VH, VV, DH, DV
Resolution (m)1–152–20
ScenesInshore, offshoreInshore, offshore
Image size (pixels)160–668512 × 512
Image number11607000
Ship number245610,263
AnnotationVertical, oriented, polygonOriented
Table 3. The results of the ablation experiments on SSDD.
 LightPVTMDFPNSDHeadAP50AP75APParams (M)FLOPs (G)
  Position1Position2
Baseline91.4%57.3%52.2%31.8935.47
LD-Det93.4%57.4%52.8%1.112.05
93.6%59.4%53.8%2.352.44
93.9%60.3%54.3%1.233.15
94.4%60.5%54.3%2.483.53
94.6%60.5%54.4%2.503.78
The bold font represents the optimal values.
Table 4. Performance comparison of different arbitrarily oriented methods on SSDD.
MethodsAP50AP75APParams (M)FLOPs (G)
Faster R-CNN(OBB)86.2%40.7%43.1%41.1247.83
R3Det89.2%43.6%46.4%41.5856.57
FCOS(OBB)91.4%57.3%52.2%31.8935.47
ATSS(OBB)92.9%54.9%52.2%36.0235.67
RTMDet-R-s92.5%60.0%53.9%8.866.46
RTMDet-R-tiny92.1%59.0%53.2%4.873.51
LD-Det94.6%60.5%54.4%2.503.78
The bold font represents the optimal values.
Table 5. Performance comparison of different arbitrarily oriented methods on RSDD-SAR.
MethodsAP50AP75APParams (M)FLOPs (G)
Faster R-CNN(OBB)85.7%32.2%40.6%41.1263.25
R3Det89.5%39.9%45.4%41.5882.17
FCOS(OBB)89.3%47.1%47.9%31.8951.55
ATSS(OBB)90.4%48.6%49.1%36.0251.81
RTMDet-R-s89.5%48.3%48.4%8.869.40
RTMDet-R-tiny87.7%46.0%46.8%4.875.11
LD-Det91.9%49.3%49.5%2.505.50
The bold font represents the optimal values.
Table 6. The ablation study on LightPVT.
ModuleAP50AP75APParams (M)FLOPs (G)
ResNet-1892.1%52.7%50.2%11.17.3
Swin-T93.3%54.2%51.5%27.6118.21
PVT v1-Tiny86.4%35.4%41.1%5.815.47
PVT v2-B0-Li93.5%55.4%53.0%3.542.95
LightPVT93.4%57.4%52.8%1.112.05
The bold font represents the optimal values.
Table 7. The ablation study on MDFPN.
ModuleAP50AP75APParams (M)FLOPs (G)
FPN93.4%57.4%52.8%1.112.05
PAFPN92.3%52.8%51.3%1.152.12
BiFPN92.4%52.1%50.9%1.132.14
MDFPN94.4%60.5%54.3%2.483.53
The bold font represents the optimal values.
Table 8. The ablation study on SDHead.
ModuleAP50AP75APParams (M)FLOPs (G)
Baseline93.4%57.4%52.8%1.112.05
SDHead93.4%57.7%53.8%1.142.31
The bold font represents the optimal values.
Disclaimer/Publisher’s Note: The statements, opinions and data contained in all publications are solely those of the individual author(s) and contributor(s) and not of MDPI and/or the editor(s). MDPI and/or the editor(s) disclaim responsibility for any injury to people or property resulting from any ideas, methods, instructions or products referred to in the content.

