1. Introduction
Point clouds are nowadays a widely used source of spatial information applicable to a wide range of engineering and scientific applications, both outdoors and indoors. Three-dimensional laser scanning and structure from motion–multi-view stereo (SfM–MVS) photogrammetry are the two most common methods of their acquisition [
1]. Three-dimensional laser scanning can be performed from stationary terrestrial [
2] as well as mobile [
3] and, recently, unmanned aerial vehicle (UAV) platforms [
4,
5,
6] or airplanes [
7,
8]. The situation is similar in photogrammetry—terrestrial photogrammetry [
9] as well as airborne photogrammetry are commonly used [
10], with UAV photogrammetry being on the rise in recent years. The latter method is easy to use, and the equipment acquisition costs are relatively low. For these reasons, it has experienced a boom over the last decade [
11,
12,
13,
14,
15,
16,
17]. Data acquired in this way always carry (in addition to spatial information) information on point color, typically in the form of three color components (red, green, and blue, as typically captured by standard cameras). The color information, however, while serving well for human orientation and object identification, goes largely unused in point cloud classification. It should be pointed out that in the case of 3D scanning, color information may be inaccurately assigned to individual points [
18], which makes color-based classification unreliable. A similar problem may also occur in photogrammetry as different cameras may record colors differently depending, for example, the chip type used in the respective camera. On the other hand, color is the primary information in photogrammetry, being strongly associated with spatial information; there are, therefore, no obstacles to its utilization when imagery from a single camera is used.
Typically, the point clouds need to be classified (segmented) for further use in many applications. Such segmentation can aim to distinguish between classes such as ground, vegetation, buildings, and roads or even to distinguish between various types of vegetation, which then can serve various purposes depending on the aim of the analysis. Many algorithms have been developed for point cloud segmentation, filtering, or classification. Especially where the acquisition of terrain data (ground filtering) is concerned, some special filters have been proposed, e.g., in [
19,
20,
21,
22,
23]. However, as even the extensive literature review presented in [
24] illustrates, RGB color is almost unused for landscape point cloud classification (only a single study with a highly specific purpose has been included in that review [
25]). Algorithms utilizing color transformation into a one-dimensional variable, such as intensity [
26] or a completely artificial variable [
27], are also suggested. Vegetation indices have also been proposed and are typically used to filter out green vegetation [
28,
29,
30]. However, this approach is, despite its usefulness for such specific purposes, not usable for general segmentation. In [
31], the authors describe methods utilizing point color; this is, however, only performed in association with other geometric features and neural networks. Similar algorithms have also been proposed in [
32,
33,
34].
Segmentation using solely color information is practically identical to 2D image segmentation. Numerous approaches have been proposed (e.g., [
35]), including automated segmentation without training data. Such approaches, however, typically distinguish between significantly different color classes (e.g., green/brown and yellow/red), and all classes need to be of similar abundance; when applying this on a real-world scene, however, this assumption is usually violated.
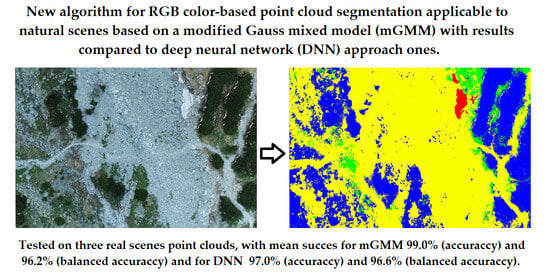
In the presented paper, we aimed to (a) develop a new method for color-based point cloud segmentation applicable to natural scenes based on a modified Gauss mixed model (mGMM) augmented by an automatic determination of the number of color clusters (defined by its position and probability distribution in the RGB space) for each class. Further, we aimed to (b) evaluate the applicability of this algorithm on point clouds of different complexities and numbers of classes and (c) compare the results with those obtained using a deep neural network (DNN) approach.
2. Materials and Methods
2.1. Test Data
To illustrate the function and success rate of the classification, three point clouds capturing real scenes with different numbers of classes and increasing difficulty of distinguishing among color classes were used (see
Figure 1,
Table 1). Descriptions of the point clouds used in this study are provided below. As the particular parameters of flights used to acquire the point clouds are irrelevant to the topic of this study, we do not provide these details.
2.1.1. Data 1—Earthworks
The first dataset describes an area of earthworks with only two classes, namely, mixed soil/sand and vegetation. The point cloud (1,688,681 points) was acquired using SfM. The source data were acquired by the DJI Phantom 4 UAV camera. The selected area is approximately 88 m × 38 m in size, and the average point density is 480 points/m2 (i.e., the points are roughly in a 0.05 m grid).
2.1.2. Data 2—Highway
The second dataset shows a segment of a highway. Using ground filtering, above-ground highway equipment (signs, guardrails, etc.) was removed from the cloud. The point cloud containing a total of 1,953,242 points was generated using SfM. The source imagery was acquired using a DJI Phantom 4 UAV camera. The selected area is approximately 85 m × 57 m in size, and the average point density is 720 points/m2 (i.e., the points are roughly in a 0.04 m grid). Three classes are present in this cloud: road (tarmac), gravel (the gravel layer between the road and the vegetation), and vegetation.
2.1.3. Data 3—Rockslide
The last point cloud describes a rockslide area in a mountainous terrain. The point cloud (1,553,695 points) was produced using SfM. The source imagery was acquired using the DJI Phantom 4 UAV camera. The selected area is approximately 60 m × 50 m in size, with an average point density of 280 points per 1 m2 (i.e., the points are roughly in a 0.06 m grid).
This dataset is the most challenging one as it contains four classes: stones, vegetation, soil, and ice. It should be pointed out that the color of ice and lighter stones are very close in many areas. A human operator can distinguish these on the basis of the texture; the algorithms evaluated in this study are, however, based only on color.
Figure 2 illustrates the representation of individual colors for the Data 3 cloud in the RGB 3D space in various rotations (i.e., the cloud is viewed from different directions in Cartesian coordinates, as indicated by the axes depicting individual R, G, and B color components that are shown below each rotation of the cloud). Data 3 is used for this illustration because of the highest number of classes and biggest complexity; the same depictions for Data 1 and Data 2 are shown in
Appendix A,
Figure A1 and
Figure A2. These figures illustrate that the data are not easily separable by colors (i.e., it is not easy to determine borders between individual classes).
2.2. Proposed and Tested Methods
Given the RGB color distribution shown above, we cannot expect successful automatic classification due to the unclear borders among classes; hence, it will be necessary to choose training data and create a classification system based on this training subset. The basic algorithm for both methods used in this paper, i.e., the modified Gaussian mixed-modeling approach as well as the deep neural network approach, is the same:
Selection of training data representing individual classes (manual classification).
Classifier training.
Classifier validation using a (manually classified) control sample. In the case of unsatisfactory performance, Steps 1 and 2 are repeated.
If Step 3 is sufficiently successful, the entire point cloud is classified using the re-sulting classifier.
In other words, the tested models only differ in the type/format of the classifier, as will be explained below.
2.2.1. Modified Gaussian Mixed-Modeling Method (mGMM)
This algorithm is based on the clustering of points with similar colors in the RGB space. The shapes of these color clusters closely resemble ellipsoids, the density of which grows toward the center, as illustrated in
Figure 3. In that figure, we gradually removed areas with the lowest densities (
Figure 3c–f) from the original point cloud, revealing the ellipsoid-like character of the dense color clusters describing the majority of the points in the original point cloud. With a slight approximation, these clusters can be considered ellipsoid and mathematically described as such, which allows their subsequent identification. The three principal clusters were characterized by one dominant color each, namely, dark green, light brown, and a darker "greyish brown“. It should also be noted that the point densities differ among the clusters, which makes the potential automated detection of the clouds by a uniform density-based removal of points difficult. This is the reason why manual selection of training data within the cloud is a crucial first step in both algorithms.
The mGMM algorithm is based on the identification and mathematical description of these ellipsoids using their spatial normal distribution. Each class is, therefore, represented by the three-dimensional normal distribution defined by its center
C (characterized by coordinates
xC,
yC,
zC) and a 3 × 3 covariance matrix
M defining the ellipsoid (Equation (1)). The eigenvectors of this matrix represent the directions of the principal semi-axes of the ellipsoid and eigenvalues their lengths.
The parameters of the normal distribution from a known group
X containing n points can be determined by the center
C (the mean of the coordinates of all points in this group) and the covariance matrix (Equation (3)):
If the weight of points is to be considered, the equations for the calculation of the weighted center
CW (Equation (4)) and covariance matrix
MW are as follows (Equation (5)):
where
w is the weight assigned to the respective point and
n is the total number of points in the matrix (i.e., the sum of weights).
Classification of each point within the entire cloud is then based on the lowest generalized Mahalonobis distance (GMD) between the point and the probability ellipsoids. The Mahalonobis distances between the individual point and all ellipsoid centers are calculated for each point
P, characterized by coordinates
x,
y,
z (Equation (6)). The individual points are then classified into ellipsoids based on the lowest GMD (i.e., each point is assigned to an ellipsoid closest to the point according to the GMD):
At the beginning of the classification process, the number of ellipsoids needed for the description of individual classes is unknown. For this reason, the following algorithm was proposed to address this issue and to identify all ellipsoids describing each class:
The probability ellipsoids are calculated for each class (i.e., for each operator-selected training subset representing one class) separately.
As RGB space is finite (each color component is expressed by integers within the 0–255 range), the number of occurrences of each composite RGB color within this class is calculated. This combination (RGB color/number of points) significantly reduces the amount of data for subsequent steps and provides weights for individual RGB colors.
The initial number of probability ellipsoids is determined by the number of local weight maxima. In our algorithm, local maxima within the color distance of 25 for each component were identified (i.e., for each point, a search for a point with higher weight within the RGB distance of 25 was performed; if no RGB color with a greater weight was found within this distance, the color of the respective point was considered the center of one of the initial probability ellipsoids).
The primary assignment of each RGB color to the centers is based only on the geometrical distance (i.e., the RGB color is assigned to the closest center of the initial probability ellipsoid). In this way, initial clusters of RGB colors are created.
Subsequently, iterative calculations are performed (note that all calculations are still performed within a single operator-selected training class):
- a.
For each cluster obtained in the previous step, the initial probability ellipsoids of RGB colors are determined. First, the centers are calculated as the weighted means of all RGB colors within the clusters. Subsequently, a covariance matrix assuming the normal distribution is constructed. In this way, we obtain initial probability ellipsoids (one for each initial RGB cluster).
- b.
Generalized Mahanolobis distances to the initial probability ellipsoids are calculated for each RGB color, and the points are re-assigned according to the lowest GMD.
- c.
The number of the probability ellipsoids is reduced based on the following criteria:
- i.
For each probability ellipsoid, the number of RGB colors (considering their weights) assigned to the respective ellipsoid is calculated. If the number is lower than an operator-selected cut-off (in our case, we used 250), the ellipsoid is “dissolved” and does not enter the next iteration. The points forming it are re-assigned to the other ellipsoids in the next step.
- ii.
If the condition number of the covariance matrix is too low (we used 1 × 10⁻¹²), the covariance matrix M cannot be inverted, and GMD cannot be calculated (i.e., the cluster cannot be considered ellipsoid anymore). Again, such an ellipsoid is dissolved, and its points are re-assigned in the next step.
- d.
Steps 5a to 5c are repeated until the number of probability ellipsoids and the number of RGB colors assigned to each ellipsoid stabilize.
After each iteration, the ellipsoids change their shape and center, which leads to alterations of the Mahalonobis distances for each point in the ellipsoids. As GMDs to all ellipsoids for each point are calculated in each iteration, points that are on the margins of an ellipsoid to which they were assigned in the previous step may end up with a lower distance to another ellipsoid after the next iteration. In effect, such points are assigned to a new ellipsoid, thus changing its shape and center for calculations in the next iteration step.
The cut-off of 250 for the dissolution of an ellipsoid number was set arbitrarily based on our experience and observations during algorithm tuning. We saw that whenever the number of points in a cluster (ellipsoid) dropped below 250, the cluster was always reduced to 0 eventually. This setting was only introduced to prevent unnecessary iterations and, therefore, speed up the process.
The algorithm was programmed in Scilab (ver. 6.1.1). In our study, 10,000 points (from each point cloud) were randomly selected from the manually selected training data for the classifier training.
2.2.2. Classification Using Deep Neural Network (DNN)
Classification can also be performed using general tools that do not need specialized functions or probability distributions. Deep neural networks have been increasingly used over the last decade due to their flexibility as well as their success in the search for patterns and their utilization for classification. DNN classification is a type of machine learning. It is used to train a model to recognize patterns in the data and, subsequently, classify new data. Neural networks are inspired by the learning processes taking place in the human brain. Each network element (neuron) sends an output based on one or more inputs. These outputs are subsequently passed on to the next layer of neurons, which use them as new inputs and generate their own outputs again. This process continues until every layer of neurons has performed its function, and end neurons attain their own inputs, process them, and return the final result. Ready-made software packages supporting easy construction of DNNs are available, such as the Artificial Neural Network toolbox (ANN, ver. 0.5,
https://atoms.scilab.org/toolboxes/ANN_Toolbox/0.5, accessed on 19 November 2023) for the Scilab environment (ver. 6.1.1), which was used in our study.
The number of input neurons is given by the number of input parameters. In our case, considering three color components (R, G, B), three input neurons have been used. The input variables were normalized into the 0–1 interval (for example, parameter r = R/255). The number of output neurons is given by the number of classes; the output is a real number between 0 and 1, indicating the likelihood that the given point belongs to the class represented by the respective output neuron (there is one output neuron for each class). The ability of the neural network to approximate more or less complicated problems is, to a large degree, determined by the number of hidden layers and their neurons. To properly evaluate how well and with what parameters the neural network performs in this classification, we tested one, two, and three hidden layers containing 1, 3, 5, 10, 15, 25, or 35 neurons each. These parameters were set to contain both obviously insufficient (one hidden layer with one neuron) or, contrarily, excessively large (three hidden layers with 35 neurons each) DNN extents; we did not increase the number of layers and neurons further as we assumed that the maximum chosen parameters are already excessive and a further increase in any of these parameters would only increase the computational demands without improving the performance. As increasing the amount of training data leads to an increase in training time, we tested training datasets with 500, 1000, and 1500 points in the training subset (acquired as a random selection from the operator-selected training dataset). The selection of the training subset was performed in two ways: (a) completely randomly, i.e., allowing a selection of multiple points with the same color, and (b) randomly with a restricting condition preventing the selection of two points with identical colors in the training sample. The latter was expected to better cover the entire range of colors within the operator-defined training class. Hereinafter, we will refer to these two approaches as “Training color repetition allowed” (TCRA) and “Training color repetition disallowed” (TCRD).
2.3. The Testing Procedure
The three datasets were selected to represent different degrees of complexity and numbers of classes. For each dataset, a training subset was manually prepared, aiming to evenly capture all principal color shades (for example, in Data 1, areas of soil with both sandy and greyish colors were selected).
Classifiers for all algorithms and their variants were trained and used for classification. The results were subsequently compared to those achieved by manual operator-performed classification. Two metrics of classification success were employed, namely, accuracy (
ACC) and balanced accuracy (
BAC), calculated in line with the supplementary material in [
36]. Each of these two metrics evaluates the success in a slightly different way. Accuracy is defined as the relative proportion of correctly classified points in the entire cloud, while balanced accuracy is the mean success of the classification of each class. Substantial differences between
ACC and
BAC indicate different degrees of success in the classification of less represented classes. Both parameters are calculated as follows:
and
where
SC1,
SC2, …,
SCn are the numbers of successfully classified points in individual classes,
CN1,
CN2, …,
CNn are the total numbers of points in individual classes, and
n is the number of classes. The use of both parameters is needed to provide a comprehensive evaluation. Considering the unequal representation of the points, we could, for example, achieve an accuracy of 85.7% simply by classifying all points in Data 1 as soil (see
Table 1), while balanced accuracy would only be 50%.
3. Results
The results of the mGMM method are detailed in
Table 2. It is obvious that the algorithm, in combination with a proper selection of training data, leads to a highly successful classification.
The overall mean accuracy (ACC) across sites is almost 99%, with only a minimum difference among sites. The mean balanced accuracy is somewhat worse at 96.2%. The differences among datasets are not negligible, which is given by the different number of classes and closeness of colors among groups. In the case of Data 3, the overlap of color classes “stones” and “ice” obviously draws the balanced accuracy down in this dataset and, in effect, impacts the overall mean balanced accuracies.
Figure 4 visually illustrates the success of the classification in detail, obviating that differences between the manual classification and the modified mGMM algorithm occur practically only on the borders between classes; it should be noted that classification of these borderline pixels is unambiguous and difficult even for a trained human operator.
The classification errors in Data 2 are repetitive and very similar throughout the image; hence, we only show detail in
Figure 5. Similar to the previous dataset, the erroneous classification can be observed on the borders of classes; in addition, the gaps between neighboring concrete panels were also incorrectly classified here.
In the most complex dataset, Data 3 (
Figure 6), the incorrect classification of points on the edges of classes is obvious again. Moreover, in this case, the overlap between the classes “ice” and “stones” causes erroneous classification of the edges of ice as stones and, vice versa, incorrect classification of stones as ice.
In view of the wide range of testing parameters in the DNN method, the amount of results and tables cannot be easily and clearly presented here. For this reason, the detailed results are presented in
Appendix A (
Table A1,
Table A2,
Table A3,
Table A4,
Table A5 and
Table A6), while only summary statistics encompassing all experiments will be presented in the main body of the manuscript. To be able to evaluate the influence of individual factors, the mean performances for all settings of the particular discussed parameter are always presented.
Table 3 presents the mean ACC and BAC for experiments according to the numbers of neurons in individual layers.
We can observe that the mean classification success is very similar for both ACC and BAC for almost all DNN variants, with the exception of the lowest numbers of neurons (one and three) in the hidden layer. Although the overall results shown in
Table 3 may give the impression that relatively good results can be achieved even with three neurons in the hidden layer, a detailed analysis (see
Table A3 and
Table A6 in
Appendix A) revealed that in some instances, the performance was much inferior compared to the networks with five and more neurons in this layer. For this reason, DNNs with one and three neurons in the hidden layer will be excluded from further evaluation. The best results were achieved in the neural network layer with 15 neurons; however, the results are almost identical from 5 neurons onwards.
Table 4 shows the results of the evaluation of the number of layers. The results obviate that the best results are, somewhat surprisingly, achieved with a single layer only, although the decrease in classification success with multiple layers is very small. Still, there is no point in adding further layers as it unnecessarily increases the computational demands.
The evaluation according to the amount of training data indicates that, as expected, the classification success increases with the amount of training data (
Table 5). However, the differences are surprisingly small. Interestingly, it appears that for small numbers of training data (500), it is beneficial to disallow repetition of identical colors in the training sample, while with the largest training subset, it is better to allow repetition. Still, the differences are negligible.
Visualization of the classification success of the DNN approach reveals somewhat similar patterns as in the case of mGMM. For example, visualization of the Data 1 dataset shows that although the threshold is slightly different, the problematic areas are similar to those identified for mGMM (see
Figure 7).
The same is illustrated in
Figure 8. It shows that mGMM incorrectly classified ice particularly, assigning it to the stones class (
Table 6,
Figure 8a), while in the DNN, incorrect classification is rather evenly spread among classes (
Figure 8b).
4. Discussion
In this paper, we describe and evaluate a new algorithm based on Gaussian mixed modeling for the segmentation of point clouds based on the color of the points in the RGB space. This method (mGMM) achieved accuracies of 99.1 (Data 1), 99.5 (Data 2), and 98.68 (Data 3), respectively. Balanced accuracies were somewhat worse, at 99.5% for Data 1, 95.05% for Data 2, and 94.3% for Data 3, respectively. These differences were caused by data complexity and color overlaps among classes in the individual datasets. Still, the overall classification success seems to be very good.
To be able to compare it with a different algorithm, we have employed a machine learning approach, namely, a deep neural network (DNN). This method and its success (compared to the human operator-created reference classification) was performed for two variants of data-selection options and three different numbers of training points. The results of DNN testing indicate that a relatively simple neural network—one consisting of an input layer with three neurons (for the R, G, and B components normalized into the 0–1 range), one hidden layer with five or more neurons, and output neurons with the number equal to that of the output classes—is sufficient for RGB color-based classification. The number of classification points increases the classification success only slightly; the difference between the use of 1000 and 1500 training points was especially negligible. Where the training data subset selection is concerned, we also tested if limiting the training point selection to just one repetition of each unique color might be more useful than the use of a random sample allowing the repetition of the same color. Both these approaches might be valid—on the one hand, it may appear reasonable to prevent the repetition of the same color in training data; on the other hand, repetitive occurrences of the same color follow the importance of the respective color in the cloud, and they are, in this way, emphasized in the training process. We found out that where a low number of training points (500 in our case) is used, preventing repetition leads to slightly better results than random subsampling allowing repetition. This is particularly obvious in BAC (
Table 5)—in other words, this leads to a better classification of less-represented classes. Where a large number of training points is used (1500), this does not matter anymore.
The overall DNN classification success varies with the dataset complexity. In Data 1 containing two classes only, the accuracy of 99.5% and BAC of 99.2% were achieved. In Data 2, with medium complexity and three classes, DNN yielded a mean ACC of 98.9% and BAC of 97.4%, while in the most complex dataset with 4 classes (Data 3), it was 93.5% and 93.6%, respectively. In the latter dataset, the inferior results were caused in particular by the color overlap of the classes “ice” and “stones”. These two classes were intentionally used to evaluate the possible influence of the overlapping color classes (which cannot be completely avoided in this type of classification); the results were actually surprisingly good, considering the simplicity of the algorithm and the fact that spatial information was not taken into account.
From the perspective of the overall performance of the two algorithms, mGMM performed better where ACC is concerned (99.0% for mGMM vs. 97.0% for DNN), while the BAC evaluation is somewhat better in DNN (96.6% for DNN compared to 96.2% for mGMM, respectively). Still, as these differences are very small, we can conclude that the performances of both methods are comparable.
Considering the programming demands, mGMM is much more difficult than the construction of a DNN using a ready-made standard engine (as used in our case)—basically, creating a DNN using such a package is a matter of the use of two pre-prepared functions. On the other hand, mGMM is much less demanding in terms of computation time as training and classification using the DNN are an order of magnitude more computationally demanding than in the case of mGMM, which may play a role, in particular, when larger datasets are segmented.
Overall, both methods appear to be usable where color differs among classes. Although the reliability of the approach is quite good, it might be further enhanced by employing additional parameters, such as the color of the surrounding points or spatial characteristics. If additional parameters are employed, it is unambiguously easier to adjust the DNN approach than to amend the mGMM algorithm (although even mGMM can be altered by increasing the number of dimensions).
5. Conclusions
In this paper, we have developed a method allowing the classification of natural scenes solely on the basis of the RGB colors. This allows a relatively computationally undemanding classification potentially applicable to a wide range of scenes. This Gaussian mixed modeling-based method was modified to utilize the specific properties of the RGB space (finite number of combinations of integers, with these combinations repeated throughout the same classes) for automatic determination of the number of probability ellipsoids needed for the class description. In addition, we have tested another approach, which was based on a deep neural network. Multiple numbers of training subsets, hidden layers, and neurons in hidden layers of the neural network were employed for that approach.
We have achieved excellent classification success with both methods. While mGMM performed slightly better in accuracy, DNN was slightly better in balanced accuracy (mean classification success of all classes). In DNN, a single hidden neuron layer with five neurons was sufficient to achieve the best results possible. Both methods have their pros and cons—mGMM appears to better approximate the color using probability ellipsoids and is less computationally demanding. On the other hand, DNN is easier to combine with additional parameters. However, both these algorithms are viable. The advantage of mGMM lies particularly in its ability to perform well regardless of the geometrical position and, therefore, in its low computational demands. This can be, considering the typical size of point clouds, highly beneficial for the user.
Author Contributions
Conceptualization, M.Š.; methodology, M.Š.; software, M.Š.; validation, R.U. and M.Š.; formal analysis, L.L.; investigation, L.L.; resources, R.U.; data curation, R.U.; writing—original draft preparation, M.Š.; writing—review and editing, M.Š. and L.L.; visualization, M.Š.; supervision, M.Š.; project administration, R.U.; funding acquisition, R.U. All authors have read and agreed to the published version of the manuscript.
Funding
This research was funded by the Grant Agency of CTU in Prague—grant project “Optimization of acquisition and processing of 3D data for purpose of engineering surveying, geodesy in underground spaces and 3D scanning”, 2023; and by the Technology Agency of the Czech Republic—grant number CK03000168, “Intelligent methods of digital data acquisition and analysis for bridge inspections”.
Data Availability Statement
Data used in this study are available upon request. The data are not publicly available due to size.
Conflicts of Interest
The authors declare no conflicts of interest. The funders had no role in the design of the study; in the collection, analyses, or interpretation of data; in the writing of the manuscript; or in the decision to publish the results.
Appendix A
Figure A1.
Data 1—Earthworks in the RGB space in various rotations defined by the axes below (a–d), showing their continuous character.
Figure A1.
Data 1—Earthworks in the RGB space in various rotations defined by the axes below (a–d), showing their continuous character.
Figure A2.
Data 2—Highway in the RGB space in various rotations defined by the axes below (a–d), showing their continuous character.
Figure A2.
Data 2—Highway in the RGB space in various rotations defined by the axes below (a–d), showing their continuous character.
Table A1.
Data 1—Earthworks DNN classification success rate in %, TCRA.
Table A1.
Data 1—Earthworks DNN classification success rate in %, TCRA.
| Training Dataset Size | 500 | 1000 | 1500 |
|---|
| Hidden Layers | Neurons | ACC (%) | BAC (%) | ACC (%) | BAC (%) | ACC (%) | BAC (%) |
|---|
| 1 | 1 | 98.9 | 97.7 | 98.9 | 98.9 | 99.5 | 99.3 |
| | 3 | 99.0 | 97.8 | 98.9 | 98.9 | 99.5 | 99.3 |
| | 5 | 99.0 | 97.7 | 98.9 | 98.9 | 99.4 | 99.1 |
| | 10 | 99.0 | 97.8 | 98.9 | 98.9 | 99.4 | 99.1 |
| | 15 | 99.0 | 97.7 | 98.9 | 98.9 | 99.4 | 99.1 |
| | 25 | 99.0 | 97.8 | 98.9 | 98.9 | 99.4 | 99.1 |
| | 35 | 99.0 | 97.8 | 98.9 | 98.9 | 99.5 | 99.1 |
| 2 | 1 | 98.7 | 96.8 | 98.8 | 98.5 | 99.5 | 99.3 |
| | 3 | 98.8 | 97.0 | 98.8 | 98.9 | 99.5 | 99.3 |
| | 5 | 98.8 | 97.0 | 98.8 | 98.9 | 99.5 | 99.2 |
| | 10 | 98.8 | 97.1 | 98.8 | 98.9 | 99.5 | 99.1 |
| | 15 | 98.8 | 97.0 | 98.8 | 98.9 | 99.5 | 99.2 |
| | 25 | 98.8 | 97.1 | 98.8 | 98.9 | 99.5 | 99.2 |
| | 35 | 98.8 | 97.0 | 98.8 | 98.9 | 99.5 | 99.1 |
| 3 | 1 | 97.2 | 92.8 | 96.9 | 94.9 | 97.3 | 93.1 |
| | 3 | 98.7 | 96.7 | 98.8 | 98.8 | 99.5 | 99.2 |
| | 5 | 98.8 | 97.0 | 98.8 | 98.9 | 99.6 | 99.4 |
| | 10 | 98.7 | 96.8 | 98.8 | 98.8 | 99.6 | 99.4 |
| | 15 | 98.8 | 96.9 | 98.8 | 98.9 | 99.5 | 99.4 |
| | 25 | 98.7 | 96.9 | 98.8 | 98.9 | 99.6 | 99.5 |
| | 35 | 98.7 | 96.6 | 98.8 | 98.9 | 99.6 | 99.4 |
Table A2.
Highway—DNN classification success rate in %, TCRA.
Table A2.
Highway—DNN classification success rate in %, TCRA.
| Training Dataset Size | 500 | 1000 | 1500 |
|---|
| Hidden Layers | Neurons | ACC (%) | BAC (%) | ACC (%) | BAC (%) | ACC (%) | BAC (%) |
|---|
| 1 | 1 | 97.4 | 90.0 | 97.5 | 87.1 | 97.3 | 89.7 |
| | 3 | 98.9 | 97.1 | 98.9 | 97.3 | 98.8 | 97.2 |
| | 5 | 98.9 | 97.2 | 98.9 | 97.1 | 98.8 | 97.2 |
| | 10 | 98.9 | 97.1 | 98.9 | 96.9 | 98.8 | 97.3 |
| | 15 | 98.9 | 97.1 | 98.9 | 97.0 | 98.8 | 97.3 |
| | 25 | 98.9 | 97.1 | 98.9 | 97.0 | 98.8 | 97.2 |
| | 35 | 98.8 | 97.1 | 98.9 | 96.9 | 98.8 | 97.2 |
| 2 | 1 | 97.1 | 89.2 | 97.4 | 85.6 | 97.3 | 88.3 |
| | 3 | 98.8 | 97.4 | 98.9 | 97.2 | 98.8 | 97.5 |
| | 5 | 98.9 | 97.2 | 98.9 | 96.8 | 98.7 | 97.3 |
| | 10 | 98.8 | 96.9 | 98.9 | 97.0 | 98.8 | 97.4 |
| | 15 | 98.8 | 97.1 | 98.9 | 97.1 | 98.7 | 97.5 |
| | 25 | 98.9 | 97.0 | 98.9 | 97.1 | 98.7 | 97.3 |
| | 35 | 98.9 | 97.0 | 98.9 | 97.1 | 98.7 | 97.5 |
| 3 | 1 | 57.1 | 64.2 | 96.0 | 67.3 | 57.1 | 63.7 |
| | 3 | 98.9 | 97.4 | 98.9 | 97.2 | 98.8 | 97.1 |
| | 5 | 98.8 | 97.2 | 98.9 | 97.3 | 98.8 | 97.4 |
| | 10 | 98.8 | 97.2 | 98.9 | 97.0 | 98.6 | 97.5 |
| | 15 | 98.8 | 97.1 | 98.8 | 97.2 | 98.8 | 97.4 |
| | 25 | 98.8 | 97.2 | 98.9 | 97.1 | 98.7 | 97.5 |
| | 35 | 98.8 | 97.0 | 98.9 | 97.1 | 98.7 | 97.5 |
Table A3.
Data 3—Rockslide DNN classification success rate in %, TCRA.
Table A3.
Data 3—Rockslide DNN classification success rate in %, TCRA.
| Training Dataset Size | 500 | 1000 | 1500 |
|---|
| Hidden layers | Neurons | ACC (%) | BAC (%) | ACC (%) | BAC (%) | ACC (%) | BAC (%) |
|---|
| 1 | 1 | 74.9 | 80.6 | 72.2 | 80.8 | 77.8 | 81.7 |
| | 3 | 90.0 | 92.3 | 92.2 | 92.6 | 91.3 | 92.9 |
| | 5 | 92.8 | 93.0 | 93.5 | 94.1 | 93.0 | 93.4 |
| | 10 | 91.4 | 93.4 | 93.7 | 94.1 | 91.9 | 94.3 |
| | 15 | 93.8 | 93.8 | 92.9 | 93.5 | 93.9 | 94.2 |
| | 25 | 93.6 | 93.6 | 93.3 | 93.3 | 94.1 | 94.2 |
| | 35 | 92.8 | 93.9 | 93.2 | 93.3 | 94.2 | 94.7 |
| 2 | 1 | 66.4 | 78.2 | 69.9 | 77.3 | 76.0 | 82.3 |
| | 3 | 89.3 | 92.0 | 91.2 | 91.5 | 91.8 | 93.9 |
| | 5 | 93.1 | 93.0 | 91.4 | 91.6 | 94.0 | 94.7 |
| | 10 | 91.9 | 92.4 | 93.2 | 92.5 | 93.4 | 94.1 |
| | 15 | 92.6 | 93.1 | 93.0 | 93.2 | 94.5 | 91.7 |
| | 25 | 92.0 | 93.7 | 94.6 | 94.7 | 94.3 | 93.2 |
| | 35 | 93.5 | 92.9 | 93.0 | 93.0 | 92.5 | 93.0 |
| 3 | 1 | 59.0 | 74.1 | 65.4 | 74.8 | 73.4 | 82.4 |
| | 3 | 89.1 | 91.3 | 90.3 | 91.4 | 83.0 | 77.0 |
| | 5 | 91.3 | 92.5 | 89.8 | 91.6 | 92.3 | 93.7 |
| | 10 | 92.9 | 93.2 | 94.5 | 92.6 | 93.7 | 93.5 |
| | 15 | 92.4 | 92.6 | 92.7 | 92.6 | 94.1 | 93.4 |
| | 25 | 92.2 | 93.2 | 92.6 | 93.0 | 93.7 | 93.1 |
| | 35 | 92.7 | 92.7 | 92.0 | 92.9 | 93.4 | 93.3 |
Table A4.
Data 1—Earthworks DNN classification success rate in %, TCRD.
Table A4.
Data 1—Earthworks DNN classification success rate in %, TCRD.
| Training Dataset Size | 500 | 1000 | 1500 |
|---|
| Hidden Layers | Neurons | ACC (%) | AC (%) | ACC (%) | BAC (%) | ACC (%) | BAC (%) |
|---|
| 1 | 1 | 99.4 | 98.5 | 99.4 | 99.3 | 99.3 | 98.5 |
| | 3 | 99.2 | 98.7 | 99.4 | 99.3 | 99.3 | 98.6 |
| | 5 | 99.3 | 98.7 | 99.4 | 99.3 | 99.4 | 98.8 |
| | 10 | 99.2 | 98.7 | 99.4 | 99.3 | 99.2 | 98.4 |
| | 15 | 99.3 | 98.8 | 99.2 | 99.2 | 99.2 | 98.4 |
| | 25 | 99.2 | 98.6 | 99.3 | 99.3 | 99.2 | 98.4 |
| | 35 | 99.3 | 98.8 | 99.2 | 99.2 | 99.2 | 98.4 |
| 2 | 1 | 99.3 | 99.2 | 99.3 | 99.1 | 99.5 | 99.3 |
| | 3 | 99.2 | 98.7 | 99.3 | 99.2 | 99.3 | 98.9 |
| | 5 | 99.2 | 98.6 | 99.3 | 99.2 | 99.3 | 98.9 |
| | 10 | 99.1 | 98.4 | 99.2 | 99.1 | 99.3 | 98.9 |
| | 15 | 99.1 | 98.5 | 99.1 | 99.1 | 99.3 | 98.8 |
| | 25 | 99.1 | 98.5 | 99.2 | 99.1 | 99.3 | 98.9 |
| | 35 | 99.2 | 98.5 | 99.2 | 99.1 | 99.3 | 98.8 |
| 3 | 1 | 99.2 | 99.0 | 99.0 | 98.5 | 99.4 | 99.4 |
| | 3 | 99.4 | 99.1 | 99.2 | 99.0 | 99.4 | 99.1 |
| | 5 | 99.2 | 98.8 | 99.2 | 99.0 | 99.2 | 98.8 |
| | 10 | 99.2 | 98.6 | 99.1 | 99.0 | 99.2 | 99.0 |
| | 15 | 99.2 | 98.6 | 99.1 | 99.0 | 99.3 | 98.9 |
| | 25 | 99.1 | 98.4 | 99.1 | 99.1 | 99.0 | 98.7 |
| | 35 | 99.2 | 98.5 | 99.1 | 99.1 | 99.3 | 99.1 |
Table A5.
Data 2—Highway DNN classification success rate in %, (TCRD).
Table A5.
Data 2—Highway DNN classification success rate in %, (TCRD).
| Training Dataset Size | 500 | 1000 | 1500 |
|---|
| Hidden Layers | Neurons | ACC (%) | BAC (%) | ACC (%) | BAC (%) | ACC (%) | BAC (%) |
|---|
| 1 | 1 | 97.3 | 84.9 | 97.1 | 87.6 | 97.3 | 86.6 |
| | 3 | 98.7 | 97.7 | 98.7 | 97.5 | 98.7 | 97.5 |
| | 5 | 98.8 | 97.6 | 98.7 | 97.5 | 98.6 | 97.5 |
| | 10 | 98.7 | 97.7 | 98.7 | 97.5 | 98.7 | 97.6 |
| | 15 | 98.7 | 97.7 | 98.7 | 97.5 | 98.7 | 97.5 |
| | 25 | 98.7 | 97.7 | 98.7 | 97.5 | 98.7 | 97.6 |
| | 35 | 98.7 | 97.7 | 98.7 | 97.5 | 98.7 | 97.6 |
| 2 | 1 | 97.1 | 82.3 | 97.0 | 82.5 | 97.3 | 86.6 |
| | 3 | 98.7 | 97.7 | 98.7 | 97.4 | 98.7 | 97.5 |
| | 5 | 98.8 | 97.5 | 98.7 | 97.5 | 98.7 | 97.6 |
| | 10 | 98.8 | 97.6 | 98.7 | 97.5 | 98.6 | 97.6 |
| | 15 | 98.6 | 97.7 | 98.7 | 97.6 | 98.7 | 97.6 |
| | 25 | 98.6 | 97.7 | 98.1 | 97.2 | 98.6 | 97.6 |
| | 35 | 98.7 | 97.6 | 98.7 | 97.5 | 98.5 | 97.6 |
| 3 | 1 | 96.6 | 75.6 | 96.5 | 76.4 | 97.2 | 83.5 |
| | 3 | 98.8 | 97.6 | 98.7 | 97.3 | 98.7 | 97.5 |
| | 5 | 98.7 | 97.7 | 98.6 | 97.5 | 98.6 | 97.6 |
| | 10 | 98.6 | 97.7 | 98.7 | 97.6 | 98.7 | 97.6 |
| | 15 | 98.6 | 97.7 | 98.7 | 97.5 | 98.7 | 97.7 |
| | 25 | 98.5 | 97.6 | 97.8 | 97.0 | 98.6 | 97.6 |
| | 35 | 98.6 | 97.6 | 97.2 | 96.7 | 98.7 | 97.6 |
Table A6.
Data 3—Rockslide DNN classification success rate in %, TCRD.
Table A6.
Data 3—Rockslide DNN classification success rate in %, TCRD.
| Training Dataset Size | 500 | 1000 | 1500 |
|---|
| Hidden Layers | Neurons | ACC (%) | BAC (%) | ACC (%) | BAC (%) | ACC (%) | BAC (%) |
|---|
| 1 | 1 | 66.4 | 78.0 | 68.3 | 80.6 | 73.8 | 80.8 |
| | 3 | 89.9 | 93.3 | 90.6 | 93.1 | 92.0 | 93.1 |
| | 5 | 92.1 | 94.7 | 92.5 | 93.6 | 92.4 | 94.2 |
| | 10 | 91.4 | 94.1 | 94.4 | 94.5 | 94.1 | 94.0 |
| | 15 | 92.4 | 94.4 | 94.9 | 94.8 | 93.6 | 94.4 |
| | 25 | 91.8 | 94.7 | 94.8 | 93.9 | 93.9 | 94.0 |
| | 35 | 92.5 | 94.4 | 95.0 | 94.4 | 94.4 | 93.9 |
| 2 | 1 | 63.6 | 76.7 | 71.2 | 77.7 | 66.3 | 77.4 |
| | 3 | 90.1 | 93.1 | 88.9 | 93.1 | 89.9 | 92.9 |
| | 5 | 92.5 | 93.4 | 91.3 | 92.6 | 93.1 | 93.4 |
| | 10 | 92.8 | 92.8 | 93.0 | 94.7 | 93.6 | 93.6 |
| | 15 | 92.9 | 93.2 | 94.2 | 93.7 | 94.3 | 93.7 |
| | 25 | 92.2 | 93.3 | 94.3 | 93.2 | 94.0 | 93.7 |
| | 35 | 92.8 | 92.9 | 93.1 | 92.9 | 94.3 | 92.7 |
| 3 | 1 | 47.7 | 70.5 | 36.4 | 59.2 | 76.2 | 53.4 |
| | 3 | 90.4 | 92.8 | 83.7 | 87.6 | 89.1 | 92.5 |
| | 5 | 92.0 | 92.9 | 90.9 | 93.6 | 91.4 | 93.3 |
| | 10 | 93.5 | 93.7 | 92.4 | 93.4 | 94.0 | 93.4 |
| | 15 | 92.5 | 92.8 | 92.8 | 93.8 | 94.5 | 92.7 |
| | 25 | 91.9 | 92.5 | 94.3 | 93.0 | 94.3 | 92.4 |
| | 35 | 91.2 | 92.4 | 93.5 | 92.5 | 94.3 | 92.9 |
References
- Kovanič, Ľ.; Topitzer, B.; Peťovský, P.; Blišťan, P.; Gergeľová, M.B.; Blišťanová, M. Review of Photogrammetric and Lidar Applications of UAV. Appl. Sci. 2023, 13, 6732. [Google Scholar] [CrossRef]
- Koska, B.; Křemen, T. The Combination of Laser Scanning and Structure from Motion Technology for Creation of Accurate Exterior and Interior Orthophotos of St. Nicholas Baroque Church. Int. Arch. Photogramm. Remote Sens. Spat. Inf. Sci. 2013, XL-5/W1, 133–138. [Google Scholar] [CrossRef]
- Jon, J.; Koska, B.; Pospíšil, J. Autonomous airship equipped by multi-sensor mapping platform. Int. Arch. Photogramm. Remote Sens. Spat. Inf. Sci. 2013, XL-5/W1, 119–124. [Google Scholar] [CrossRef]
- Štroner, M.; Urban, R.; Křemen, T.; Braun, J. UAV DTM Acquisition in a Forested Area—Comparison of Low-Cost Photogrammetry (DJI Zenmuse P1) and LiDAR Solutions (DJI Zenmuse L1). Eur. J. Remote Sens. 2023, 56, 2179942. [Google Scholar] [CrossRef]
- Bartmiński, P.; Siłuch, M.; Kociuba, W. The Effectiveness of a UAV-Based LiDAR Survey to Develop Digital Terrain Models and Topographic Texture Analyses. Sensors 2023, 23, 6415. [Google Scholar] [CrossRef] [PubMed]
- Pasternak, G.; Zaczek-Peplinska, J.; Pasternak, K.; Jóźwiak, J.; Pasik, M.; Koda, E.; Vaverková, M.D. Surface Monitoring of an MSW Landfill Based on Linear and Angular Measurements, TLS, and LIDAR UAV. Sensors 2023, 23, 1847. [Google Scholar] [CrossRef]
- Piovan, S.E.; Hodgson, M.E.; Mozzi, P.; Porter, D.E.; Hall, B. LiDAR-Change-Based Mapping of Sediment Movement from an Extreme Rainfall Event. GIScience Remote Sens. 2023, 60, 2227394. [Google Scholar] [CrossRef]
- Moudrý, V.; Cord, A.F.; Gábor, L.; Laurin, G.V.; Barták, V.; Gdulová, K.; Malavasi, M.; Rocchini, D.; Stereńczak, K.; Prošek, J.; et al. Vegetation Structure Derived from Airborne Laser Scanning to Assess Species Distribution and Habitat Suitability: The Way Forward. Divers. Distrib. 2022, 29, 39–50. [Google Scholar] [CrossRef]
- Bartoš, K.; Pukanská, K.; Kseňak, Ľ.; Gašinec, J.; Bella, P. Cross-Polarized SfM Photogrammetry for the Spatial Reconstruction of Challenging Surfaces, the Case Study of Dobšiná Ice Cave (Slovakia). Remote Sens. 2023, 15, 4481. [Google Scholar] [CrossRef]
- Kovanič, Ľ.; Blišťan, P.; Štroner, M.; Urban, R.; Blistanova, M. Suitability of Aerial Photogrammetry for Dump Documentation and Volume Determination in Large Areas. Appl. Sci. 2021, 11, 6564. [Google Scholar] [CrossRef]
- Leisner, M.M.; de Paula, D.P.; Alves, D.C.L.; da Guia Albuquerque, M.; de Holanda Bastos, F.; Vasconcelos, Y.G. Long-term and Short-term Analysis of Shoreline Change and Cliff Retreat on Brazilian Equatorial Coast. Earth Surf. Process. Landf. 2023, 48, 2987–3002. [Google Scholar] [CrossRef]
- Hochfeld, I.; Hort, M.; Schwalbe, E.; Dürig, T. Eruption Dynamics of Anak Krakatau Volcano (Indonesia) Estimated Using Photogrammetric Methods. Bull. Volcanol. 2022, 84, 73. [Google Scholar] [CrossRef]
- Pavelka, K.; Matoušková, E.; Pavelka, K., Jr. Remarks on Geomatics Measurement Methods Focused on Forestry Inventory. Sensors 2023, 23, 7376. [Google Scholar] [CrossRef] [PubMed]
- Santos-González, J.; González-Gutiérrez, R.B.; Redondo-Vega, J.M.; Gómez-Villar, A.; Jomelli, V.; Fernández-Fernández, J.M.; Andrés, N.; García-Ruiz, J.M.; Peña-Pérez, S.A.; Melón-Nava, A.; et al. The Origin and Collapse of Rock Glaciers during the Bølling-Allerød Interstadial: A New Study Case from the Cantabrian Mountains (Spain). Geomorphology 2022, 401, 108112. [Google Scholar] [CrossRef]
- Nesbit, P.R.; Hubbard, S.M.; Hugenholtz, C.H. Direct Georeferencing UAV-SfM in High-Relief Topography: Accuracy Assessment and Alternative Ground Control Strategies along Steep Inaccessible Rock Slopes. Remote Sens. 2022, 14, 490. [Google Scholar] [CrossRef]
- Stanga, C.; Banfi, F.; Roascio, S. Enhancing Building Archaeology: Drawing, UAV Photogrammetry and Scan-to-BIM-to-VR Process of Ancient Roman Ruins. Drones 2023, 7, 521. [Google Scholar] [CrossRef]
- Tonti, I.; Lingua, A.M.; Piccinini, F.; Pierdicca, R.; Malinverni, E.S. Digitalization and Spatial Documentation of Post-Earthquake Temporary Housing in Central Italy: An Integrated Geomatic Approach Involving UAV and a GIS-Based System. Drones 2023, 7, 438. [Google Scholar] [CrossRef]
- Štroner, M.; Urban, R.; Línková, L. A New Method for UAV Lidar Precision Testing Used for the Evaluation of an Affordable DJI ZENMUSE L1 Scanner. Remote Sens. 2021, 13, 4811. [Google Scholar] [CrossRef]
- Štroner, M.; Urban, R.; Línková, L. Multidirectional Shift Rasterization (MDSR) Algorithm for Effective Identification of Ground in Dense Point Clouds. Remote Sens. 2022, 14, 4916. [Google Scholar] [CrossRef]
- Wang, Y.; Koo, K.-Y. Vegetation Removal on 3D Point Cloud Reconstruction of Cut-Slopes Using U-Net. Appl. Sci. 2021, 12, 395. [Google Scholar] [CrossRef]
- Braun, J.; Braunova, H.; Suk, T.; Michal, O.; Petovsky, P.; Kuric, I. Structural and Geometrical Vegetation Filtering—Case Study on Mining Area Point Cloud Acquired by UAV Lidar. Acta Montan. Slovaca 2022, 22, 661–674. [Google Scholar] [CrossRef]
- Wu, Y.; Sang, M.; Wang, W. A Novel Ground Filtering Method for Point Clouds in a Forestry Area Based on Local Minimum Value and Machine Learning. Appl. Sci. 2022, 12, 9113. [Google Scholar] [CrossRef]
- Storch, M.; de Lange, N.; Jarmer, T.; Waske, B. Detecting Historical Terrain Anomalies With UAV-LiDAR Data Using Spline-Approximation and Support Vector Machines. IEEE J. Sel. Top. Appl. Earth Obs. Remote Sens. 2023, 16, 3158–3173. [Google Scholar] [CrossRef]
- Grilli, E.; Menna, F.; Remondino, F. A review of point clouds segmentation and classification algorithms. Int. Arch. Photogramm. Remote Sens. Spat. Inf. Sci. 2017, XLII-2/W3, 339–344. [Google Scholar] [CrossRef]
- Strom, J.; Richardson, A.; Olson, E. Graph-Based Segmentation for Colored 3D Laser Point Clouds. In Proceedings of the 2010 IEEE/RSJ International Conference on Intelligent Robots and Systems, Taipei, Taiwan, 18–22 October 2010. [Google Scholar] [CrossRef]
- Huang, Z.-K.; Chau, K.-W. A New Image Thresholding Method Based on Gaussian Mixture Model. Appl. Math. Comput. 2008, 205, 899–907. [Google Scholar] [CrossRef]
- Severino, O.; Gonzaga, A. A New Approach for Color Image Segmentation Based on Color Mixture. Mach. Vis. Appl. 2011, 24, 607–618. [Google Scholar] [CrossRef]
- Moorthy, S.; Boigelot, B.; Mercatoris, B.C.N. Effective Segmentation of Green Vegetation for Resource-Constrained Real-Time Applications. In Precision Agriculture ’15; Wageningen Academic Publishers: Wageningen, The Netherlands, 2015; pp. 257–266. [Google Scholar] [CrossRef]
- Ponti, M.P. Segmentation of Low-Cost Remote Sensing Images Combining Vegetation Indices and Mean Shift. IEEE Geosci. Remote Sens. Lett. 2013, 10, 67–70. [Google Scholar] [CrossRef]
- Štroner, M.; Urban, R.; Suk, T. Filtering Green Vegetation Out from Colored Point Clouds of Rocky Terrains Based on Various Vegetation Indices: Comparison of Simple Statistical Methods, Support Vector Machine, and Neural Network. Remote Sens. 2023, 15, 3254. [Google Scholar] [CrossRef]
- Nguyen, A.; Le, B. 3D Point Cloud Segmentation: A Survey. In Proceedings of the 2013 6th IEEE Conference on Robotics, Automation and Mechatronics (RAM), Manila, Philippines, 12–15 November 2013. [Google Scholar] [CrossRef]
- Hu, H.; Zhang, G.; Ao, J.; Wang, C.; Kang, R.; Wu, Y. Multi-Information PointNet++ Fusion Method for DEM Construction from Airborne LiDAR Data. Geocarto Int. 2022, 38, 2153929. [Google Scholar] [CrossRef]
- Díaz-Medina, M.; Fuertes, J.M.; Segura-Sánchez, R.J.; Lucena, M.; Ogayar-Anguita, C.J. LiDAR Attribute Based Point Cloud Labeling Using CNNs with 3D Convolution Layers. Comput. Geosci. 2023, 180, 105453. [Google Scholar] [CrossRef]
- Baiocchi, A.; Giagu, S.; Napoli, C.; Serra, M.; Nardelli, P.; Valleriani, M. Artificial Neural Networks Exploiting Point Cloud Data for Fragmented Solid Objects Classification. Mach. Learn. Sci. Technol. 2023, 4, 045025. [Google Scholar] [CrossRef]
- Zhan, Q.; Liang, Y.; Xiao, Y. Color-Based Segmentation of Point Clouds. In Laser Scanning; Bretar, F., Pierrot-Deseilligny, M., Vosselman, G., Eds.; IAPRS: Paris, France, 2009; Volume XXXVIII, Part 3/W8, pp. 155–161. [Google Scholar]
- You, S.-H.; Jang, E.J.; Kim, M.-S.; Lee, M.-T.; Kang, Y.-J.; Lee, J.-E.; Eom, J.-H.; Jung, S.-Y. Change Point Analysis for Detecting Vaccine Safety Signals. Vaccines 2021, 9, 206. [Google Scholar] [CrossRef] [PubMed]
Figure 1.
Original and manually operator-classified point clouds used for the evaluation of the algorithms: (a,b) Data 1—Earthworks, (soil + sand—red vs. vegetation—blue); (c,d) Data 2—Highway (vegetation—blue, tarmac—green, gravel—red); (e,f) Data 3—Rockslide (stones—yellow, vegetation—blue, soil—green, ice—red).
Figure 2.
Data 3—Rockslide in the RGB space in various rotations defined by the axes below (a–d) showing their continuous character.
Figure 2.
Data 3—Rockslide in the RGB space in various rotations defined by the axes below (a–d) showing their continuous character.
Figure 3.
Identification of clusters characterizing the main color ranges, illustrated by the example of Data 1. (a) The original full point cloud representing colors in the RGB space (external view on the entire distribution). (b) Section through the distribution, color-coded according to the density of the points within (red—high density, green/yellow—medium density; blue—low density). (c,d) The same cloud after filtering out areas with low density of points; the clusters of points with similar colors and their cores are easier to observe. (e,f) The same step (removal of low-density areas) is repeated once again, better revealing the ellipsoid character of the cores.
Figure 4.
Classification errors in Data 1—yellow color indicates incorrectly classified pixels in detail.
Figure 4.
Classification errors in Data 1—yellow color indicates incorrectly classified pixels in detail.
Figure 5.
Detail of classification errors in Data 2—(errors highlighted in red).
Figure 5.
Detail of classification errors in Data 2—(errors highlighted in red).
Figure 6.
A detail of classification errors in Data 3 (errors highlighted in red).
Figure 6.
A detail of classification errors in Data 3 (errors highlighted in red).
Figure 7.
Classification errors in Data 1—comparison of (a) DNN (1 hidden layer, 15 neurons) and (b) mGMM.
Figure 7.
Classification errors in Data 1—comparison of (a) DNN (1 hidden layer, 15 neurons) and (b) mGMM.
Figure 8.
Data 3—Rockslide classification success—a comparison of the results of (a) mGMM and (b) DNN in the most problematic (ice) region.
Figure 8.
Data 3—Rockslide classification success—a comparison of the results of (a) mGMM and (b) DNN in the most problematic (ice) region.
Table 1.
Percentage representation of individual classes in test data (based on the manually classified data).
Table 1.
Percentage representation of individual classes in test data (based on the manually classified data).
| Class | Data 1 | % | Data 2 | % | Data 3 | % |
|---|
| 1 | Vegetation | 14.3 | Vegetation | 42.2 | Vegetation | 29.0 |
| 2 | Soil | 85.7 | Tarmac | 54.3 | Soil | 6.0 |
| 3 | | | Gravel | 3.5 | Stones | 64.3 |
| 4 | | | | | Ice | 0.7 |
Table 2.
mGMM classification success.
Table 2.
mGMM classification success.
| Data | Number of Classes | ACC (%) | BAC (%) |
|---|
| Data 1—Earthworks | 2 | 99.1 | 99.5 |
| Data 2—Highway | 3 | 98.7 | 95.1 |
| Data 3—Rockslide | 4 | 99.2 | 94.3 |
| Mean | | 99.0 | 96.2 |
Table 3.
Classification success for different numbers of neurons in the hidden layers.
Table 3.
Classification success for different numbers of neurons in the hidden layers.
| NnHL | TCRA | TCRD |
|---|
| | ACC (%) | BAC (%) | ACC (%) | BAC (%) |
|---|
| 1 | 85.7 | 85.5 | 86.6 | 84.8 |
| 3 | 95.9 | 95.4 | 95.8 | 96.3 |
| 5 | 96.8 | 96.2 | 96.7 | 96.7 |
| 10 | 96.9 | 96.3 | 97.0 | 96.7 |
| 15 | 97.1 | 96.3 | 97.1 | 96.7 |
| 25 | 97.1 | 96.4 | 97.0 | 96.6 |
| 35 | 97.0 | 96.3 | 97.1 | 96.5 |
Table 4.
Classification success for different numbers of hidden layers.
Table 4.
Classification success for different numbers of hidden layers.
| Number of | TCRA | TCRD |
|---|
| Hidden Layers | ACC (%) | BAC (%) | ACC (%) | BAC (%) |
|---|
| 1 | 97.1 | 96.5 | 97.1 | 96.9 |
| 2 | 97.0 | 96.2 | 97.0 | 96.6 |
| 3 | 96.8 | 96.1 | 96.9 | 96.4 |
Table 5.
Classification success for different numbers of training data points.
Table 5.
Classification success for different numbers of training data points.
| Data | Training | TCRA | TCRD |
|---|
| | Dataset Size | ACC (%) | BAC (%) | ACC (%) | BAC (%) |
|---|
| Data 1 | 500 | 98.8 | 97.2 | 99.2 | 98.6 |
| | 1000 | 98.9 | 98.9 | 99.2 | 99.1 |
| | 1500 | 99.5 | 99.2 | 99.2 | 98.7 |
| Data 2 | 500 | 98.8 | 97.1 | 98.7 | 97.6 |
| | 1000 | 98.9 | 97.1 | 98.5 | 97.4 |
| | 1500 | 98.8 | 97.4 | 98.7 | 97.6 |
| Data 3 | 500 | 92.6 | 93.1 | 92.3 | 93.5 |
| | 1000 | 92.9 | 93.1 | 93.4 | 93.6 |
| | 1500 | 93.5 | 93.6 | 93.7 | 93.5 |
| Mean | 500 | 96.8 | 95.8 | 96.7 | 96.6 |
| | 1000 | 96.9 | 96.3 | 97.0 | 96.7 |
| | 1500 | 97.3 | 96.7 | 97.2 | 96.6 |
Table 6.
Classification errors in the most complex dataset (Rockslide) for the mGMM (ACC 99.21%; BAC 94.25%) and DNN (1 hidden layer, 15 neurons, 1500 training points; ACC 93.9%; BAC 94.2%) algorithms; note that the vast majority of the mGMM errors are in incorrect classification of ice to the stones class, while in DNN, the errors are more evenly distributed. Results are expressed in %.
| Method | Class | Total Errors (%) | Erroneously Classified as (%) |
|---|
| | | | Vegetation | Soil | Stones | Ice |
|---|
| mGMM | Vegetation | 1.0 | - | 0.3 | 0.7 | 0.0 |
| | Soil | 1.2 | 1.0 | - | 0.2 | 0.0 |
| | Stones | 0.4 | 0.0 | 0.1 | - | 0.3 |
| | Ice | 20.4 | 0.0 | 0.0 | 20.4 | - |
| DNN | Vegetation | 2.4 | - | 2.0 | 0.4 | 0.0 |
| | Soil | 6.4 | 5.8 | - | 0.0 | 0.6 |
| | Stones | 7.8 | 3.1 | 1.7 | - | 3.0 |
| | Ice | 6.7 | 0.0 | 1.0 | 5.7 | - |
| Disclaimer/Publisher’s Note: The statements, opinions and data contained in all publications are solely those of the individual author(s) and contributor(s) and not of MDPI and/or the editor(s). MDPI and/or the editor(s) disclaim responsibility for any injury to people or property resulting from any ideas, methods, instructions or products referred to in the content. |
© 2023 by the authors. Licensee MDPI, Basel, Switzerland. This article is an open access article distributed under the terms and conditions of the Creative Commons Attribution (CC BY) license (https://creativecommons.org/licenses/by/4.0/).


