1. Introduction
Synthetic-aperture radars [
1] are active microwave-imaging radars, which can obtain high-resolution remote-sensing images of Earth in all forms of weather and at any time of the day, and offer a certain ability to penetrate the Earth’s surface. As an important high-resolution-radar remote-sensing technology, SAR has been rapidly developed over decades, and mature high-quality commercial SAR products, including Alos2 [
2], RadarSAT-2 [
3], Sentinel-1 [
4], and TerraSAR [
5], have been formed internationally. Synthetic-aperture radars have provided high-quality and unique remote-sensing services in various fields, such as agricultural classification [
6], topographic mapping [
7], disaster reduction and relief [
8], ship detection [
9], etc. Quantitative applications, such as soil-moisture inversion [
10], ocean-wind-field inversion [
11], forest-biomass inversion [
12], etc., have received increasing attention. These applications make high demands of the quantization and data-processing accuracy of SAR data. Furthermore, large amounts of accumulated ground-observation SAR data can also provide useful feedback for SAR-data processing, which is reflected in the analysis and mining of stable features and rules in multidimensional space based on massive historical data, as well as offering the mining of high-quality objects for improving the quality of SAR images.
The amplitudes of SAR-image products can be converted into the backscattering coefficient of ground objects after calibration, which is the basis of a variety of subsequent quantitative applications. Radiation calibration is essential in SAR-image-data processing. During the in-orbit testing of space-borne SAR sensors, it is generally necessary to complete radiometric calibration through artificial calibrators. During the long mission-life periods of SAR observation, there are many interference factors, such as device aging, temperature, rays, and solar activities. Therefore, it is necessary to ensure that the SAR system can maintain a stable and consistent radiation level with high-quality SAR data products. The long-term monitoring of SAR-image-radiation quality is an effective coping strategy. With the increasing number and working modes of space-borne SAR sensors, the demand for a convenient, low-cost, and high-precision long-term monitoring method of SAR-image-radiation quality is of practical significance.
Currently, there are two main SAR-based radiometric calibration methods. One is based on artificial calibration equipment, such as radiation transmitters [
13,
14] or corner reflectors [
15]. The other is the use of a uniform distribution target, such as the Amazon rainforest [
16,
17,
18], as a stable radiation reference. Generally, space-borne SAR-data products must undergo calibration experiments to complete relevant radiation-calibration work. In terms of SAR-radiation-quality monitoring, on the one hand, with the large-scale deployment of calibration equipment, represented by trihedral corner reflectors, the long-term calibration requirements of SAR-radiation quality have been met to some extent. On the other hand, research into radiation references based on ground objects in scenes themselves has long been the focus of scholars. Rainforests, ice sheets [
19], deserts [
20], and oceans [
21,
22] in natural ground objects were all studied and used for radiation calibration by scholars, among which the Amazon tropical rainforest is the most widely studied and used SAR-radiation reference. In addition, permanent scatters (PS) [
23,
24] are researched for radiation calibration. It was proven that artificial strongly scattering targets in urban areas can also be effective and reliable radiation references. Zakharov et al. [
25] studied the radiation stability of oil platforms based on L-band SAR satellite data and found that their radiation stability reached a high level. The use of novel general ground objects developed by human society as a stable reference for SAR radiometric monitoring is an interesting and valuable exploration direction.
In this paper, the novel concept of the hyper-pixel is proposed, which refers to a collection of ground-object features of the same semantic area in a large spatial dimension. The special hyper-pixel object studied in this paper corresponds to a kind of special residential area in urban areas. It is found that the radiation-datum value extracted by the hyper-pixel is a highly stable quantity in the time domain. Based on this, this paper contributes to a fast, low-cost, and high-precision SAR-based radiation-monitoring technique, which has the potential for further use in cross-radiation calibration.
The experiment in this paper is based on a Sentinel-1B dataset of 68 repeated orbit observations with the same beam spanning 5 years, from 2016 to 2022. Multiple hyper-pixel objects in the scene were extracted, the radiation-data values of each hyper-pixel were calculated, and the stability performance of the time-domain radiation datum of these hyper-pixels was obtained. It was found that the stability of the radiation datum was generally better than 0.3 dB (1). The radiometric changes in the SAR system were established based on the performance of the radiation-data values in the time domain. We also used 40 tropical-rainforest observations by Sentinel-1A from 2018 to 2022 to compare and verify the temporal stability of the hyper-pixel’s radiation-data values. In addition, based on 34 observations by GF-3 in San Diego from 2018 to 2022, this paper also studies the radiation-data changes of the hyper-pixels under the conditions of different geometric dimensions, such as building-group orientation and satellite perspective, providing a research basis for the application of the hyper-pixel in SAR-based radiation calibration under the conditions of different orbital SAR images and non-multi-temporal data.
This paper is organized as follows. In
Section 2, the concept of the hyper-pixel and the feature analysis of the corresponding ground object are given, and the method of calculation of the SAR-radiation-data value of the hyper-pixel is given. In
Section 3, the time-domain radiometric stability performances of multiple hyper-pixel objects from the Sentinel-1B Houston dataset are presented. In
Section 4, the influence of the changes in geometric dimension of the hyper-pixel, such as building orientation and incident angle, on the radiation datum is studied and discussed.
Section 5 gives the conclusion.
2. Methodology
2.1. The Concept of Hyper-Pixel
In the traditional SAR imaging model, it is simply considered that there is an approximate “one-to-one” mapping relationship between the observation scene and observation data, and “pixel-by-pixel” imaging can be adopted by the “ideal point target” model.
Formula (1) is the classic “ideal point target” model of traditional imaging mode, where represent the three-dimensional coordinates of the real backscatterers, represent the azimuth and range-coordinate position of the target on the SAR image, is the scattering of real objects, is the observation data, is the observation noise, and represents the ideal transfer function. The symbol represents convolution.
However, the actual SAR observations have the multi-path effect, overlay, occlusion, and other phenomena, as well as multi-pixel energy dispersion. The observation scenes and observation data show “many-to-many” mapping, and “ideal point target” model is no longer valid. With complex target scattering and systematic error coupling, the model parameters are difficult to accurately and stably estimate and calibrate.
Under these complex conditions, the concept of the hyper-pixel is proposed, for which the multi-dimensional space of space, time, spectrum and so on has stable distribution rules and correlation constraints. The concept of a hyper-pixel is defined simply as:
where the
represents a hyper-pixel target; here, we use the notation of
to abstractly represent a constraint space. The symbol
means the signal is complex scattering coupled with other signal energy. The
represent the location of multiple real scattering centers, and the symbol
stands for the
-th backscatterer. The
stands for the multi-dimensional space of radiation, time, space, geometry, and so on. The symbol
represents many-to-many mapping with multi-pixel coupling, where the mark of average is borrowed to reflect that hyper-pixel is a collection of multiple backscatterers, which is used for stable feature extraction under multi-pixel processing.
By using the concept of the hyper-pixel and analyzing a large amount of data, the stability characteristics or constraint relations of multi-pixel targets in the multi-dimensional spatial data are extracted. Thus, more accurate and robust imaging-model parameters can be obtained through the prior knowledge of the hyper-pixel target set:
The hyper-pixel is an information complex of semantic ground objects or special scattering objects of ground objects, which can be a research object for comprehensive interpretation of ground objects and the SAR-system imaging model. The hyper-pixel is a special set of pixels with stable characteristics and correlation constraints in space–time-spectrum multi-dimensional space that can be mined for specific information. The concept of hyper-pixel can be used in the analysis and application of massive Earth-observation data and provides a new approach for mining potential high-value information in SAR data.
The concept of the hyper-pixel described above is highly abstract and can be used to guide many SAR-based processing fields. This article focuses on an application of a specific field as long-term radiation-quality monitoring for SAR systems by studying a special kind of urban residential hyper-pixel. Based on finite-dimensional feature analysis and mining, it realizes the extraction of radiation-stability features from ground objects, and finally achieves the purpose of long-term SAR-system radiation monitoring, which is an intuitive and effective application of the hyper-pixel.
2.2. The Characteristics of the Ground Objects of This Special Urban-Residential Hyper-Pixel
The scene objects corresponding to the hyper-pixel studied in this paper are residential areas widely distributed in the urban areas of North America. Below, the Houston urban area is used as an example to study the essential characteristics of the object. The object consists of a basic residential unit, households, each consisting of a single low-rise main single-family building and a yard (grass and vegetation) in front of and behind it. There are horizontal roads on both sides of the two-level units, and there is a wide, longitudinal main road with ten to as many as dozens of units side by side in the horizontal direction. In addition, the roof configuration of the main building is mainly composed of a triangular prism or pyramidal cone, and the direction of the main edge is generally parallel or perpendicular to the adjacent road. The ground object is a complex comprehensive type composed of a variety of simple objects, including vegetation, roads, and buildings. Although the performance of this type of ground object is complex at the local unit level, due to the clustering of this housing group and the consistency among units, it is presented as a piece of relatively consistent ground-object-target type in a large remote-sensing image, such as a SAR image.
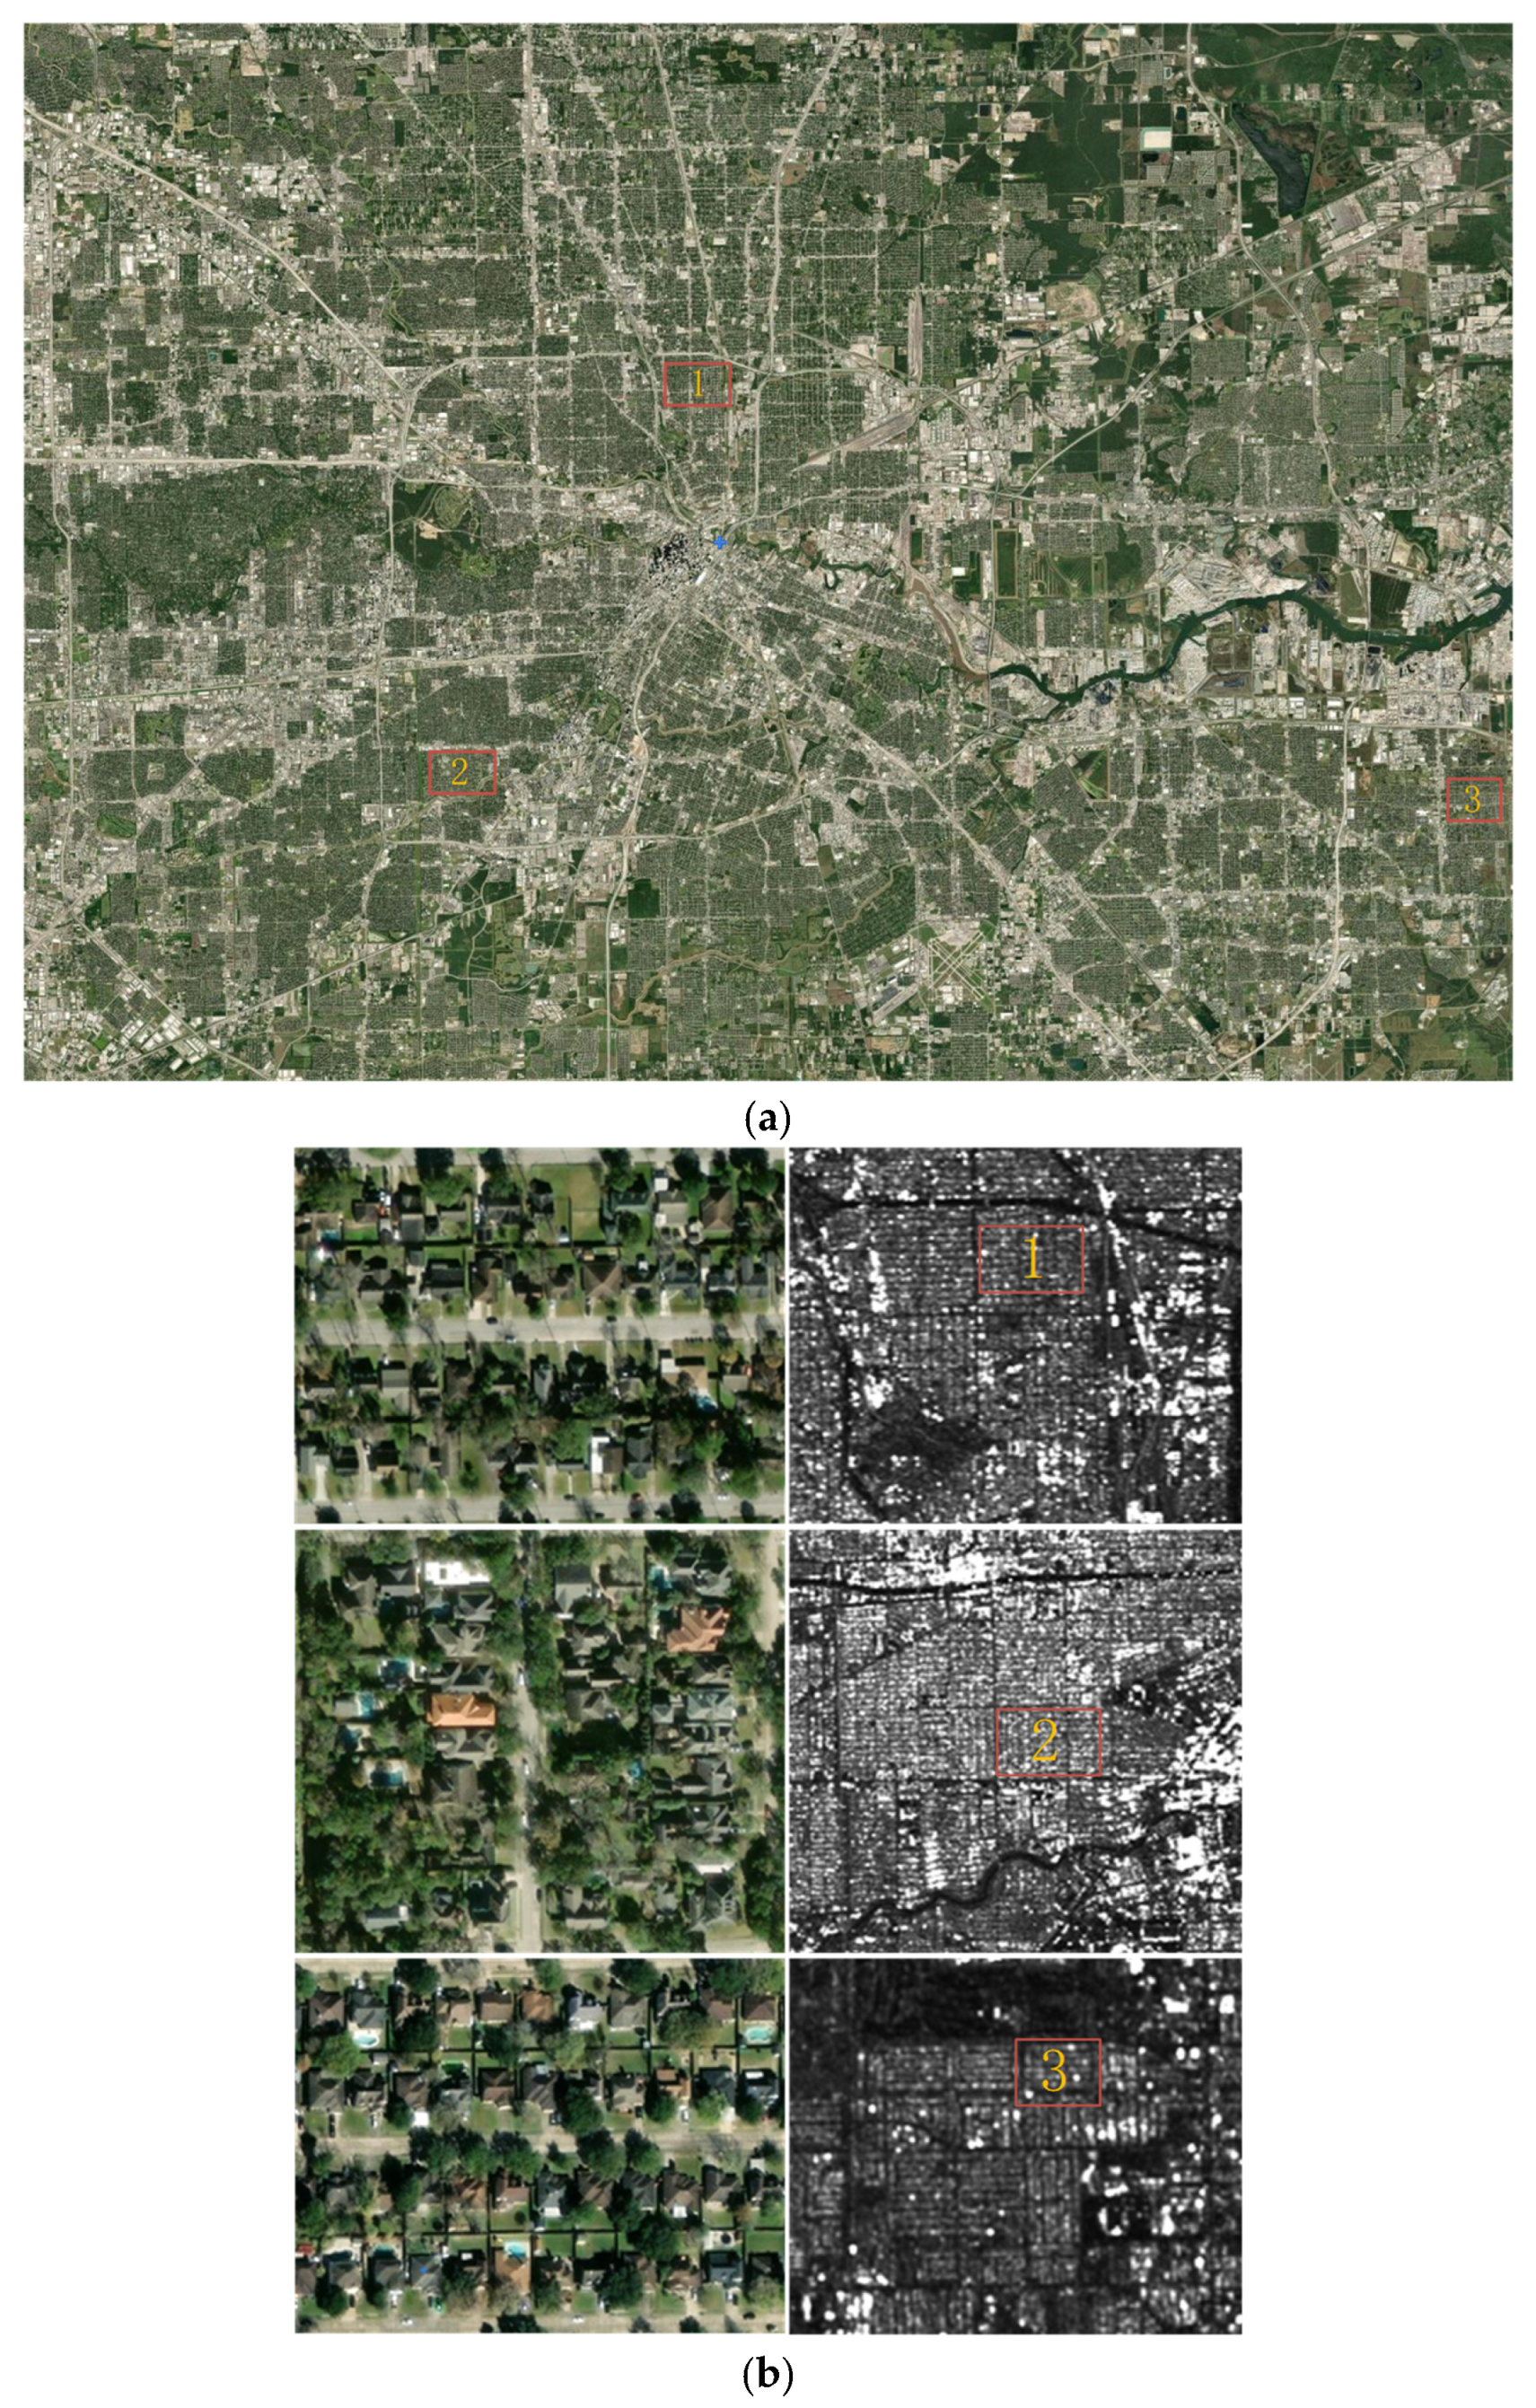
A high-resolution optical image of the North American residential area is shown in
Figure 1, which shows the residential clusters in three areas of Houston in optical detail and in SAR radiation.
This type of ground object is widely distributed in the urban areas of Houston. In fact, it is common in North American cities and towns, indicating the universality of this particular hyper-pixel object. Although there is clear consistency across the residential units within residential areas, there may be variability among the units for different residential clusters. This is mainly reflected in the following: (1) differences between buildings, since the building units in different residential areas may be different; (2) differences in vegetation, which are mainly reflected in the sparseness and size of the tree canopy, as shown in
Figure 1b, in which the vegetation in the second area is more lush; and (3) differences in distribution, since there may be obvious differences between the composition proportions of buildings, vegetation, grassland, and roads in different residential areas. It can be seen that the residential hyper-pixels are not identical in different geographical locations and, naturally, the radiation references of different hyper-pixels cannot be guaranteed to be the same, but this does not mean that the radiation datum of the hyper-pixels themselves are not stable. Therefore, this paper is based on the analysis of the radiation characteristics of the same hyper-pixel or a combination of fixed hyper-pixels.
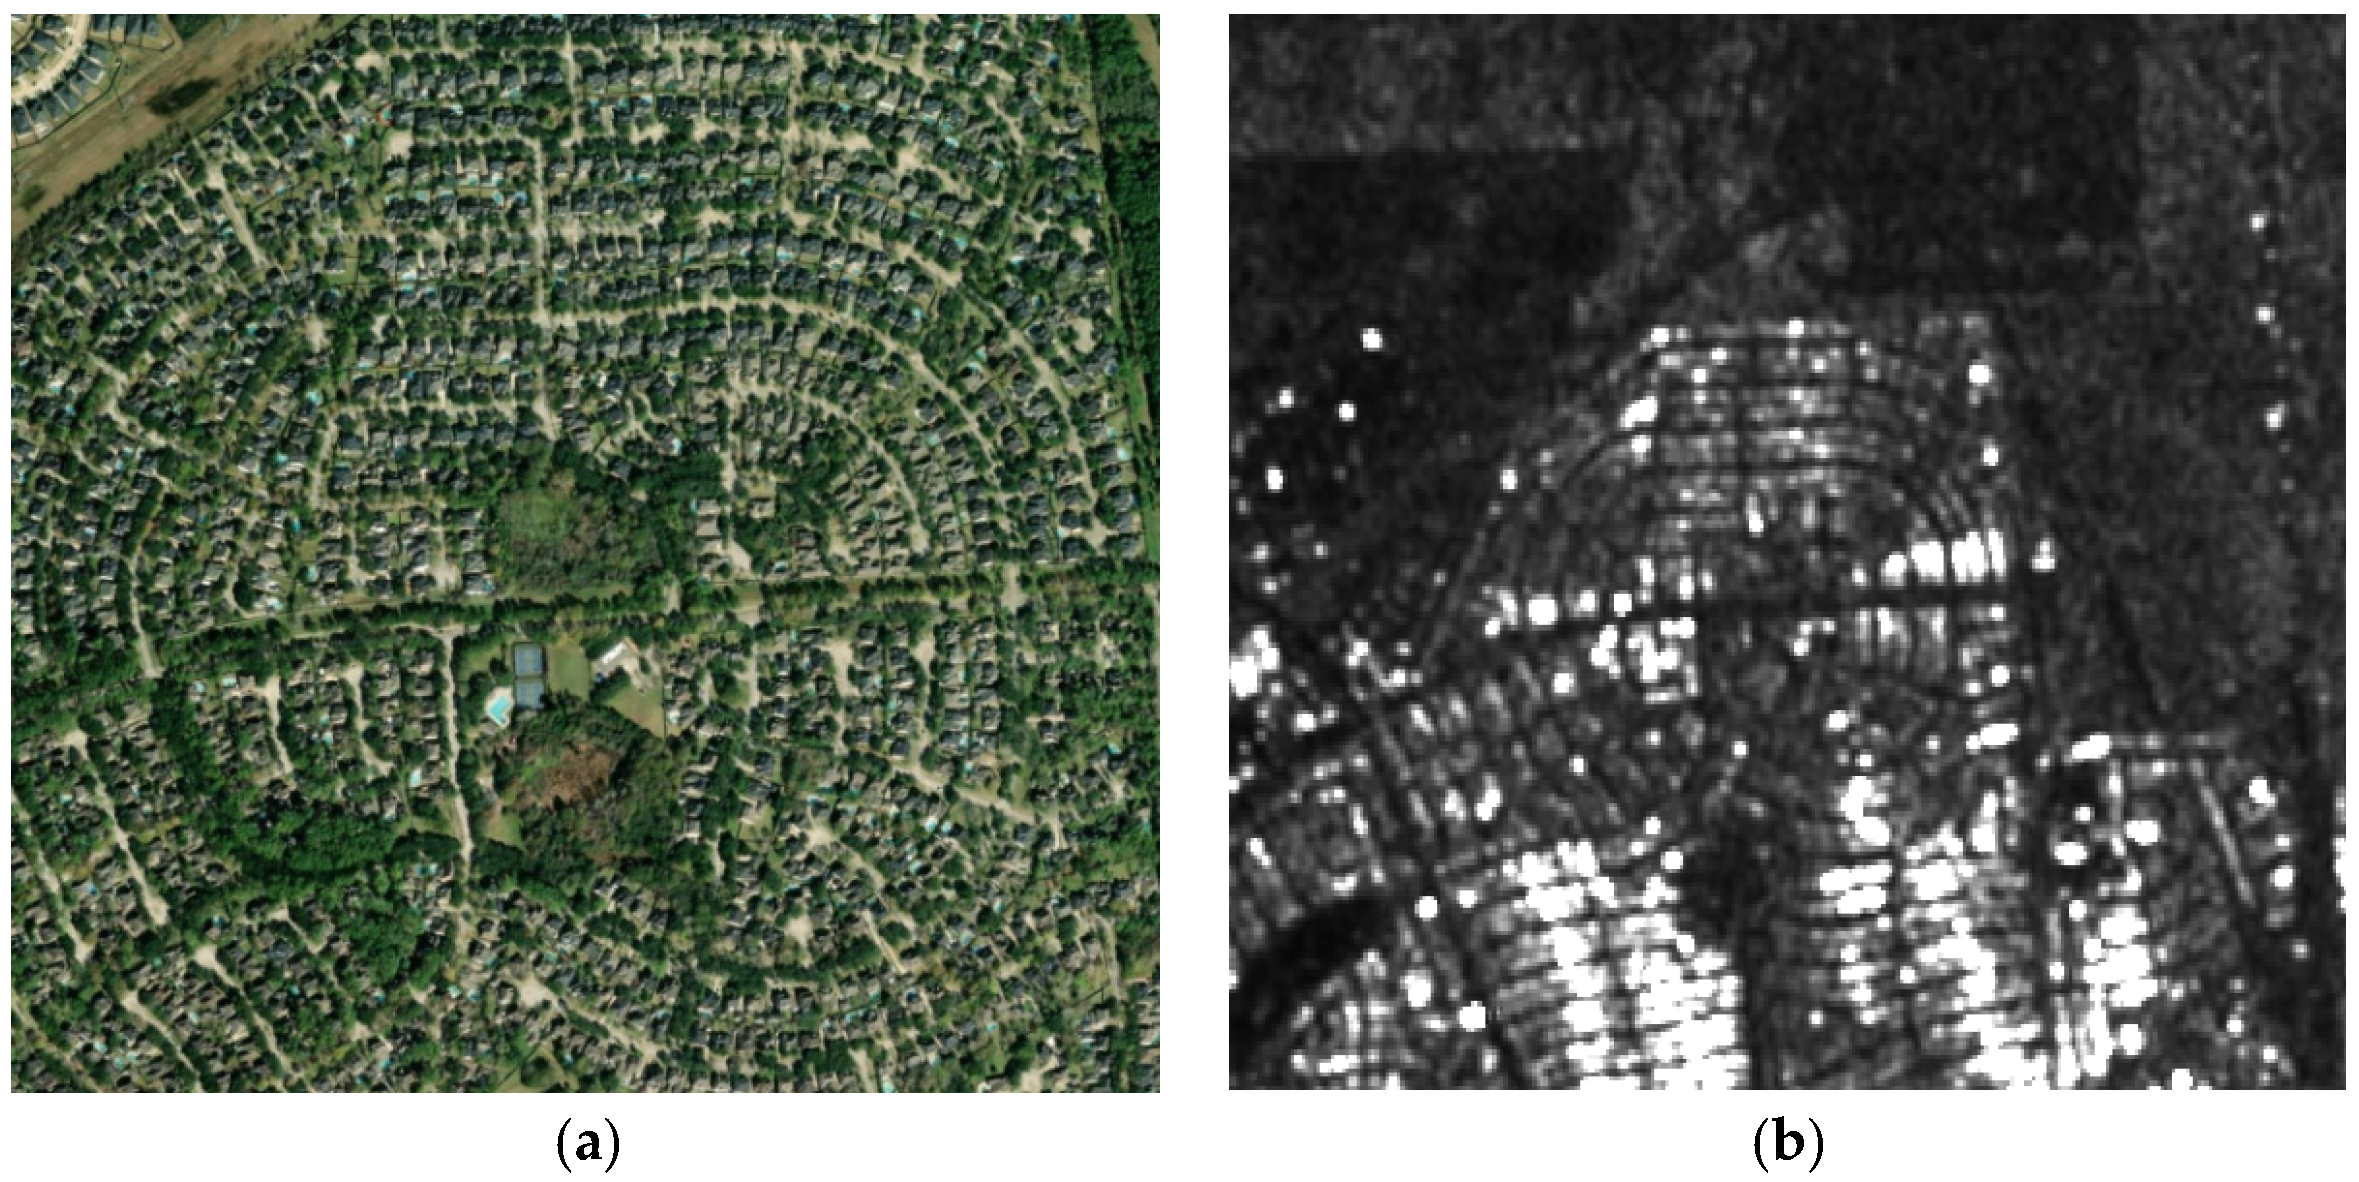
In addition, the hyper-pixels in this urban area may appear in two kinds of arrangement, regular orthogonal (as shown in
Figure 1b) and curved (as shown in
Figure 2). Due to the orientation angle of the buildings, there are obvious scattering-intensity variations in the residential area in the SAR image in
Figure 2b, which mainly originate from the obvious changes in the geometric orientation within the hyper-pixel. Due to the complexity of the use of this kind of object to extract the hyper-pixel radiation datum, this kind of hyper-pixel is not taken as the research target in this paper, but in
Section 4, the influence of the geometric orientation on radiation characteristics is studied.
2.3. The Radiometric Monitoring Method of Hyper-Pixel
For this special residential hyper-pixel, the radiation datum is a stable radiation reference when the geometric and spatial dimension parameters are constant. This section describes the method for calculating the radiation datum and the processing procedure used for SAR system’s radiation-quality monitoring.
First, for the extraction of residential hyper-pixel targets, it is necessary to ensure that a hyper-pixel contains multiple residential units, to make it statistically significant. Based on the analysis in
Section 2.2, the ground object corresponding to one hyper-pixel in the image is a homogeneous residential area, and the hyper-pixel boundaries can be distinguished according to main streets, with high entropy values of scattering variation or roads with low scattering intensity. In this paper, we focus on the study of the radiometric characteristics of this hyper-pixel itself. Without to the need to deal with a large number of urban scenes, we take the approach of manually extracting the target residential region, since the human error is sufficiently small to be negligible with the assistance of high-resolution Google images and can avoid the introduction of additional variables by image-segmentation algorithms.
Next, it is necessary to calculate the stable radiation-reference value of the extracted hyper-pixels in the urban area. For uniformly distributed targets such, as tropical rainforests, the method of the local spatial mean is generally used to achieve the extraction of corresponding radiation-intensity values of ground objects. However, for these particular residential hyper-pixels, in low-resolution SAR images, the hyper-pixels have regular texture features, such as alternating light and dark stripes or spots. For high-resolution data, the residential-area unit may present radiation in a regular rectangular block. The residential area is prone to obvious strong scattering points, so the single-pixel extraction method is not suitable. The authors of [
26] proposed a method of scattering median statistics of regional spatial slices. This paper uses this processing approach to calculate the median scattering intensity of all image pixels of the hyper-pixel as a stable radiation reference. For multiple hyper-pixel targets in a given scene, a fixed hyper-pixel set
was selected and the radiation-reference mean of each hyper-pixel was calculated as the radiation-datum value of the SAR data. Radiation-datum-value extraction is carried out according to the following formula:
where the
represents the calculation of the scattering median for the pixel points corresponding to the
-th hyper-pixel object. The symbol
stands for average calculation.
With the multi-temporal repetitive-orbit-observation SAR-dataset, the application of SAR systems’ radiometric monitoring by urban residential hyper-pixels is based on the following process:
Step 1: Collection of the multi-temporal observation dataset: determine the target urban area, collect corresponding historical data, and collect the dataset with the same beam, the same orbit direction, and the same imaging mode (otherwise, refer to the content in
Section 4, it requires sufficient prior knowledge of the performances of hyper-pixels in the target region).
Step 2: SAR-data preprocessing, including necessary data quantization, radiometric correction, geometric correction, and other operations for all scenes in the dataset.
Step 3: Registration operation. Time-series image registration is used to generate sub-pixel level matching multi-temporal dataset (there are many registration methods, but they are not the focus of this paper, and the proposed technique tolerates the existence of registration errors).
Step 4: Extraction of the residential hyper-pixels. According to
Section 2.2 and
Section 2.3, extract regular and uniform scene areas containing multiple housing units. Multiple hyper-pixels can be extracted from an urban area; the same hyper-pixel in the multi-temporal dataset corresponds to the same value of
.
Step 5: Calculation of radiation-datum value. First, check the hyper-pixel targets in all scenes to determine the hyper-pixel set for radiometric monitoring. Next, calculate the radiation-datum value representing the whole scene, according to Formula (4).
Step 6: SAR radiometric monitoring. According to Step 5, calculate the radiation datum of each scene in the multi-temporal dataset, monitor abnormal fluctuations and change trends, and realize the radiation monitoring of SAR products in the past stage. For newly acquired data that meet the imaging conditions, the radiation datum can be obtained through steps 2 to 4, and rapid radiometric monitoring is conducted by comparing the radiation datum with historical values.
3. Experimental Results
3.1. Sentinel-1 Multi-Temporal Data and Data Processing
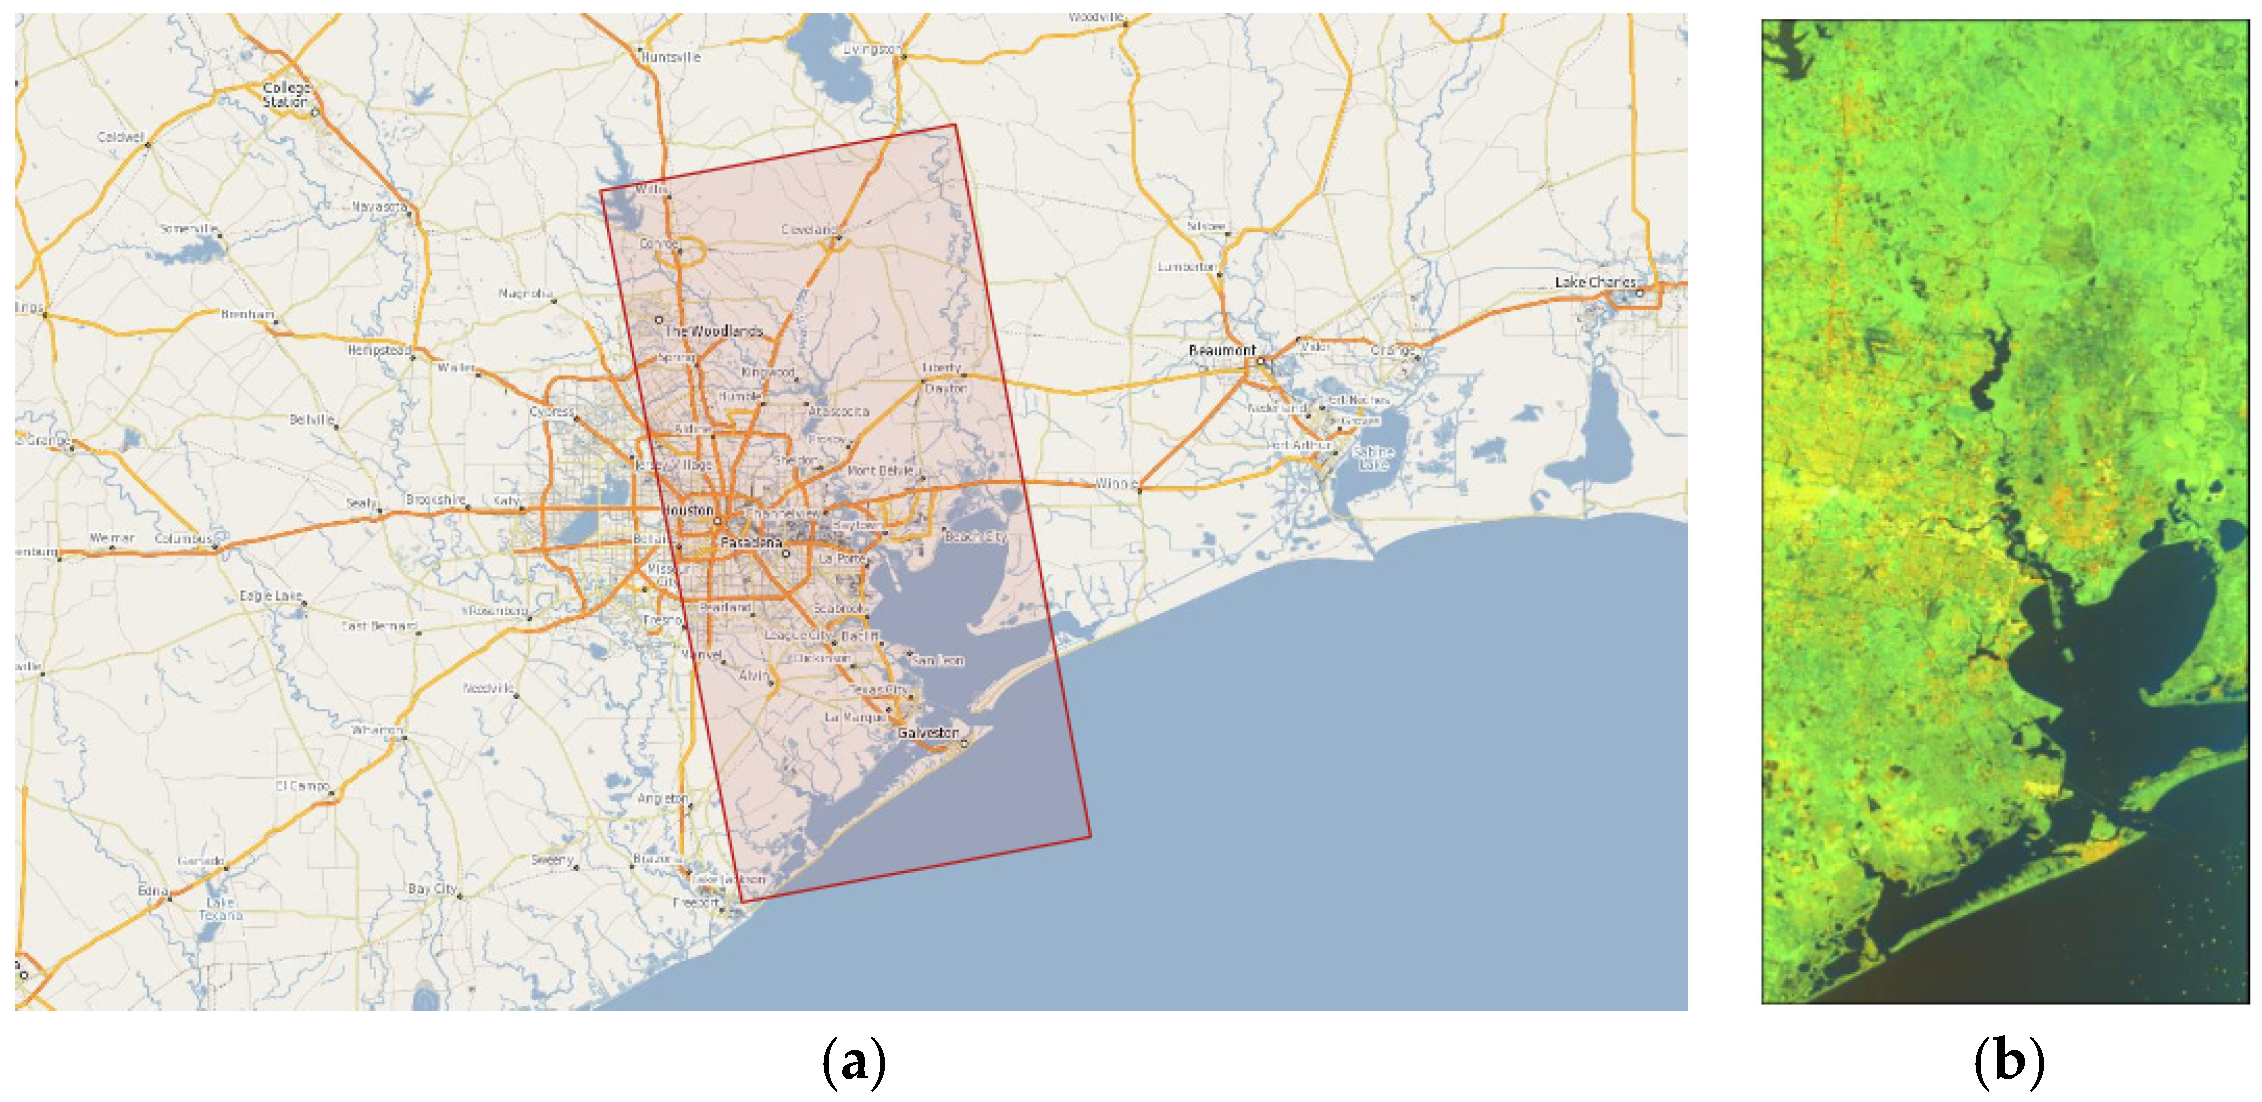
The experiment’s multi-temporal SAR dataset was derived from data from the European Space Agency’s Sentinel-1 mission [
4]. Sentinel-1’s C-band SAR constellation is divided into A and B stars and provides four imaging modes: Stripe (SM), wide interference (IW), ultra-wide (EW), and wave mode (WV). Sentinel-1 data have high radiation quality, their radiation-calibration stability is 0.5 dB (3
), and their absolute radiation accuracy is 1 dB (3
) [
27]. The dataset used in this paper is the ground range detected (GRD) data in SM mode, with a resolution of about 23 m, processed by 6 × 6 multi-view, with 68 scenes in total. Each scene ranges from October 2016 to November 2021, with a distribution interval of about 1 month. The dataset information is shown in
Table 1 and
Figure 3:
The ESA SAR-data-processing software, SNAP, was used to process the data, including the use of absolute radiometric correction to obtain images and geometric correction to convert the images to a coordinate system under the WGS84 reference frame.
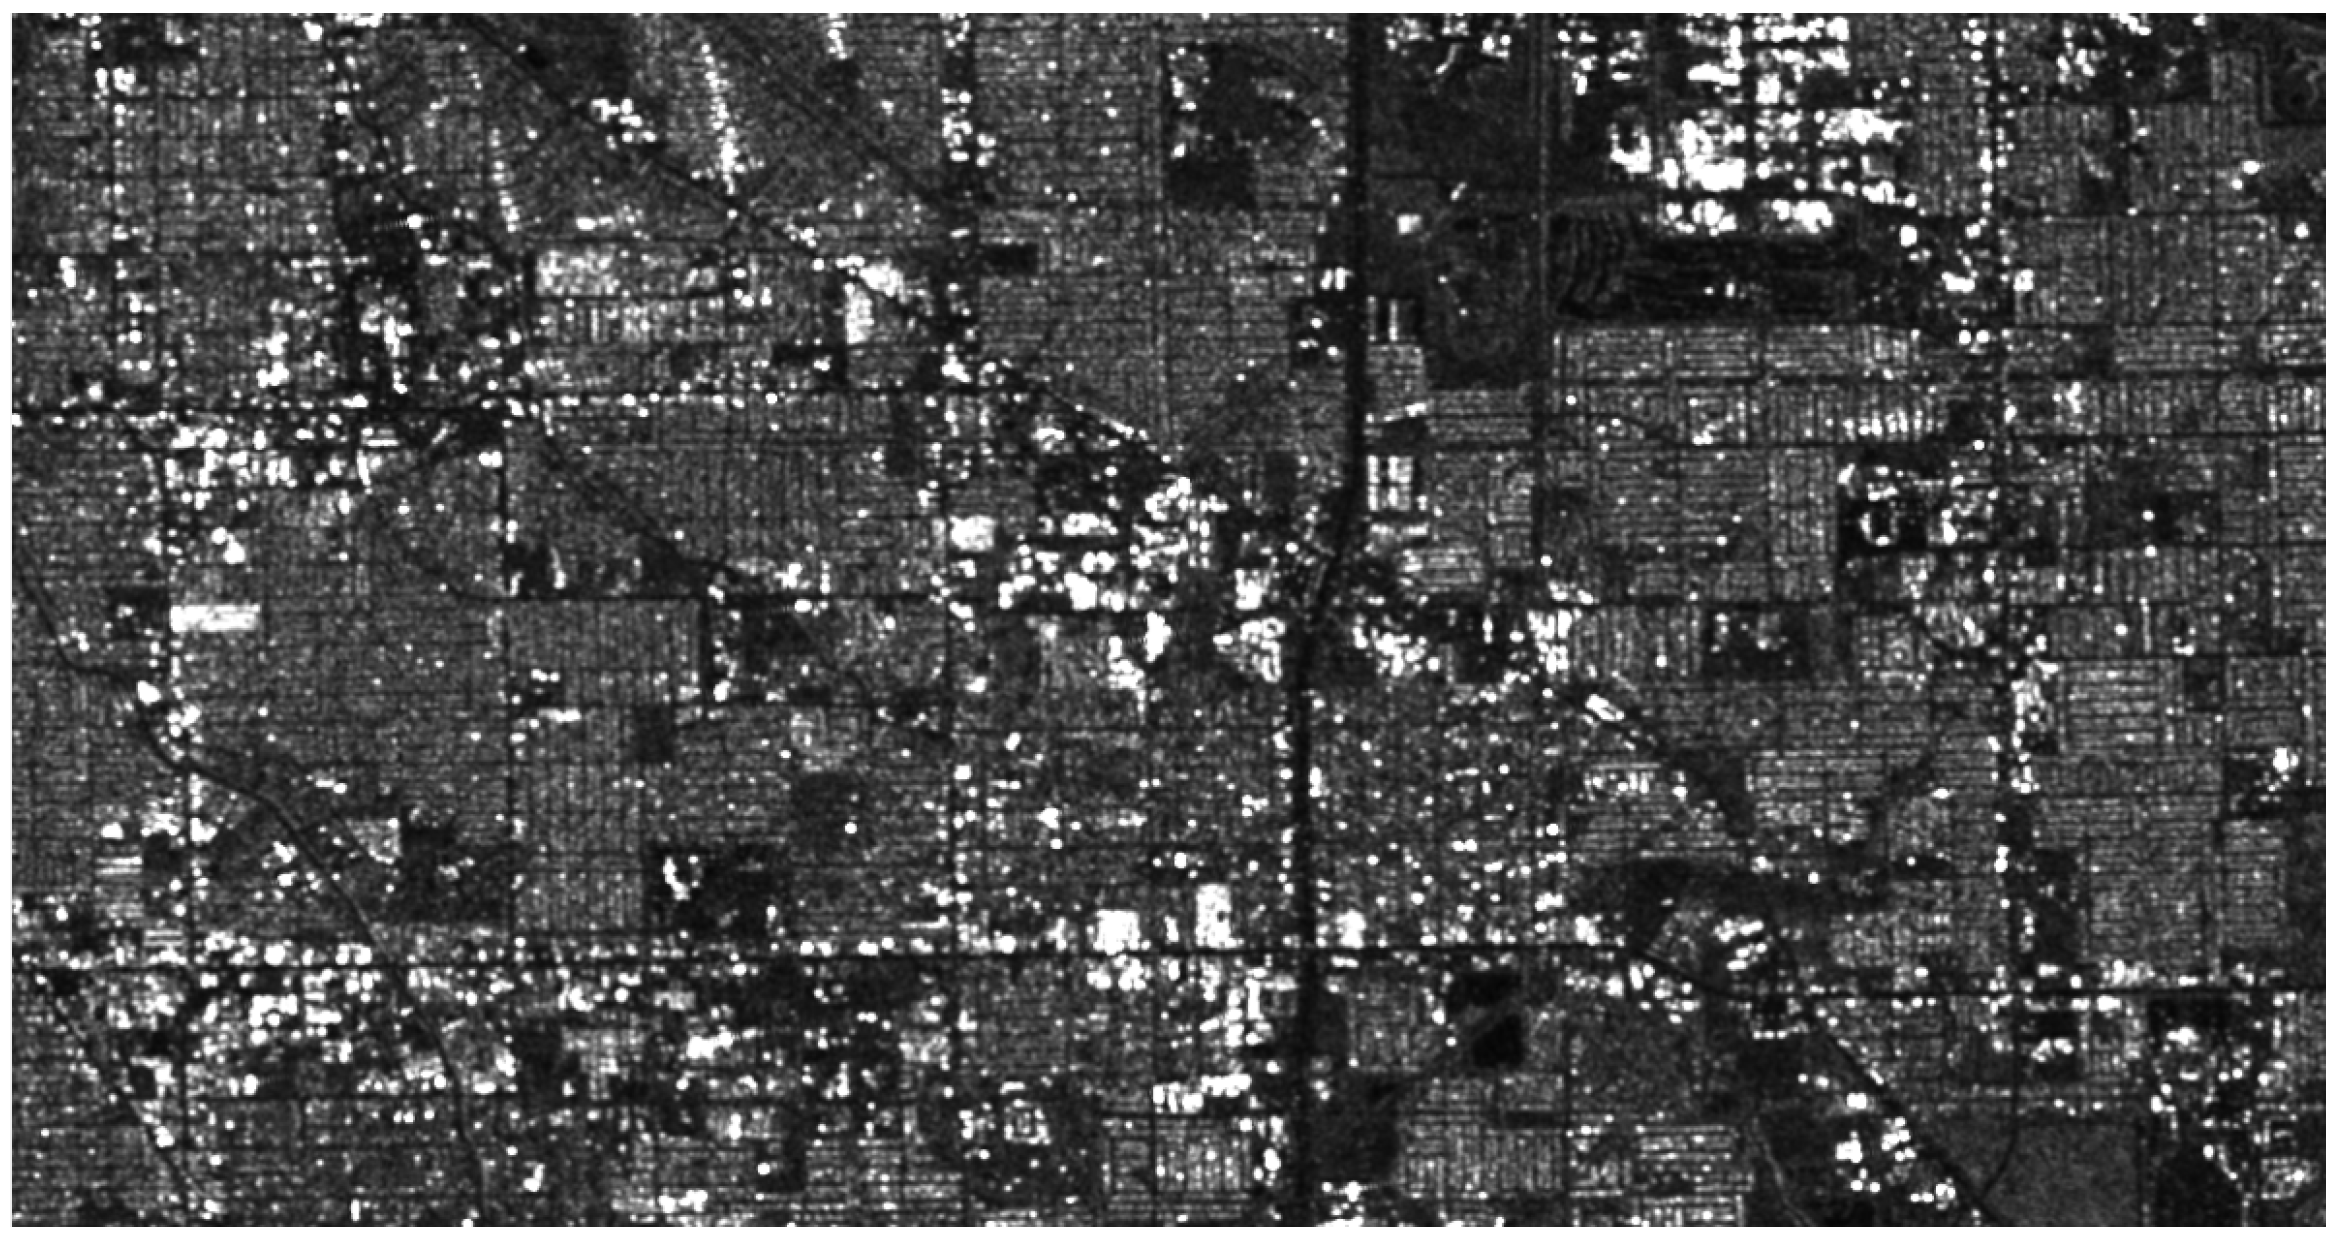
Next, it was necessary to register these data to achieve sub-pixel-level registration accuracy. A maximum-coherence search of the up-sampled images was applied to achieve the sub-pixel level registration. Although these scene data were strictly repeated orbit observations, pixel-level offsets were still present in the data for each scene after geometric correction by SNAP and, generally, there were random offsets within a dozen pixels. In particular, the scene around March 2018 was offset by about 70 pixels in the range direction and more than 380 pixels in azimuth, which made this scene significantly different from the others. After the registration operation, we took an area in the center of Houston city as the object of study. The scene is shown in the following figure.
For this selected Houston urban area, we obtained the preliminary performance of the scattering intensity of its SAR image with time from the time-series data, and the residential area without new residential constructions or demolitions in that period was selected for hyper-pixel extraction. It can be seen that although there were, inevitably, multiple strongly scattering points in the residential area, which may have been unstable, the method of median statistics used in the hyper-pixel radiation-datum calculation in this paper can prevent the influence of small numbers of discrete values of radiation, to a certain extent.
3.2. Time-Domain Radiation-Datum Stability Analysis of the Special Residential Hyper-Pixels
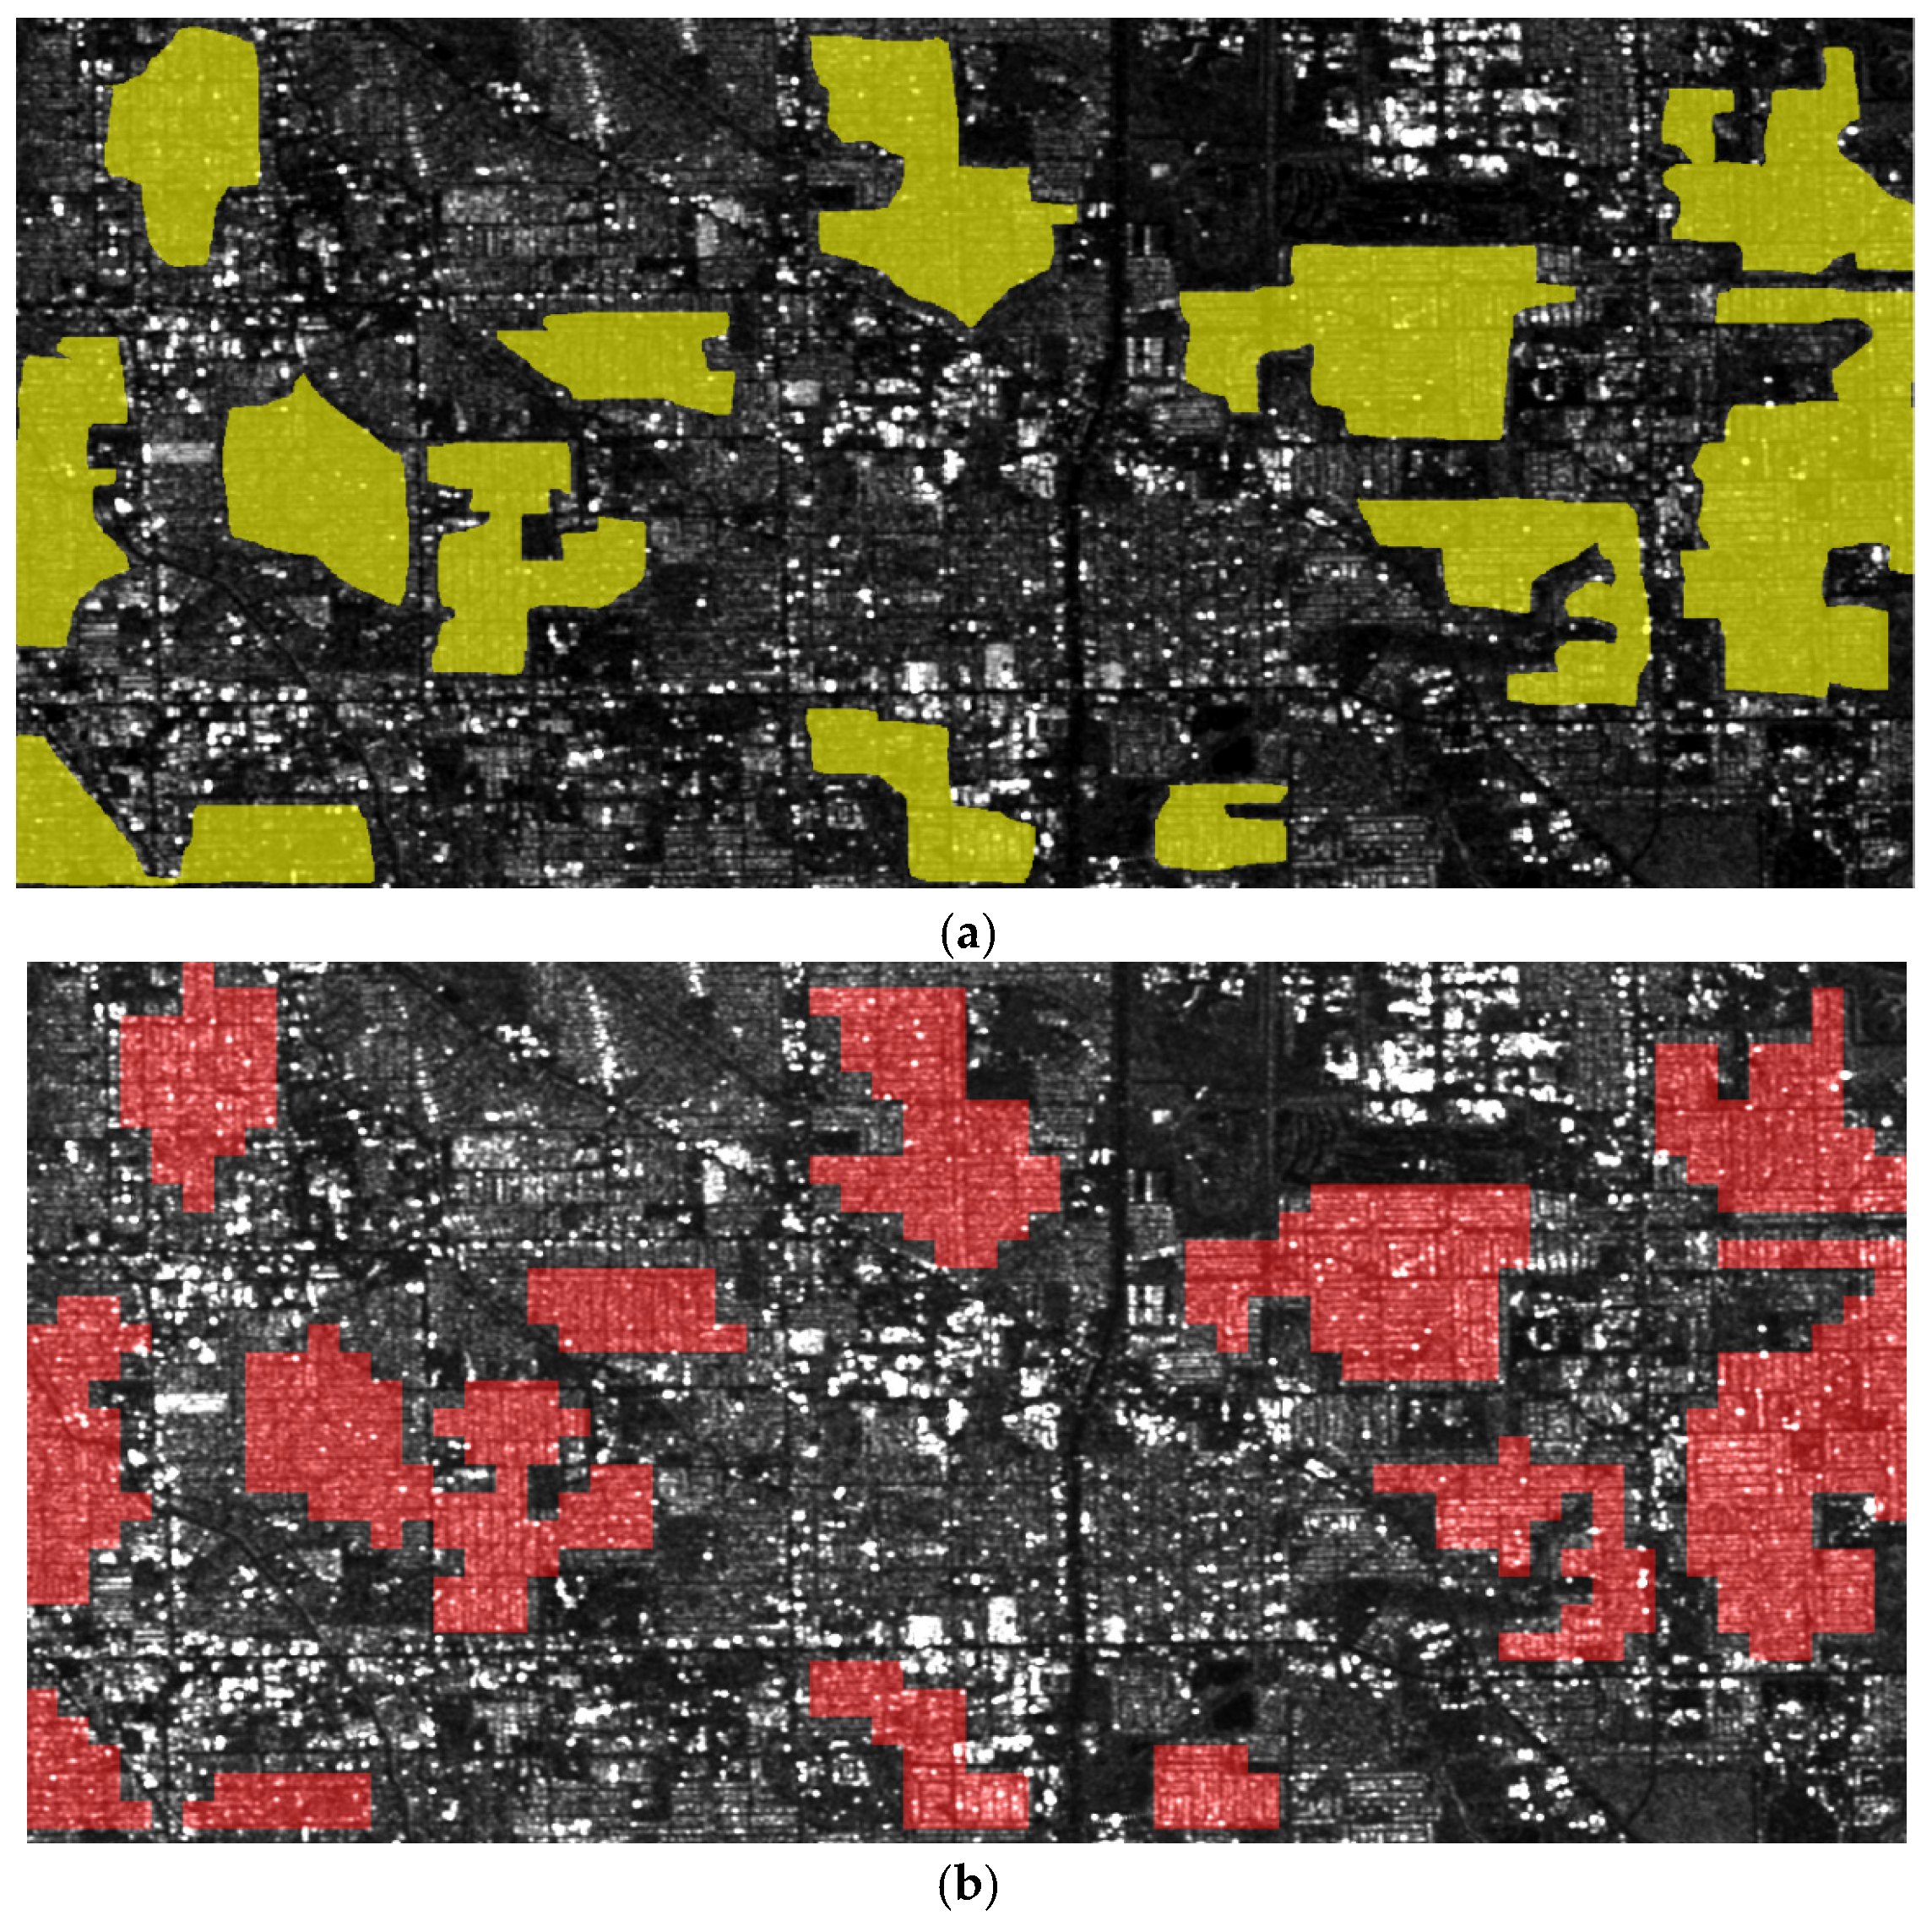
As can be seen from the urban features in
Figure 4, there is a large number of residential hyper-pixel targets in this central Houston area. This subsection presents an analysis of the time-domain radiation-datum stability of the residential hyper-pixels. Firstly, the residential hyper-pixel objects were manually extracted from the experimental area of the multi-temporal urban area in
Figure 4. The extraction results of up to 14 hyper-pixels were obtained, as shown in
Figure 5. The multiple irregular residential areas in
Figure 5a are the hyper-pixel targets.
We selected the 14 hyper-pixel targets as a fixed set for extracting the radiometric data from the scene to analyze the radiometric stability performance. For the irregular area covered by the extracted hyper-pixel set, first of all, the selected area was sliced, with a processing approach of 20 × 20 pixel slicing. When the slicing coverage overlapped with more than half of the hyper-pixel target pixels, the slice can WAS set as the target area; the area marked in red in
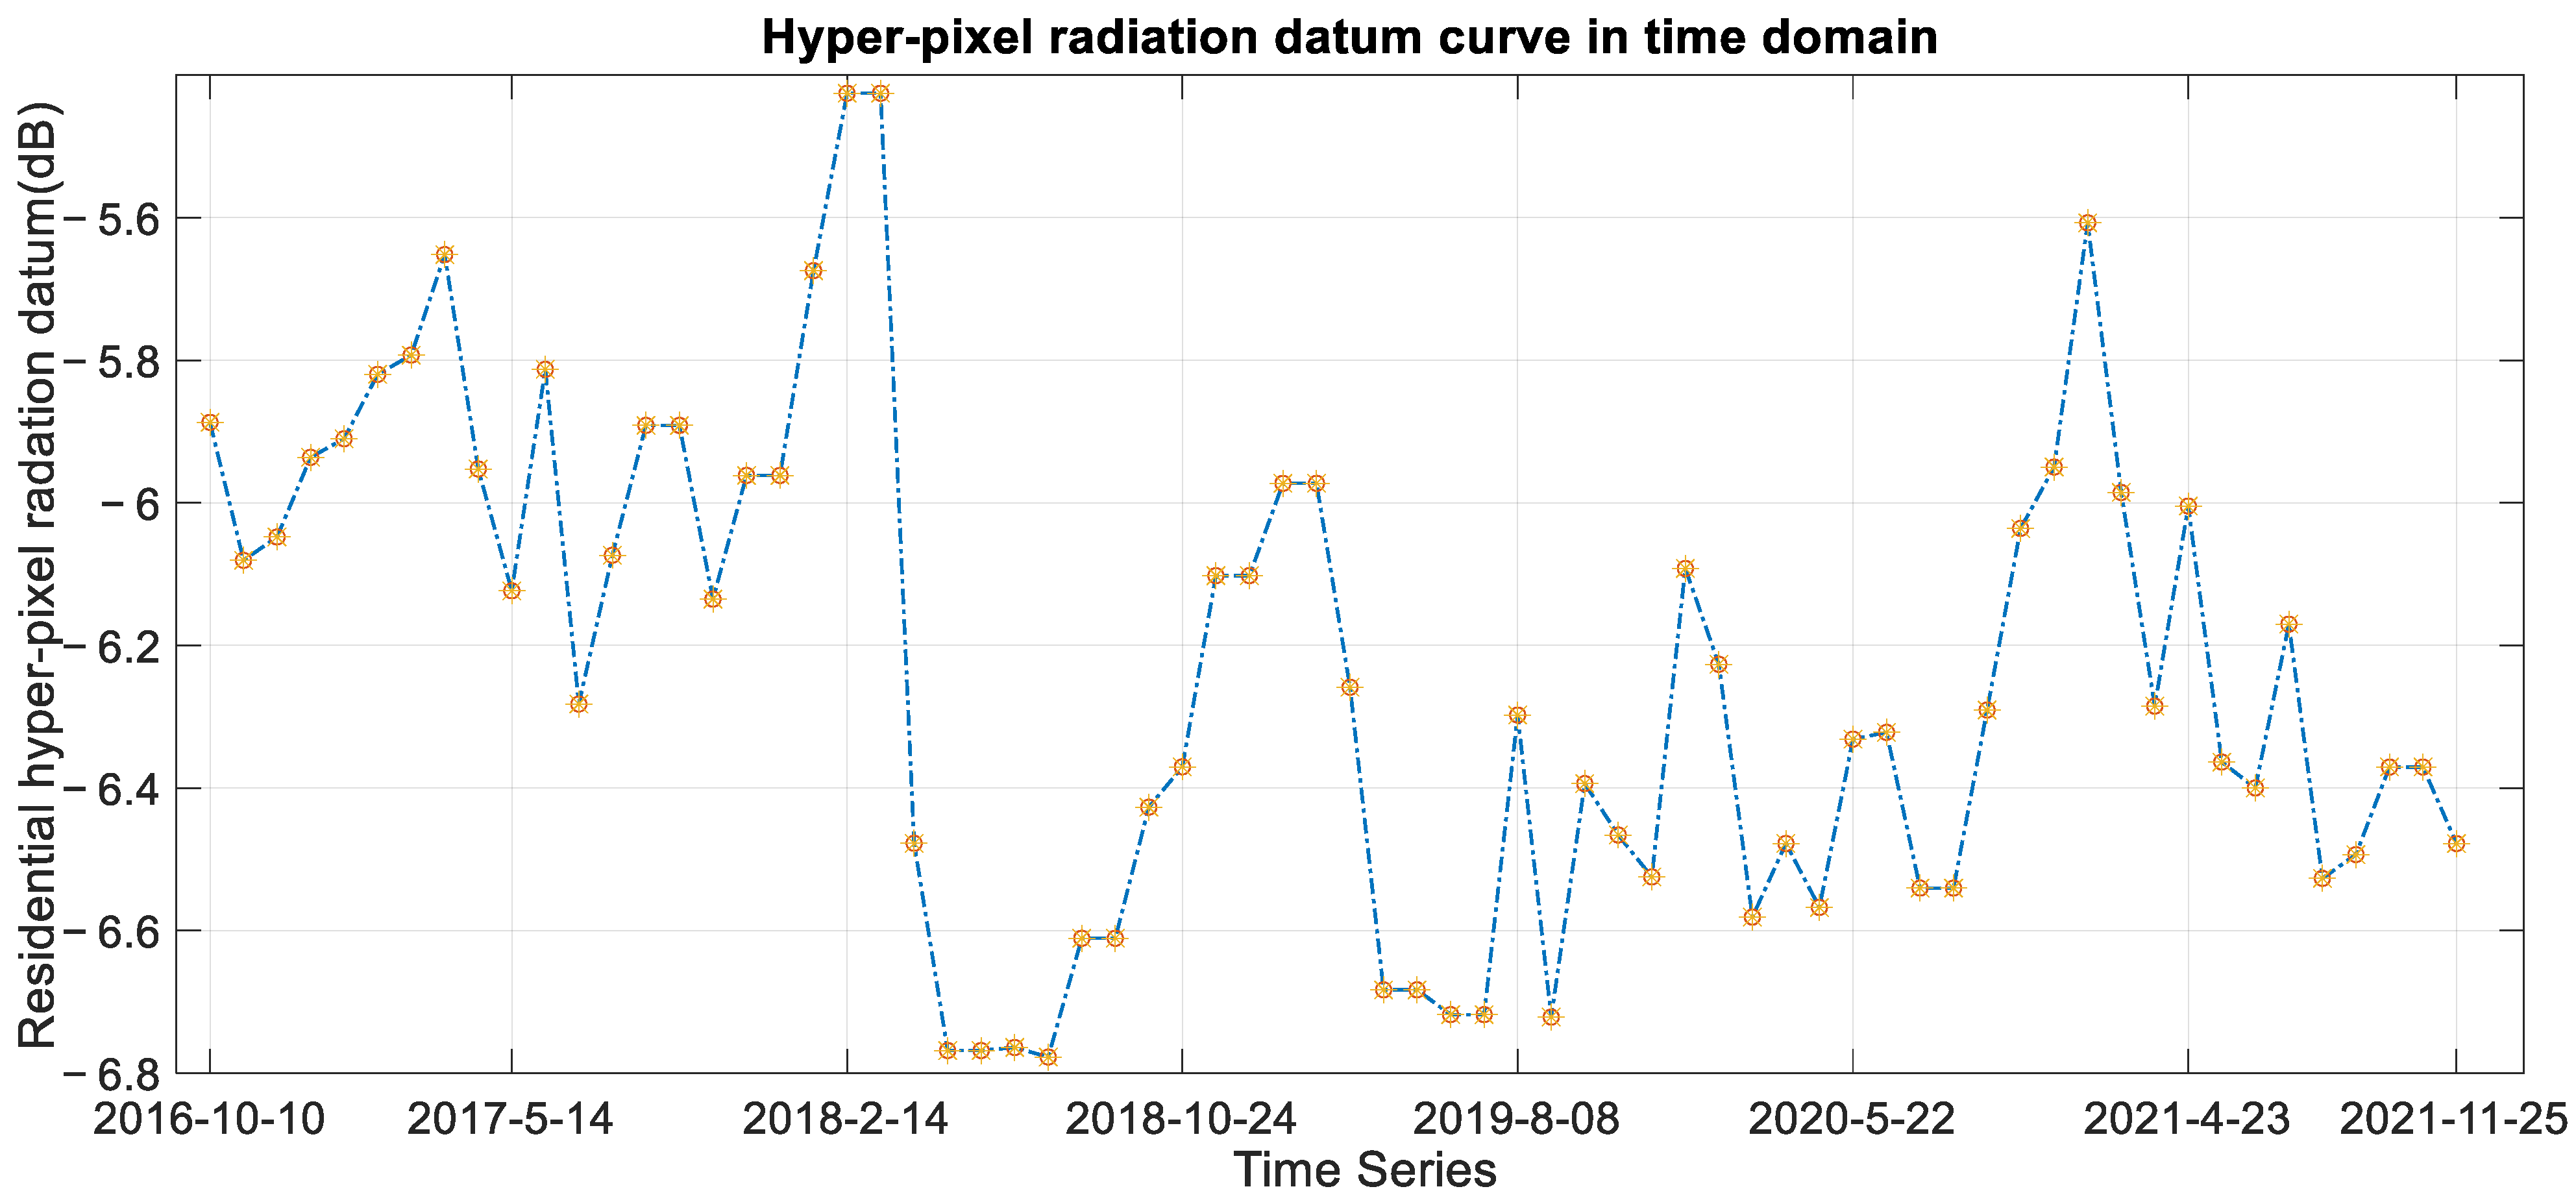
Figure 5b represents the final slices of the hyper-pixel set. Next, according to Equation (2), the median radiation value of the slices was calculated, after which the mean value of each slice was calculated as the radiation datum of all the hyper-pixels. The radiation-data values of the scene are shown in the time domain in
Figure 6.
From the experimental results, it can be observed that the radiation intensity of the first 21 scenes, i.e., 26 February 2018 and before, was higher, with an average value of −5.88 dB, while the radiation on and in 47 scenes after 22 March 2018 had an average value of −6.35 dB, with a difference of about 0.47 dB. In addition, the strong scattering performance in scene 20, 21 and the low scattering intensity in scenes 23 and 24 are visible, which reflects a numerical jump in radiation intensity. Considering the anomalous offset of hundreds of pixels in the coverage of this repeated observation around scene 22, we believe that the experimental results reflect a change in the radiometric quality of the S3 data products of the Sentinel 1B data in SM mode around March 2018. It was interesting to find that the geometric-position-anomaly variation and the radiation-anomaly variation in the SAR dataset coincided well in terms of time, and we believe that a small variation due to the onboard system, or other reasons, may be observed. This experimental result validates, to some extent, the radiometric-monitoring capability of the hyper-pixels.
In addition, for the radiation datum of the hyper-pixel set, the standard deviation of the first 21 scenes was 0.233 dB, the standard deviation of the last 47 scenes was 0.292 dB, and the total standard deviation was 0.273 dB after compensating for the jump in the radiation intensity of the dataset. In general, the experiment verified that the radiation-data stability of the hyper-pixels reached a level of about 0.3 dB (1). Considering the nominal radiometric stability of 0.5 dB (3) for Sentinel-1, the time-domain stability of the radiation datum of the special hyper-pixel in the urban area was relatively good.
Regarding the characteristics of the radiation-data changes reflected in
Figure 6, we conducted radiometric-monitoring experiments based on other hyper-pixels.
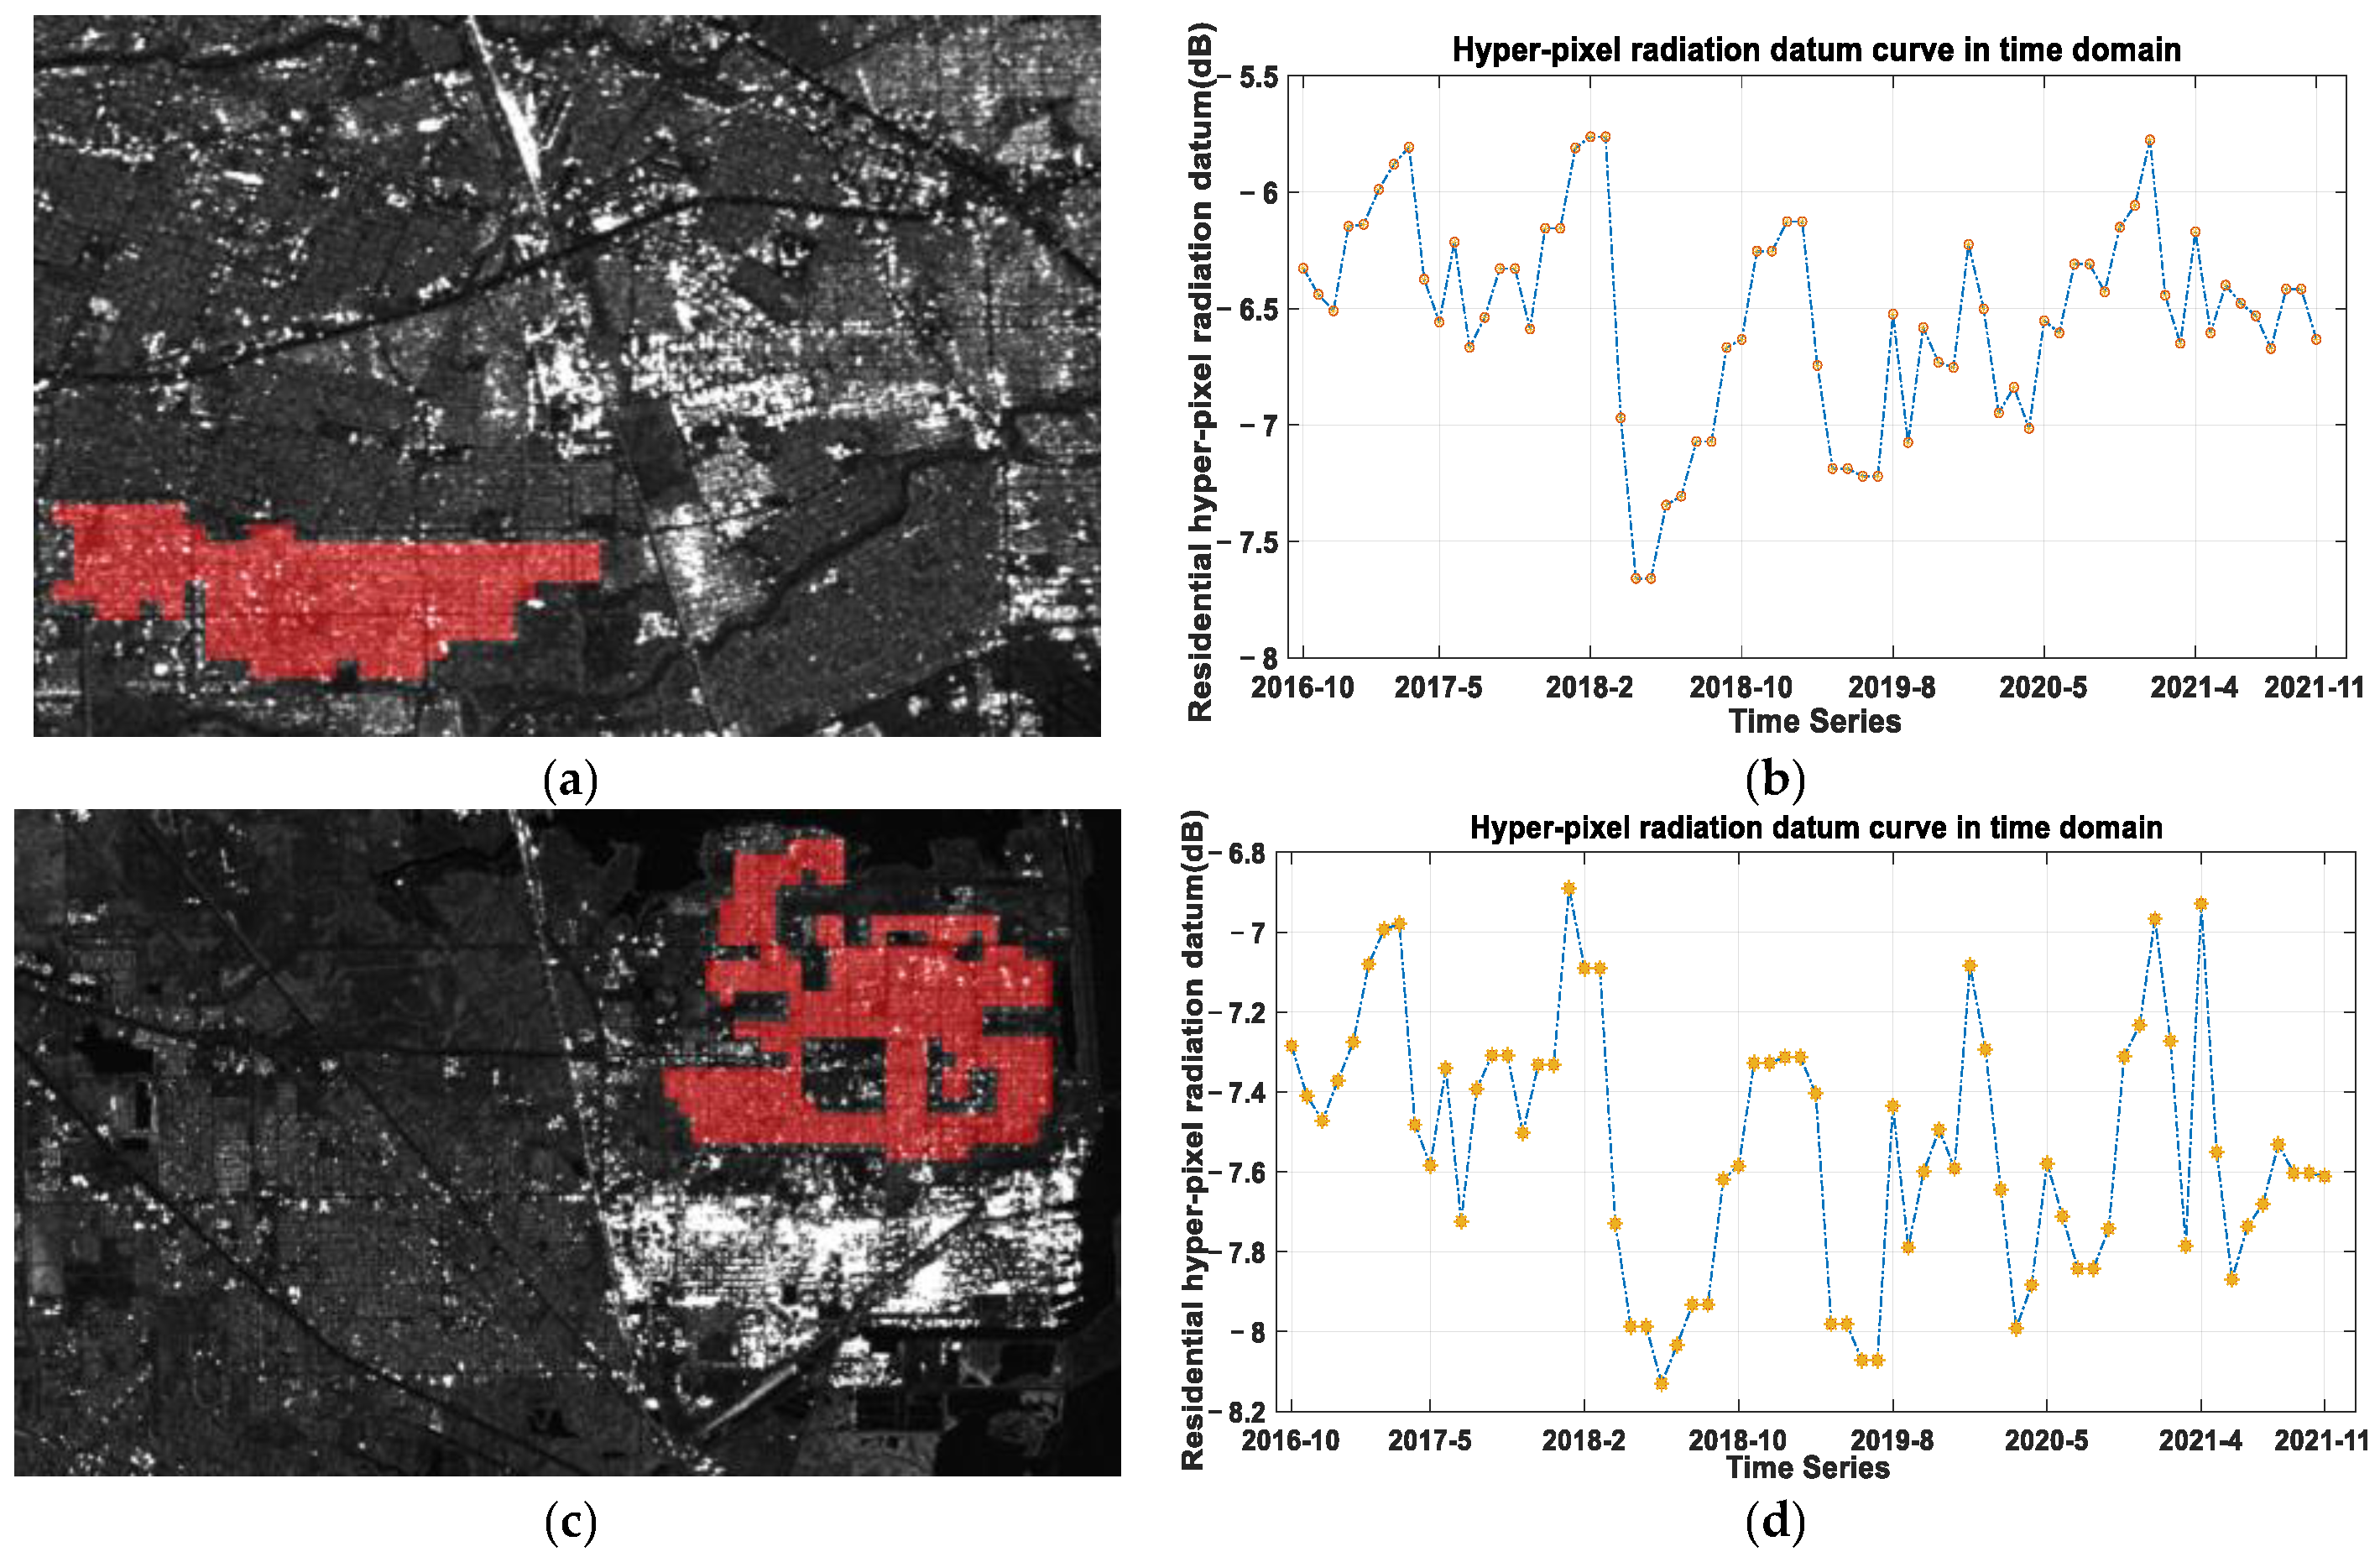
Figure 7 shows the time-domain radiometric-monitoring results of two single residential hyper-pixels from the Sentinel-1 Houston dataset, which respectively show the area of the manually selected hyper-pixels and the time-domain curves of the radiation datum. It can be seen that although there may have been differences in the absolute radiation-data values of different residential hyper-pixels, there was good consistency across the relative changes in the time domain. In addition to the consistent characteristics of the abrupt change in radiation levels in March 2018, it can be observed that the radiation intensity showed a small increasing trend from 2018 to 2021. This is an interesting phenomenon that may reflect the drift pattern of the radiation level of the SAR sensor of Sentinel 1B over time. In addition, the radiation stability of the two observations reached levels of about 0.4 dB (1
) and 0.3 dB (1
), respectively.
From the experimental results, it can be seen that the radiation intensities of different hyper-pixel targets may have differed, but the data’s stability and variation trends were consistent, which indicates that the radiation datum of the hyper-pixel set extracted in this paper truly reflected the radiation performance obtained by the joint physical action of the SAR system and the ground objects.
In actual processing, the larger the area covered by the hyper-pixel set, the more reliable the statistical radiation reference. From the results in
Figure 6 and
Figure 7, it can be observed that the radiation datum of the hyper-pixel set with a larger coverage area was slightly more stable. This was due to the use of median and average statistical-calculation approaches in Formula (4), which can prevent noise or random bias and approach the true values of extracted results when using large samples. The improvement effect decreases with the increase in sample size. Our experimental experience was that in general, effective results can be achieved when the coverage range of the hyper-pixel set reaches 300 × 300 pixels, similar to the range in
Figure 7a.
3.3. Analysis of the Effect of Seasonal Variation on Radiation Datum
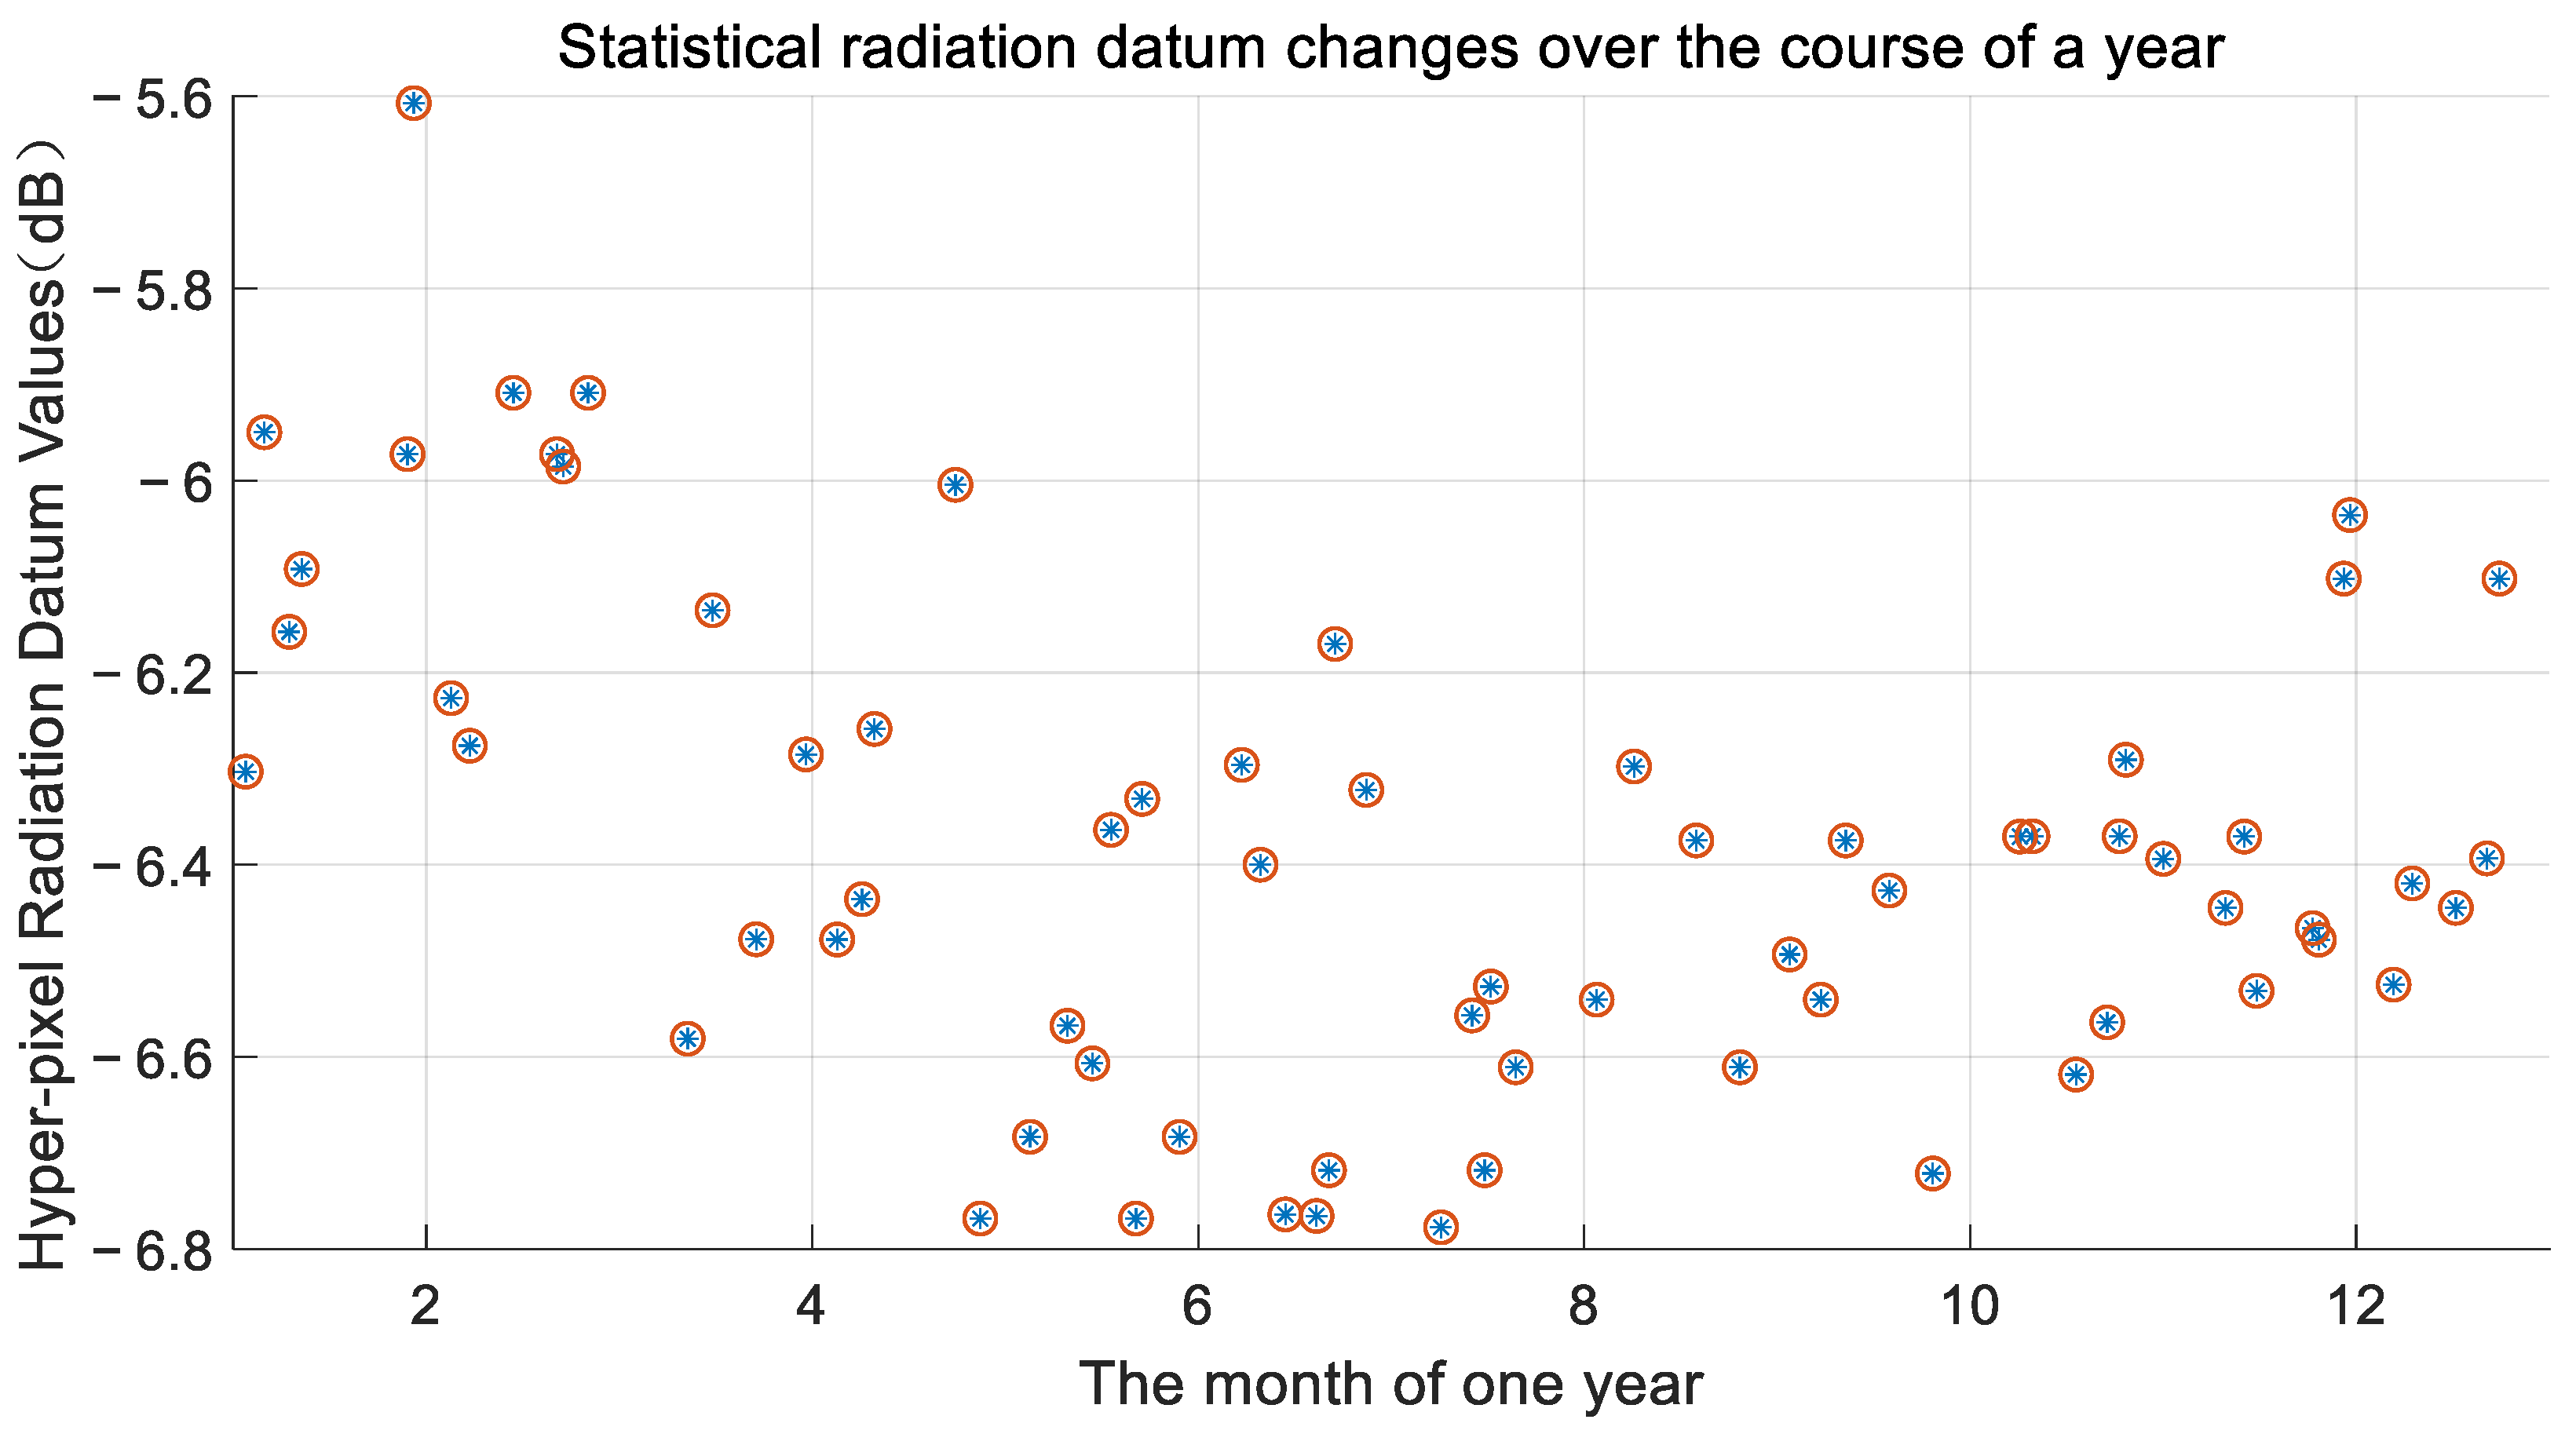
In this section, we study the influence of climate on the radiometric data of the residential hyper-pixels. An ideal radiation-stabilized reference target, such as an artificial calibrator, should be climate-independent. However, the general ground objects in scenes are subject to external influences, such as precipitation and humidity, while the hyper-pixel proposed in this paper is a comprehensive collection of objects containing vegetation and grassland. Naturally, it was difficult to achieve an ideal state, as in the calibrator, and it was necessary to conduct a study of the influence of climate on its radiation datum. By unifying the radiation datum at each time point in
Figure 6 over a year, we obtained the results shown in
Figure 8, below.
From
Figure 8, we can see that there was a certain pattern in the distribution of the radiation-data intensity over the year, which shows that the radiation intensity was strong from December to February, while it decreased slightly from May to October. The statistical results reflect the seasonal variation of the hyper-pixel radiation-data in the region. From the Weather Spark website, we obtained the climate pattern for Houston city: the rainiest month is June, with an average rainfall of 114 mm, and the month with the least amount of rainfall is February, with an average rainfall of 75 mm [
28]. Comparing the trends in
Figure 8, it can be seen that the intensity of the radiation datum of this hyper-pixel was strong when the precipitation was low and the temperature was low in February. Furthermore, the radiation intensity was low in the summertime, when the temperature was high and the air was humid.
Considering that Houston is located at a latitude near 30°N, it has a humid subtropical monsoonal climate with generally evergreen vegetation and a relatively uniform precipitation distribution throughout the year. Although its climate change is considered to be relatively mild, a visible influence of the seasonal climate on the radiation performance can be seen in
Figure 8. These seasonal hyper-pixel radiation-data characteristics are a kind of fingerprint of the external geographic environment. For different cities, this fingerprint needs to be obtained from statistics based on a large number of observations. The effectiveness of these residential hyper-pixel data for SAR-sensor radiometric monitoring can be further enhanced by compensating for the numerical variation of the radiation reference due to seasonal changes.
3.4. Comparison of Hyper-Pixel Radiation Stability with Tropical Rainforest
In this section, we compare the Sentinel data on the radiation stability of the South American tropical-rainforest region with the radiation stability of the Houston urban hyper-pixel in
Section 3.2, so as to verify the stability of the radiation reference extracted by the hyper-pixel proposed in this paper and its feasibility for radiometric monitoring.
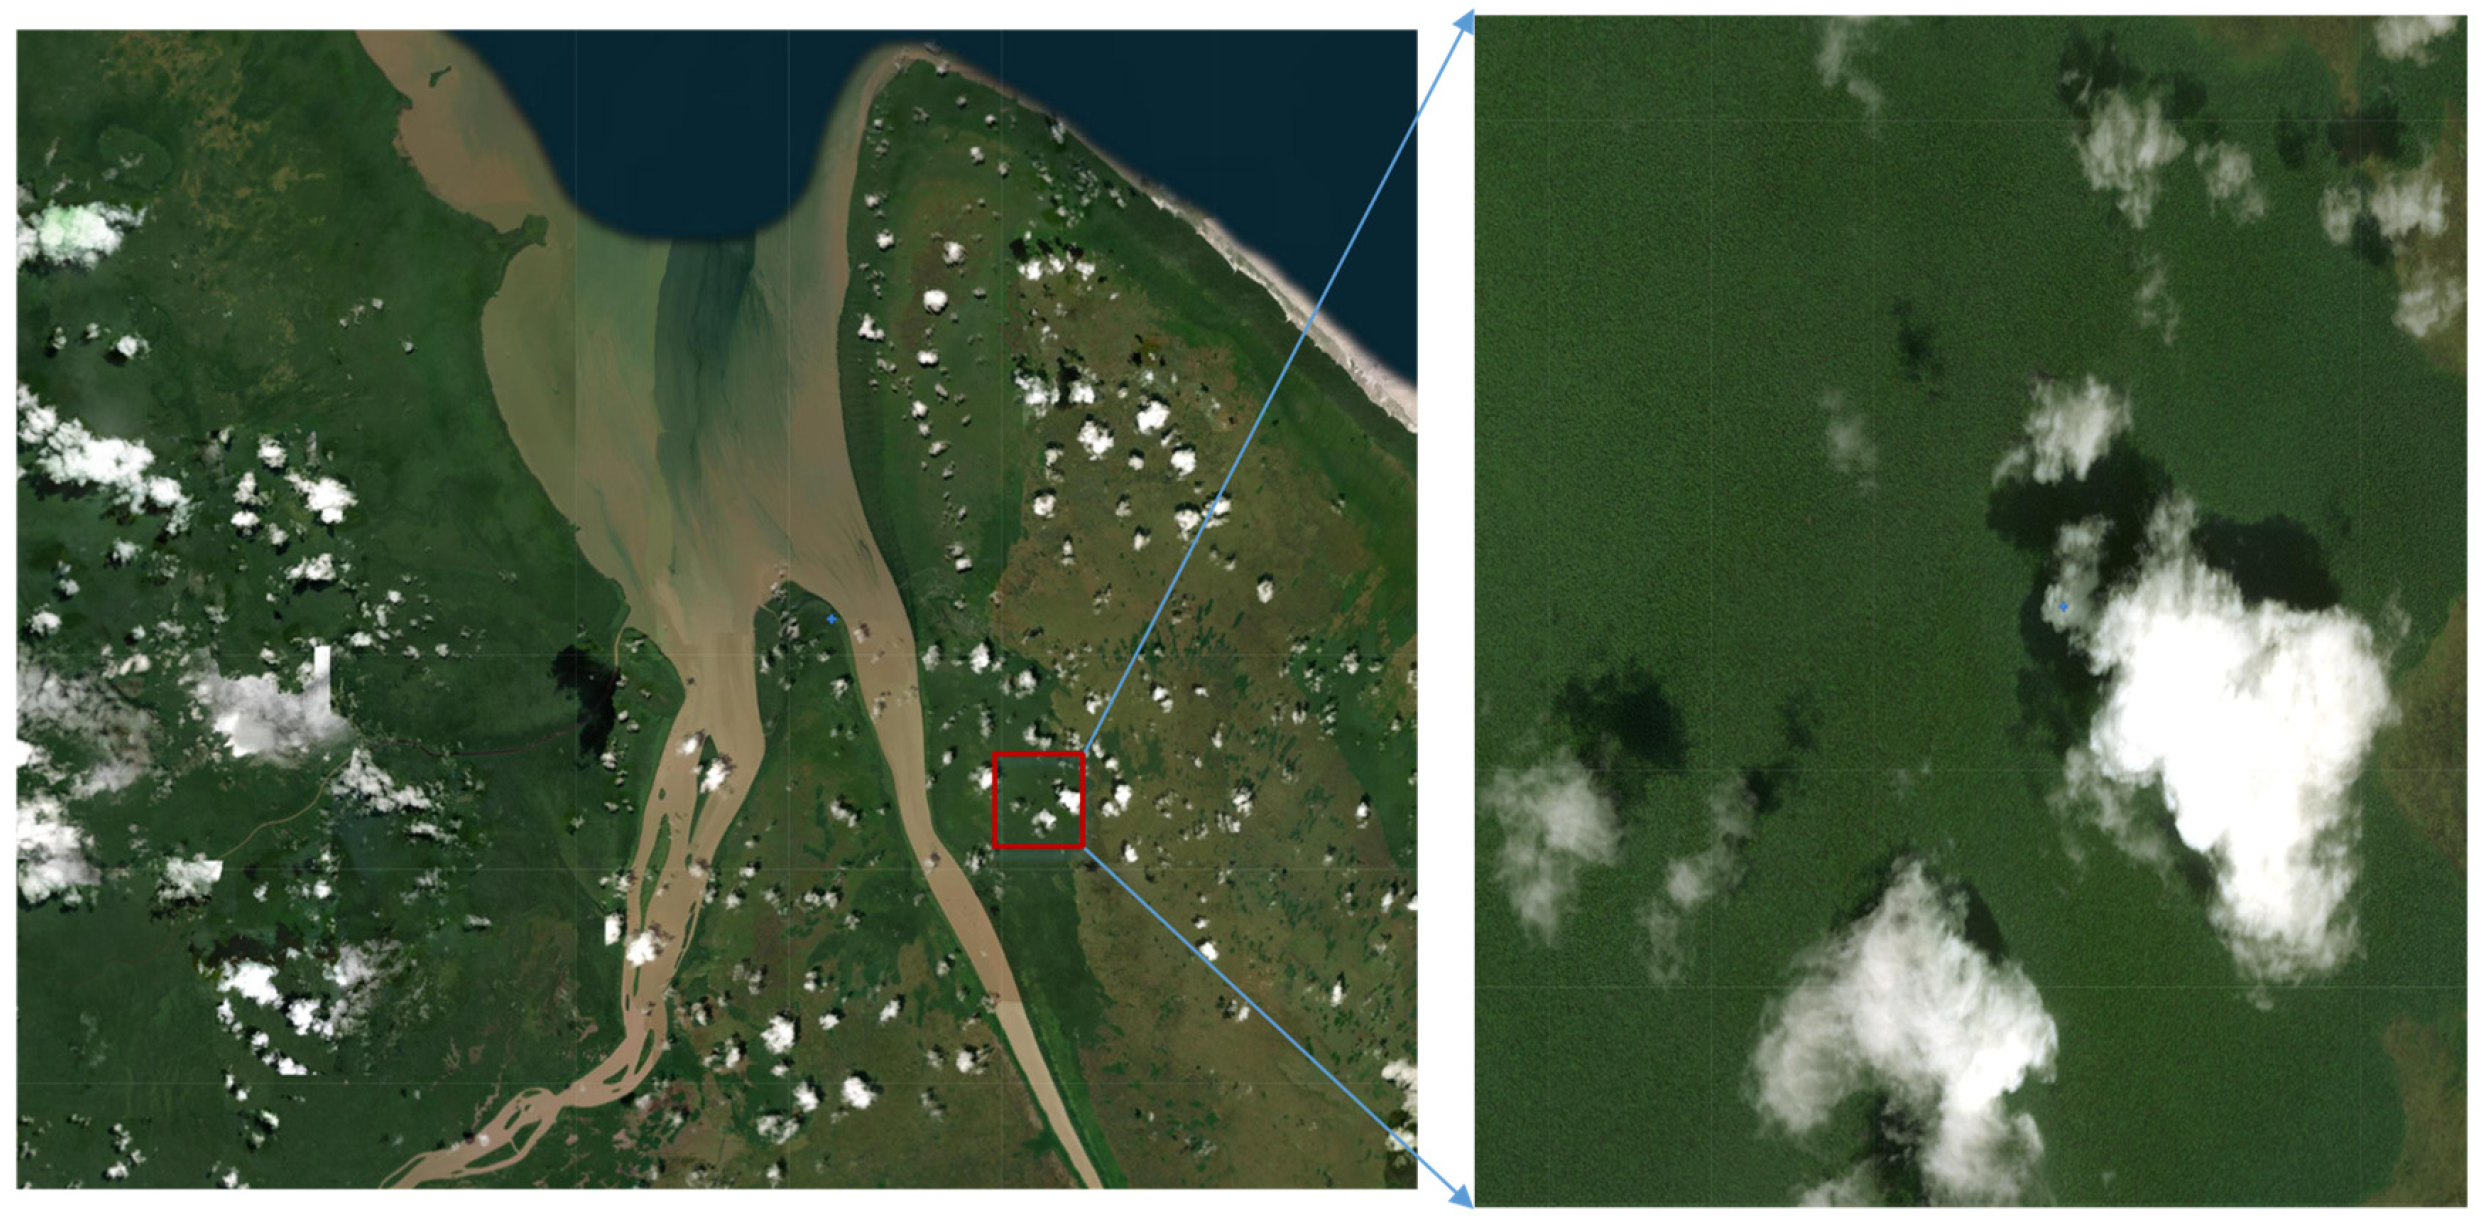
The tropical rainforest whose data were used in the experiment is located at the mouth of the Oyapok River in French Guiana, South America, and it is observed by repeated Sentinel-1A orbits. Since Sentinel-1A has conducted a large number of repeated orbits in which images of this region were obtained, a large amount of multi-temporal data was available, and we used this dataset to conduct a radiometric-stability analysis and a comparison of the tropical rainforest.
Figure 9 shows the uniform and consistent distribution of the rainforest target area, which was selected for extracting the mean value of the scattering intensity. It is an area covered by dense rainforest vegetation, ensuring the validity of its radiation.
The experimental dataset was the imaging data of S2 beam of Sentinel 1A in SM mode, covering a range from June 2018 to November 2022, with a total of 40 repeated observation datasets at an interval of about one month. The was used to study the scattering intensity of the rainforest targets, because it can remove the influence of the incident angle.
After calibrating the data based on SNAP software to obtain the
data, we calculated the mean radiation intensity of the local area of this rainforest.
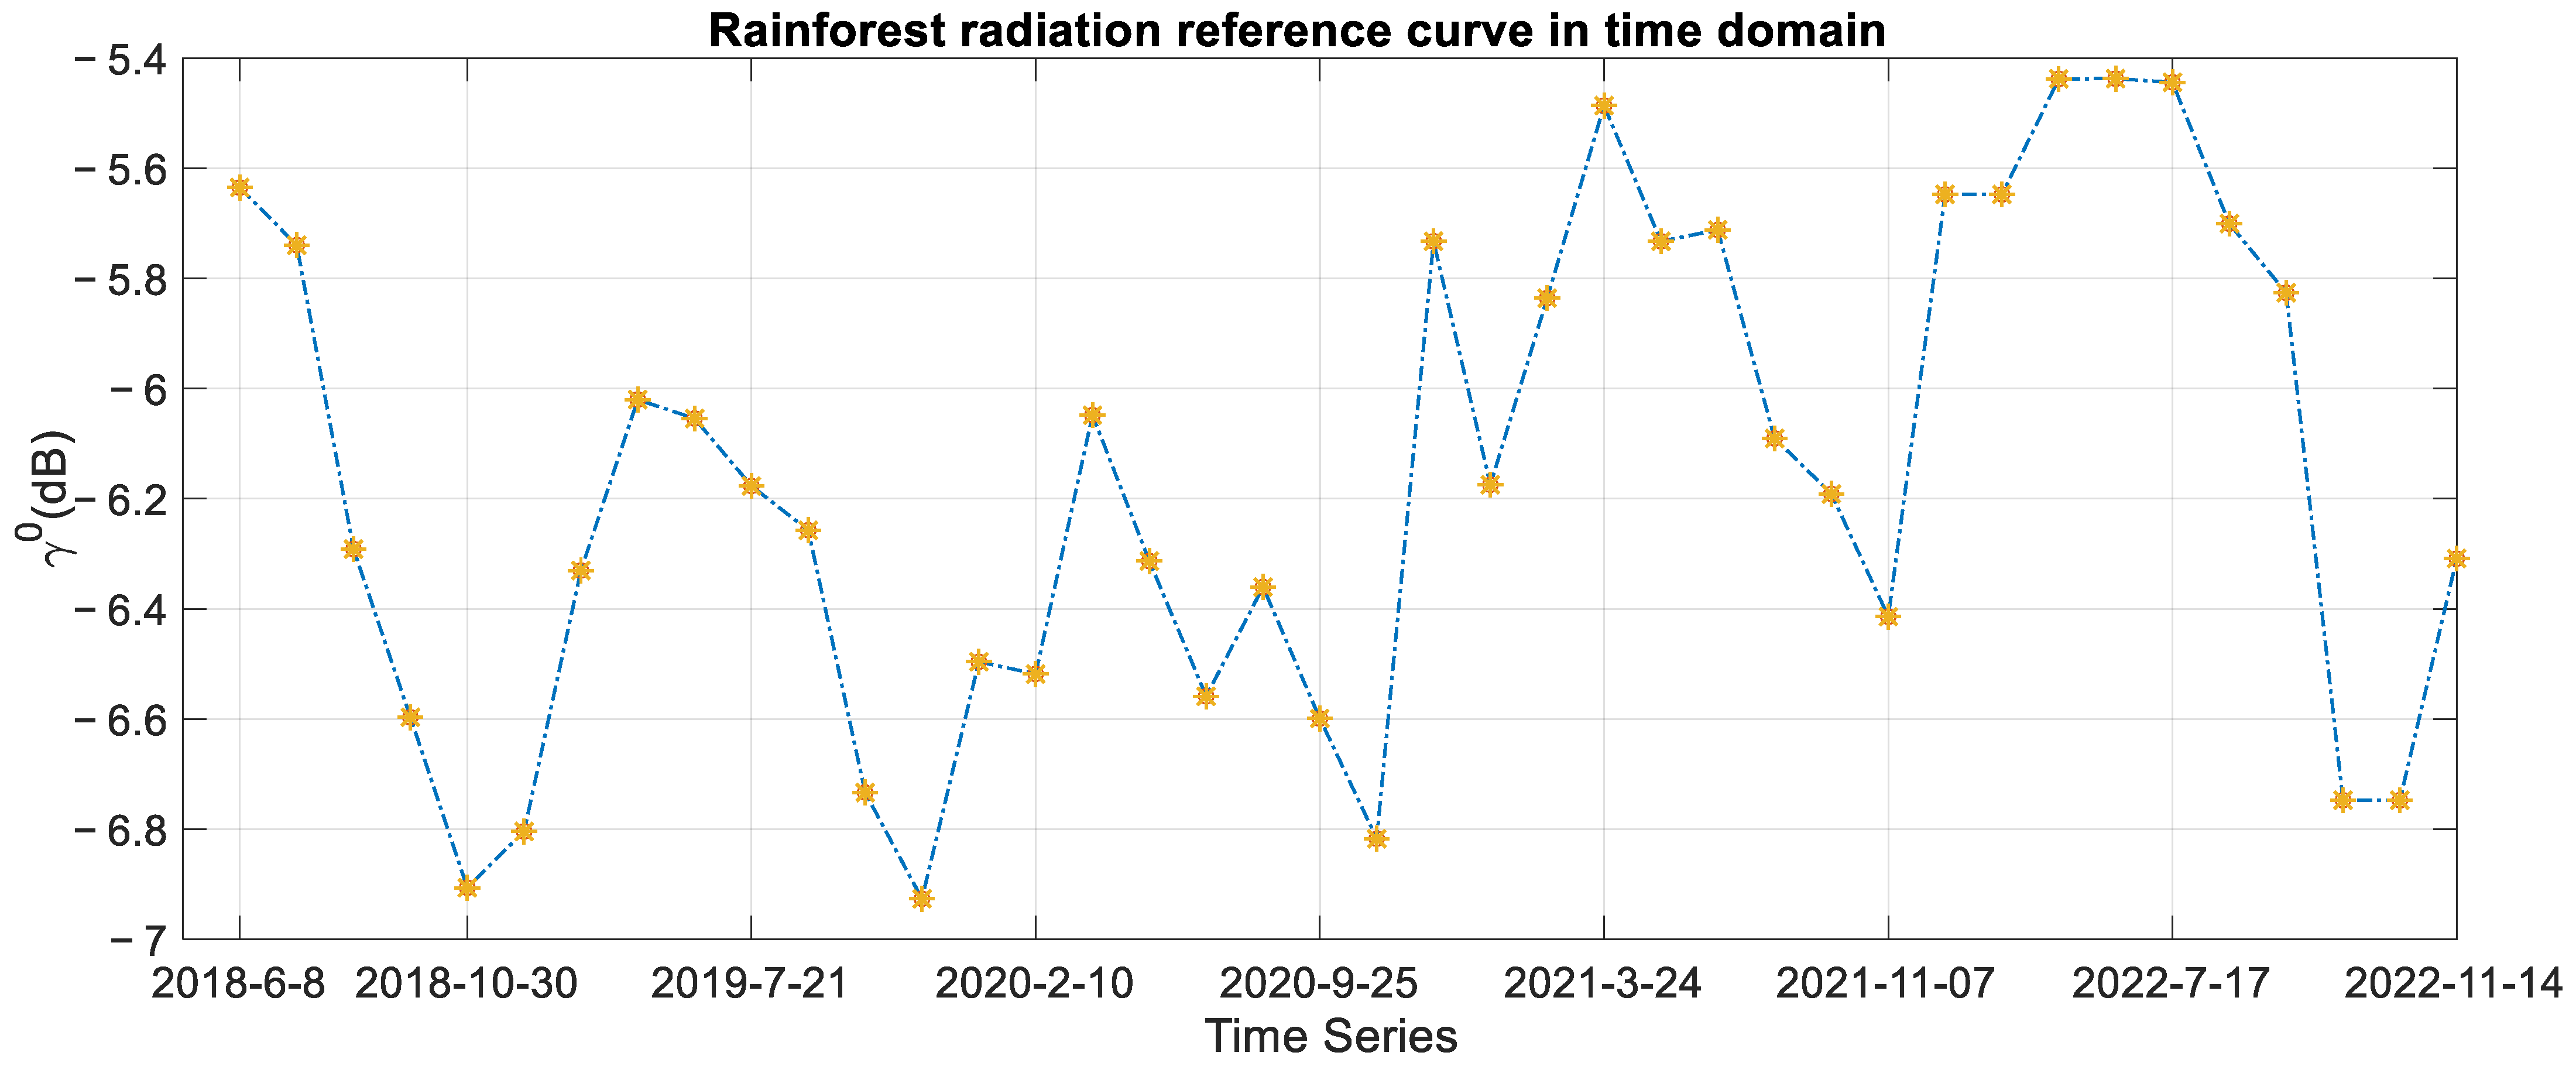
Figure 10 shows its radiation-stability performance over a period of more than 4 years.
The size of the rainforest region extracted in the experiment was limited by the scenario to about 500 × 300 pixels, and the radiation stability of this rainforest dataset was 0.45 dB (1
). Furthermore, as the authors of [
29] pointed out, the monitoring results of the rainforest scattering coefficient of Sentinel-1 in WV1 mode were around 0.37 dB (1
).
Assuming that the radiation-stability properties of Sentinel-1A and 1B are similar, the experiments using the tropical rainforests revealed that the time domain of the radiation datum extracted by the residential hyper-pixels proposed in this paper is more stable than the monitoring results of the tropical rainforest under the same conditions. This experiment verified that at least the urban residential hyper-pixels in the Houston area can be used for radiation monitoring, and their results were not worse than those of the tropical rainforest. In addition, the same trend of slowly increasing radiation levels was observed using the Sentinel-1A l data for 2019, 2020, and 2021.
4. Experimental Analysis and Discussion
4.1. Geometric-Orientation-Component-Extraction Method for Hyper-Pixel of GF-3 Repeated-Observation Data
Regular low-rise residential buildings played an important role in the overall radiometric performance of the residential hyper-pixel target presented in this paper, while the widespread double-bounce scattering was an important component of the residential-building scattering. Since double-bounce scattering is sensitive to the radar incident direction, the hyper-pixel’s relative geometric orientation to the SAR sensor is an important factor affecting the scattering intensity.
Figure 2 shows the visible radiation-intensity variation of the arc-arranged residential cluster. However, for the regular residential area, when there was consistency in the building orientations on the same housing estate, the geometric orientation in the multi-temporal dataset was certain; therefore, this geometric-orientation-independent variable of the hyper-pixel was not considered in the experiments described in
Section 3.
However, the effects of different geometric orientations of the regular building clusters presented in different orbits and at different beams on the radiation intensity of the hyper-pixel cannot be ignored. In this section, we study the effect of the geometric-orientation variable of the hyper-pixel on the radiation-data values, which will help to improve the applicable range of radiometric monitoring of residential hyper-pixels.
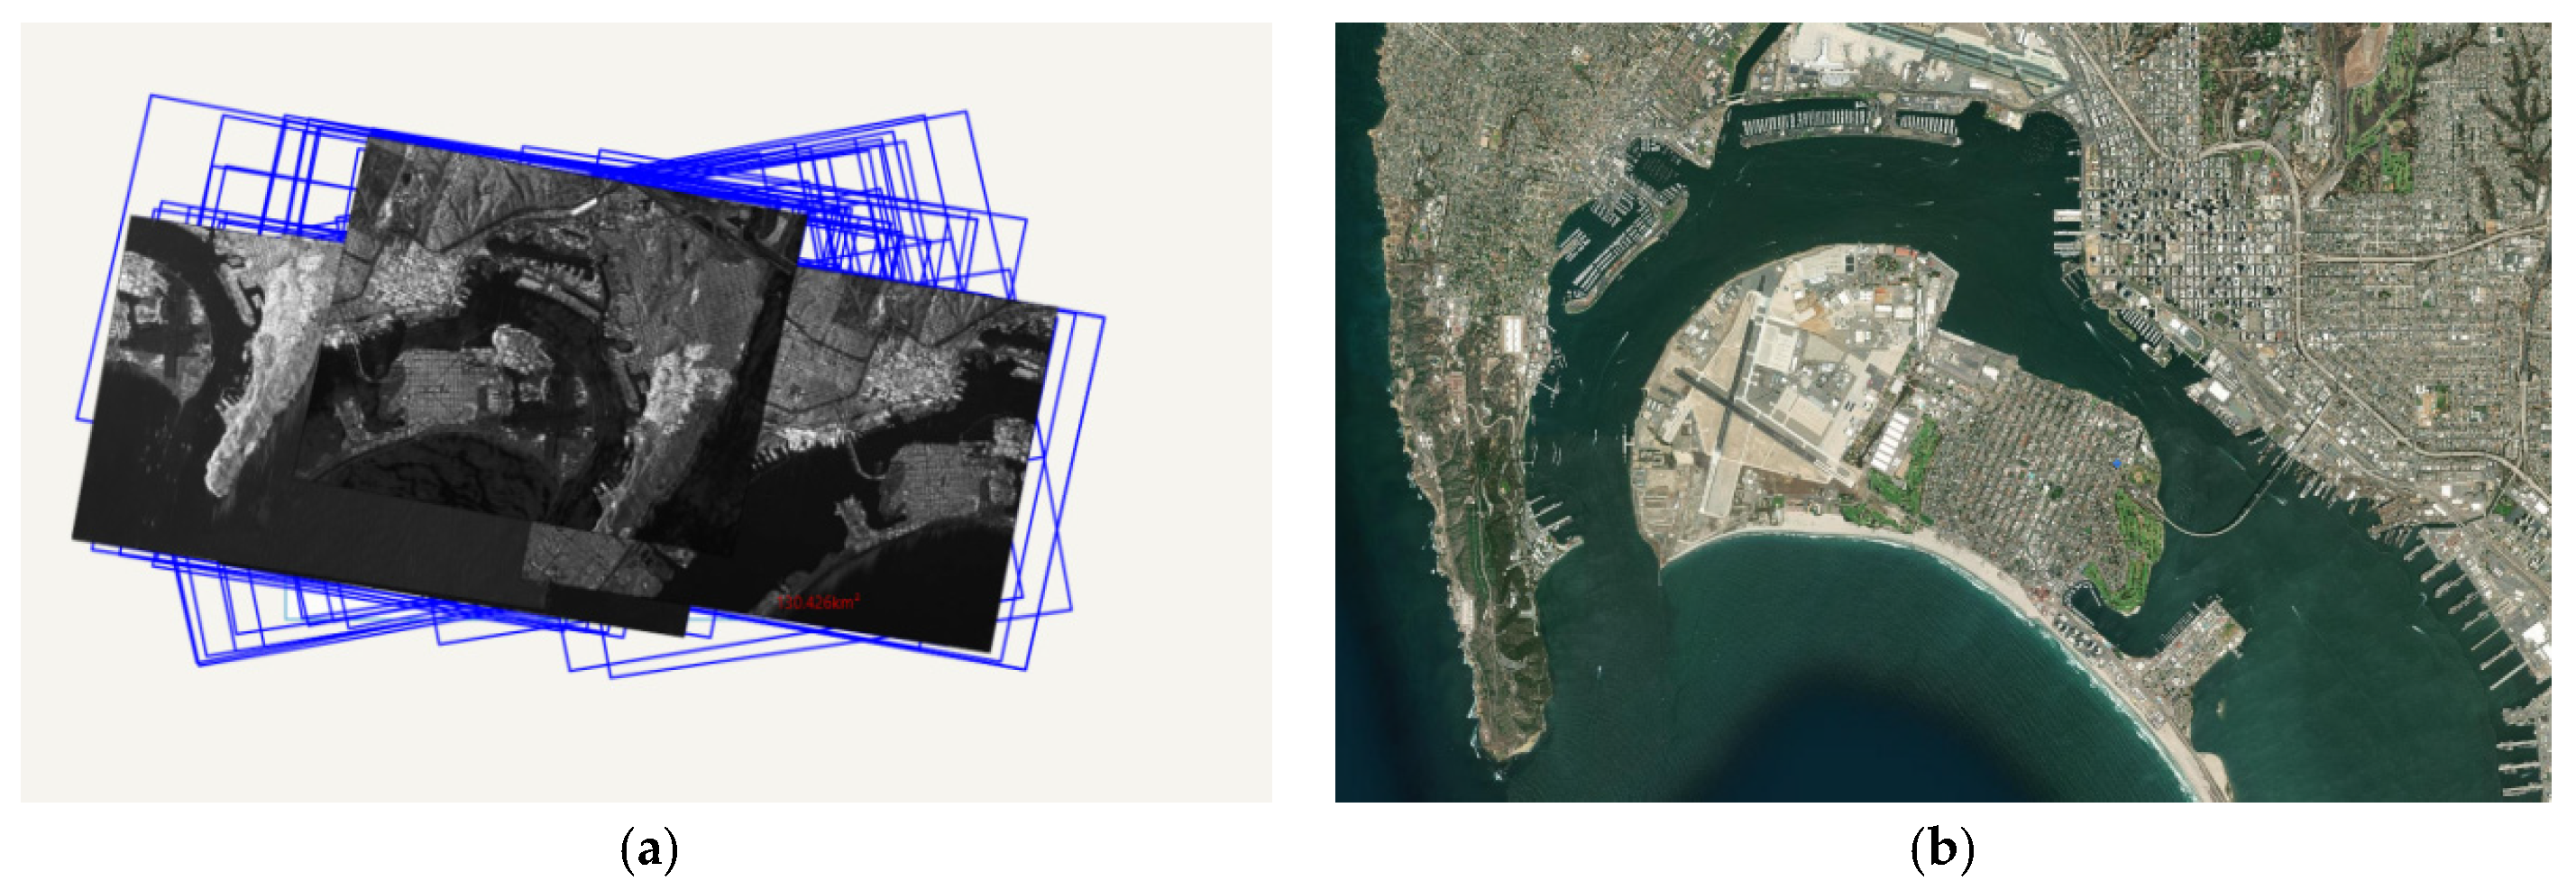
In this section, we use the GF-3 observations of different beams and different orbits in the same region to study the problem of the radiation changes caused by the different geometric orientations of the residential hyper-pixel. Here, we consider that the radiometric quality of the GF-3-calibrated data products is reliable (relative radiation accuracy: 1 dB (3
) [
30]), and that the radiation error of the data itself has a secondary effect on the research results. The data used are a time-series dataset of the GF-3 spotlight mode, with a resolution of 1 m, imaged in San Diego, USA. The imaging-data information are shown in
Figure 11. We choose the residential area on the small island in the scene as a fixed hyper-pixel object for the study.
The building orientation in the L1A-image data is the result of the combined effect of the actual building orientation and the SAR sensor’s incident angle, among other factors, reflecting the relative geometric relationship between the ground target and the sensor. In this paper, we directly use the buildings’ orientation in the L1A image as the research object to study the effect of the relative geometric orientation on the radiation intensity of the hyper-pixel. In addition, since the internal distribution of the residential hyper-pixels is consistent, we only need to determine the uniform orientation of the building cluster, and since the basic residential unit in households is generally rectangular in distribution, as demonstrated in
Section 2.2, the actual distribution of the residential building is vertically distributed in the length and width direction, and only the angle of one side direction needs to be determined. Here, we use the direction of the roads in the area to characterize the residential orientation for extraction.
Thus, we simplify the relative geometric-orientation problem of hyper-pixels to the direction-extraction problem of straight roads inside the residential area. The process flow is as follows:
- (1)
Read the data and perform quantization, and radiometric calibration to transform the data into backward-scattering-coefficient data.
- (2)
Select the region of the hyper-pixel target, perform normalized resampling according to the azimuthal-pixel interval and range-pixel interval, and invert the image gray-scale values, so that roads with low radiometric intensity become highlighted-line targets.
- (3)
Using the standard Hough transform for straight-line detection in the image, calculate the orientation angle of the straight line corresponding to the road in the L1 image with respect to the azimuth; in other words, obtain the relative geometric orientation of this residential hyper-pixel.
- (4)
Calculate the radiometric data of this residential-complex hyper-pixel.
- (5)
Repeating (1) to (4), above, for each hyper-pixel of the dataset, obtain the results of the radiation-data variation with different geometric orientations.
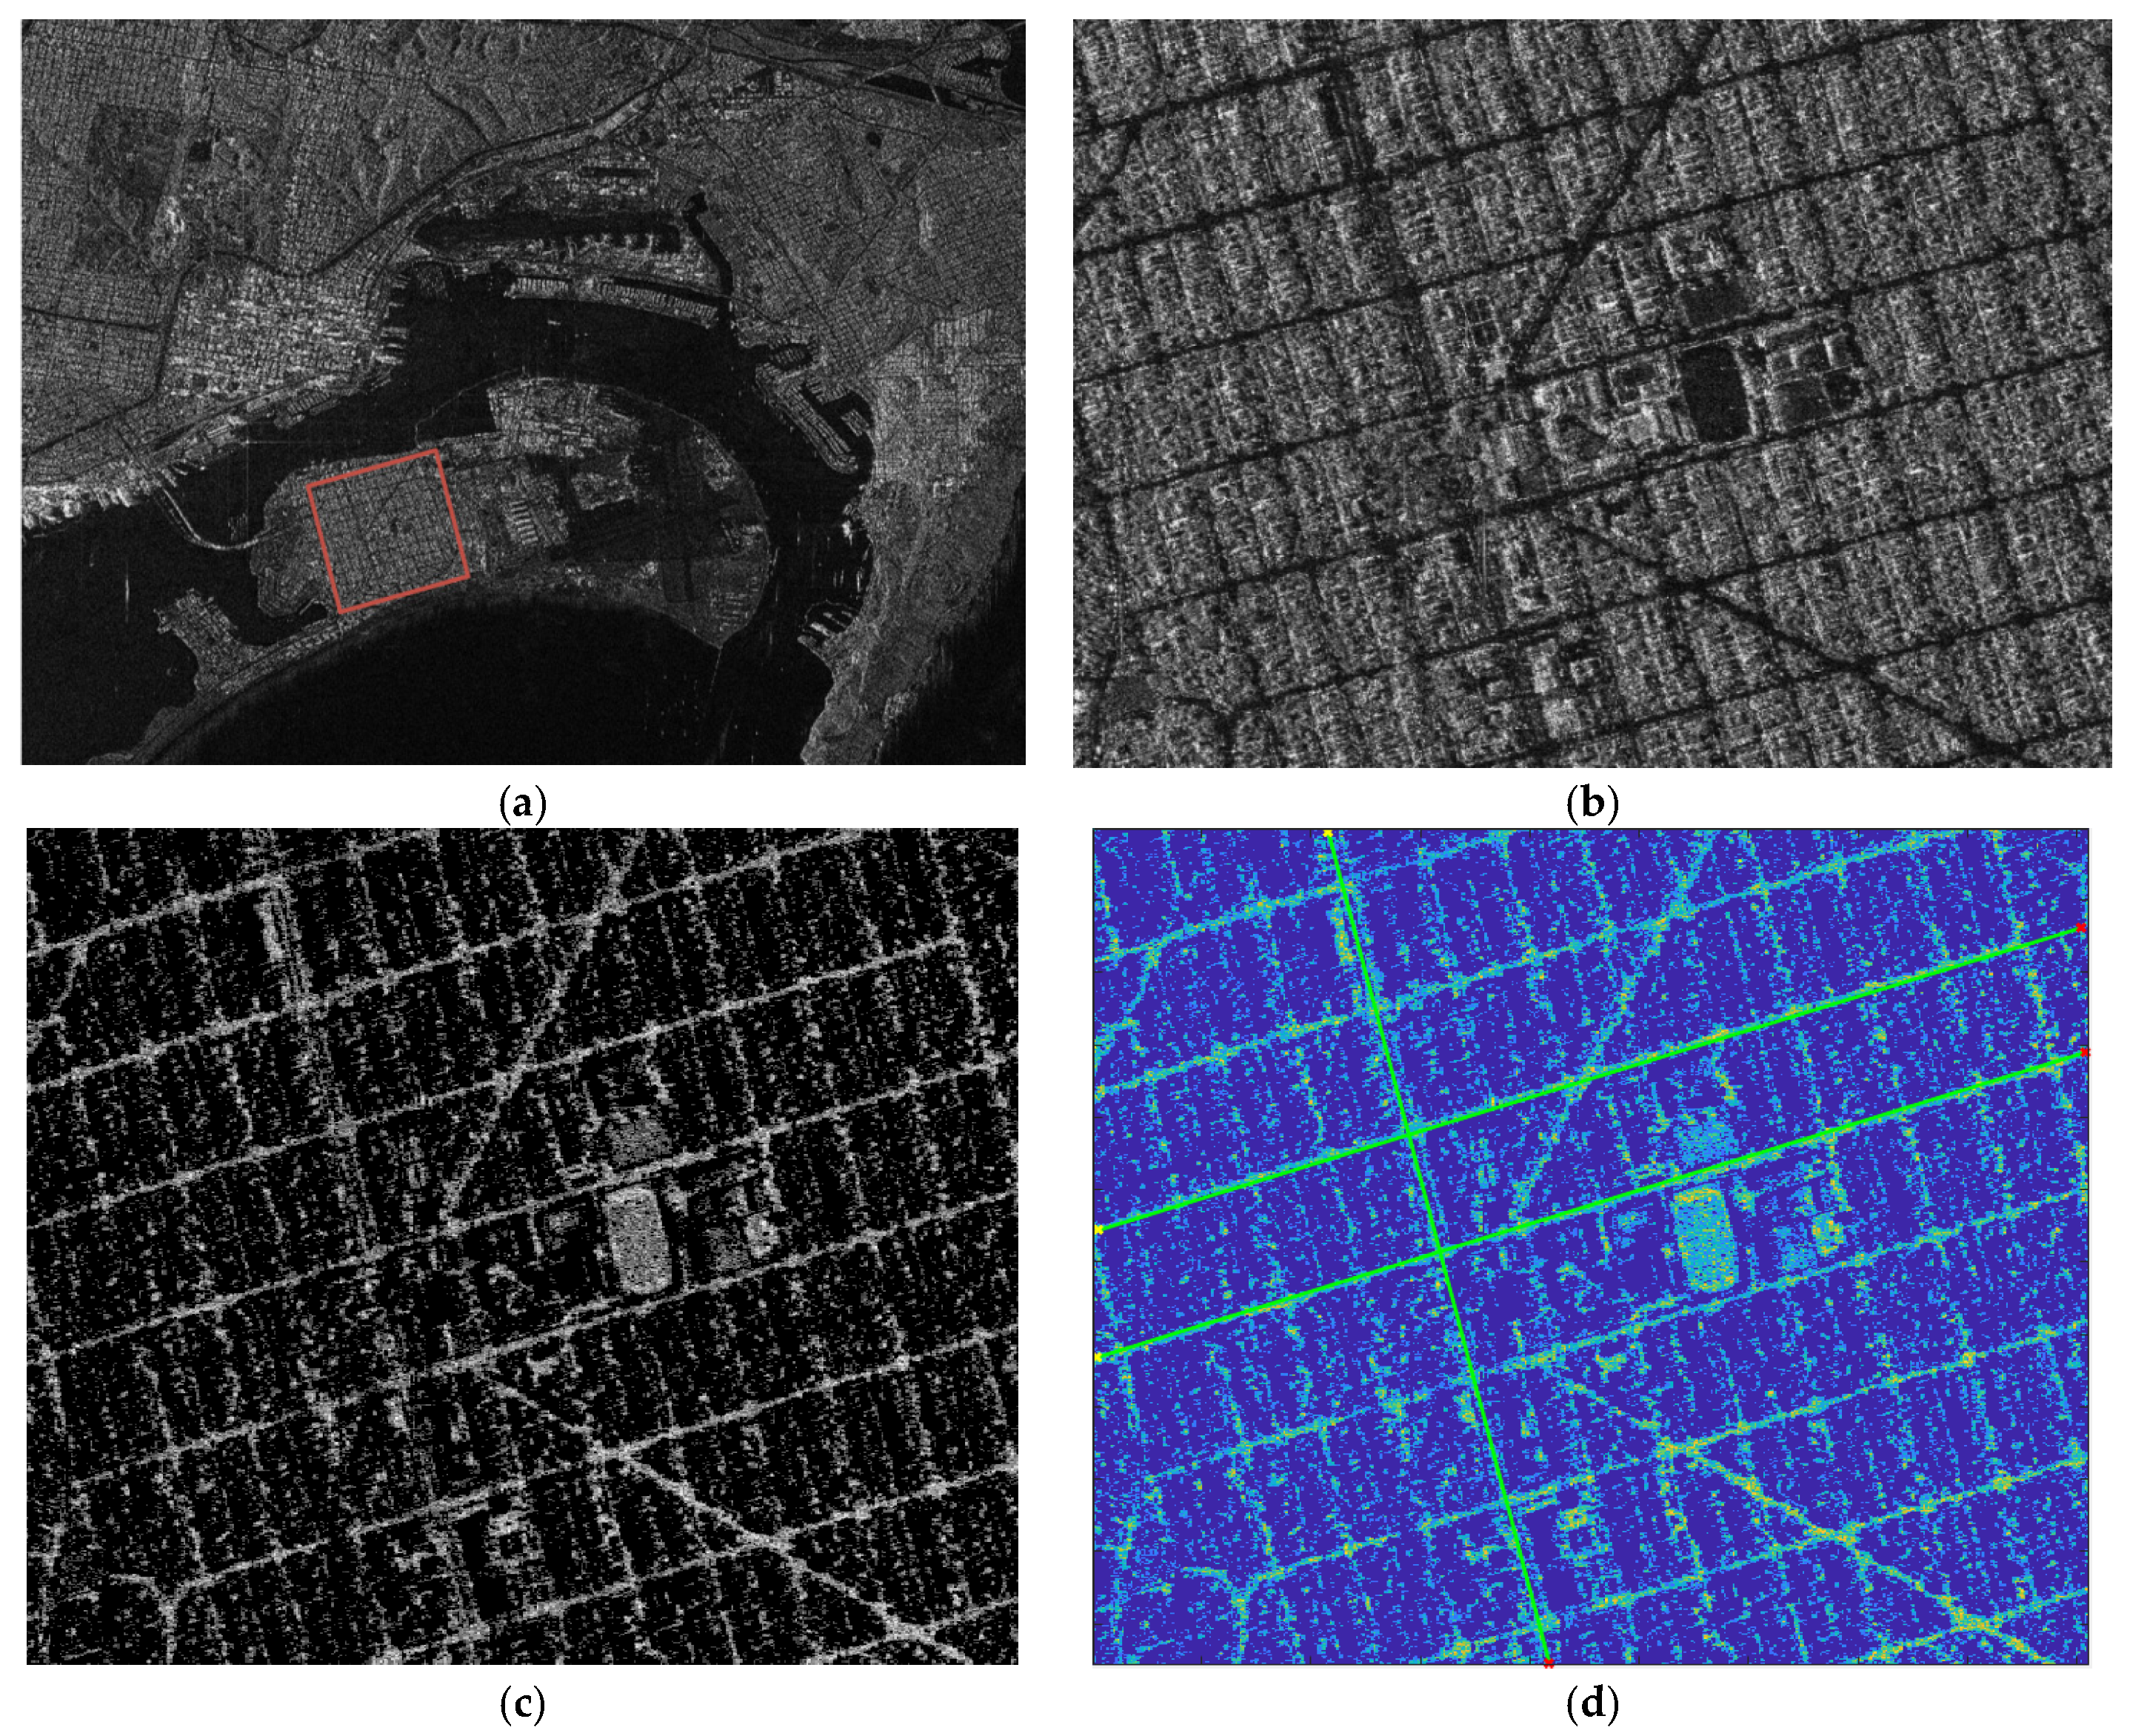
For one scene in the dataset, GF3_KRN_SL_010358_W117.2_N32.7_20180729_L1A_HH_L10003357821, the experimental data and the processing results are shown in
Figure 12. The figure shows the extraction of the geometric orientation of the hyper-pixel in the GF-3 San Diego area. The two straight lines presented in
Figure 12d represent two roads in the residential area. We took the direction of the road as the direction of the residential buildings. We extracted the angle between the road direction and the azimuth direction to obtain the relative geometric orientation of this scene, of about 10 degrees.
4.2. Experimental Results and Discussion
We extracted the hyper-pixels of the buildings’ geometric orientations and calculated the radiation datum for a total of 34 time-series-observation datasets with different tracks and different beams from 2018 to 2022. Taking the relative geometric orientation as the
X-axis and the radiation-data values of the hyper-pixels for each scene as the
Y-axis, the results were obtained and are shown in
Figure 13.
On the one hand, it can be seen in
Figure 11a that although the dataset did not require repeated orbital observations, its orbital direction was generally consistent, and the dataset was also all in descending mode, so the main factor influencing the relative geometric orientation was the incident angle. The relative geometric orientation varied within a small interval, as shown in
Figure 13.
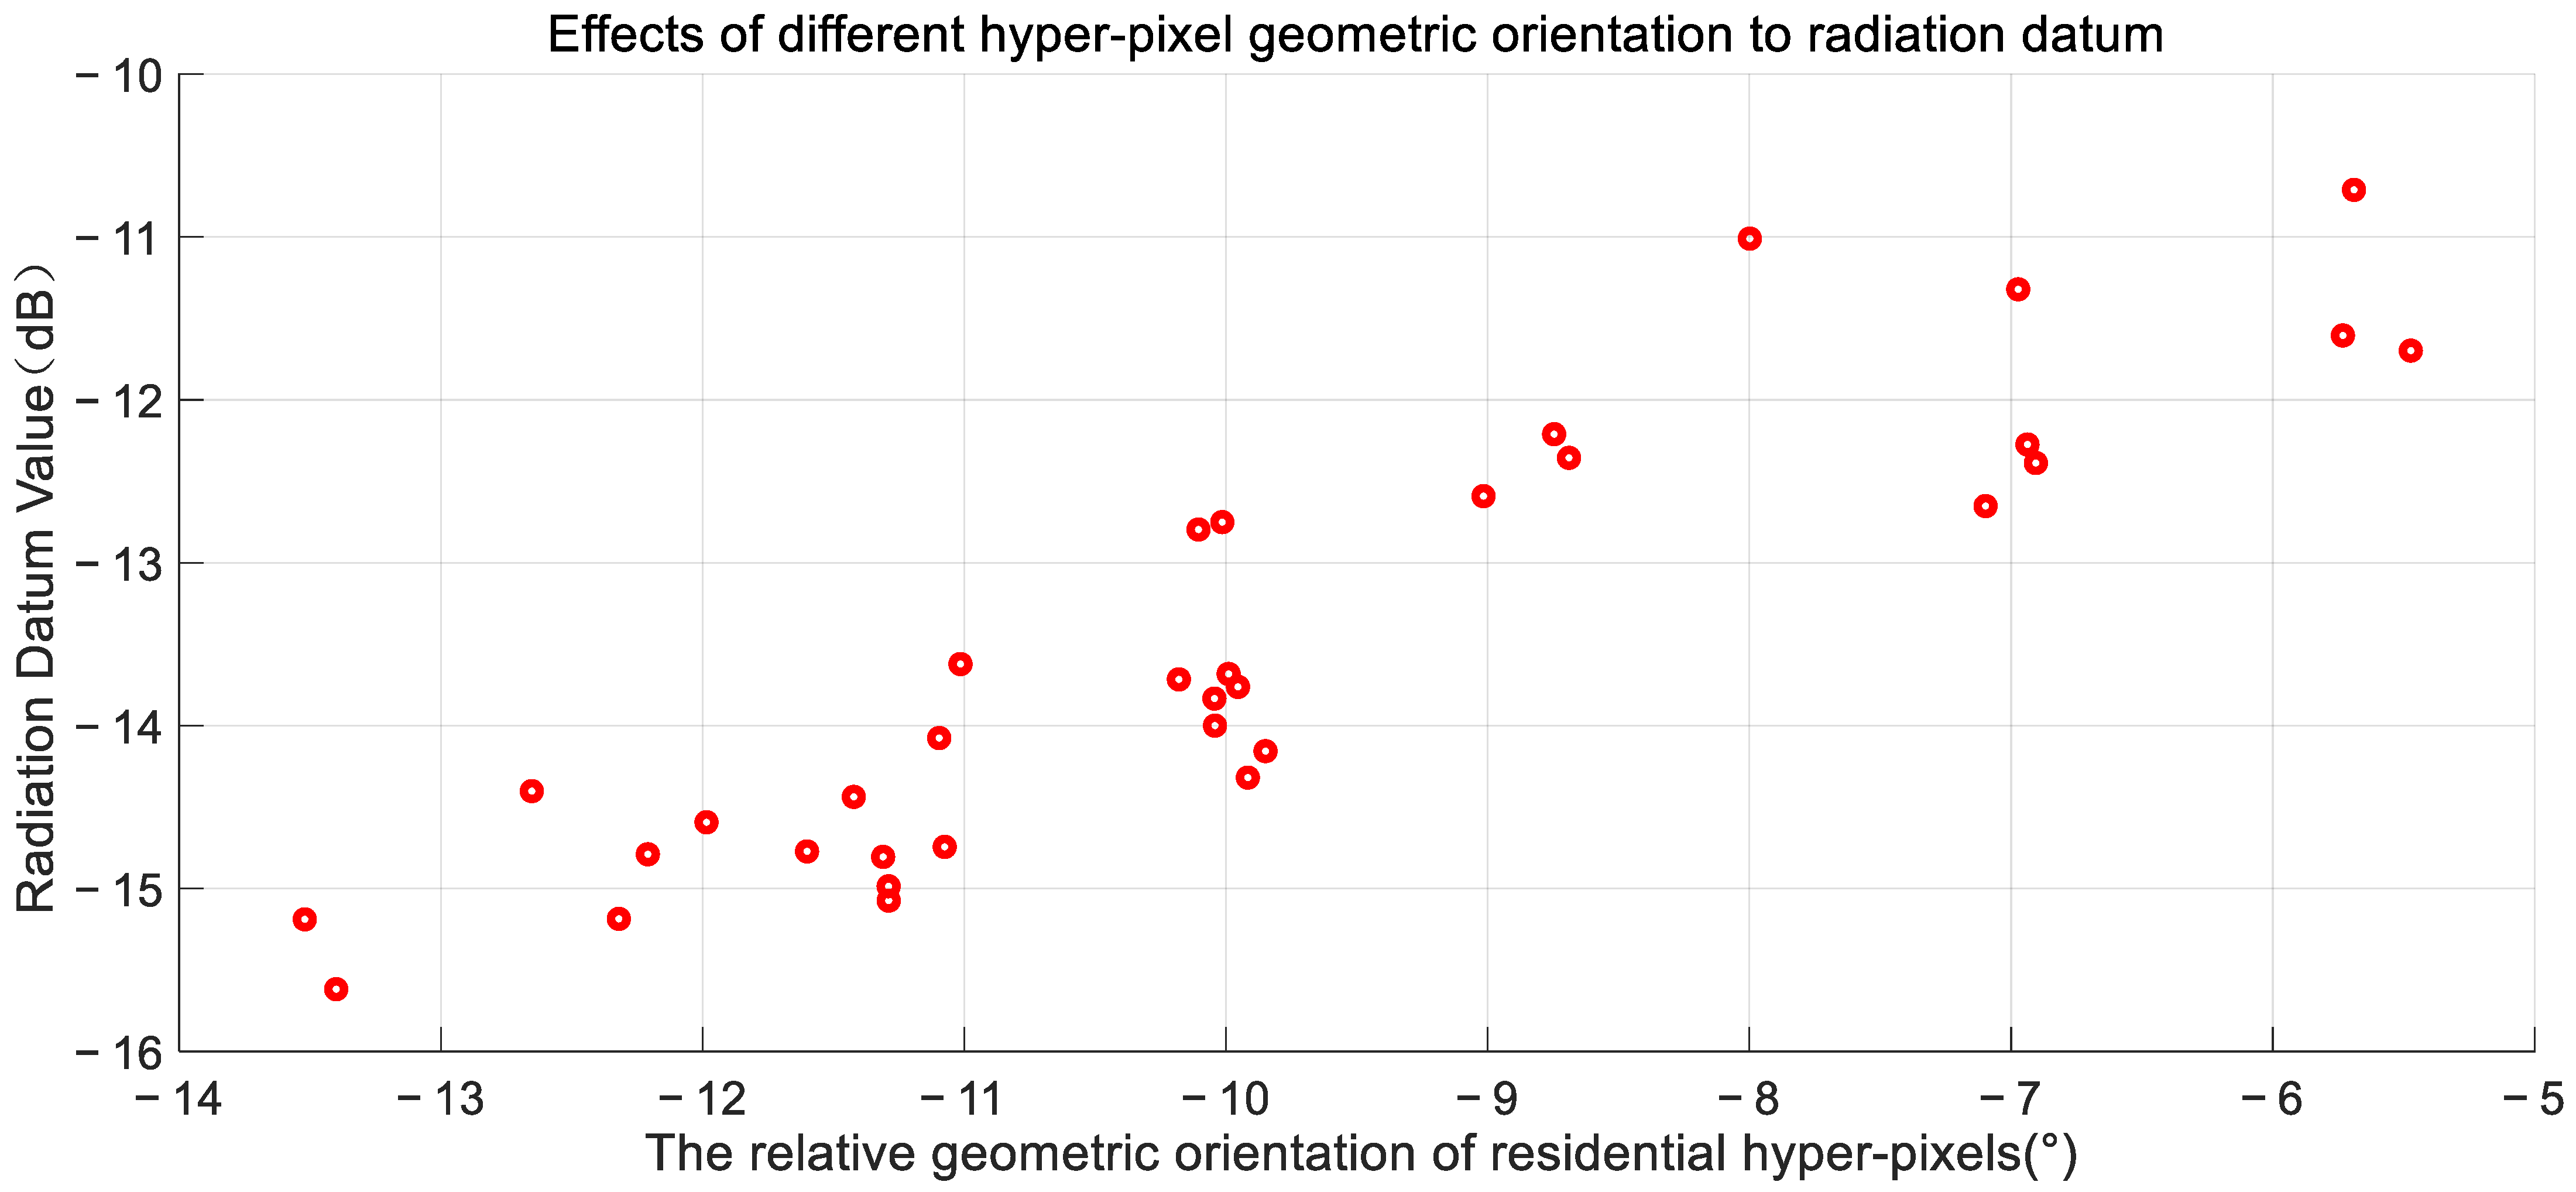
Figure 13 shows that as the absolute value of the relative geometric orientation angle became larger in the azimuthal direction, the extracted radiation-data value decreased, and the experimental results showed an approximately linear pattern. For the same hyper-pixel target, the angle of the relative geometric orientation was jointly affected by the residential units’ orientation, satellite-orbit direction, and incident angle. The relative geometric-orientation variable proposed was obviously correlated with the radiation-data values of the hyper-pixels, as shown in
Figure 13. At an angle of −13.5°, the radiation datum was about −15.5 dB, and at around −5.5°, the radiation intensity was around −11 dB. Almost all the measured samples were clustered near this line segment, which was constructed with the two endpoints. For the radiometric monitoring, the empirical rule obtained was beneficial for the correction of the radiation intensity monitored.
The experimental results obtained using each hyper-pixel geometric orientation also showed strong aggregation. Considering that the errors in the experimental results included the radiometric accuracy of the GF-3 SAR data themselves and the radiometric errors of different beams, as well as the inclusion of the radiometric fluctuations over 4 years of observations, the good aggregation of the sample points of this radiometric reference indicates the reliability of the proposed hyper-pixel radiometric reference and formed the basis of this experiment, whose aim was to study the influence of geometric orientation.
In general, for the application of hyper-pixels in radiometric monitoring, if the multi-temporal data are in the same orbit and beam, then the radiation datum of the hyper-pixel can be used directly as the radiation reference. Otherwise, for more general cases, in practical applications, such as different orbits and different incident angles, the value of the radiation datum of the hyper-pixel may have a large variation, as shown in
Figure 13, and there may be a maximum variation of more than 5 dB, so it is necessary to set strict conditions. Otherwise, if, for one hyper-pixel, a large number of observations accumulate, it is possible to form the statistical law of relative geometric orientation relative to the radiation datum, as shown in
Figure 13. The relative geometric orientation of the hyper-pixel buildings extracted from this imaging scene can be used to correct the corresponding radiation-data values, which can effectively improve the effectiveness or application range of the radiometric monitoring of hyper-pixels.
5. Conclusions
Synthetic-aperture-radar-based radiation calibration and monitoring using scene targets without relying on artificial calibrators have attracted the attention of scholars over a long period because of their obvious advantages in terms of calibration cost and ease of implementation. Scholars have extensively studied the characteristics of natural features with wide coverage and uniformity, such as rainforests, deserts, ocean-wind fields, and ice fields, for the radiation calibration of SAR systems, among which tropical rainforests and ocean-wind fields have become classical reference objects for SAR calibration. With the development of human society, novel and universally distributed feature targets, which can be used as stable SAR radiometric-calibration references, such as the residential areas in urban areas utilized in this paper, constitute interesting directions of research.
In this paper, we first proposed a hyper-pixel concept to treat a specific independent residential neighborhood in an urban area as a kind of stable and independent hyper-pixel object, which was used to extract a stable radiometric data to achieve the goal of normalized low-cost radiometric monitoring of SAR data. We analyzed the intrinsic characteristics of the hyper-pixel target, proposed a method to calculate the radiation datum of the hyper-pixel, and verified its radiometric stability with the Sentinel-1 Houston multi-temporal dataset. A comparison experiment with a distributed tropical-rainforest target verified that the time-domain stability of the hyper-pixel radiation datum was sufficiently high to monitor the time-domain variation in the SAR-radiation quality. In addition, we studied the influence of the seasonal climate, and the seasonal fluctuations in specific urban areas were removed by big-data statistics, which improved the stability of the radiation datum extracted by the hyper-pixels. In the radiometric-monitoring experiments on the Sentinel-B repeated-orbit multi-temporal data, we found a possible change in the SAR-sensor-radiation intensity and a radiation-intensity shift in recent years. Finally, in this paper, we investigated the relationship between the hyper-pixel radiation datum and the relative geometric orientation of a residential building based on the GF-3 repeated-observation dataset, which provided an idea for a technical approach to the radiometric monitoring of the general dataset.
The hyper-pixel-based radiometric-monitoring method proposed in this paper has the following advantages. (1) Hyper-pixels are widely distributed in urban areas, villages, and towns, and may overlap with the observation task target, ensuring that data acquisition is convenient, the amount of historical data is large, and, in general, that it is not necessary to use additional imaging resources. (2) The radiation datum of this hyper-pixel is stable enough to reach 0.3 dB (1), and the calculation method used to obtain the radiation datum is simple and convenient. (3) Compared with the permanent-scatters method, and others, the hyper-pixel method requires low registration accuracy and even low imaging quality, so it has a lower application threshold. However, the method also has obvious limitations. (1) The radiation intensities of different residential hyper-pixels may vary, so it is necessary to ensure that the hyper-pixel objects used for radiation-data extraction are specific or in fixed combinations. (2) The radiometric performances of the hyper-pixels may be affected by seasonal variations, so residential hyper-pixels are influenced by the geographical environments in which they are located. (3) The radiometric performances of these hyper-pixels are sensitive to changes in the geometric orientation parameters, requiring data from repeated orbital observations of the same beams.
Overall, it is evident from the research in this paper that the analysis and statistical modeling of the effects of hyper-pixel radiation datum on the seasonal variation, the incident angle, and the development of regularity, among other features, are valuable. The removal of the coupling of these stable external factors on the radiation intensity can not only lower the threshold for the application of the method in radiometric monitoring but also lead to new application scenarios, such as the cross-calibration of multiple star constellations.
The advantages, disadvantages, and applicability of the radiometric-monitoring technique proposed in this article were fully discussed above. Further research can be undertaken on the following topics. (1) With the enrichment and accumulation of data, the impact of geometry, time, system state, and other factors on the radiation stability of hyper-pixels can be further studied. (2) The study of the radiation performance of hyper-pixels in different spaces, including whether urban areas with different climates and cultural environments can extract similarly radiation-stable hyper-pixels and, ultimately, establish a stable radiation-reference network on a global scale. (3) The numerous and complex SAR-imaging phenomena and target interpretations of SAR based on the concept of the hyper-pixel, as well as the integration of SAR imaging and detection, which are particularly promising and challenging research directions.
Author Contributions
Conceptualization, S.S., X.Q. and K.F.; methodology, S.S., X.Q. and K.F.; software, S.S.; validation, S.S., X.Q. and K.F.; formal analysis, K.F.; investigation, S.S.; resources, X.Q. and K.F.; data curation, S.S.; writing—original draft preparation, S.S.; writing—review and editing, K.F. and X.Q.; visualization, S.S. and K.F.; supervision, K.F.; project administration, K.F.; funding acquisition, X.Q. and K.F. All authors have read and agreed to the published version of the manuscript.
Funding
This research was funded by the National Natural Science Foundation, China, grant numbers 62022082, 61991421, and 61991420.
Data Availability Statement
Not applicable.
Acknowledgments
The authors would like to thank National Satellite Ocean Application Service (NSOAS) and CHEOS, for providing GF-3 data, and the European Space Agency, for providing Sentinel-1 data.
Conflicts of Interest
The authors declare no conflict of interest.
References
- Freeman, A. SAR Calibration: An Overview. IEEE Trans. Geosci. Remote Sens. 1992, 30, 1107–1121. [Google Scholar] [CrossRef]
- Kankaku, Y.; Suzuki, S.; Osawa, Y. ALOS-2 Mission and Development Status. In Proceedings of the 2013 IEEE International Geoscience and Remote Sensing Symposium-IGARSS, Melbourne, VIC, Australia, 21–26 July 2013; pp. 2396–2399. [Google Scholar]
- Luscombe, A. Image Quality and Calibration of RADARSAT-2. In Proceedings of the 2009 IEEE International Geoscience and Remote Sensing Symposium, Cape Town, South Africa, 12–17 July 2009; Volume 2, pp. II-757–II-760. [Google Scholar]
- Torres, F.; Snoeij, R.; Geudtner, P.; Bibby, D.; Davidson, D.; Attema, M.; Potin, E.; Rommen, P.; Floury, B.; Brown, N.; et al. GMES Sentinel-1 Mission. Remote Sens. Environ. Interdiscip. J. 2012, 120, 9–24. [Google Scholar] [CrossRef]
- Pitz, W.; Miller, D. The TerraSAR-X Satellite. IEEE Trans. Geosci. Remote Sens. 2010, 48, 615–622. [Google Scholar] [CrossRef]
- Ndikumana, E.; Ho Tong Minh, D.; Baghdadi, N.; Courault, D.; Hossard, L. Deep Recurrent Neural Network for Agricultural Classification using multitemporal SAR Sentinel-1 for Camargue, France. Remote Sens. 2018, 10, 1217. [Google Scholar] [CrossRef]
- Heygster, G.; Dannenberg, J.; Notholt, J. Topographic Mapping of the German Tidal Flats Analyzing SAR Images With the Waterline Method. IEEE Trans. Geosci. Remote Sens. 2010, 48, 1019–1030. [Google Scholar] [CrossRef]
- Singhroy, V. Sar Integrated Techniques for Geohazard Assessment. Adv. Space Res. 1995, 15, 67–78. [Google Scholar] [CrossRef]
- Wang, Y.; Wang, C.; Zhang, H.; Dong, Y.; Wei, S. A SAR Dataset of Ship Detection for Deep Learning under Complex Backgrounds. Remote Sens. 2019, 11, 765. [Google Scholar] [CrossRef]
- Le Hegarat-Mascle, S.; Zribi, M.; Alem, F.; Weisse, A.; Loumagne, C. Soil Moisture Estimation from ERS/SAR Data: Toward an Operational Methodology. IEEE Trans. Geosci. Remote Sens. 2002, 40, 2647–2658. [Google Scholar] [CrossRef]
- Wang, H.; Yang, J.; Mouche, A.; Shao, W.; Zhu, J.; Ren, L.; Xie, C. GF-3 SAR Ocean Wind Retrieval: The First View and Preliminary Assessment. Remote Sens. 2017, 9, 694. [Google Scholar] [CrossRef]
- Beaudoin, A.; Toan, T.L.; Goze, S.; Nezry, E.; Lopes, A.; Mougin, E.; Hsu, C.C.; Han, H.C.; Kong, J.A.; Shin, R.T. Retrieval of Forest Biomass from SAR Data. Int. J. Remote Sens. 1994, 15, 2777–2796. [Google Scholar] [CrossRef]
- Döring, B.J.; Schmidt, K.; Jirousek, M.; Rudolf, D.; Reimann, J.; Raab, S.; Antony, J.W.; Schwerdt, M. Hierarchical Bayesian Data Analysis in Radiometric SAR System Calibration: A Case Study on Transponder Calibration with RADARSAT-2 Data. Remote Sens. 2013, 5, 6667–6690. [Google Scholar] [CrossRef]
- Reimann, J.; Schwerdt, M.; Schmidt, K.; Ramon, N.T.; Castellanos, G.A.; Döring, B.; Rudolf, D.; Raab, S.; Antony, J.M.W.; Zink, M. The DLR SAR Calibration Center. In Proceedings of the 2015 IEEE 5th Asia-Pacific Conference on Synthetic Aperture Radar (APSAR), Singapore, 1–4 September 2015; pp. 169–173. [Google Scholar]
- Huang, Q.; Zhang, F.; Li, L.; Liu, X.; Jiao, Y.; Yuan, X.; Li, H. Quick Quality Assessment and Radiometric Calibration of C-SAR/01 Satellite Using Flexible Automatic Corner Reflector. Remote Sens. 2023, 15, 104. [Google Scholar] [CrossRef]
- Moore, R.K.; Hemmat, M. Determination of the Vertical Pattern of the SIR-B Antenna. Int. J. Remote Sens. 1988, 9, 839–847. [Google Scholar] [CrossRef]
- Rizzoli, P.; Braeutigam, B.; Zink, M. TanDEM-X Large-Scale Study of Tropical Rainforests for Spaceborne SAR Calibration in X-Band. In Proceedings of the EUSAR 2014; 10th European Conference on Synthetic Aperture Radar, Berlin, Germany, 3–5 June 2014; pp. 1–4. [Google Scholar]
- Luscombe, A.P. Radiometric Calibration Information from RADARSAT-1 Amazon Measurements. In Proceedings of the 2001 CEOS SAR Workshop, Tokyo, Japan, 2–5 April 2001; pp. 2–5. [Google Scholar]
- Buck, C. Alternative Large-Scale Distributed Targets for SAR Elevation Beam Pattern Characterization; Citeseer: Princeton, PA, USA, 2001. [Google Scholar]
- Ridley, J.; Strawbridge, F.; Card, R.; Phillips, H. Radar Backscatter Characteristics of a Desert Surface. Remote Sens. Environ. 1996, 57, 63–78. [Google Scholar] [CrossRef]
- Ming, F.; Hong, J. A Method of Measuring SAR Calibration Constant Using Ocean. In Proceedings of the 2011 3rd International Asia-Pacific Conference on Synthetic Aperture Radar (APSAR), Seoul, Republic of Korea, 26–30 September 2011; pp. 1–4. [Google Scholar]
- Scoon, A.; Robinson, I.S.; Meadows, P.J. Demonstration of an Improved Calibration Scheme for ERS-l SAR Imagery Using a Scatterometer Wind Model. Int. J. Remote Sens. 1996, 17, 413–418. [Google Scholar] [CrossRef]
- Giudici, D.; Villa, A.; Recchia, L.; Monti Guarnieri, A.; Johnsen, H.; Meadows, P.; Mouche, A.; Miranda, N.; Ottavianelli, G. Long Term PS-CAL Analysis of ERS and ASAR Data and Comparison to Other Calibration Techniques. In Proceedings of the EUSAR 2014; 10th European Conference on Synthetic Aperture Radar, Berlin, Germany, 3–5 June 2014; pp. 1–4. [Google Scholar]
- D’Aria, D.; Ferretti, A.; Monti Guarnieri, A.; Tebaldini, S. SAR Calibration Aided by Permanent Scatterers. IEEE Trans. Geosci. Remote Sens. 2010, 48, 2076–2086. [Google Scholar] [CrossRef]
- Zakharov, A.; Zakharova, L.; Sorochinsky, M.; Sinilo, V.; Ivanychev, E. Oil Platforms as SAR Calibration Targets in C and L Bands. In Proceedings of the EUSAR 2018; 12th European Conference on Synthetic Aperture Radar, Aachen, Germany, 4–7 June 2018; pp. 1–4. [Google Scholar]
- Yang, J.; Qiu, X.; Ding, C.; Lei, B. Identification of Stable Backscattering Features, Suitable for Maintaining Absolute Synthetic Aperture Radar (SAR) Radiometric Calibration of Sentinel-1. Remote Sens. 2018, 10, 1010. [Google Scholar] [CrossRef]
- Panetti, A.; Rostan, F.; L’Abbate, M.; Bruno, C.; Bauleo, A.; Catalano, T.; Cotogni, M.; Galvagni, L.; Pietropaolo, A.; Taini, G.; et al. Copernicus Sentinel-1 Satellite and C-SAR Instrument. In Proceedings of the 2014 IEEE Geoscience and Remote Sensing Symposium, Quebec City, QC, Canada, 13–18 July 2014; pp. 1461–1464. [Google Scholar]
- Available online: https://weatherspark.com/y/9247/Average-Weather-in-Houston-Texas-United-States-Year-Round (accessed on 13 December 2022).
- Li, H.; Mouche, A.; Stopa, J.E.; Chapron, B. Calibration of the Normalized Radar Cross Section for Sentinel-1 Wave Mode. IEEE Trans. Geosci. Remote Sens. 2019, 57, 1514–1522. [Google Scholar] [CrossRef]
- Han, B.; Ding, C.; Zhong, L.; Liu, J.; Qiu, X.; Hu, Y.; Lei, B. The GF-3 SAR Data Processor. Sensors 2018, 18, 835. [Google Scholar] [CrossRef] [PubMed]
Figure 1.
Optical-image and SAR-image displays of residential areas in the Houston area. (a) The Google optical image of the Houston area and the distribution of three specific residential clusters within the urban area. (b) The optical-image and SAR-image details of the slices of three residential areas. On the right is the scattering intensity of GRD (ground range detected) data of Sentinel-1B with a resolution of about 20 m, corresponding to the residential area.
Figure 2.
The curved-arrangement residential cluster and its radiation intensity in SAR image. (a) The Google optical image of the curved-arrangement residential cluster. (b) The scattering intensity of GRD (ground range detected) data of Sentinel-1B, corresponding to (a).
Figure 2.
The curved-arrangement residential cluster and its radiation intensity in SAR image. (a) The Google optical image of the curved-arrangement residential cluster. (b) The scattering intensity of GRD (ground range detected) data of Sentinel-1B, corresponding to (a).
Figure 3.
The imaging range of Houston scene of the experimental dataset and the corresponding quick-look image. (a) The imaging range of Houston scene data is shown in the red box. (b) The quick-look image from Sentinel-1 product.
Figure 3.
The imaging range of Houston scene of the experimental dataset and the corresponding quick-look image. (a) The imaging range of Houston scene data is shown in the red box. (b) The quick-look image from Sentinel-1 product.
Figure 4.
SAR images of a partial area of Houston.
Figure 4.
SAR images of a partial area of Houston.
Figure 5.
The residential hyper-pixels of manual extraction in Houston scene. (a) The manual-extracted hyper-pixels, as shown in the irregular yellow areas. (b) The slices of the hyper-pixel set.
Figure 5.
The residential hyper-pixels of manual extraction in Houston scene. (a) The manual-extracted hyper-pixels, as shown in the irregular yellow areas. (b) The slices of the hyper-pixel set.
Figure 6.
The radiation-data curve of the hyper-pixel set.
Figure 6.
The radiation-data curve of the hyper-pixel set.
Figure 7.
The time-domain performance of radiation datum extracted from different residential hyper-pixels. (a) An independent residential hyper-pixel object in the scene. (b) The radiation datum curve of the hyper-pixel in (a). (c) Another independent residential hyper-pixel object in the scene. (d) The radiation datum curve of the hyper-pixel in (c).
Figure 8.
The Houston residential-hyper-pixel radiation-data values varied seasonally.
Figure 8.
The Houston residential-hyper-pixel radiation-data values varied seasonally.
Figure 9.
The selected Amazon-rainforest area was used for radiation-stabilization studies.
Figure 9.
The selected Amazon-rainforest area was used for radiation-stabilization studies.
Figure 10.
The curve of mean radiation intensity for experimental rainforest data.
Figure 10.
The curve of mean radiation intensity for experimental rainforest data.
Figure 11.
The GF3 repeated-observation dataset in San Diego. (a) The schematic diagram of repeated observation coverage area. (b) The Google optical image of this scene.
Figure 11.
The GF3 repeated-observation dataset in San Diego. (a) The schematic diagram of repeated observation coverage area. (b) The Google optical image of this scene.
Figure 12.
Extraction results of GF-3-based hyper-pixel geometric orientation in San Diego. (a) The SAR image of this scene at central location of (LON 117°14′49.7113″W, LAT 32°42′18.7956″N). (b) The target residential area on the small island in the scenario, corresponding to the area in the red box in (a). (c) Normalized pixel interval and grayscale inverted image. (d): The straight lines of the roads in the scenario obtained by standard Hough transform.
Figure 13.
Results of GF-3 experiments in the same residential area in San Diego: Effects of hyper-pixels’ relative geometric orientations on radiation datum.
Figure 13.
Results of GF-3 experiments in the same residential area in San Diego: Effects of hyper-pixels’ relative geometric orientations on radiation datum.
Table 1.
Sentinel-1 dataset parameters.
Table 1.
Sentinel-1 dataset parameters.
| Data Source | Beam Code | Incident Angle/° | Resolution (m)
Rg × Az | Sensing Time | Image Amount |
|---|
| S1B_GRDH | S3 | 29.33~34.85 | 23 × 23 | October 2016~November 2021 | 68 |
| Disclaimer/Publisher’s Note: The statements, opinions and data contained in all publications are solely those of the individual author(s) and contributor(s) and not of MDPI and/or the editor(s). MDPI and/or the editor(s) disclaim responsibility for any injury to people or property resulting from any ideas, methods, instructions or products referred to in the content. |
© 2023 by the authors. Licensee MDPI, Basel, Switzerland. This article is an open access article distributed under the terms and conditions of the Creative Commons Attribution (CC BY) license (https://creativecommons.org/licenses/by/4.0/).


