Article

Appraisal of Ancient Quarries and WWII Air Raids as Factors of Subsidence in Rome: A Geomatic Approach

by
Angela Celauro
1,*,
José Antonio Palenzuela Baena
1,2,
Ilaria Moriero
1,
Alexander Maass
3,
José Francisco Guerrero Tello
4,
Peppe Junior Valentino D’Aranno
1,2 and
Maria Marsella
1,5
1
Dipartimento di Ingegneria Civile Edile e Ambientale-(DICEA), Sapienza Università di Roma, Via Eudossiana 18, 00184 Rome, Italy
2
Survey Lab s.r.l., Via Cavour 167, 00184 Rome, Italy
3
Freiburger Institut für Paläowissenschaftliche Studien (FIPS), Albertstraße 14A, 79104 Freiburg im Breisgau, Germany
4
Istituto Nazionale di Geofisica e Vulcanologia (INGV), Osservatorio Etneo, Piazza Roma 2, 95125 Catania, Italy
5
Centro di Ricerca Aerospaziale Sapienza (CRAS), Sapienza Università di Roma, Via Eudossiana 18, 00184 Rome, Italy
*
Author to whom correspondence should be addressed.
Remote Sens. 2023, 15(8), 2011; https://doi.org/10.3390/rs15082011
Submission received: 25 January 2023 / Revised: 31 March 2023 / Accepted: 1 April 2023 / Published: 11 April 2023

Abstract

:
Ancient mining and quarrying activities left anthropogenic geomorphologies that have shaped the natural landscape and affected environmental equilibria. The artificial structures and their related effects on the surrounding environment are analyzed here to characterize the quarrying landscape in the southeast area of Rome in terms of its dimensions, typology, state of preservation and interface with the urban environment. The increased occurrence of sinkhole events in urban areas has already been scientifically correlated to ancient cavities under increasing urban pressure. In this scenario, additional interacting anthropogenic factors, such as the aerial bombardments perpetrated during the Second World War, are considered here. These three factors have been investigated by employing a combined geomatic methodology. Information on air raids has been organized in vector archives. A dataset of historical aerial photographs has been processed into Digital Surface Models and orthomosaics to reconstruct the quarry landscape and its evolution, identify typologies of exploitation and forms of collapse and corroborate the discussion concerning the induced historical and recent subsidence phenomena, comparing these outputs with photogrammetric products obtained from recent satellite data. Geological and urbanistic characterization of the study area allowed a better connection between these historical and environmental factors. In light of the information gathered so far, SAR interferometric products allowed a preliminary interpretation of ground instabilities surrounding historical quarries, air raids and recent subsidence events. Various sub-areas of the AOI where the presence of the considered factors also corresponds to areas in slight subsidence in the SAR velocity maps have been highlighted. Bivariate hotspot analysis allowed substantiating the hypothesis of a spatial correlation between these multiple aspects.

1. Introduction

Rome lies on several types of ancient-to-modern artificial hypogea. With regard to the ancient structures there, the dense network of cavities belongs mainly to traits of subterranean quarries, dated from the Pre-Roman/Roman period onwards, and whose extent is only partly known. Other typologies of ancient underground structures can be sections of aqueducts [1], hydraulic systems or hypogeal environments belonging to residential facilities. The partial knowledge of the actual network extent is a factor that plays a relevant role in the deterioration of their conservation and related urban security. Moreover, the increase in urban pressure due to the widening of residential areas and the related traffic intensification may affect the condition of both the hypogeal and surface environments, resulting in the increasing phenomenon of sinkholes and road raveling, a rising threat in the current urban context. The appraisal of man-made factors in promoting sinkholes or chasms is, therefore, nowadays a very critical topic, while the study of the archaeological aspects of these quarries, also aimed at their characterization, protection and enhancement, remains less thorough, even though closely connected to them.
The exploitation of lithotypes, aimed at satisfying the need for building materials either in opencast or subterranean modalities, is an activity that, since ancient times, has increased in parallel with the expansion of inhabitation nuclei, taking place in the surrounding periphery of them. Over time, rapid urbanization has meant that these quarrying areas have become residential neighborhoods once the exploitation has ceased. Pre-industrial quarries can be opencast or developed underground, depending on the depth and stratification of the lithotypes of interest in the geological profile.
In Rome, the actual perimeter of the city circumscribes, at the subterranean level, a vast network of underground structures. These quarries developed with the opening of galleries, chambers and pits, interspersed with pillars, which can be found on single or multiple levels. The exploitative methods in quarries evolved over time, from the manual use of rudimentary metal tools to the deployment of automatic mechanisms. Despite differences in scale, these exploitation methods always entail similar impacts on the surrounding environment. The use of the ancient method of fire-setting and, later on, the employment of targeted-detonation of explosive charges, applied since the 17th century, have a deeper impact on the encasing rock, and they were also used to a limited extent in quarries. Conversely, the work of wedges and chisels allowed a more controlled extraction of the stone materials without damaging them.
The characteristics of the underground structures, such as the width and depth of galleries and subterranean chambers, the dimension of pillars, the distance of the vaults from the ground level, and the lithotypes, play a role in conservation-related urban security. The quarries in the southeast part of Rome that are herein considered are mainly aimed at exploiting pyroclastic products from the Vulcanic district of Colli Albani, such as tuff and pozzolana, which characterize the local geological asset with stratifications generated by several explosive volcanic events. These lithotypes were used as building materials and as a basis for the production of hydraulic mortar and hydrated lime [2]. To a lesser extent, and mainly in other areas of the city, the alluvial deposits, connected with local hydrology and palaeohydrology, were also the aim of exploitation.
With the urban development, the city subsequently incorporated these extractive areas into its dense urban texture, obliterating their appearance, affecting their preservation, and endangering the integrity of the built-up areas at the surface. Furthermore, repeated air raids that took place during the Second World War in the years 1943 and 1944 may have played a role in weakening the static nature of the ancient hypogea and the current condition of urban structures, infrastructures and underground and surface services.
The present work aims to describe in detail the ancient quarrying activities and the delicate interface with the aforementioned anthropic factors by applying a combined geomatic approach to reveal their spatial distribution and correlation in the study area in light of the worsening conservation conditions of the quarries and the increase in the phenomenon of urban raveling.
To achieve this broad aim, the appraisal of conspicuous literature concerning the ancient lithic exploitation methods and the historical, archaeological and geological aspects relatable to road raveling was mandatory. In fact, in its complexity, this phenomenon has been the subject of previous studies that investigated specific aspects for finding cutting-edge methods for its proper characterization and monitoring.
The understanding of the nature of anthropogenic underground cavities in the urban context of Rome has been approached through the scrutiny of several previous studies, which addressed the archaeological [3,4,5], landscape [6,7] and speleological aspects [8] but also the characterization of local lithotypes for ancient masonry [9,10], the ancient techniques of extraction [11] and related infrastructures [12]. The archaeological study of this type of hypogea also relates to underground environments of different nature, such as catacombs, which can sometimes be located in dismissed quarry sections [2,13]. Additionally, the geological–geotechnical aspects [14,15,16,17] related to the hypogea have been closely connected to the instability phenomena (above all, the sinkhole and landslide issues) investigated in Rome but also in other analogous places. The individuation of the underground environments is also aimed at implementing risk management actions [18,19,20,21,22]. On these last aspects, for several years, significant achievements have been made in the mapping of the cavities [8,18,21,22,23,24,25,26], the assessment of degeneration conditions relatable to the development of sinkholes and the evaluation of the connected risk [19,21,22,23,27,28]. Considering also the achievements reached in the study of analogous cases in Italy and out of the country, further efforts have been directed toward identifying precursory factors [29,30,31,32]. Geomatics monitoring by space-borne, close-range and ground-based platforms bearing a wide range of sensors has been validated for the evidencing of soil raveling, using, as an example, photogrammetric modeling [33,34], ground-based systems [35], geophysics approaches [17,21,26,36,37,38,39], or sensor networks [40]. The Differential Interferometric Synthetic Aperture Radar (DInSAR) technique, one of the key methods applied in satellite monitoring in urban areas [41,42,43,44], has also recently been applied to the investigation of sinkholes ([29,31,32,45,46,47], and a preliminary approach in [48]). These new studies can allow precautionary and mitigative actions, which can decrease the occurrence of emergencies, civil risk and damages to structures, allowing savings on maintenance costs.
There are, therefore, a number of very relevant scientific contributions dedicated to this phenomenon. Based on the scientific work existing so far and considering the aspects that are less explored, the approach herein described aims to increase the knowledge of on the ancient quarries and widen the possible anthropogenic factors that can favor the development of subsidence phenomena. In this work, the historical and archaeological factors are considered primary, as the research is dedicated to the investigation of their function as triggers. Therefore, the role of this contribution, among the others mentioned, is to bring out new features that can guide the identification of areas of archaeological and historical relevance, which must be further studied for their conservation and for related urban safety. The understanding of ancient quarrying activities and their exploitation evolution is crucial in interpreting the remarkable alteration of the natural landscape related to the excavation of opencast and underground quarries, trenches, and the accumulation of waste materials, such as dump heaps and refilled pits or collapsed cavities (pingen, a term coming from German terminology in mining, is used here to indicate historical structures).
In particular, the tuff and pozzolana quarries of the southeast area of Rome have been investigated using techniques of digital photogrammetry and virtual survey on historical and recent aerial imageries and space-borne optical and Synthetic Aperture Radar (SAR) monitoring, which have been of significant usefulness in the research in this area, not only for the monitoring of the surface infrastructures and buildings but also, indirectly, to gather additional information on the state of the subterranean environments.
The collection of archival historical information and their vectorization complete this heterogeneous dataset, whose use was already validated for the formulation of initial claims on the topic of urban archaeology and raveling [48]. In this previous work, preliminary results have been briefly outlined, and expeditious considerations on spatial analyses were qualitatively described. Here, a sounder discussion of results coupled with geospatial analysis as a quantitative evaluation method is proposed on an enlarged population of data obtained from historical, urbanistic and geological explorations, sided by 2D and 3D photogrammetric products and Persistent Scatterers Interferometry (PSI or PSInSAR) outputs.
The following methodological paragraph is introduced with a brief description of the study area to outline the motivation that led to the chosen methodology. Additionally, a graphical workflow of the methodology is shown in the Supplementary Files section.

2. Materials and Methods

2.1. The Study Area

The phenomenon of sinkholes in Rome is currently significantly evident because of the increasing incidence and its disparate triggering causes, which are not easily predictable but often associated with the presence, as stated, of underground environments. This occurrence can be further favored, depending on the type of sinkhole, by extreme weather events, such as heavy rains, but also by poor infrastructure maintenance, or it can be worsened by the presence of tree roots that can damage the integrity of the cap rock and asphalt coverage. It is possible to identify areas that are often subject to the opening of chasms, as evidenced in previous studies [18,22,26,28], where the east to southeast sector of the city is highlighted as one of the most affected. A detailed consideration of the concurrent agents and risk elements is also depicted in Mazza et al. [28], executed in a sector of this urban area.
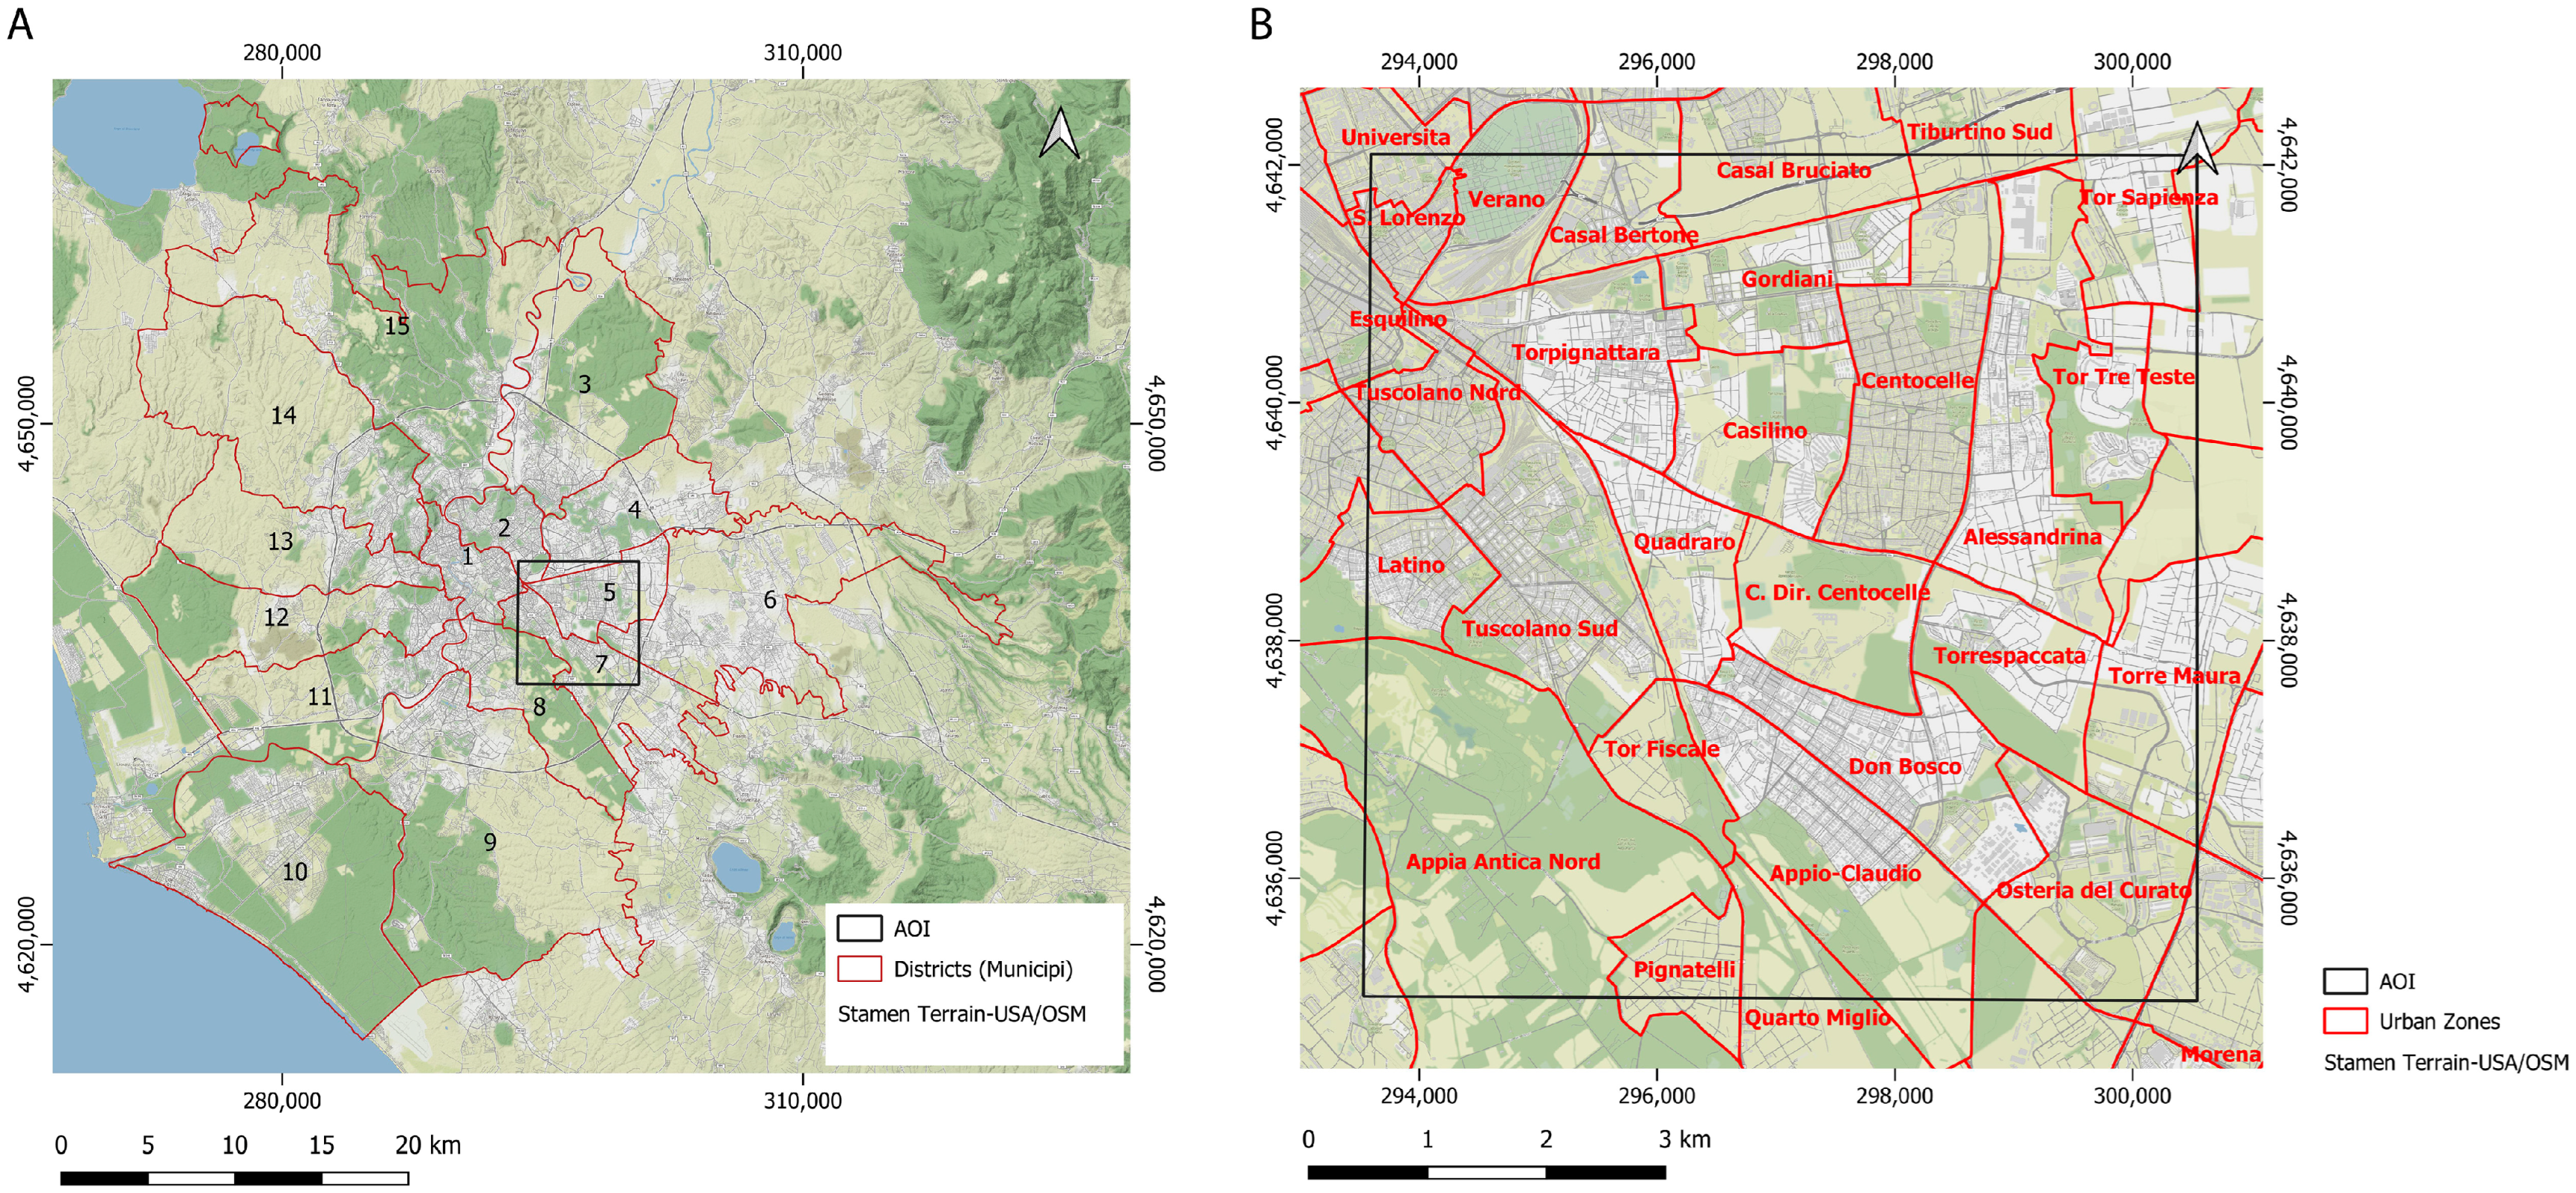
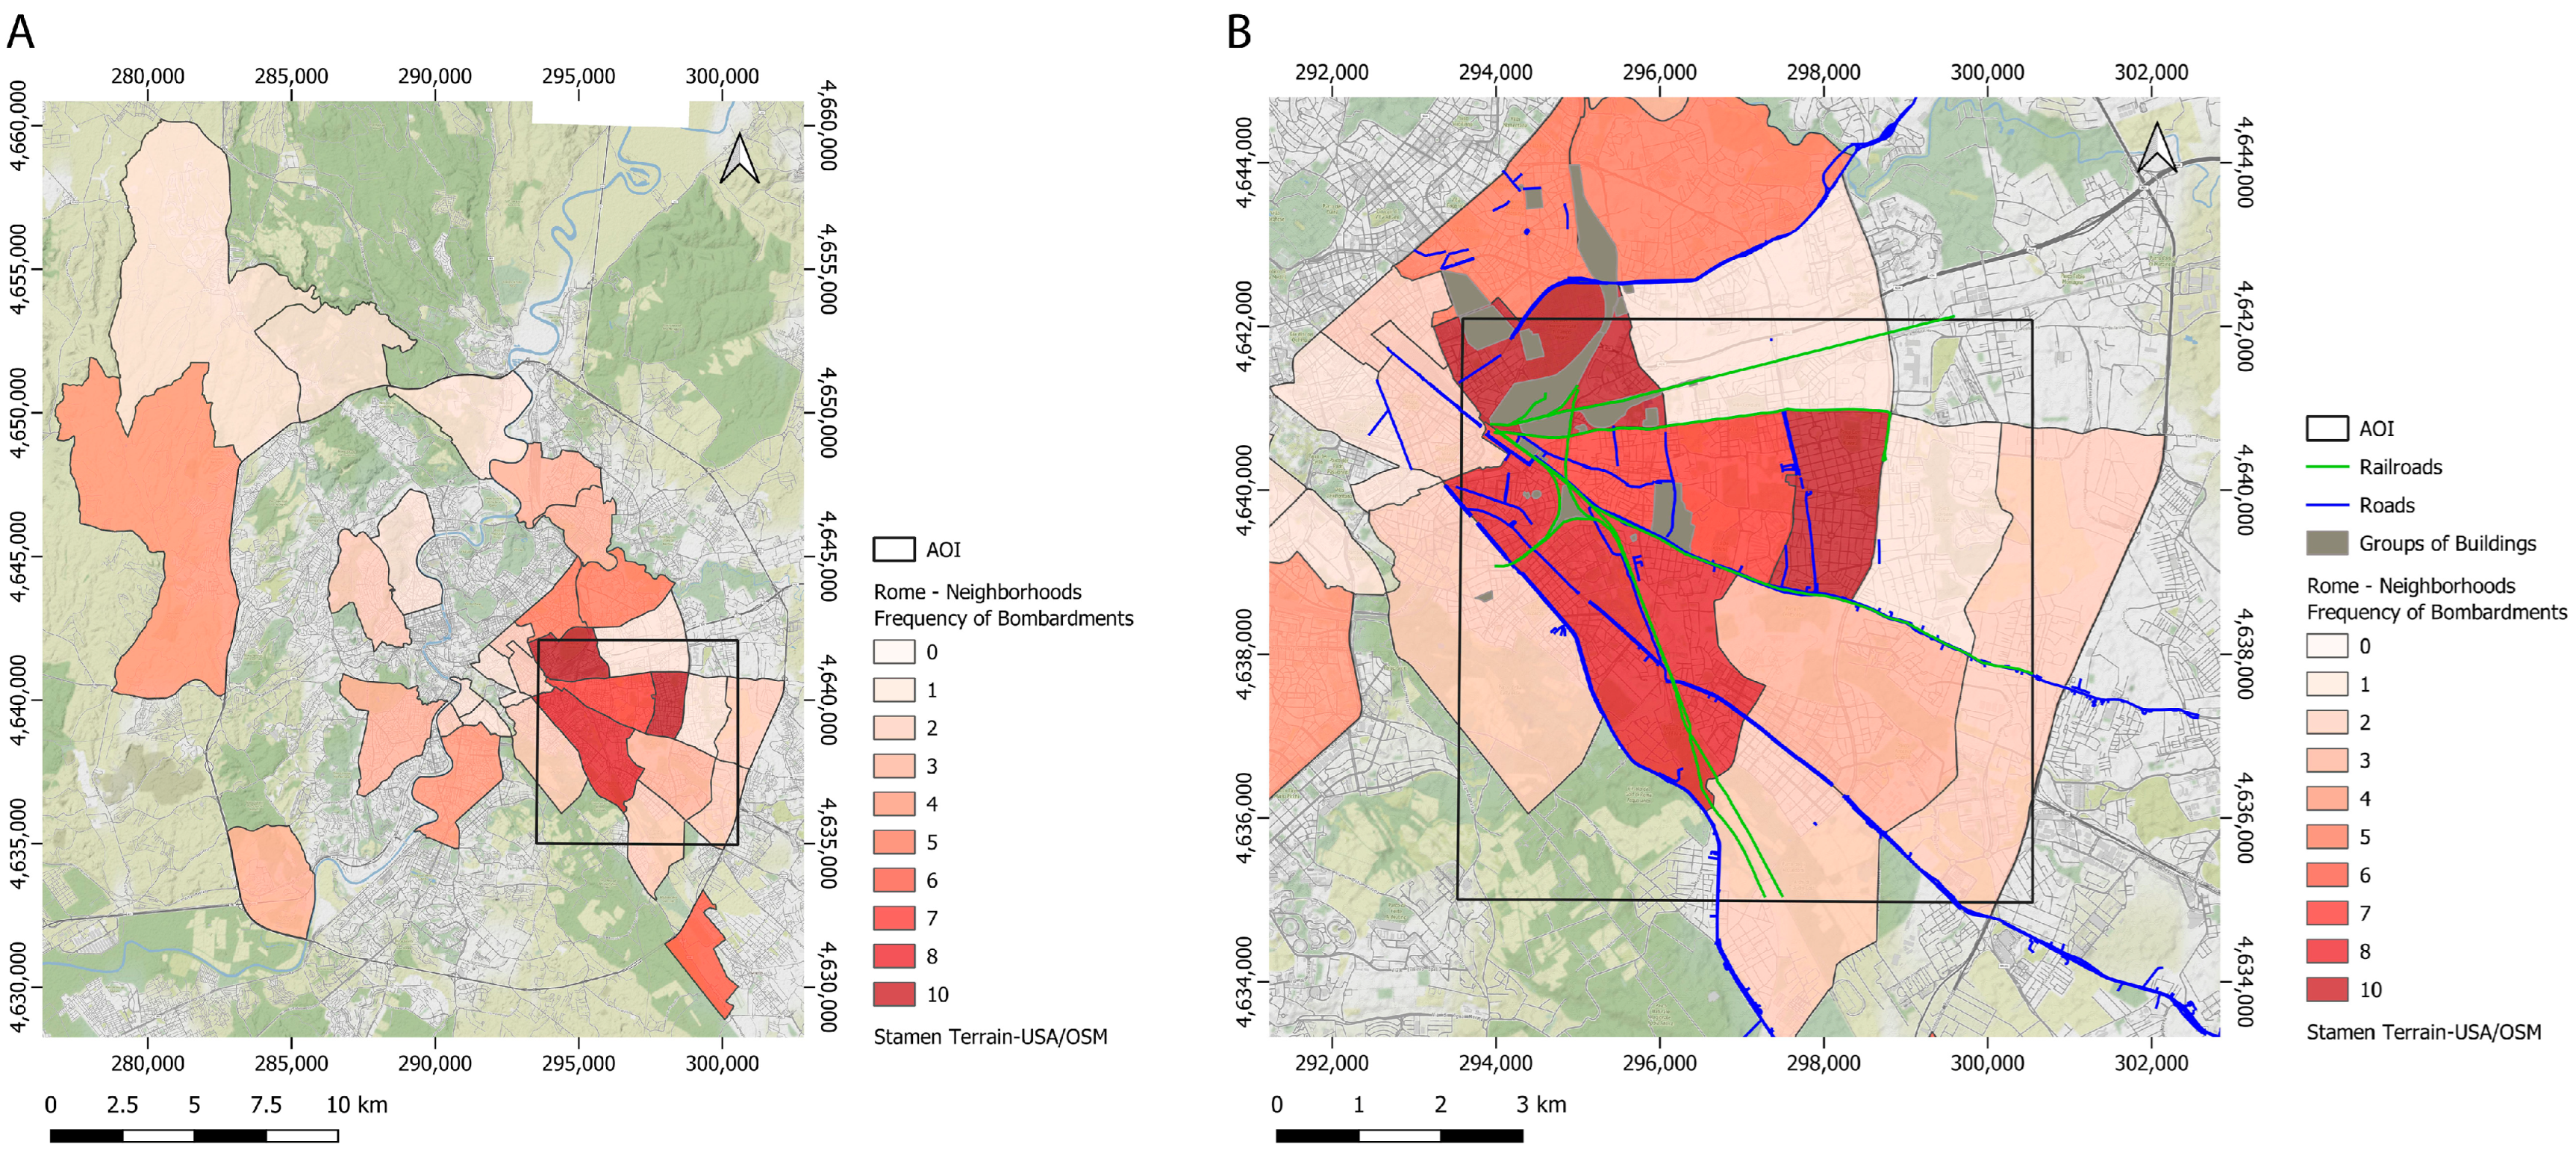
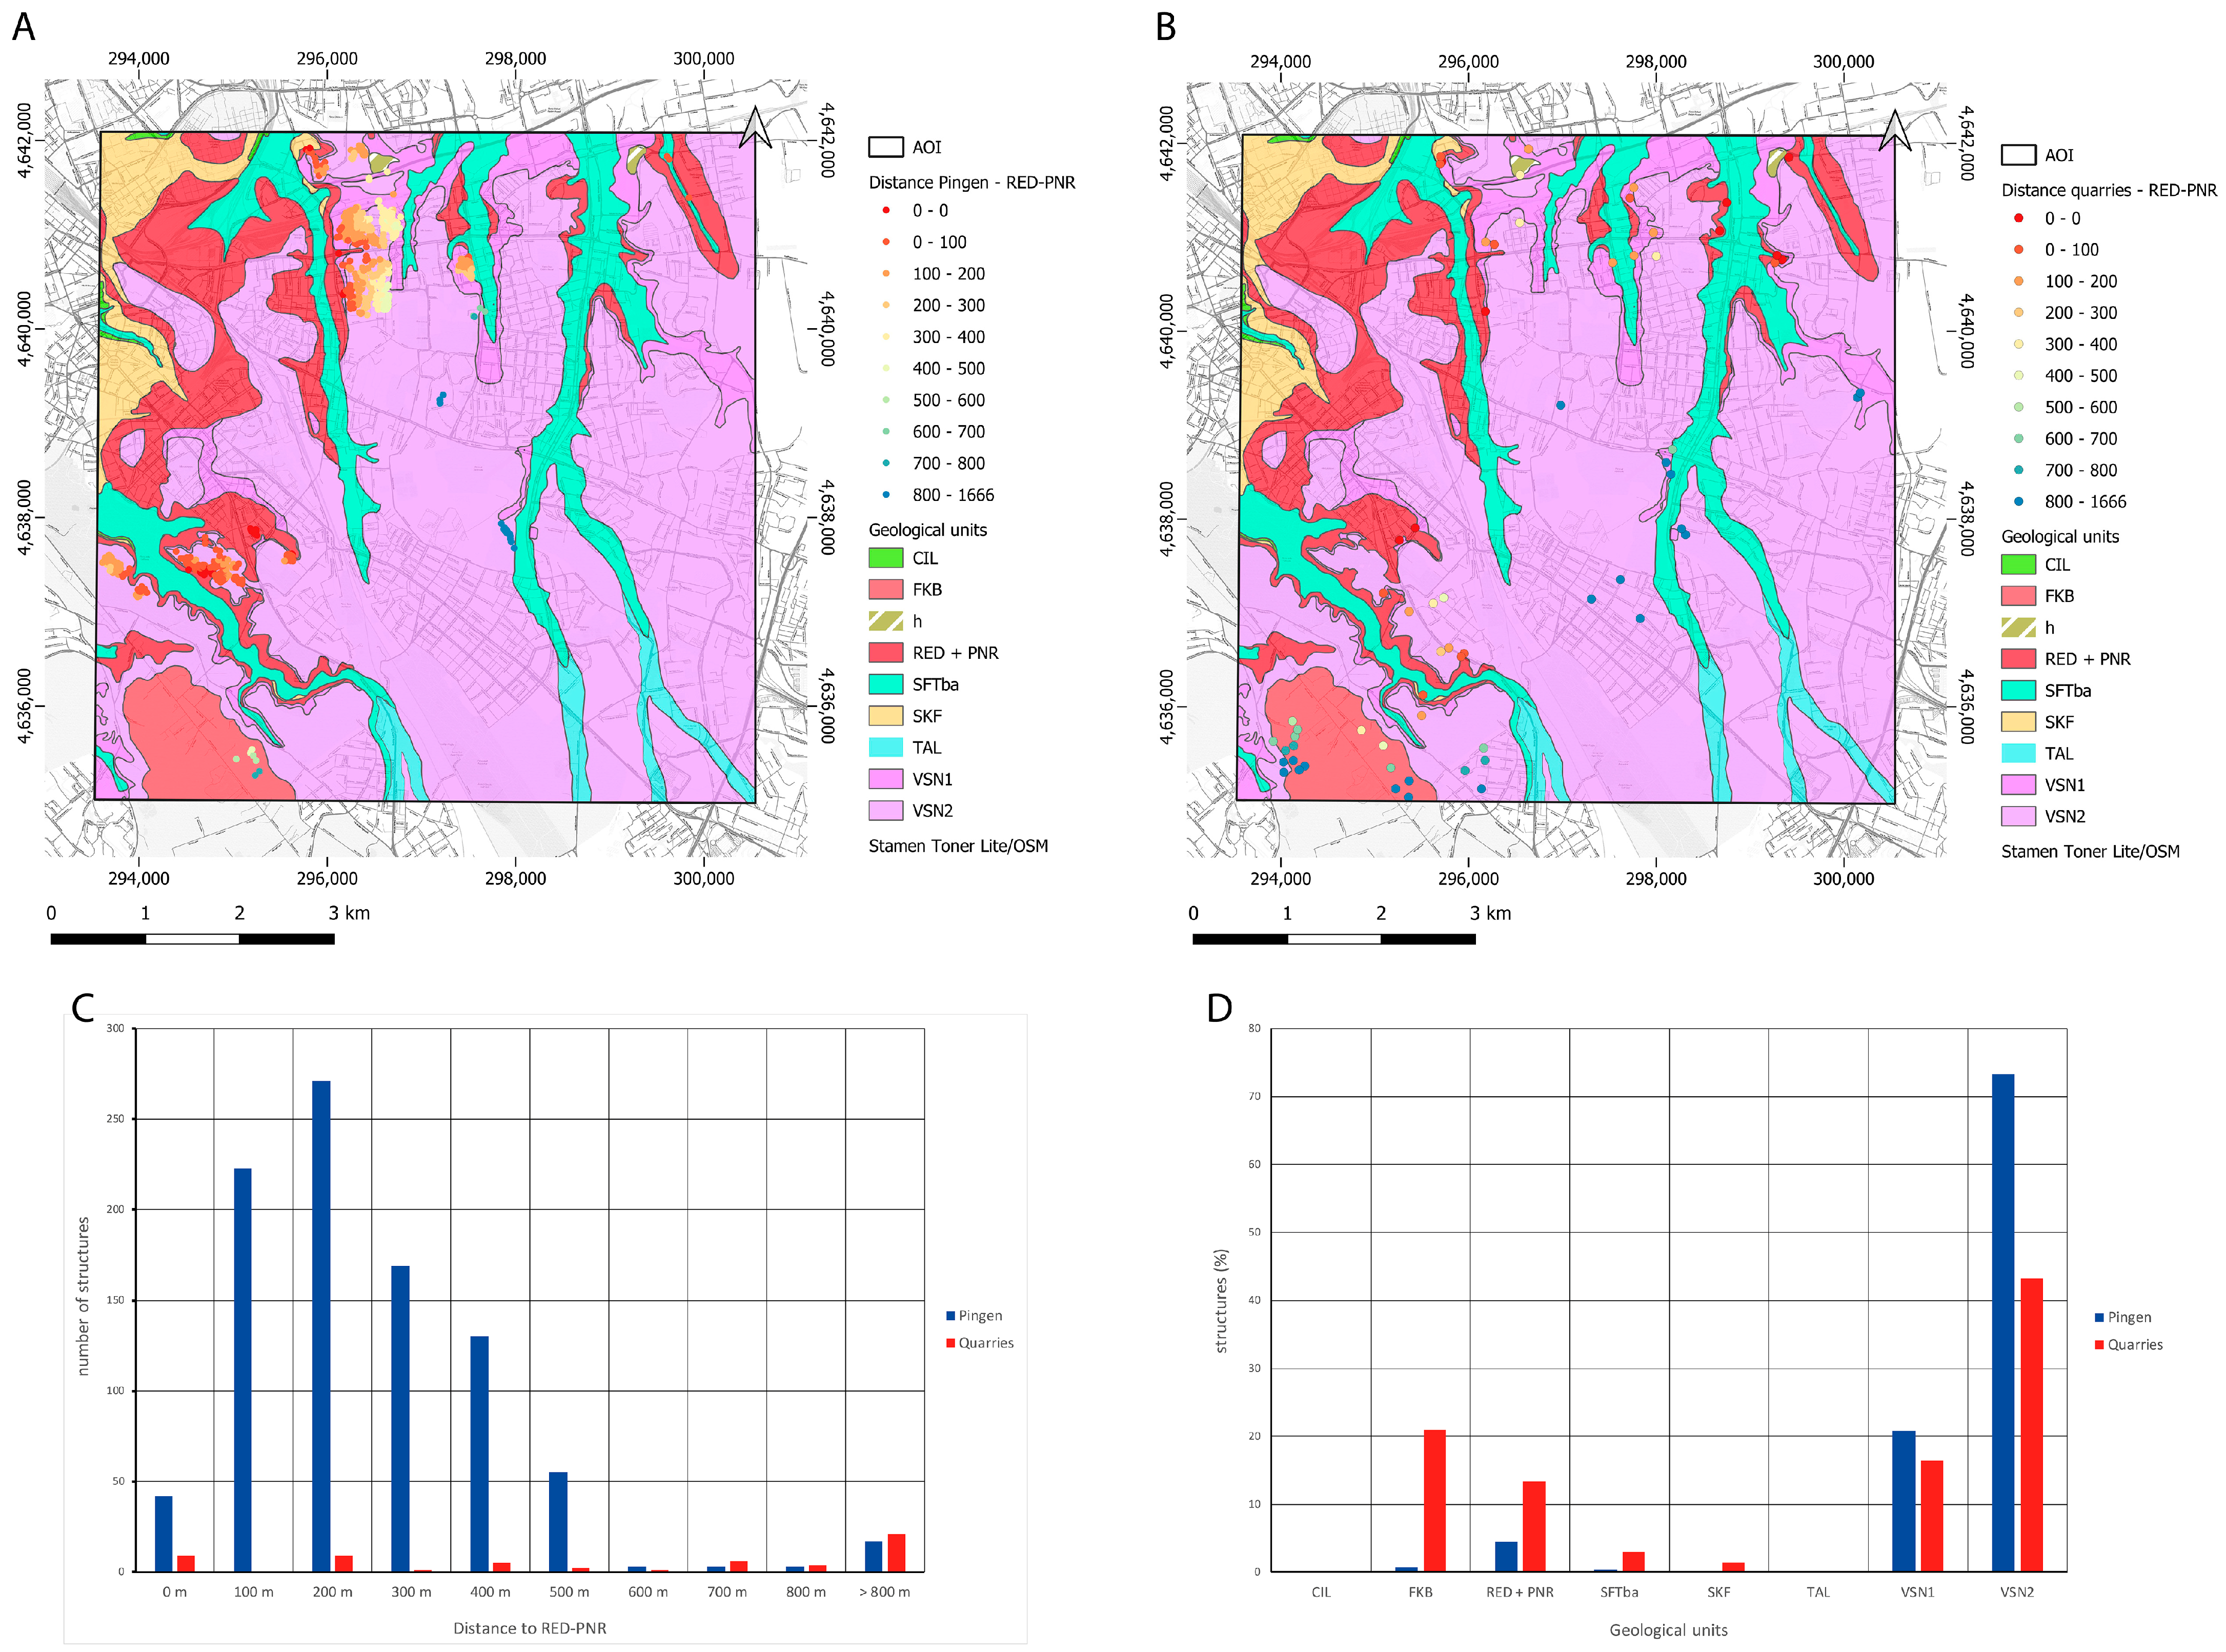
In a wider surrounding zone of Rome (AOI, 
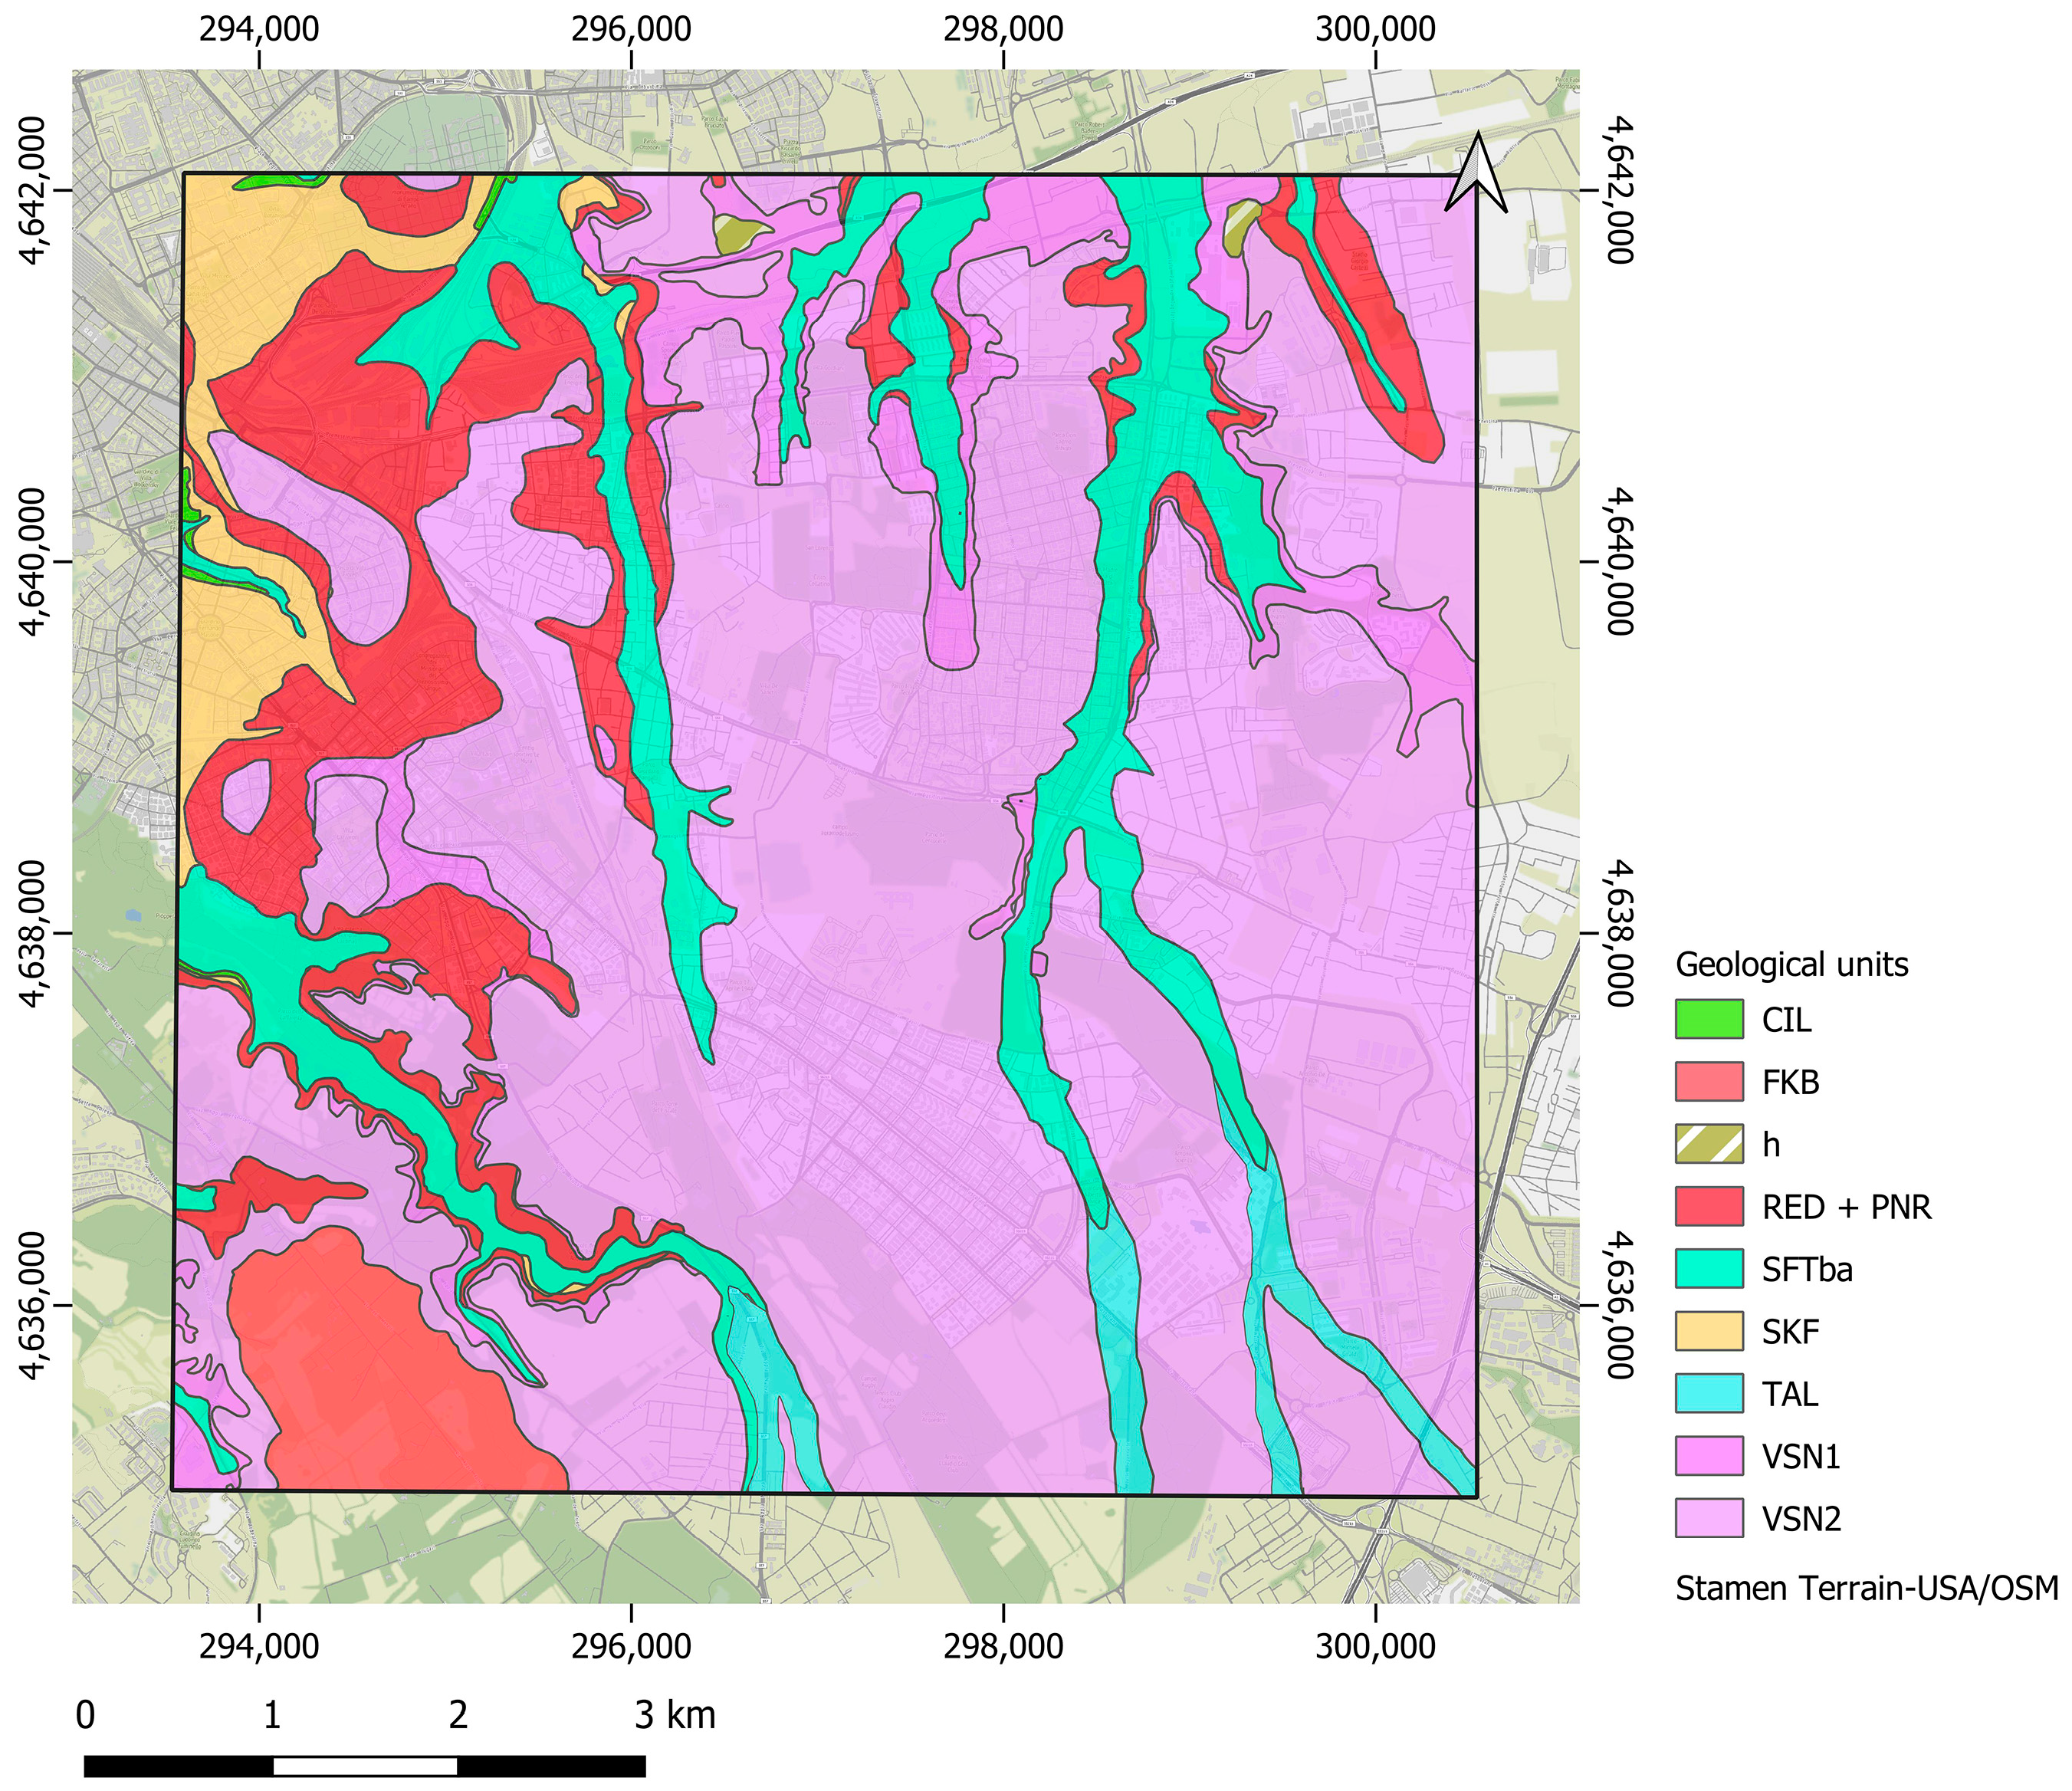
Figure 1), the vast network of galleries and chambers was developed in the pyroclastic units of the Volcanic district of Colli Albani (Figure 2), with exploitations mainly aimed at red and black pozzolane (RED + PNR) and the Villa Senni—pozzolanelle (VSN2) [28]. The Villa Senni—tufo lionato (VSN1) was also used as building material [26].
In terms of dimensions and depth, the type of underground network depends on the stratification and thickness of geological units. In the city, the thickness of pyroclastites can be between 10 and 40 m [14]. Despite the vast diversity of exploitation, some general delineations can be valid: the underground structures are mainly referred to as being located at about 10 to 15 m from the walking level [14], and galleries have an average height between 3 and 5 m and a width of 2–3 m [28,37], which are typical dimensions of the Roman underground exploitation [13] but were also used later on. Dimensional exceptions are the subterranean quarries dug in the tuff so-called “lionato”, distinguished for their bigger dimensions of around 10–15 m per side, allowed by the higher competence of the rock [14]. Furthermore, sometimes the network can run on two or more levels [28] and, in some areas, the vaults can be much closer to the walking level, even only a few meters at a time [37], causing additional complexity in evaluating the preservation conditions of the underground system.
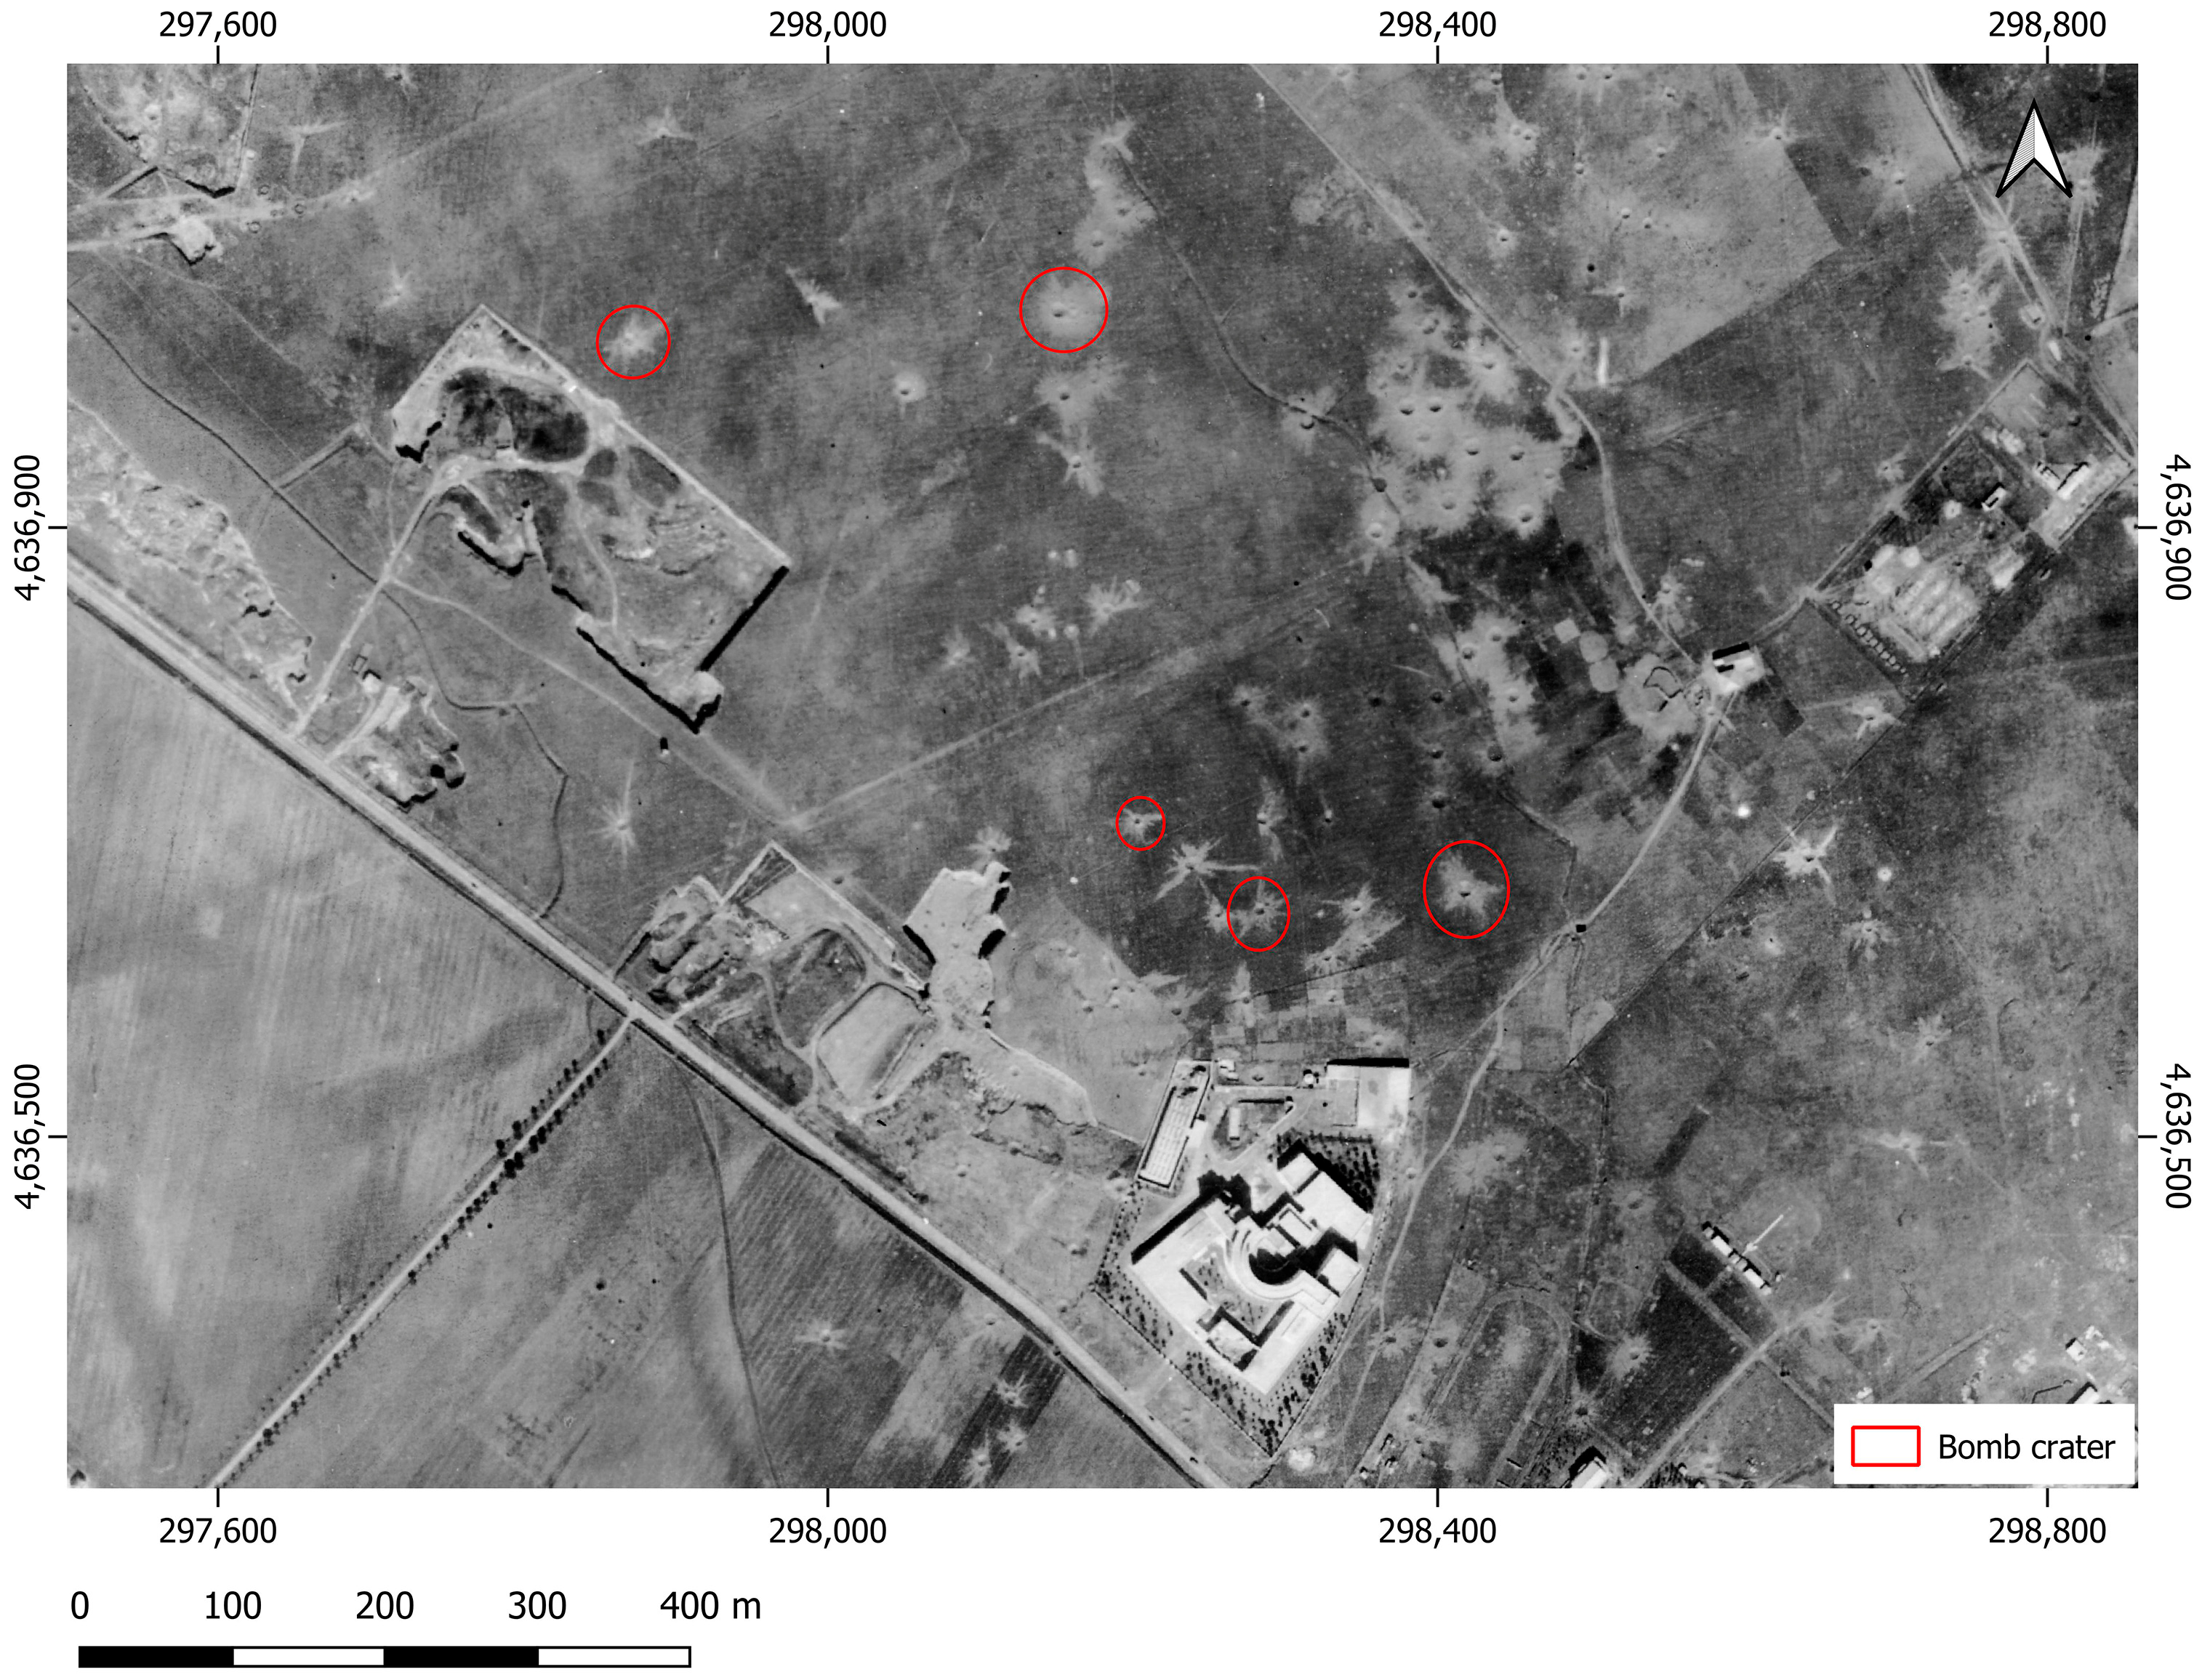
Considering the historical factor here under study, this area also emerges as one of the bombardment hotspots in Rome during the Second World War (WWII). The intense air raids were aimed at strategic features of the AOI. The impact of the explosive devices on the eventual underground structures below was certainly depending on the penetration effect, which is, in turn, relatable to the flight height, the inclination of the hit and, related to the impacted aim, the type of backfill soils and the distance between the underground vaults and the ground surface. It is here hypothesized that the bombardments, when over underground structures or in their vicinity, may have triggered the worsening of the underground stability, which could have sped up under the increasing urban pressure. The historical aerial photographs (HAPs, an example in Figure 3), furnished from Ente Italiano Rilievi Aerofotogrammetrici, Istituto Centrale per il Catalogo e la Documentazione (ICCD), support the dimensioning of the craters of bomb impacts. Sudden structure collapses are documented in historical reports, such as the case of the destruction of a cavity used as a bomb shelter in the Acqua Bullicante area (a sub-quarter of Casilino, in Figure 1B), in the north of the AOI [53].
The density of the ancient quarries and the high incidence of bombing events in the AOI, in combination with the increase in recent subsidence phenomena, are the premises of the study, and their spatial distributions are the topics of investigation here, both from the points of view of urban security and conservation of archaeological structures. Because of the complex interrelation of these factors in the AOI, a methodology for their proper consideration has been designed. The main outputs obtained during the data collection phase will be briefly illustrated in the context of the methods used to clarify the practical aspects better and to furnish a preliminary overview of these data, which are the inputs of the subsequent geostatistical analysis. The results in Section 3 is then explicitly dedicated to the geospatial correlation of all the factors hitherto considered.

2.2. Photogrammetric Processing of HAPs and Satellite Data

For the first step, several aerial pictures have been orthorectified to allow very accurate identification and vectorization of the bomb impacts and quarry-related structures.
The HAPs used are aerial photos acquired during aerial reconnaissance missions executed by the Italian and British Air Forces (Aeronautica Militare—AM, and the British Royal Air Force—RAF) and during photogrammetric flights conducted by companies such as the Italian SARA (Società Aerofotografie e Rilevamenti Aerofotogrammetrici). This diachronic dataset covers the area extension completely, but considering the dataset from a temporal resolution point of view, there are gaps throughout the period in question.
The photogrammetric processes were mainly performed using the Orthoengine module in PCI Geomatica 2017 [54]. The workflow guides the execution of the internal and external orientations from the phase of Ground Control Points (GCP) and tie points (TP) insertion till the extraction of the digital elevation model (DEM), the editing of the Digital Terrain Model (DTM), the orthorectification of the images and finally their mosaicking. With this operational stacking, high-resolution and accurate orthophotos and Digital Surface Models (DSM) and DTM were generated from 0.55 m/px panchromatic stereoscopic satellite images from the constellation Pléiades (CNES and ASI—Orfeo System satellite optical sensors, supplied by Sysdeco Italia S.r.l.—date of acquisition: 1 January 2017). Pléiades-HR stereoscopic pairs have a low base/height ratio and a reciprocal coverage higher than 95%, which are very suitable characteristics for extracting DEMs. These data were used as reference to support the extraction of orthophotos and DSMs from HAPs.
In Orthoengine, the mathematical model Rational Function was selected in the extract-from-image mode. In fact, Pléiades-HR were provided with RPC (Rapid Positioning Capability) auxiliary data, containing the polynomial coefficients that allow their first low-accuracy georeferencing. An additional five GCPs, obtained from the numerical cartography of Rome with elevation information, were added manually to obtain a more accurate fit by using the GCP/TP Collection tool. This minimum number of GCP was chosen as the images have a difference in the acquisition angle of less than 7° (base/height ratio lower than 0.15°), and a higher number can worsen the model by introducing errors inherent in the manual operation itself [55]. After the execution of these steps, the residual report helps check the quality of the set math model. For these images, residuals never higher than two pixels correspond to an error of ±1 m. The conversion of the images into epipolar pairs allows for automatic DEM extraction. The final processing carried out with the module DEM editing, by means of terrain filters, supports the production of the DTM, applied for the orthorectification of the two images in the Generate Ortho tool. These products were analyzed in QGIS and CloudCompare [56].
Furthermore, PCI Geomatica was then successfully applied to extract two DSMs from four photographs of AM_1953 and two photographs of RAF_1944. The PCI Geomatica 2017 workflow used for the ortho-correction of historical photographs is similar to the previous stacking, with an additional step for the internal orientation of the camera. In fact, historical photographs are furnished mainly without calibration certificates, which can be reconstructed by the insertion and calculation of several required data. This step allows the correction of image distortions due to the cameras’ optics and defines the pixel coordinates of the image and the projection center.
Following the project’s setting with the selection of the Mat Modelling Method for Aerial Photography with an external orientation computed from GCP, the calibration of the camera was achieved by inserting the information available on the photographs, such as their size, the focal length, scale, and flight elevation and by manually marking the position of the fiducial marks. In some cases, it was even possible to hypothesize the aerial camera’s model from the coded information on the historical photographs. For example, in the case of RAF_1944 imagery, the type of camera can be deduced from the code F/24″, which was interpreted at first as an F24 model, used by the British and American air forces. However, this hypothesis was later discarded, as the 24″ stands for focal length in inches, not used for F24 cameras but for Fairchild cameras, such as the K17 or K22, often used in reconnaissance flights by the Ally armies during WWII, whose dimensions of 9 × 9 inches and type of fiducial marks additionally confirm one of these models.
The difficulty encountered so far in this phase was the collection of a suitable number of GCP, which shall be collected in unchanged areas, visible in both the historical images and in the Pléiades-HR products, such as historical fortified edifices, residential buildings and parts of roads. Still, because such zones are scarce, it was very often necessary to create a “hooking network”, provided by other relatively more recent photographs, such as the AM_1953 series, that was orthorectified mainly with the purpose of supporting the georeferencing of older photographs. Each of the GCP’s X, Y and Z values were measured on the vector cartography and verified with Pléiades-HR Orthophotos and DSM. For the SARA_1927 dataset, the scarcity of GCPs did not allow the extraction of a good elevation model in PCI, so the Agisoft Metashape 2.0 software [57] for creating 3D models by Structure for Motion (SFM) was tested for this photogrammetric operation. This software aligns pictures by an internal algorithm, creating a model of the surface whose accuracy can be increased by the insertion of markers and which can be georeferenced by GCP.
Once this photogrammetric dataset had been generated, its accuracy was checked using validation points identified on the numerical cartography. For what regards the Pléiades-HR products, the position of the validation points is uniformly distributed in space while, in the case of historical datasets, their positioning is determined by the presence of unchanged built-up areas, avoiding the zones adjacent to the GCPs as much as possible. In the case of AM_1953, which depicts a period in which this area was already semi-built, the vast residential neighborhoods allowed the insertion of the validation points with a wider spatial distribution criterion, while the accuracy values for the older HAPs products are less homogeneous, showing good results in areas close to GCPs and noisier values in peripheral areas, at times with very wide shifts, especially for what regards elevation values. However, the use of these DSMs for the study of quarry structures is possible as it is aimed at performing relative measurements to interpret their shapes. In Table S1 (in Supplementary Files), the values of accuracy were obtained by comparing these check points on the orthophotos and the analogous points in the vector cartography calculated by subtracting the metric coordinates of the two series of points. Additionally, in Table S2 (in Supplementary Files), the DSMs values of elevation accuracy were calculated analogously.
These photogrammetric products were used as basic information layers for the vectorization of quarry-related structures, forms of bomb impacts and for an evaluation of the urbanization in the AOI.

2.3. Vectorization of Historical Data

All the vectorization operations have been executed in the free and open-source software QGIS 3.16 Hannover [58] by manually drawing the vectors and using the attribute table as an alphanumeric archive of the relevant historical information.
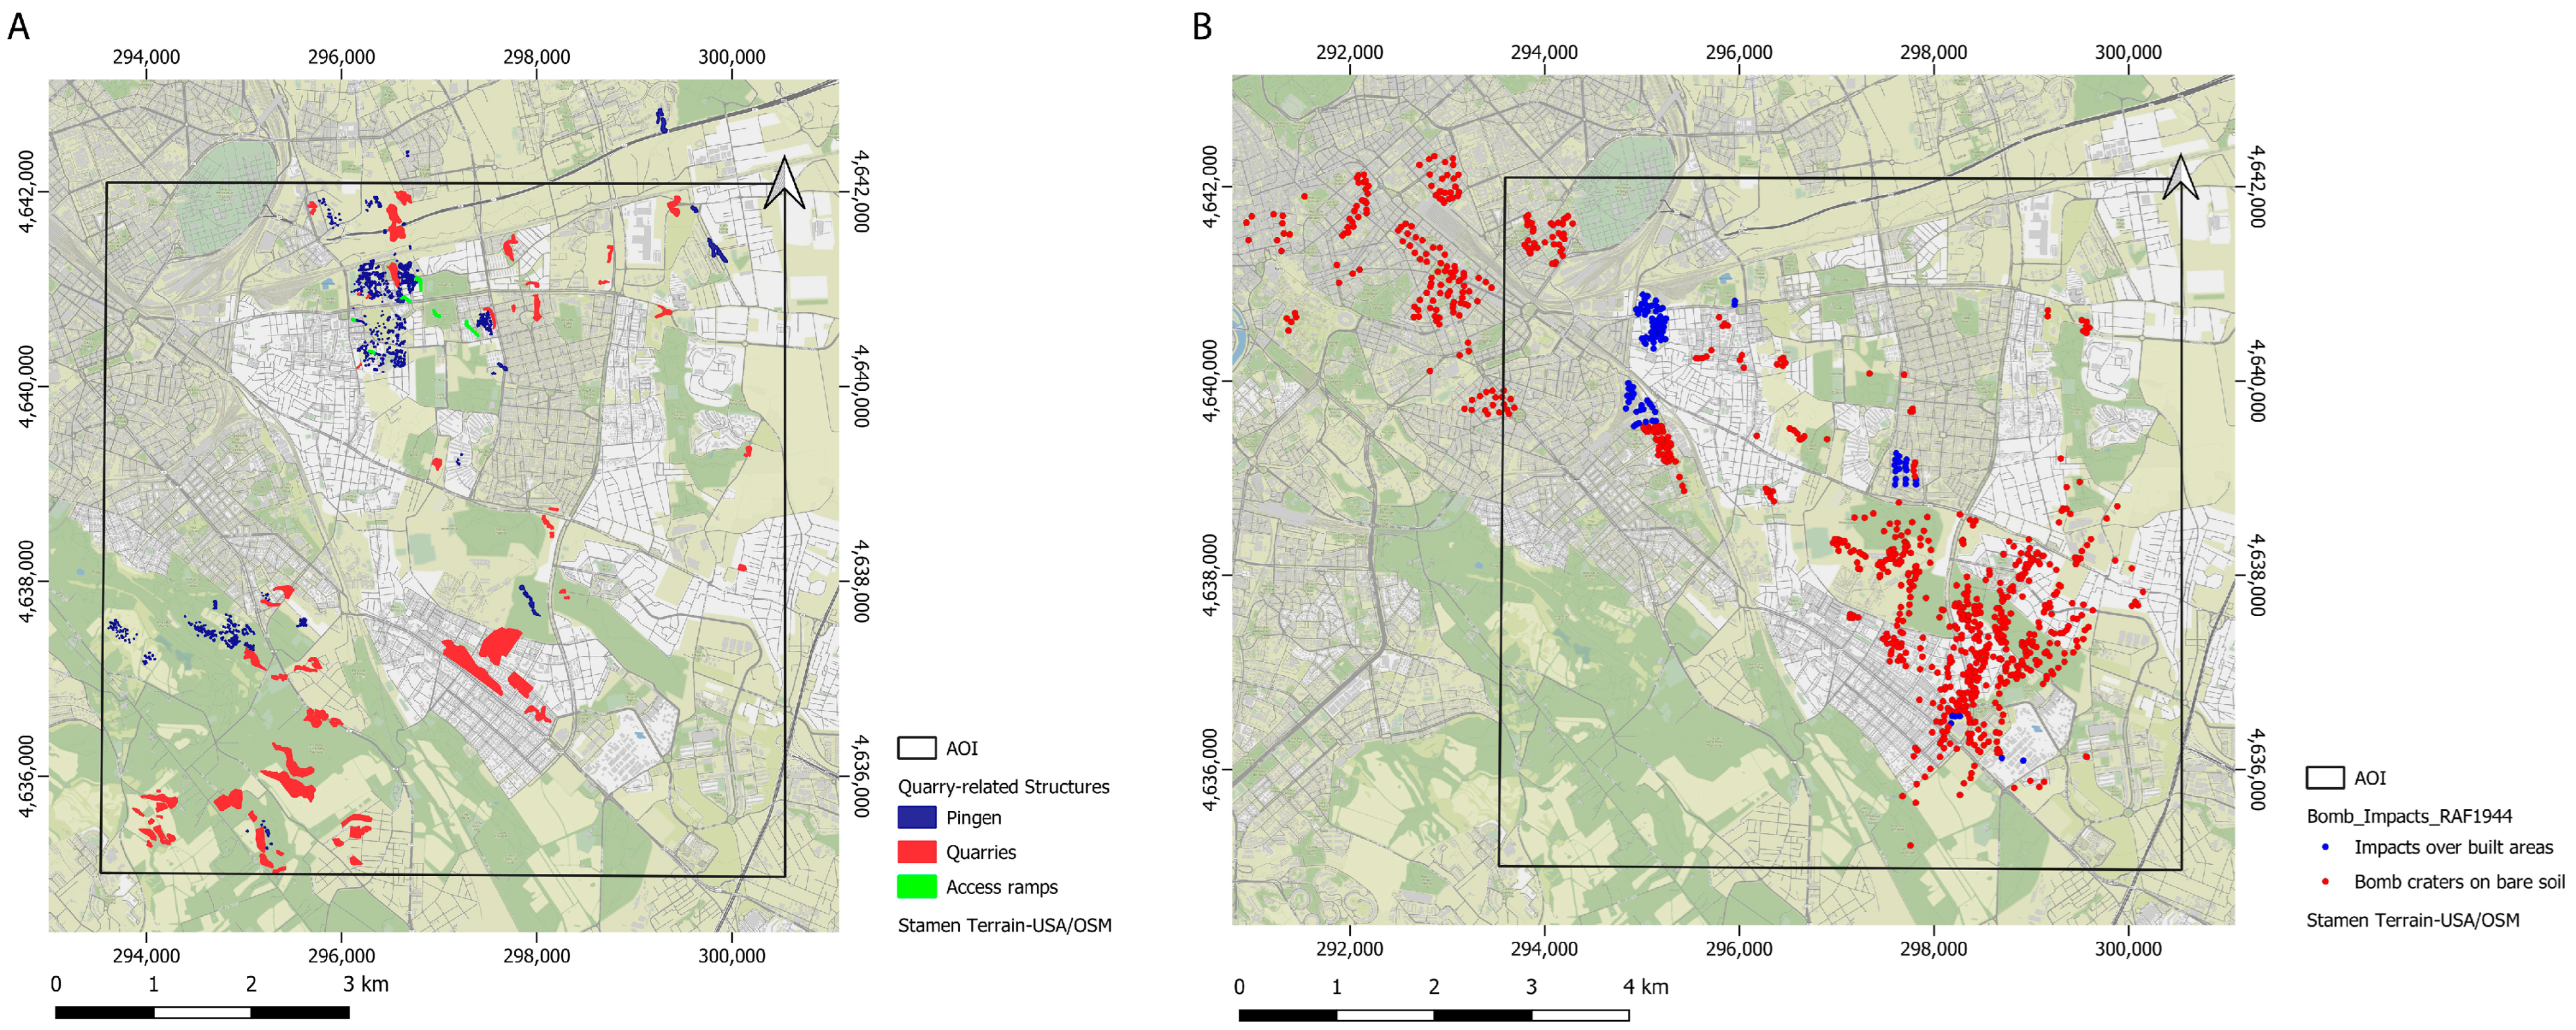
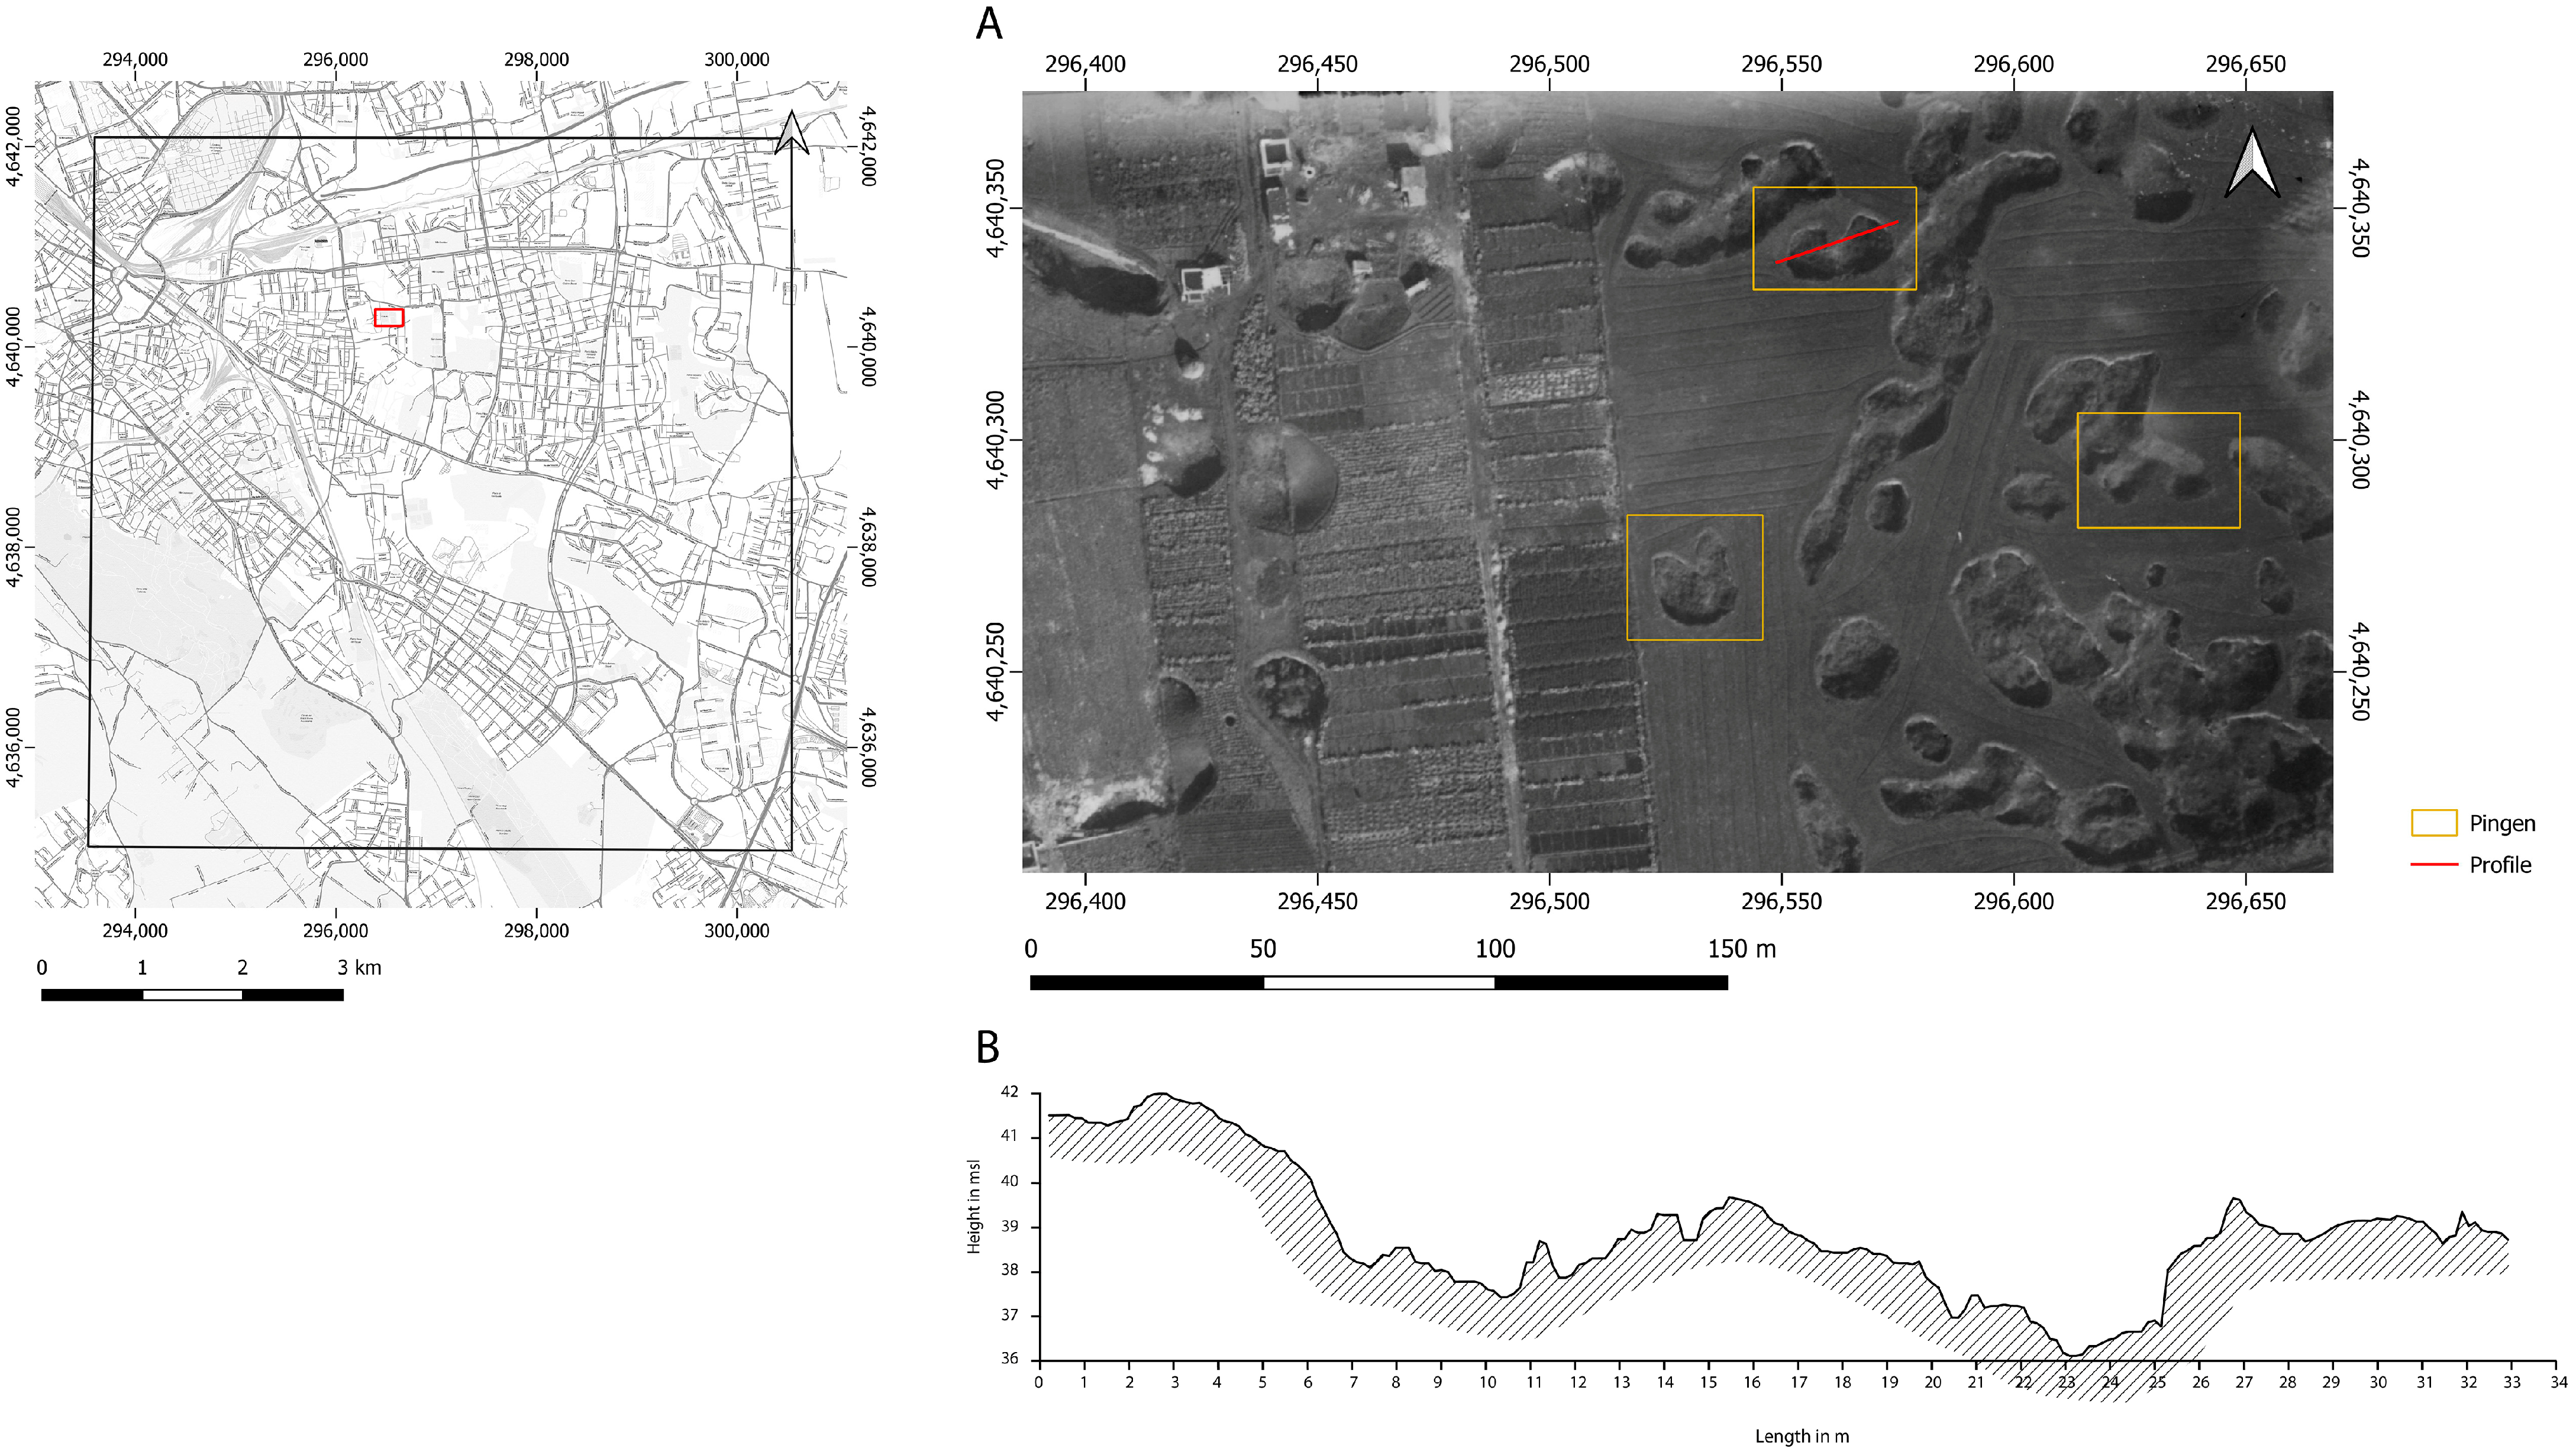
The extraction of orthophotos from historical photographs of the last century, belonging to the period between 1927 and 1953, was used for the vectorization of opencast quarries, trenches, terracing and sections of collapsed underground quarries (Figure 4A). This dataset allowed the visualization of the study area in the period preceding the urbanization, allowing a better understanding of the ground morphology when it was not jet wholly built up. Two-dimensional vectors were created by manually drawing all the quarry-related structures on a selection of orthorectified photographs (Figure 4A).
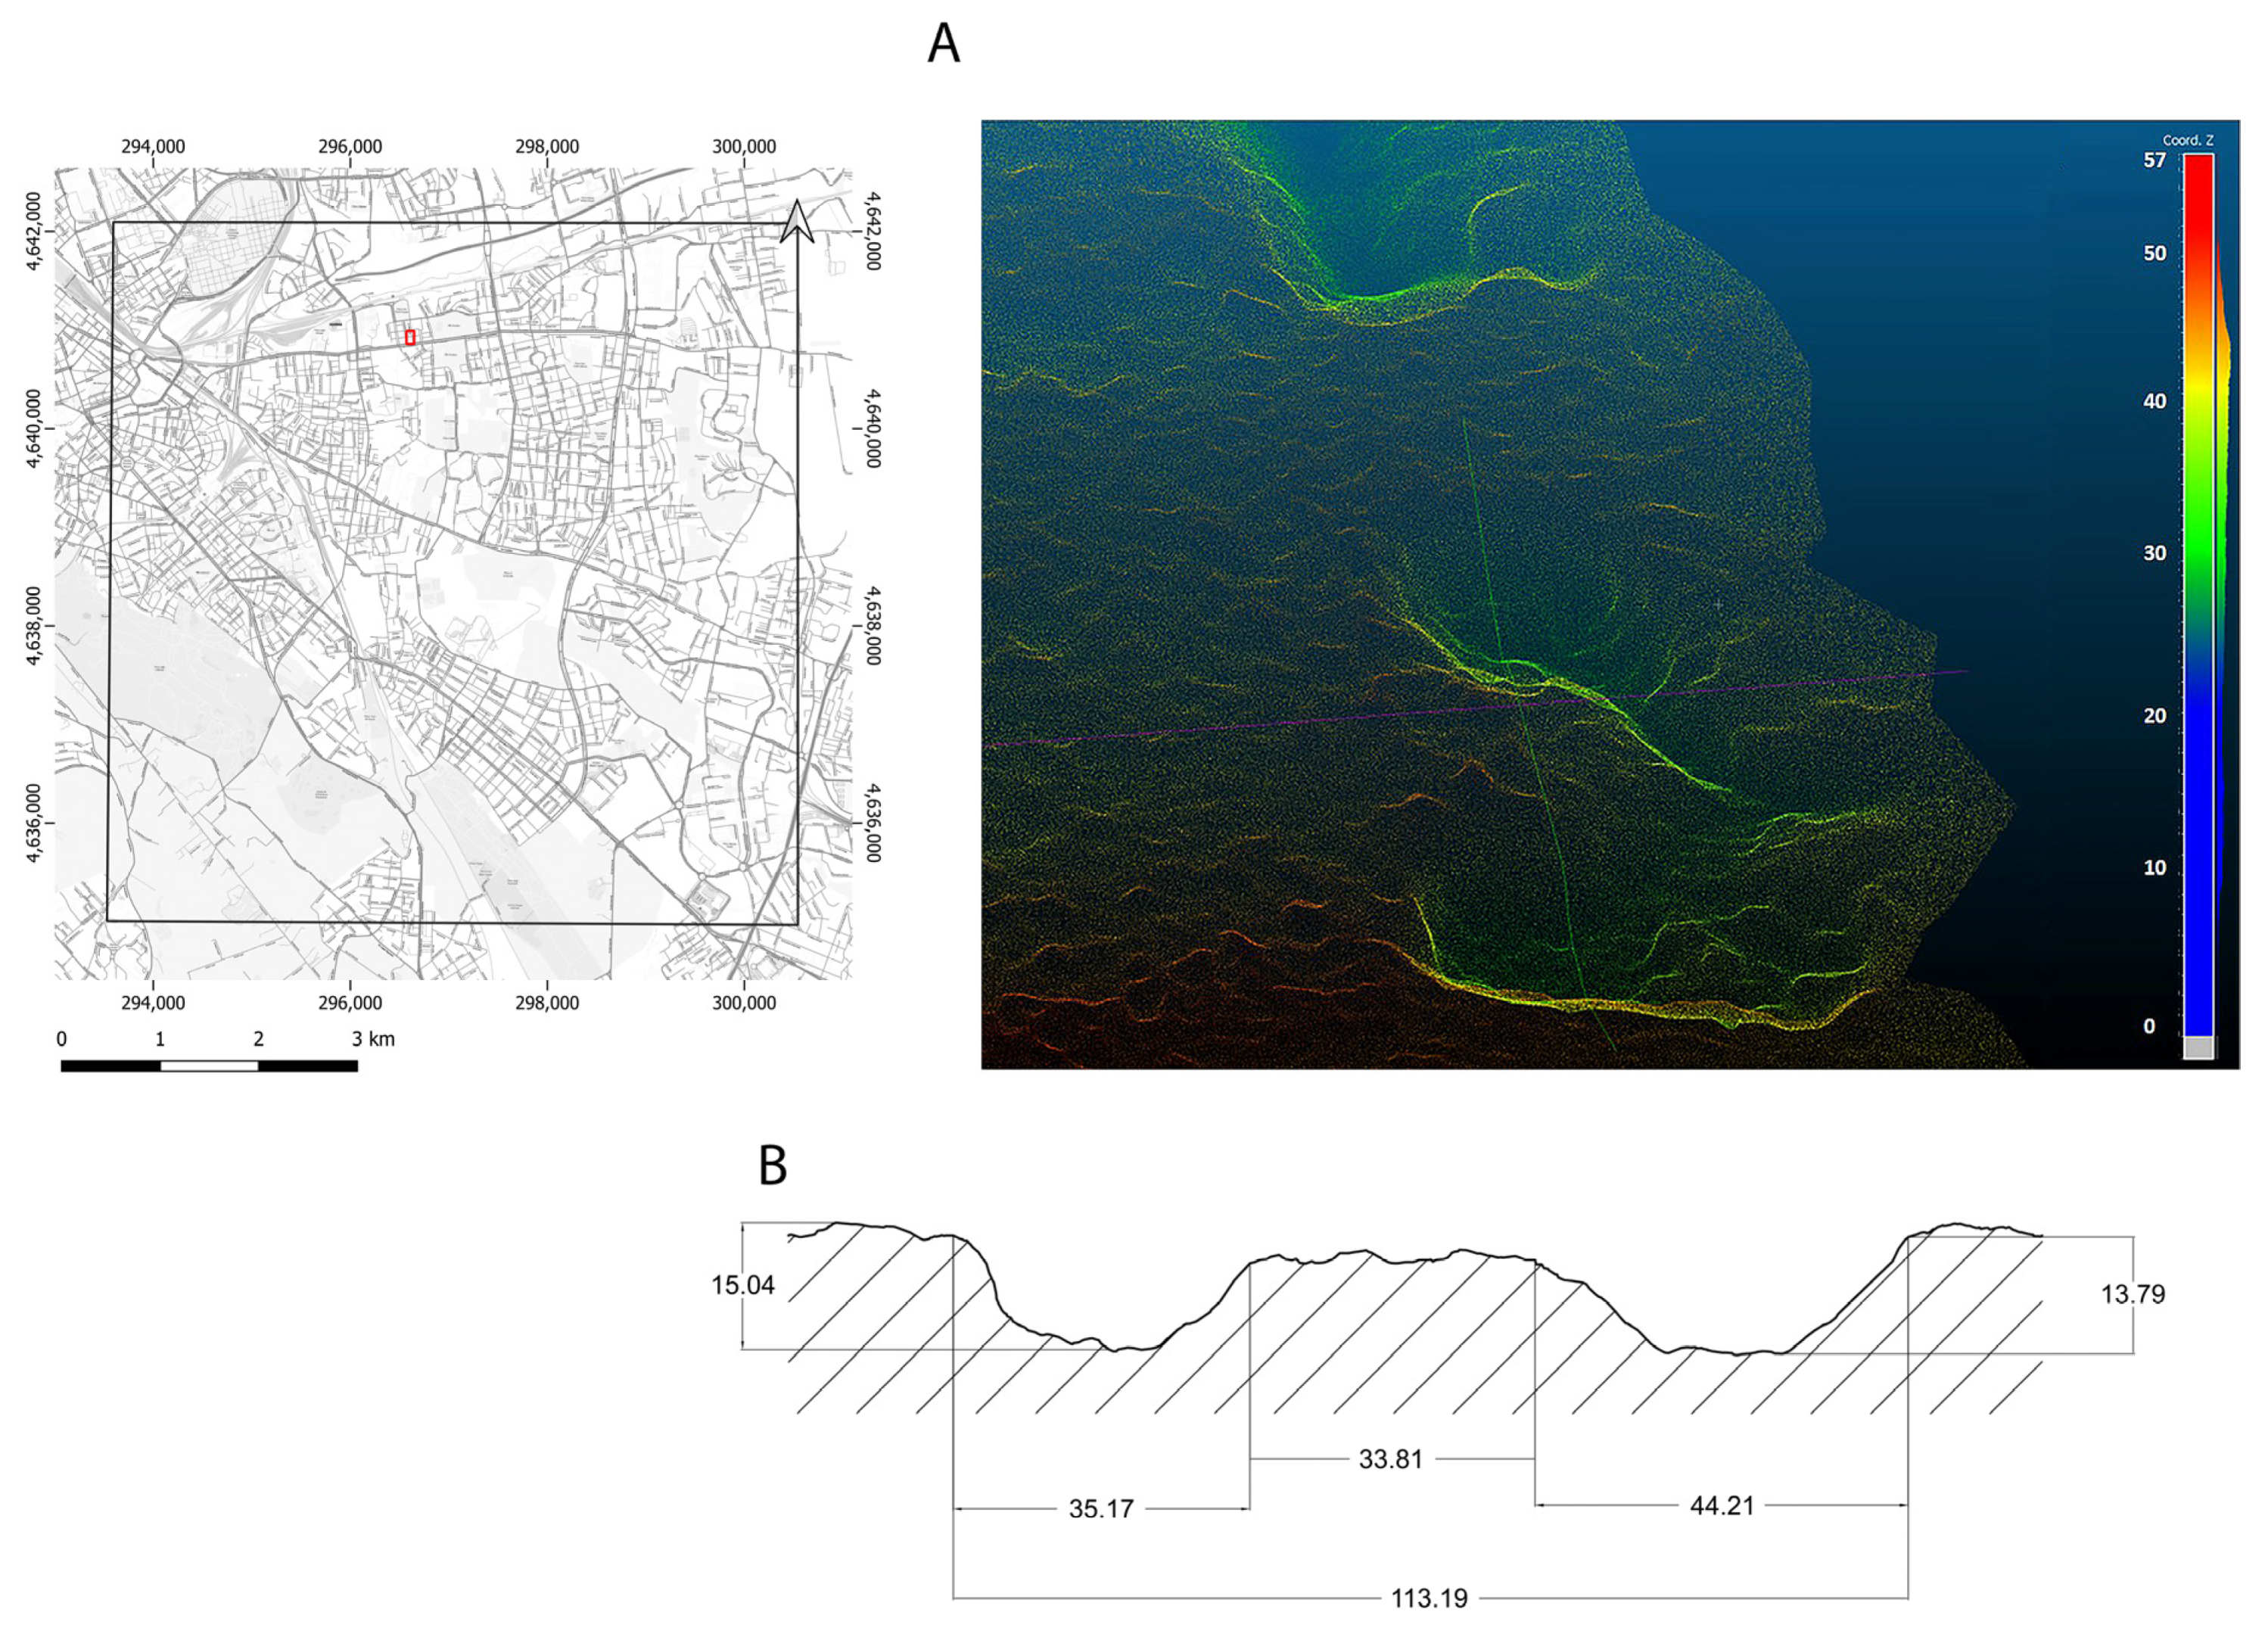
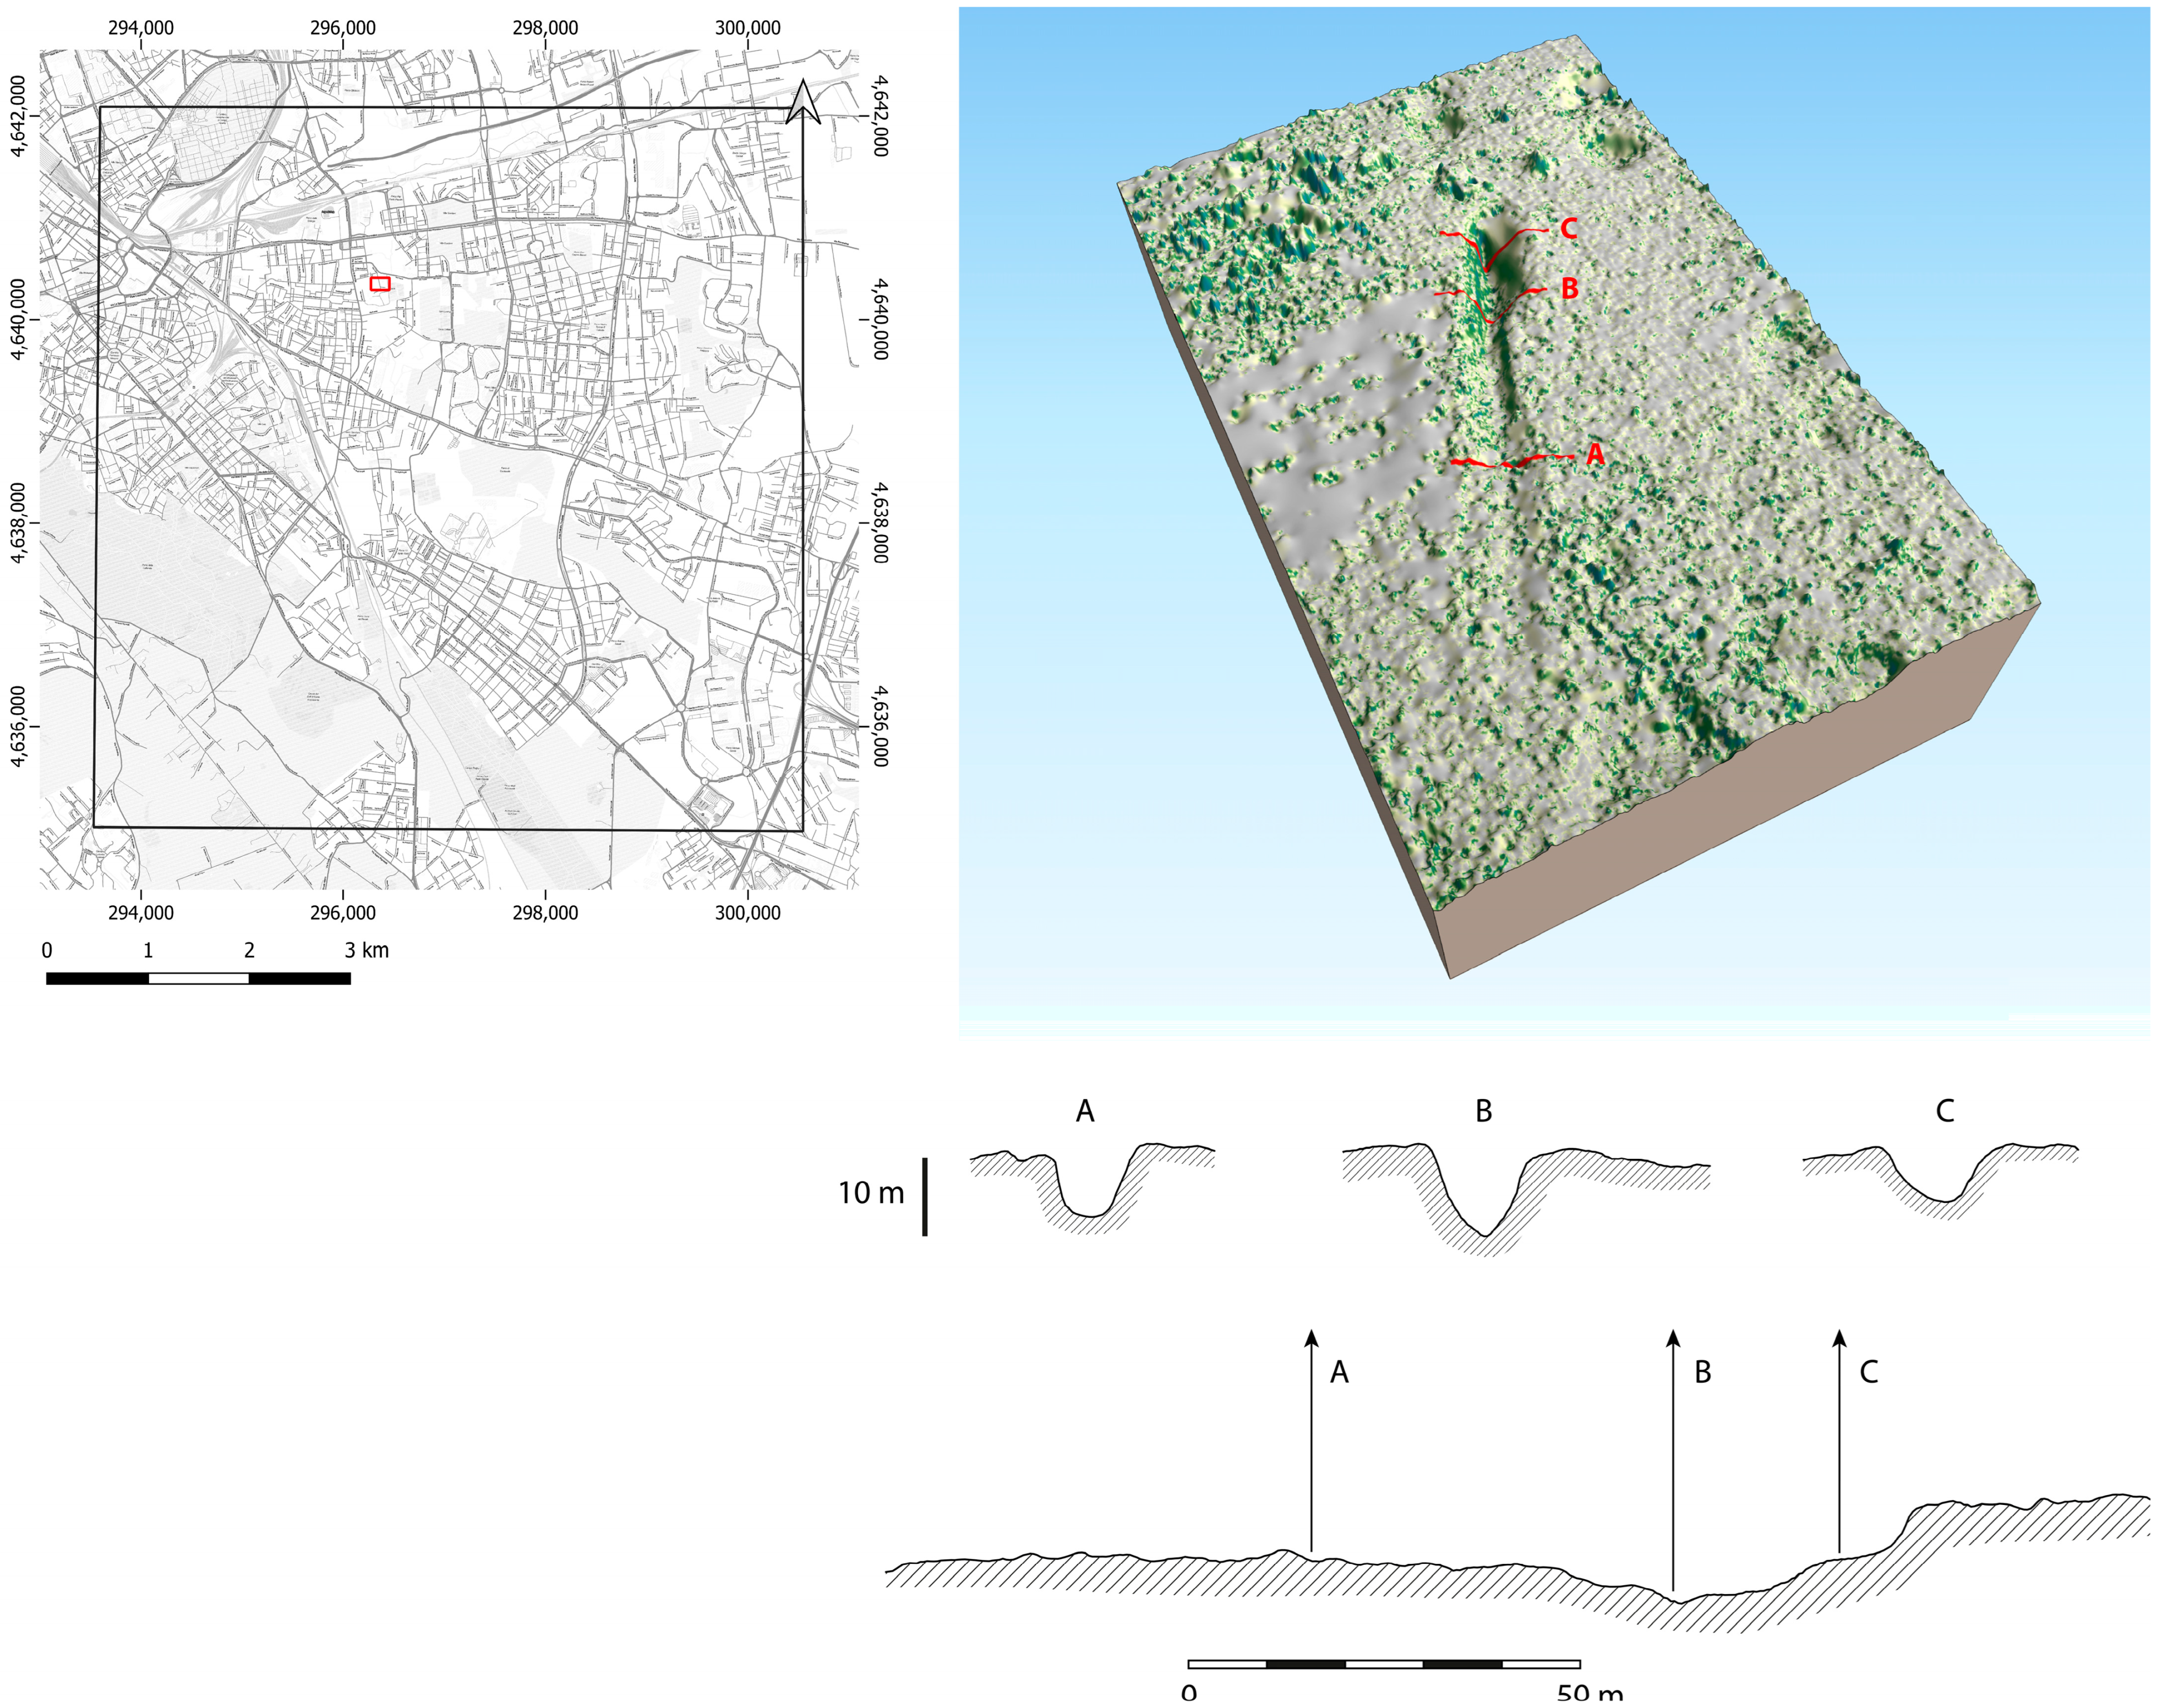
Furthermore, historical DSMs were studied with virtual surveys by taking advantage of the 3D View option in the QGIS suite, and the topography was highlighted employing profiles, both in QGIS, through the Terrain Profile Plugin and the Contour Lines tool, accessible from the Raster menu and in CloudCompare by using the Extract Sections function. Profile extraction on these historical DSMs (SARA_1927, RAF_1944 and AM_1953) permitted to evaluate size and type of exploitation of the local stone, the position of access ramps and also a characterization of the relative age of the sinkholes and the position of the pillars in the collapsed areas, as will be explained in the results in Section 3. The importance of this 3D feature extraction lies in the possibility of estimating the shape and relative depth of the exploited deposits. The dimension of exploitation and the use of infrastructures can be argued from the evaluation of the width of the trenches and the entrance ramps. Additionally, the underground structures can be indirectly studied from various morphologies of collapse, which are clearly noticeable in the 3D models as dense agglomeration in several zones of the AOI [48].
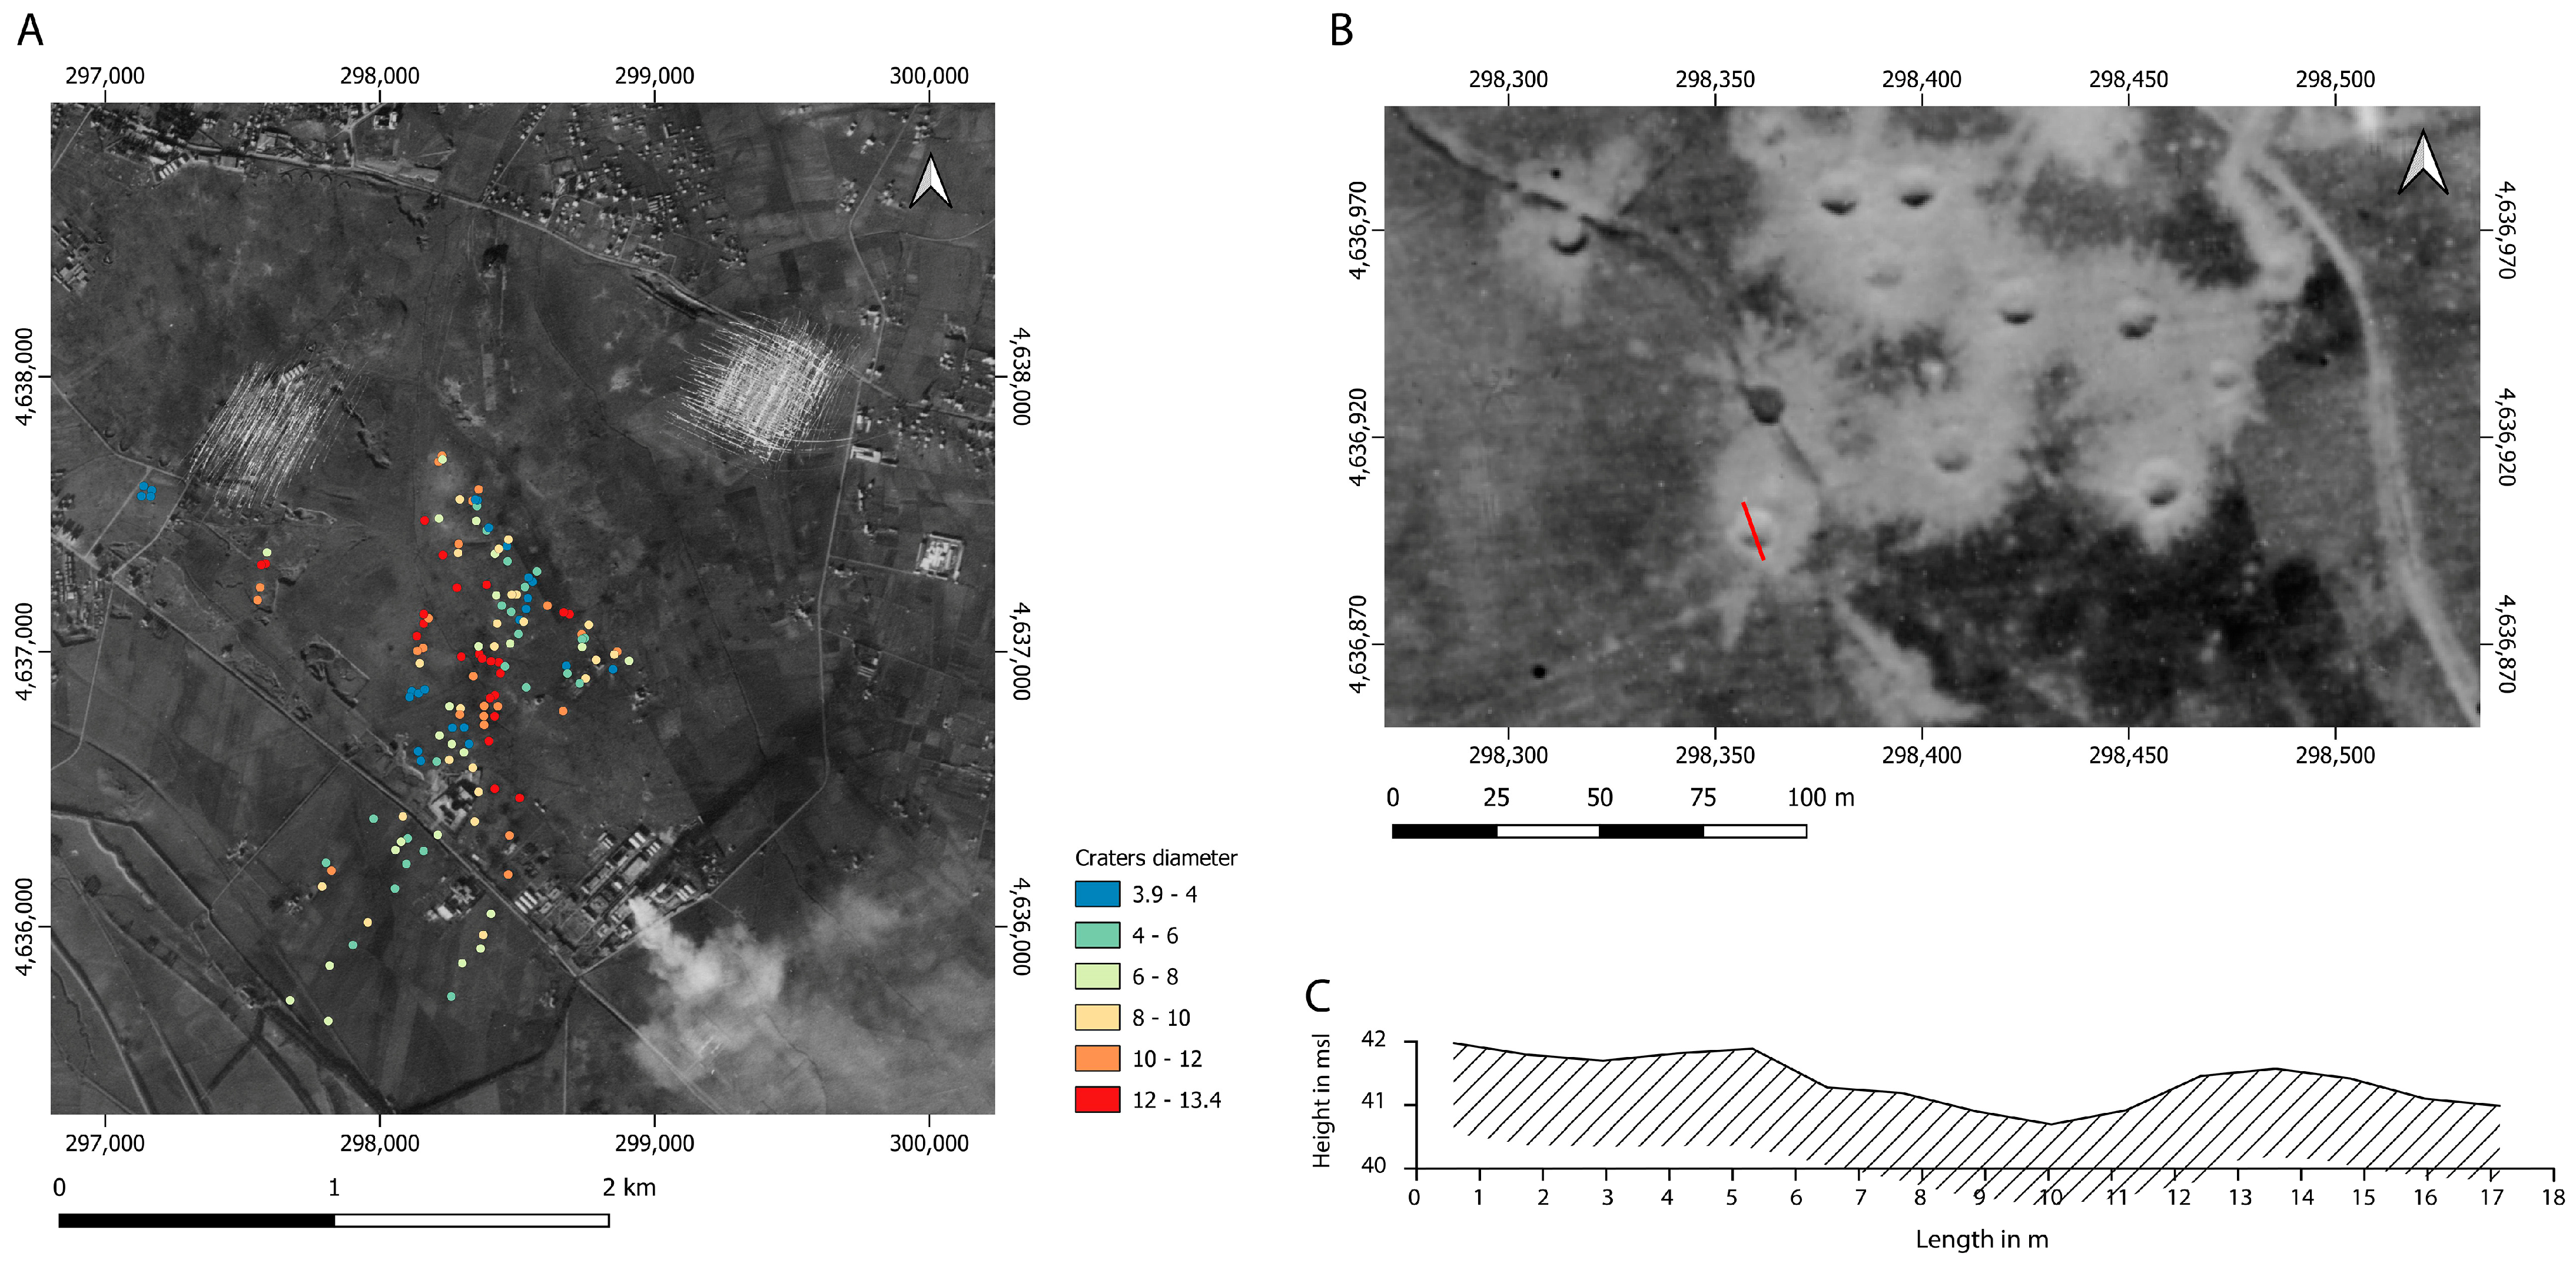
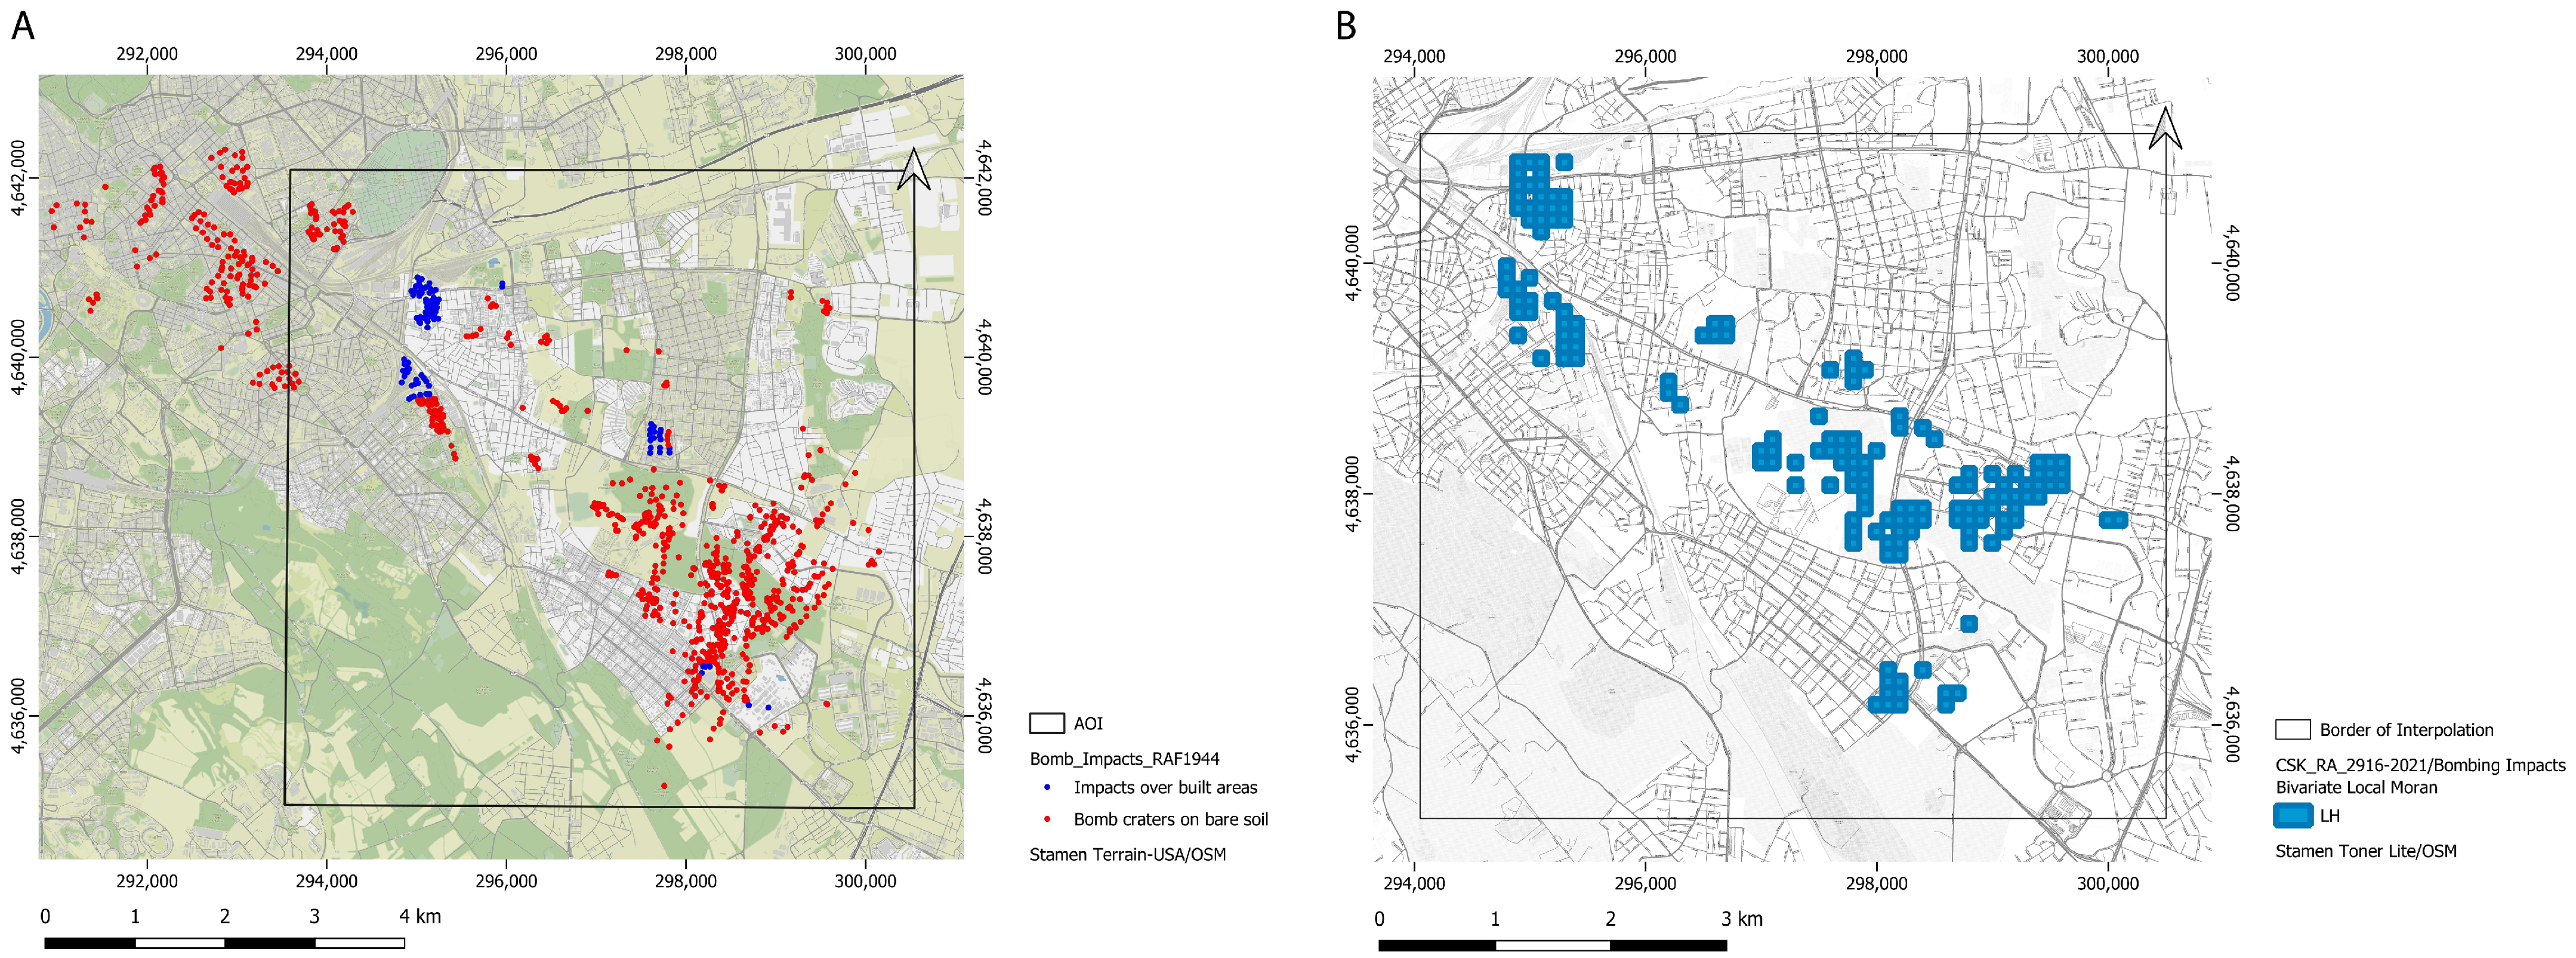
The orthophotos and mosaics also allowed for studying the spatial distribution of bombardments, permitting a dimensioning of the craters when the bomb hit the bare ground and left a clear, measurable trace. Otherwise, when the bomb hit inhabited areas, a photointerpretation of the damage on the buildings, visible in the photograph, was attempted. The recognition of the craters left on bare soil is straightforward, while identifying the impacts on inhabited areas is more complex and should be considered less accurate (Figure 4B). The vector layer dedicated to the vectorization of the two types of bomb impacts—craters and destroyed buildings—was produced from the photogrammetric products of RAF_44. A preliminary result of this vectorization was also briefly described in [48], grounding the further development reached here with the vectorization of both types of bomb impacts from a broader dataset of photographs, allowing the collection of data in areas that were previously not considered.
Given the operational onerousness of the crater vectorization phase, a method based on deep learning was integrated into this methodology for the automatic recognition of craters and will be the object of future development of the research, as it is currently in its setting phase. For this task, several experiments are presently running with one-stage object detection algorithms, such as RetinaNet and YOLOv3 [59,60,61,62], which are among the most widely used. RetinaNet is a unified network that utilizes a focal loss function to address class imbalance during training comprising an off-the-self Convolutional Neural Network (backbone) and two-stage cascade subnetworks. YOLOv3 (You Only Look Once, Version 3 [63]) proposes transforming the target detection task into a regression problem. It is composed of a single Convolutional Neural Network structure, the YOLO backbone, for the convolutional transformation of the image based on changing the step size of the convolutional core. Each algorithm is trained on an aerial bombardment image dataset and analyzes the performance of the two models to determine the best result in bomb recognition. In the following scientific outcomes, currently in preparation, the whole procedure, from data preprocessing to the final results, will be delineated. The method has already allowed validating the completeness of the manual localization of the traces left by explosive ordnances. Furthermore, the machine learning method will also enable the automatic distinction of the traces left by different types of bombs (explosive and incendiary ordnances).
Furthermore, the extraction of 3D models from the photographs by means of the described method also allows assessments related to the degree of penetration of the bombs into the ground. However, historical models can be noisier when dealing with small-size details than when analyzing large quarry-related morphologies. Both the open-source software for the point cloud processing CloudCompare and QGIS have been used for the extraction of multiple profiles.
The use of these photogrammetric products is limited to the temporal availability of the HAPs. With the aim to clearly individuate the most affected areas in the AOI, additional types of vectors have been designed to collect archival information.
Historical information related to bombing events was georeferenced into vector layers (points, lines and polygons). These vector archives (updated from preliminary results in [48] by the employment of additional sources) are built to provide evidence of the most affected areas, which also correspond to the AOI (in Figure 5A). The accuracy of their spatial positioning depends on the detail of the existing information gathered from historical sources [64,65,66,67,68,69,70,
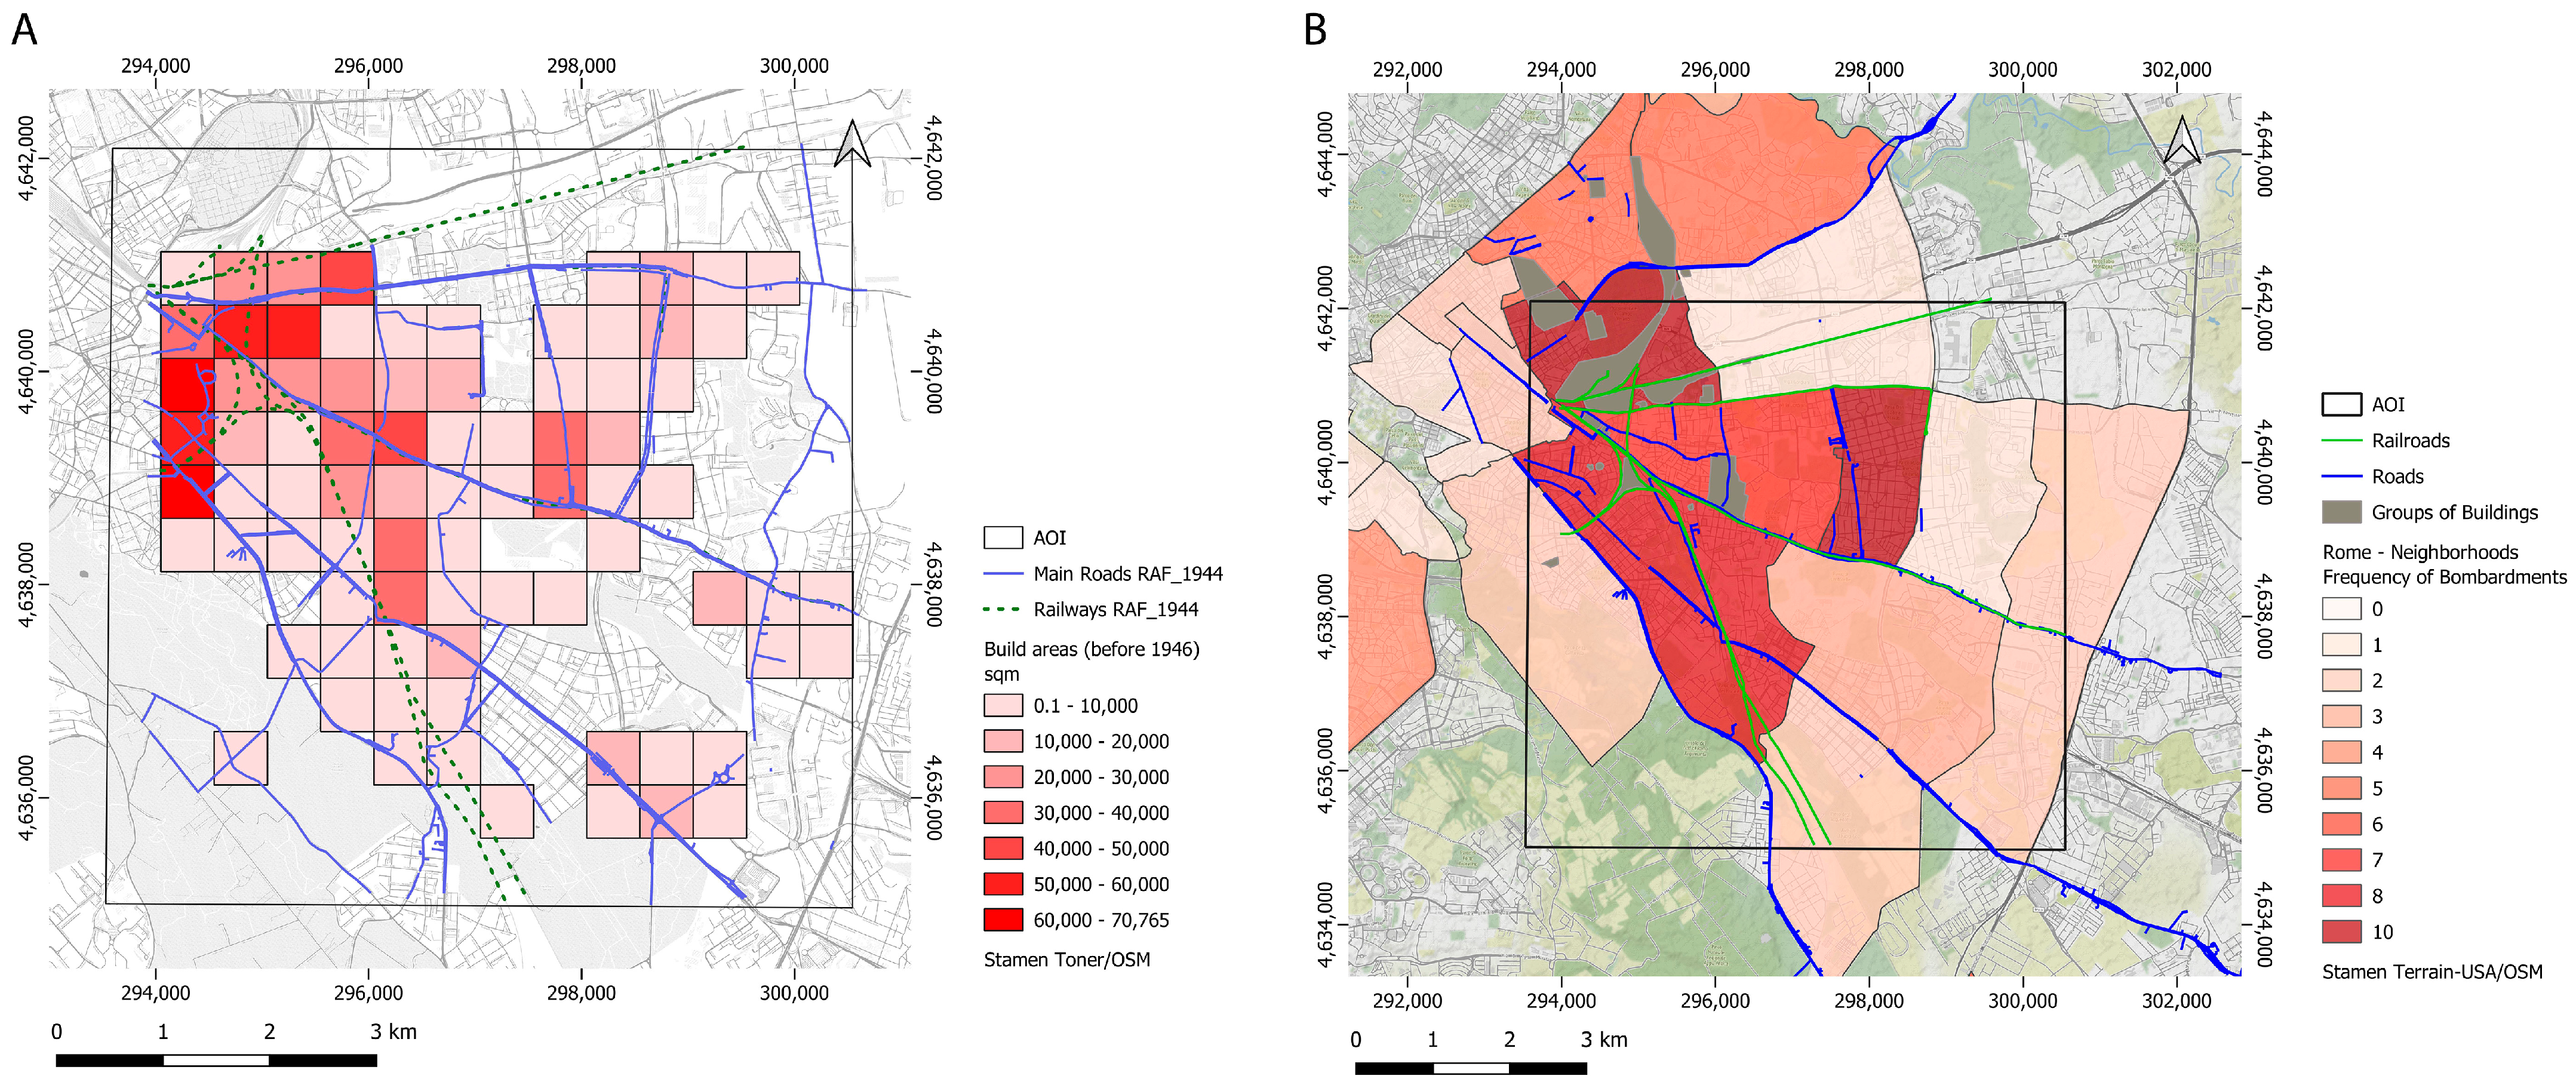
71]. Events on roads and railways have been collected in line vectors, while specifically mentioned neighborhoods are recorded as polygons. At last, a point vector has been used to gather heterogeneous information regarding areas and sub-zones of quarters. Finally, a dedicated polygon vector outlines several groups of buildings, which, due to their strategic function, are specifically mentioned in the sources as air raid aims (Figure 5B). These are mainly composed of railway junctions and stations, military barracks, a military airport, hospitals, and industrial areas. Residential areas were also heavily involved, such as entire suburbs, but also several historical buildings, such as churches and the monumental cemetery of the city, which are specifically mentioned in the sources as reference points. Once this preliminary work was accomplished, the frequency of bombing events for each district of Rome was also counted and reported in the attribute table of the polygon vector (Figure 5).
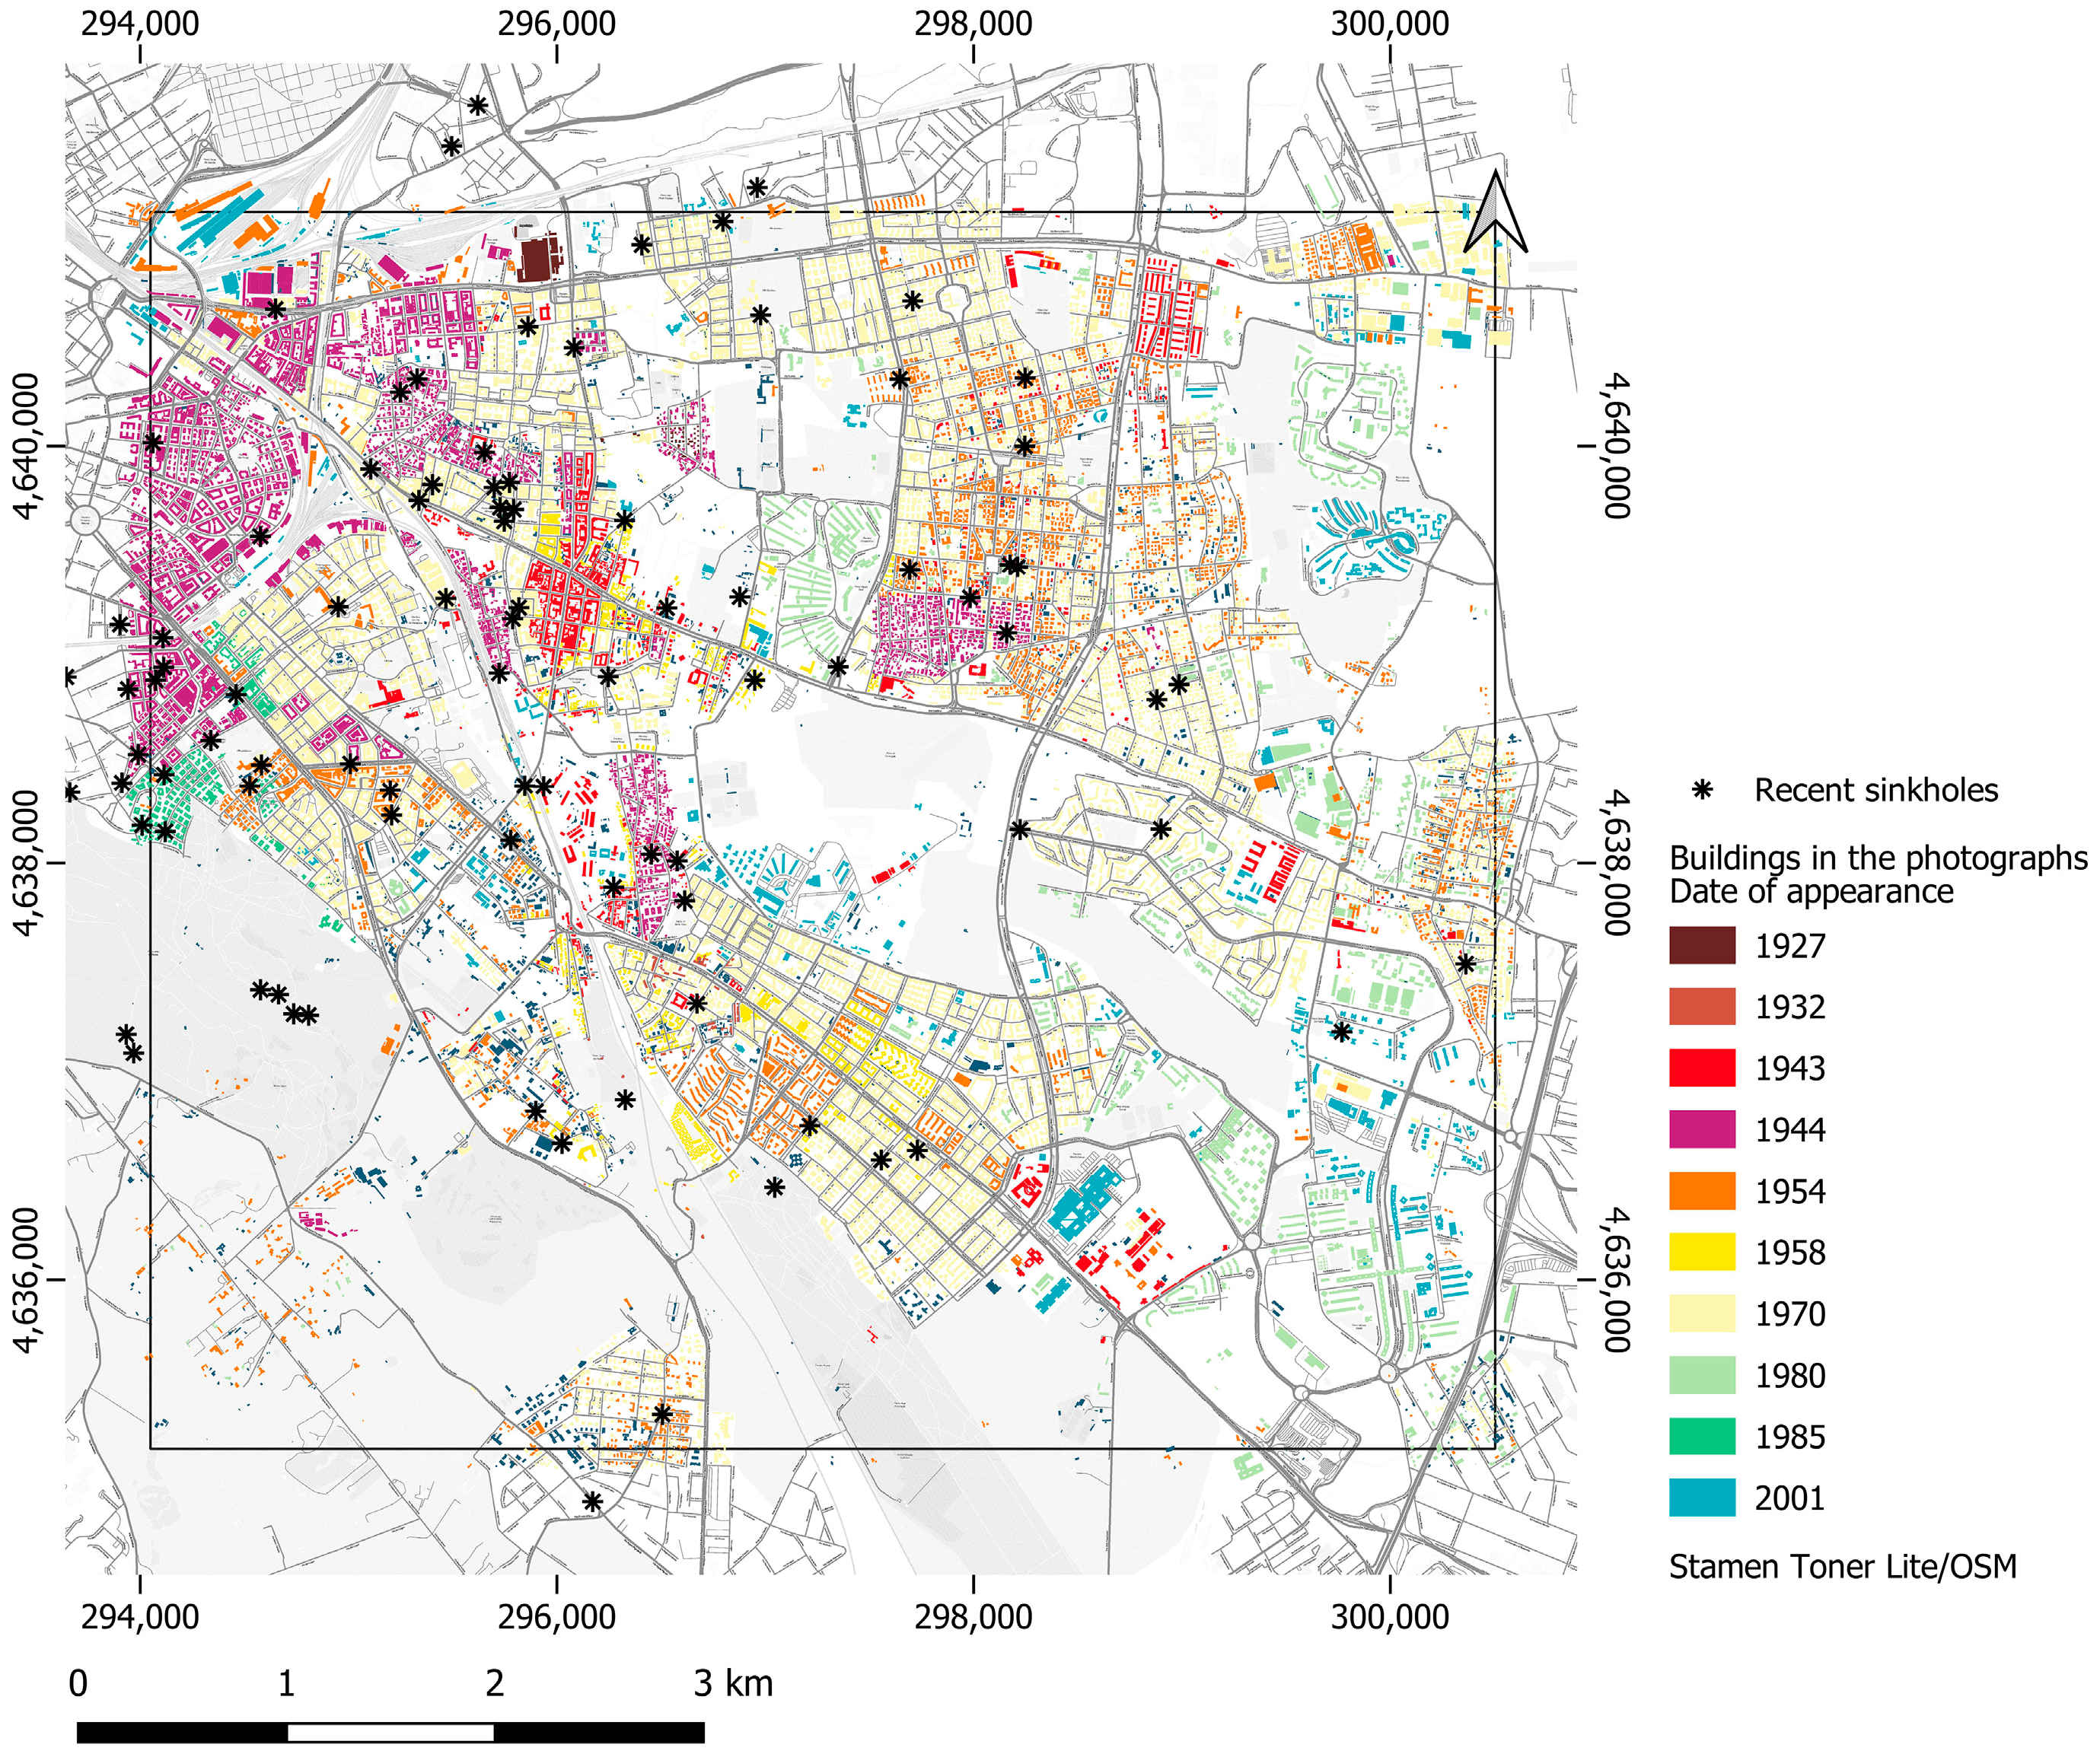
Furthermore, a classification of the buildings’ construction period in the area of interest (Figure 6) was performed to depict the urbanization development in the AOI, using the whole series of historical photographs, which cover the area in the period between 1927 and 1985. The previously described photomosaics were used for this purpose, but several other photographs were also georeferenced in QGIS, by means of the Georeferencer tool, for the years 1927, 1932, 1943, 1944, 1953, 1958, 1970, 1980, and 1985; and more recent optical data available on Google Earth Pro [74] were used. The operation has been conducted by visual inspection of the dataset to control in which photograph each residential area appeared first. The classification was mainly performed on the scale of the single building, “block by block”. Once the building was individuated, the period was recorded in the attribute table of the dedicated polygon vector [71]. These classifications have been made to show the directions of the urban growth and to understand which zones were already built in the historical period straddling WWII.
Additionally, a vector layer was dedicated to recording the more recent sinkholes and road raveling events that occurred in the area under study (in Figure 6, the black asterisks). This vector does not represent the total number of events, but it is a collection of the ones that are reported in the local news of Rome, mainly in the period between 2018 and 2022. The positions have been estimated from the address information attainable in the sources or deducing it from the related pictures or descriptions.
A detailed vectorization of the geological units in the AOI (Figure 2, from [51]) was conducted to furnish a fundamental base layer for the following geospatial analysis.
As a result of this preliminary phase of work, historical, urban and geological information is thus represented by orthorectified rasters and vectors, whose consultation and analysis were managed in a GIS environment.

2.4. SAR Velocity Maps

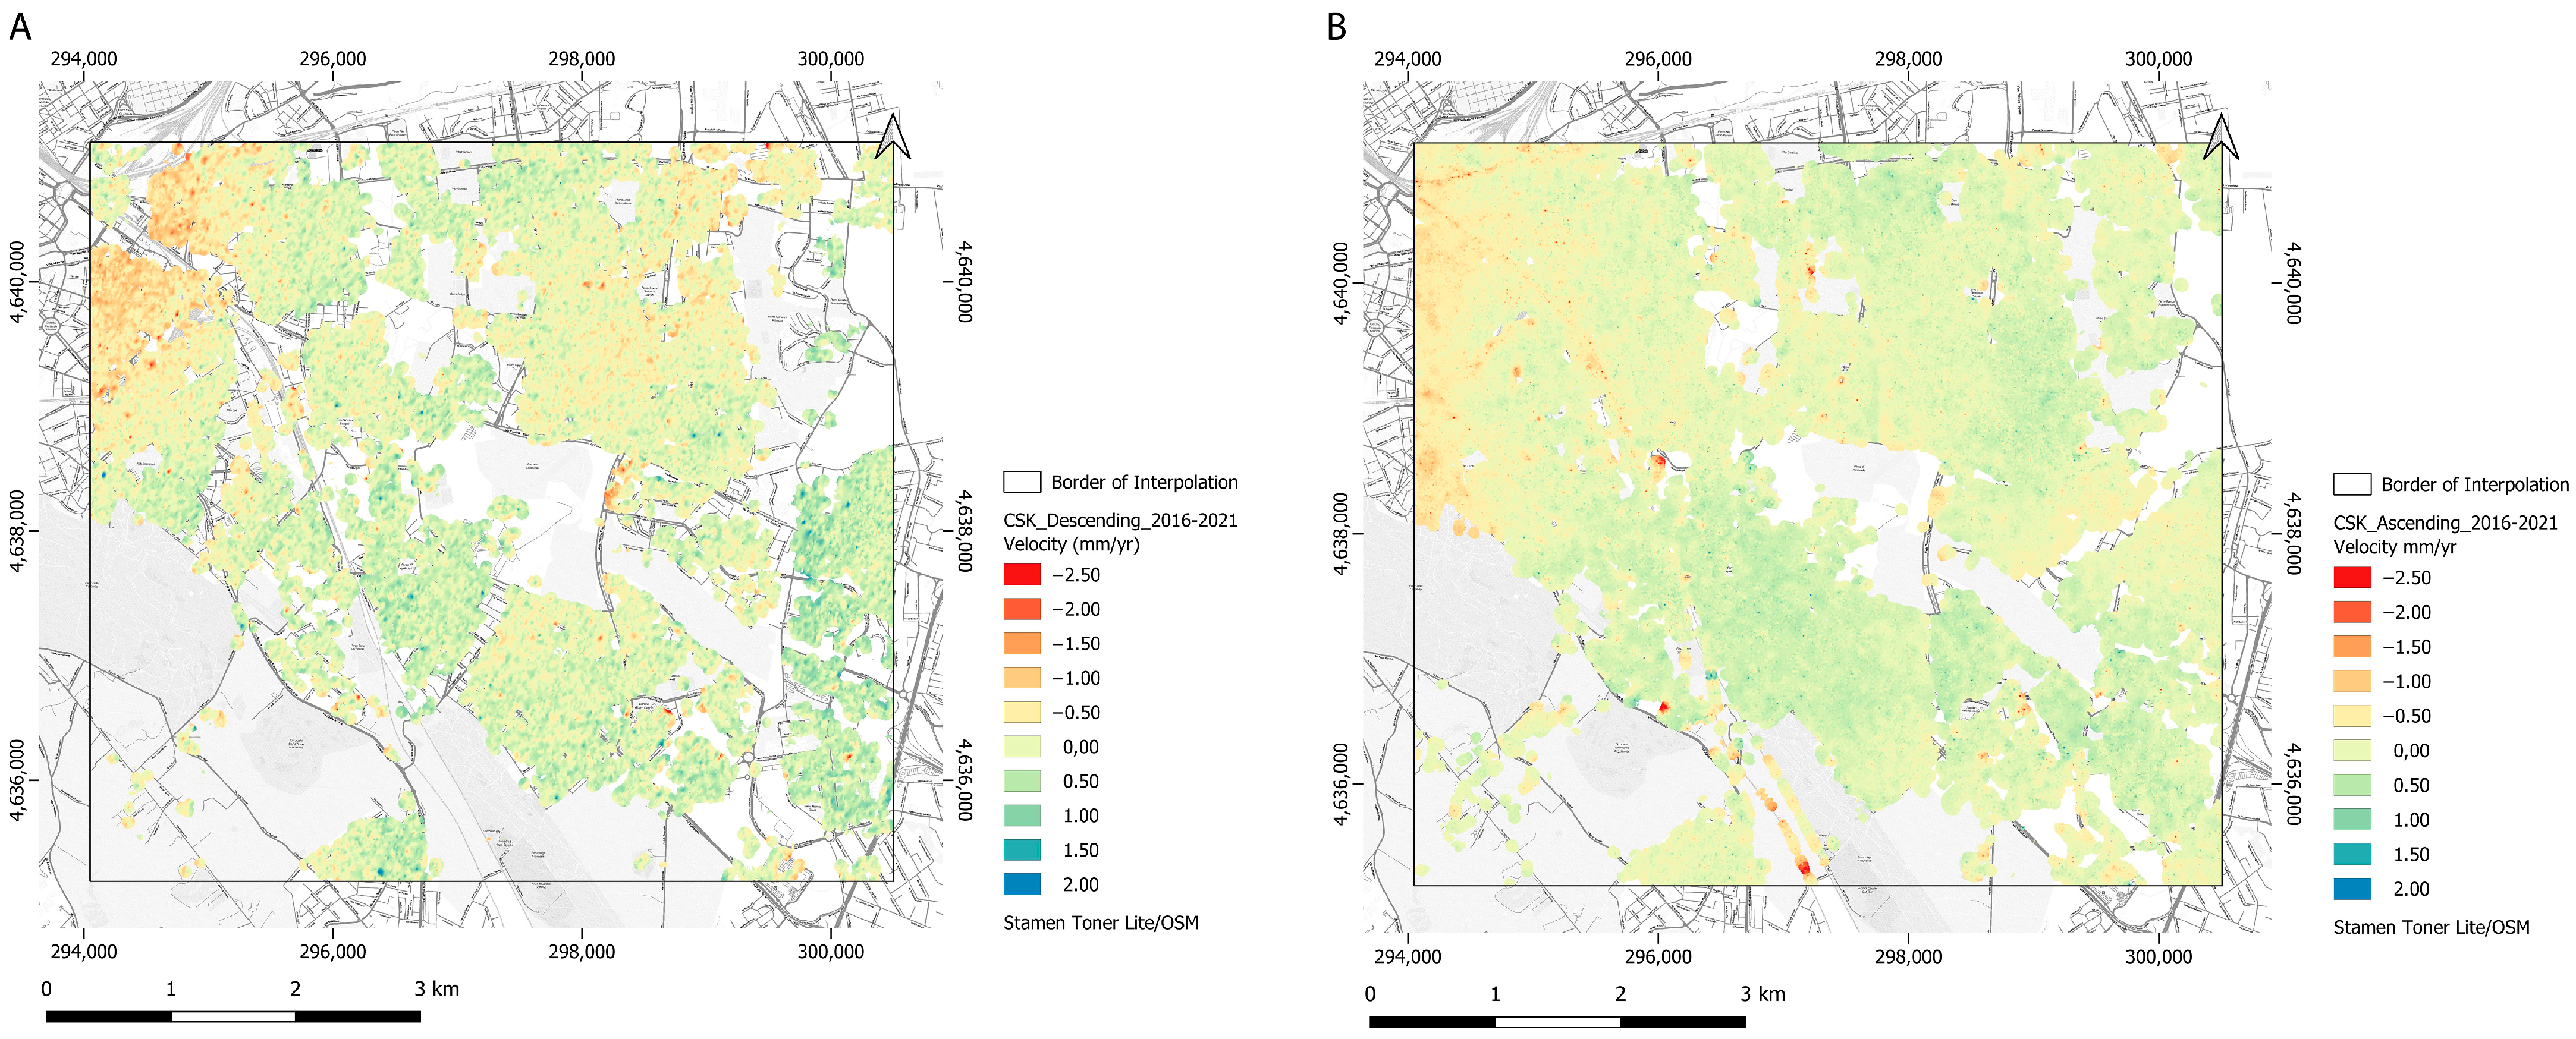
The PSInSAR technique was applied for the processing of two COSMO-SkyMed (CSK) datasets supplied by ASI (Agenzia Spaziale Italiana), to gather an overview of the displacements of structures and infrastructures in this urban area, especially focusing on the zones overlying the major quarry–structure density and with a simultaneous incidence of air-raid events. The image mode in use is the Stripmap HIMAGE, which has a geometric resolution of 3 × 3 m in Single Look Complex. CSK data in X-Band (9.6 GHz with a wavelength of 3.1 cm) have a radiometric resolution of 8 bit/pixel and a radiometric accuracy of 1 dB.
PSInSAR is a multi-temporal interferometric technique aimed at detecting ground deformation through the monitoring of radar targets (Permanent Scatterers—PSs) from a long temporal SAR dataset [75,76]. The permanent scatterers are elements already present on the ground, natural or man-made, which are characterized by a high phase stability and a coherent intensity of backscattered signal through time, non-affected by geometric and temporal decorrelation. Because of this, PSs are characterized by an average annual speed value (expressed in mm/year) measured along the satellite LOS (line of sight), which is suitable for the estimation of displacement.
The 16-day repeat cycle of CSK acquisitions allows the processing of long datasets with homogeneous geometric acquisition modes. Therefore, the population of Permanent Scatterers extracted from the CSK 2016–2021 time series (right ascending—RA, and right descending—RD) by using the Envi 5.3.1—SARScape 5.2.1 module [77] is fairly dense and homogeneously distributed.
The velocity values are then interpolated to extract displacement velocity maps. The setting of the interpolation [48] is briefly described in the fundamental steps. The estimation of PSs density is the first pivotal phase to carry on the interpolation with the best search radius (set at 50 m to consider a minimum of five neighboring points in the interpolation process) and raster cell size setting. Following this preliminary analysis, the automated interpolation phase was performed using the MUSA (Monitoring Built-Up Area From Satellite) Interpol suite, an ad hoc tool developed for monitoring built-up areas by means of PSs [78]. The tool automatically iterates the execution of an Inverse Distance Weighting (IDW) and ordinary kriging with three variograms by setting different parameters. The autofitting is performed ten times, and for each of these trials, fifty parameter iterations are automated, allowing an improvement of the models for experimental variograms. After a cross-validation of all models, the predictor that best represents the dataset is chosen.
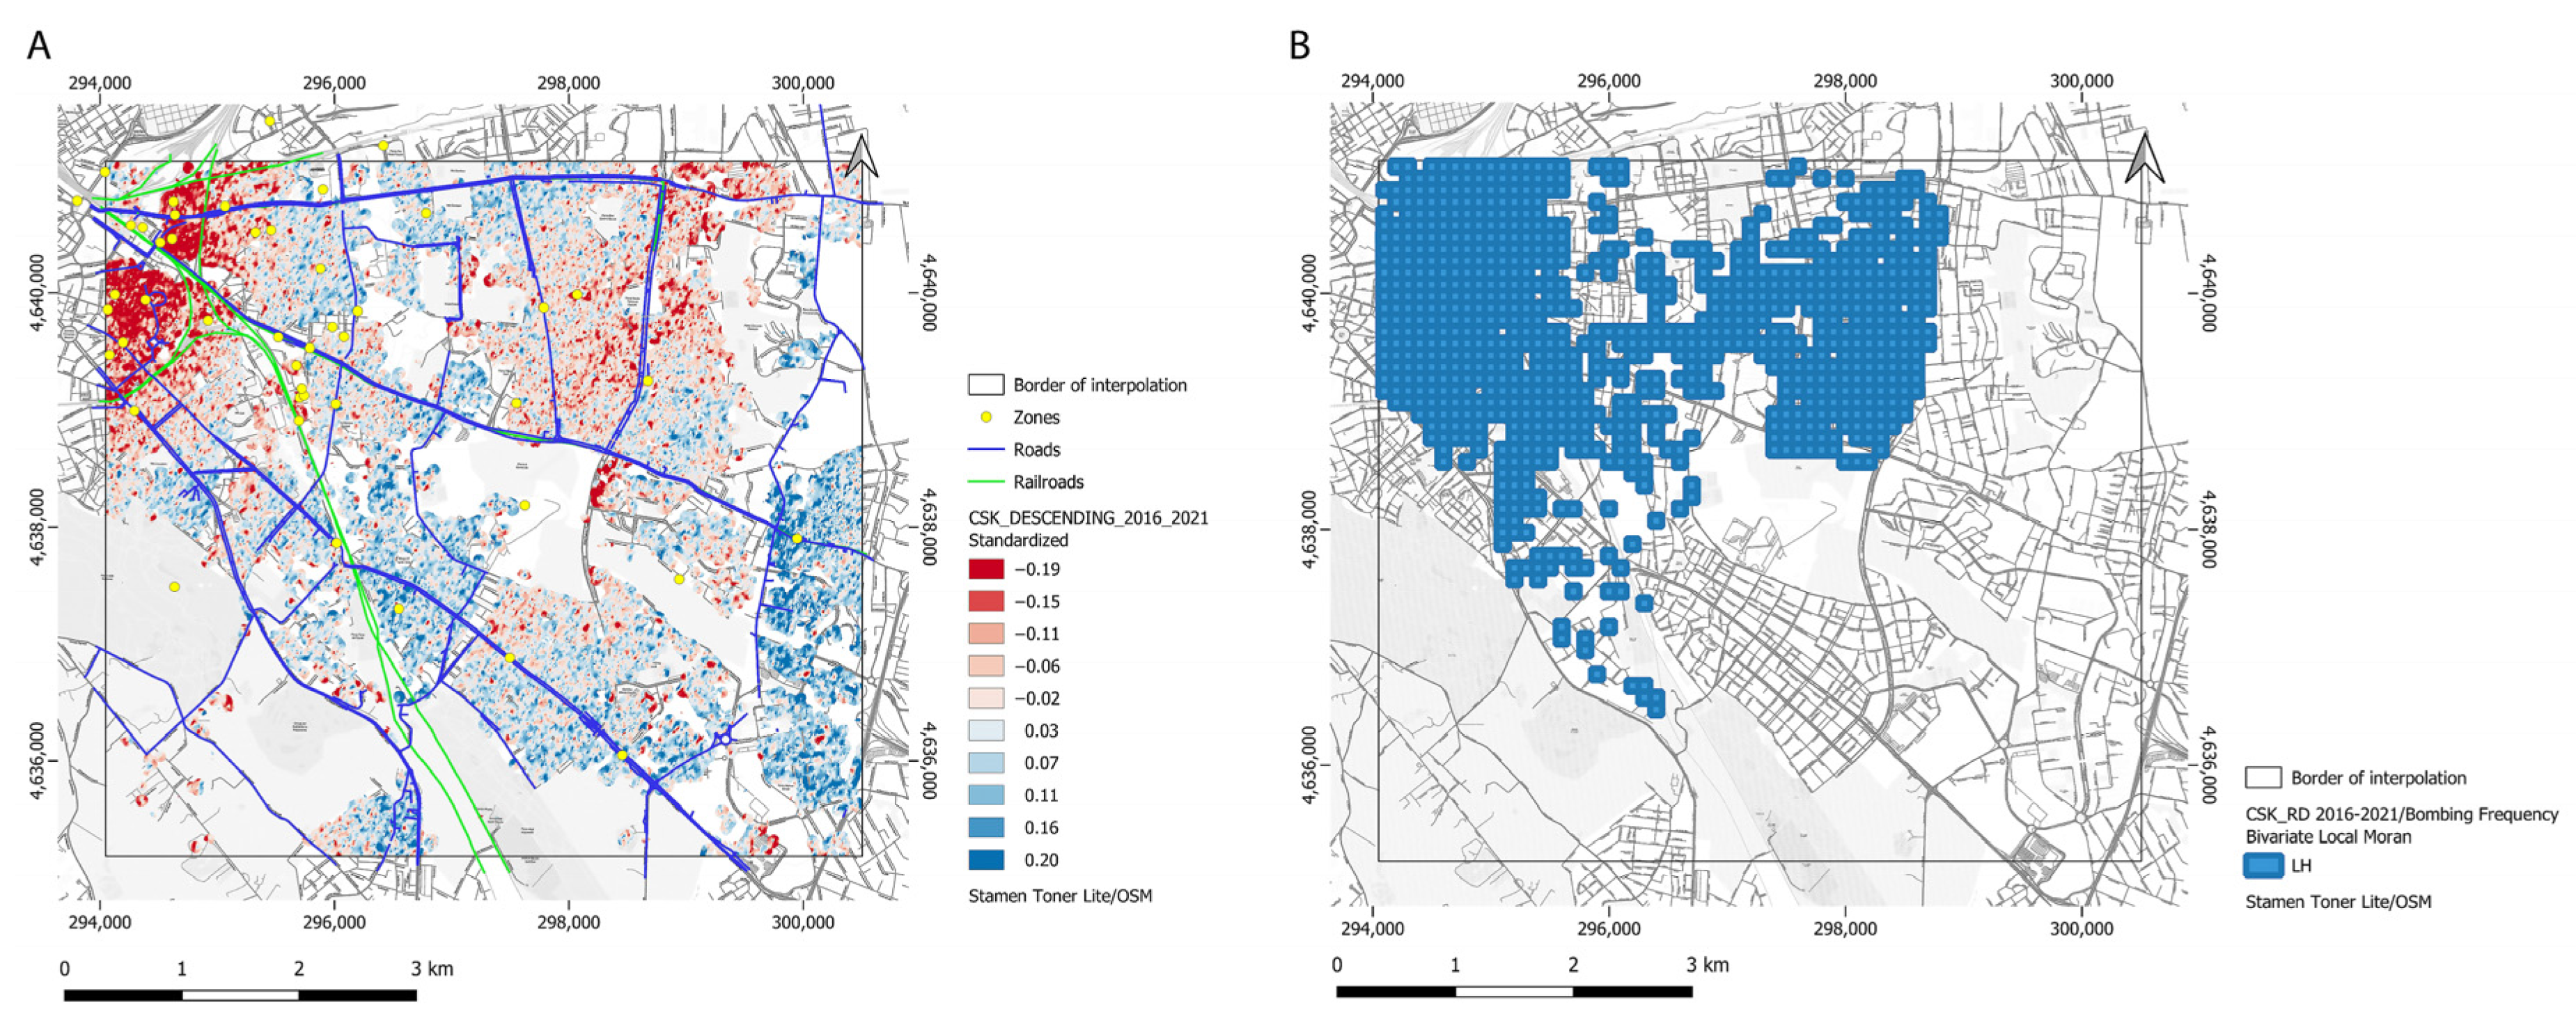
These two interpolated velocity maps are two pivotal layers (Figure 7) used to detect the existence of possibly correlated trends.

2.5. Geospatial Analysis

Given the complexity and diversity of the information considered, several geoprocessing tools available in QGIS have been applied to simplify the dataset by enhancing their spatial distribution and highlighting the correlation of the factors considered.
An approach was dedicated to evidencing incidences of historical pingen and opencast quarries in relation to their vicinity to geological units. The NNJoin (Nearest Neighbor Join) plugin in QGIS supported this estimation by joining the two shapefiles in a new vector, whose new field Distance helps enhance their nearest neighborhood relationship.
Besides this simple analysis, which does not require a preprocessing of the data, the following operations require a fishnet generation. This grid, created with the QGIS tool Create Grid, is a vector array of squared cells (grids of 100 × 100 and 500 × 500 m cells), which covers the entire area under study and whose attribute table can be used as an archive to convey numerical values describing the different data considered here, which are otherwise inhomogeneous in terms of typology, shape, and spatial distribution. These numerical values were calculated and automatically entered into the grid cells using several calculation functions: Zonal Statistics, Join Attributes by Location and Join Attribute by Nearest, Count Points in Polygon and the Field Calculator. The Zonal Statistic tool was fundamental to automatically calculate the mean values of the PS velocity. The Join Attributes by Location and By Nearest were successfully used to associate the value of frequency of the bombardment events to each cell of the fishnet. The same tool was employed to estimate the extension of the terrain portion of the AOI that was already built in the ‘40s, expressed in sqm. This calculation was achieved by joining the attribute tables of the fishnet and that of the selected edifices constructed till 1946, followed by the summing of the values of the field “Shapefiles Area” of e, grouping them cell by cell. The Count Points in Polygon tool allowed calculating density maps expeditiously, specifically by counting how many points (i.e., centroids of quarry-related structures or bomb craters) fall within the borders of each fishnet’s cell. Specifically, the Field Calculator allowed extracting the mean date of the buildings that fall in each cell, which was important for gathering information related to the urbanization. In this way, the fishnet collects all the numerical values associated with the factors under study, allowing a standardized analysis of the data. The fishnet was used to show trends of single factors, such as bombing events or the presence of quarry-related structures in the AOI, by creating density maps with graduated colors (which can be set in the fishnet Property—Layer Styling panel) in QGIS but especially for the geostatistical investigation that follows.
The preliminary evaluations of the spatial distribution significance were carried out by analyzing each numerical attribute considered with the QGIS toolset Hotspot Analysis [77], a spatial autocorrelation algorithm aimed at enhancing the adjacency relation through spatial weights. This is one of the LISA algorithms (Local Indicators of Spatial Association) available on the QGIS platform [79], which allows the study of the correlation of a single variable or two variables. The Hotspot Analysis—Local Moran’s I [80,81] makes use of locations and of a spatial weights matrix to indicate whether and how much the spatial distribution of the points deviates from a random distribution. This tool’s output is a shapefile where, in the attribute table, the q values (the standardized value of attributes z-score translated into the quadrant value of the Moran Scatterplot [79,80,81]) permit evaluating the significance that clusters have versus the null hypothesis of spatial randomness. This allows visualizing the clusters and outliers, grouping coherent distributions of values (i.e., subsidence values adjacent to subsidence values or contrariwise consistent positive uplift trends), expressed by the attributes LL (Low-Low or cold clusters), HH (High-High or hot clusters) and the group of outliers HL (High-Low) and LH (Low-High). The tool was applied at first to study the PS distributions in the two geometries [48] and to observe the significant clusters of every single factor considered here.
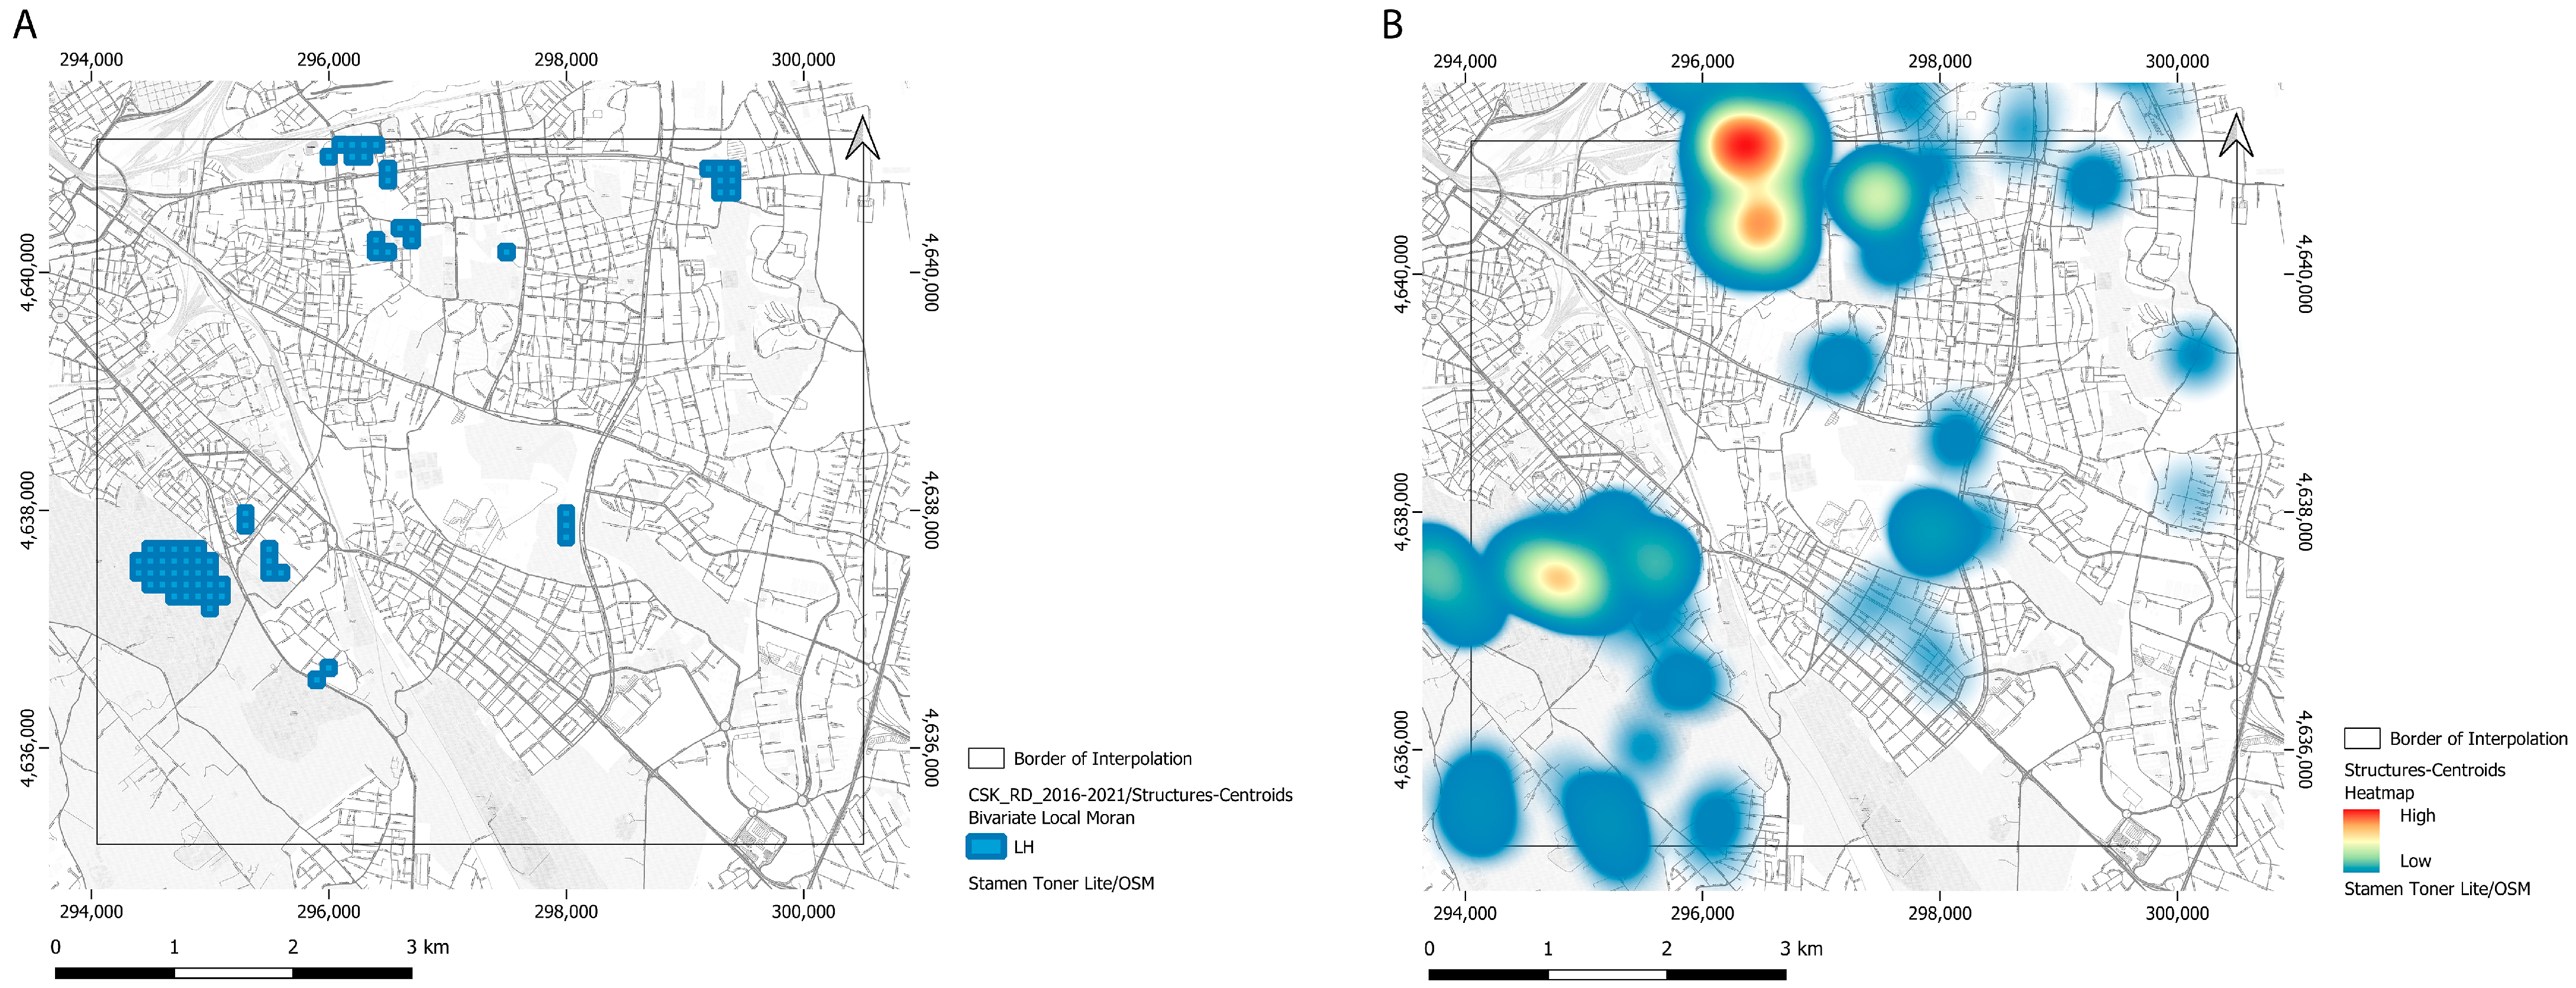
Furthermore, additional spatial analysis was performed to cross-validate correlations among two variables within the whole dataset of vector and raster data by using the bivariate autocorrelation function of the Hotspot Tool—Bivariate Local Moran [79].
This approach was carried out to consider the spatial distribution of interpolated velocity maps in relation to other factors, such as the bombing events and the quarry-related structures. For this purpose, the plugin individuates the spatial correlation between two numerical attributes, of which one is set as the base attribute, with respect to the distribution trends of the second variable based on numerical values and reciprocal positions. In this case study, the velocity values have been fed into the tool as the base attributes, to which the other datasets have been correspondingly compared. The velocity maps have been further processed with the Close Gaps tool in QGIS, to interpolate the No-Data areas and allow the calculation of the mean values in the fishnet.

3. Results

3.1. Spatial Analysis of the Vectored Historical Information and Photogrammetric Products

The historical information related to the bombing events that occurred in Rome during WWII, in 1943 and 1944, cataloged in vector shapefiles throughout the urban area, have been displayed on the frequency value to identify the high-incidence zones. The hotspot of this shapefile is a large area in the northwest corner (Figure 8B), coincident mainly with the neighborhoods that were already built-up at that time (Figure 8A, in red the areas with a higher ratio of built sqm/cell).
By comparing the traffic network map of 1944 (Figure 8A) and the more frequently bombed areas during air raids (Figure 8B), it is evidenced that the bombardment aims were mainly the civil and military targets in the northwest area that were, at that time, already densely developed (Figure 8A). On the counterpart, this very early presence of urban texture limits the identification of structures related to quarries from HAPs in this area (as shown in the distributions in Figure 4A and Figure 6).
At any rate, considering the studies in the literature, the presence of ancient hypogeal environments in these already urbanized areas is also documented [18,22,23,24,25]. An overlapping combination of these layers allowed identifying corresponding hotspots. Furthermore, it was possible to manually localize and size the impact craters (Figure 9) recognized in the historical photographs after the steps of orthorectification and 3D model extraction. The relative depth varies from one meter to more than two, and the diameters are usually in the size range of 4 to 13 m, relatable to the weight of the bombs, their impact angle, and the type of backfill soil. These values were compared with the results in recent literature [82] to estimate the type of ordnance, which is classified between the weights of 250 and 500 kg, also considering the modifications that occur after erosion.
The cavities are sometimes a few meters from the walking surface [37]; therefore, the bombing events are considered as possible factors in the weakening of the underlying or surrounding underground structures, which can continue to develop with the increase in local urban pressure (traffic intensification and widening of the built-up zones).
With regard to the structures relatable to opencast quarries and pingen, the HAPs have allowed hypothesizing the type of exploitation. The broad opencast and terraced quarries are easily identifiable in large polygonal depressions delimited by abrupt escarpments. Contrariwise, pingen have typically smaller dimensions and are located in dense, closely spaced areas, often heart-shaped or horn-shaped (Figure 10).
This peculiar shape is due to a swollen area in the center of the semi-circular pingen, which allows locating the position of a pillar or the chamber supporting walls. Furthermore, from the degree of flattening of the depression, it is possible to distinguish between more recent and older structures caused by partial reburial and weathering. The distinction between opencast quarries and pingen is also permitted by the identification of the quarry front, as opposed to the access area, which is never present in the pingen, which are instead more or less regular depressions in which the sides slope down towards a central area. By extracting profiles from the DSM SARA_1927, it is also possible to evaluate the relative depth of the pingen and to localize the caved-in pillar or wall. In the 3D profile of the structures, this central swollen area can be measured (Figure 10B), helping characterize the type and size of underground structures. The extraction of multiple profiles in vector form was performed in CloudCompare to produce digital renderings (Figure 11). Operations of feature enhancements can also be accomplished by means of the open-source software GigaMesh [83].
From the photogrammetric outputs shown here, these structures are interpreted as vestiges of the exploitation technique named “chambers and pillars”, where a dense network of galleries connected areas of exploitation. This method can be applied to identifying access ramps that allow estimating additional exploitation features [28]. These structures were originally built diagonally to reach the level of the targeted lithotypes. If the geological units were relatively superficial, the ramps were the most effective infrastructures to access them successfully; otherwise, in the case of deeper deposits, the opening of pits was more economical. From the relative roughly estimated depth of the access ramps to the surface, due to the contribution of the backfill soil thickening, it is possible to estimate the position of the exploitation aim in the geological stratigraphy. From their width, it is possible to consider the use of wheeled vehicles for the transportation of materials and, from this, to estimate the scale of the exploitation. Figure 12 shows such a sizeable structure that reached a relative depth of more than 10 m from the surface.
Collapsed traits of galleries are distinguishable from the overmentioned access ramps or opencast trenches because of their typical elongated-pingen shapes.
Following this vectorization phase, it was possible to evidence the incidences of exploitation traces in the geological map to highlight a preferentiality of types of structures in specific lithotypes. From a statistical evaluation, the main targets of the exploitation in this area are the volcanic rocks, while the alluvial deposits do not show clear evidence of exploitation (Figure 13A,B,D). Even though the geological map represents the most superficial lithotypes, while the subterranean exploitation can be aimed at lower layers, the distribution and relative distance of the units support additional interpretations, as follows.
Furthermore, a statistical analysis has been dedicated to the study of the relationships between types of quarry-related structures and types of volcanic rocks. The geological map in the areas surrounding dense pingen fields in the western area of the AOI shows a complex alternation at a short distance from recent (VSN1 and VSN2) and older (RED and PNR) layers. The pingen fields are present mainly on the RED-PNR unit (whose geotechnical description in [28] defines them as less coherent) or in their close vicinity (Figure 13A). In fact, in this zone, the natural weather erosion on the emergent relief partially obliterated the more superficial terms [28], causing an absence or a spotty presence of the VSN’s more coherent and more recent units. As emerges in the study by Mazza et al. [28], the presence of VSN1 (especially if in thick layers, over 2 m) above the quarry vaults can have a protective function and gives a lower predisposition to raveling and sinking phenomena. Following the study of Mazza et al. [28] and considering the local topography and the almost horizontal trend of the geological profiles, it is hypothesized that the historical pingen that opened in the past centuries were preponderant in these zones because of the lower thickness or absence of the VSN units and the consequent superficiality of the RED-PNR and of their subterranean exploitations, which are, because of these concomitant factors, prone to collapse.
Considering this, the group of quarry structures and pingen have been analyzed in relation to the distance to the RED-PNR, performing a NNJoin analysis in QGIS, which allows determining the vicinity relation of the two vectors. The maximum incidence of pingen (90%) falls mainly in the RED-PNR group and in close vicinity to the border with VSN1 and VSN2, within a distance of 500 m (Figure 13C). The ancient exploitation that was mainly addressed to the RED-PNR had to be carried out underground, but the thin thickness of the VSN1 may not have carried out the protective function that it has instead in the areas where this unit is more predominant. In the vast areas where the VSN2 is the superficial layer and VSN1 is also present below, and where these units reach a considerable thickness, the quarries of pozzolana shall be deeper and in a better state of preservation, as it is also comparable with the risk map of Mazza et al. [28].
Furthermore, opencast quarries are observed in large areas where VSN2 and FKB (Figure 13B,D) are predominant at the surface, and it is here hypothesized that these types of wide surface exploitations were also aimed at these types of volcanic rocks.

3.2. Querying Velocity Maps with Vectored Historical Datasets

The PSs extracted from the SAR CSK dataset in both ascending and descending geometries of acquisition are well represented by the interpolated velocity maps as, with the setting of a 50 m interpolation radius, their pixel values are not calculated very far away from the points, thus avoiding obtaining insignificant results. In fact, the presence of vegetated areas, which in this area of Rome are in some cases extensive, such as the public parks, does not allow the extraction of homogeneous coverage of the PSs from CSK in the X-band. Thence, the rasters will have no-data areas corresponding to the denser green canopies and for some of these analyses it was necessary to further process the outputs with the Close Gaps tool. The effect of radar shadow and the double bounce effect can cause monitoring issues in urban environments with a high density of high buildings interspersed by narrow streets. The use of both geometries in combination permits coping with this matter.
Furthermore, before additional spatial analyses, the interpolation maps were also verified for residual topographic phase ramps, comparing them with a DTM. The topographic trend of the DTM does not match the PSs value trends, allowing excluding that the PSs are affected by this type of systematic error.
The interpolation maps favor identifying significant distribution through smoothed outputs, which are easier to read than the original point vector data, displaying more information than a cluster/outlier analysis, such as the mediate values of velocity. Furthermore, the standardized velocity maps, filtered by a standard deviation of 2 between the values of −1 and 1, displayed through color ramps, allow viewing large areas of slightly negative consistent values, both in the RA and RD (the example of RD is shown in Figure 14A), especially in the western area, and in other spots in the center and at the east. Some main roads and railways are also visible on the velocity maps, characterized by slightly subsiding values (Figure 14A).
A first correlation analysis was conducted with the layers concerning bombing events (Figure 14A,B). These vector layers easily allow highlighting the neighborhoods that have been bombed on several occasions. By executing a Bivariate Local Moran analysis and considering the position of the clusters with a meaningful distribution of slight negative values in the velocity maps, corresponding to high values of bombing frequency (LH areas), it was possible to perform a rapid interpretation of the distribution. This simple approach allowed us to locate the areas where the two factors under exam have an inverse correlation (Figure 14B). There are also areas with direct correlations, located in the hot cluster HH, in the cold LL and inverse correlation in the second outlier HL, but the intent of this geospatial analysis is to provide evidence of only the LH zones, where values of subsidence correspond to hotspots of the factors under study. In the case of Figure 14B, the LH areas are in the northwestern quadrant of the AOI.
Furthermore, the bivariate autocorrelation was calculated between the velocity maps and the vector, which locates the impact effects of air raids from HAPs. In Figure 15, it is possible to observe where there is a concurrence of subsidence values and bombed areas. Comparing Figure 14 and Figure 15 with Figure 5, which reports the bombed areas, and Figure 4A, which reports the quarry-related structures it is possible to observe the zones where an incidence of air raids overlaps with the mentioned structures, such as sub-areas of Centocelle, Gordiani, Tuscolano, Casilino and Don Bosco (toponyms reported in Figure 1B), and where the values in the velocity maps are in slight subsidence.
The northwest corner (Torpignattara, as an example), which has a very high frequency of bombing events, is the most complex to interpret due to the presence of buildings already constructed in the ’40s, which prevents the direct observation of quarry structures in the HAPs. In addition, the presence of underground structures in this zone is documented in the literature [18,22,23,24,25]. By further comparing the results obtained for the bombardments with those gathered from the spatial query of velocity maps with connected quarry structures, a more consistent discussion can be tried. In fact, the hypothesis formulated is that the zones of the AOI with ancient hypogeal environments, which underwent air raids, may show trends in subsidence, evidencing a condition in their state of preservation.
Thus, a second comparison, conducted at first by visual inspection, has been performed with the layer of the vectorization of quarry-related structures from HAPs. Interestingly, a coincidence between the extension of the pingen in various districts and the yellow-red areas in the interpolation maps can be observed (an example of the Gordiani subzone is reported in Figure 16).
Finally, a last geospatial analysis was used to correlate the velocity maps with quarry-related structures. It is stressed here that the position of pingen does not exclude the possibility of additional collapsing of lower-level undergrounds when the quarries are disposed on multiple layers; furthermore, the pingen also give a valuable indication of the possible presence of subterranean environments in neighboring areas. From the Bivariate Hotspot analysis (Figure 17), the areas that stand out are over or are neighboring those areas of dense fields of pingen, clearly visible in the HAPs, to the north and to the southwest (corresponding, respectively, to subareas of Gordiani, Centocelle and Tor Fiscale). By also comparing the shapefile of recent sinkholes (Figure 6), it is noted that these points are dispersed over large areas, mainly concentrated in the northwest corner, where it was not possible to evaluate the presence of ancient quarries from HAPs due to early presence of urbanization. However, recent sinkholes are still notable in the areas already highlighted in the HAPs, which are often coincidental or neighboring the LH zones in Figure 17.
These first matching evaluations were carried out between the possible factors considered, which, in combination with environmental conditions, may have favored sinkhole events in subsequent periods. In addition, a more focused spatial analysis of the described layers helped discuss results with a quantitative approach for selected subareas.

4. Discussion

At last, a discussion of the results grouped geographically is required to highlight the distribution of factors and the zoning of their co-presence. The extensive data collection has allowed the discussion of some general aspects hitherto related to mining archaeology, preservation of hypogea and road raveling. Concerning the characterization of mining structures, it was possible to extrapolate information pertaining to the mining landscape. However, as evidenced by the non-homogeneous distribution of the data produced so far, detailed results concerning the preservation/urban raveling are currently achievable mainly in some of the study subareas. For instance, in the northwest corner of the AOI, the presence of dense urban texture since the ‘40s has prevented the study of bare-earth morphology by the virtual survey of HAPs. Moreover, the information deducible from photographs is limited to the coverage of available data, and 3D products are further limited to areas where they allow good model extraction. Comparisons with detailed geological data from the literature, such as geological profiles [28], have a representative value, which decreases as the distance increases. For these reasons, a more targeted study is feasible where the complete data stratification can be queried in all facets. Though, for completeness, an overview of the main information gathered so far will be reported, following a geographical order from north to south, delineating some main traits of the whole AOI.
The slight relief that characterizes the northwest corner determined more significant erosion of the more recent lithic units [28], resulting in the outcropping in this quadrant of the older lithic terms (black and red pozzolana). In this sub-area, there are also hypogeal environments relatively close to the walkway [28,37]. As a first instance, the high frequency of bombing events in this area, the concomitance of slight subsidence of the velocity maps, and the presence of lithic units of predominantly incoherent type are put into relation. In the velocity maps, some of the main communication routes, such as the Via del Mandrione (railroad, green vector in Figure 8A) and several main roads, such as Via Casilina (in blue in Figure 8A), which run from about the northwest corner till the area’s southern border, are distinguishable by slightly subsiding values that follow the line shapefile (air-raid roads and air-raid railroads in Figure 8A). Furthermore, Via del Mandrione is also evidenced in the vector layer of the recent sinkhole events (Figure 6), as it is repeatedly mentioned in the news for the recent development of ravelling and chasms.
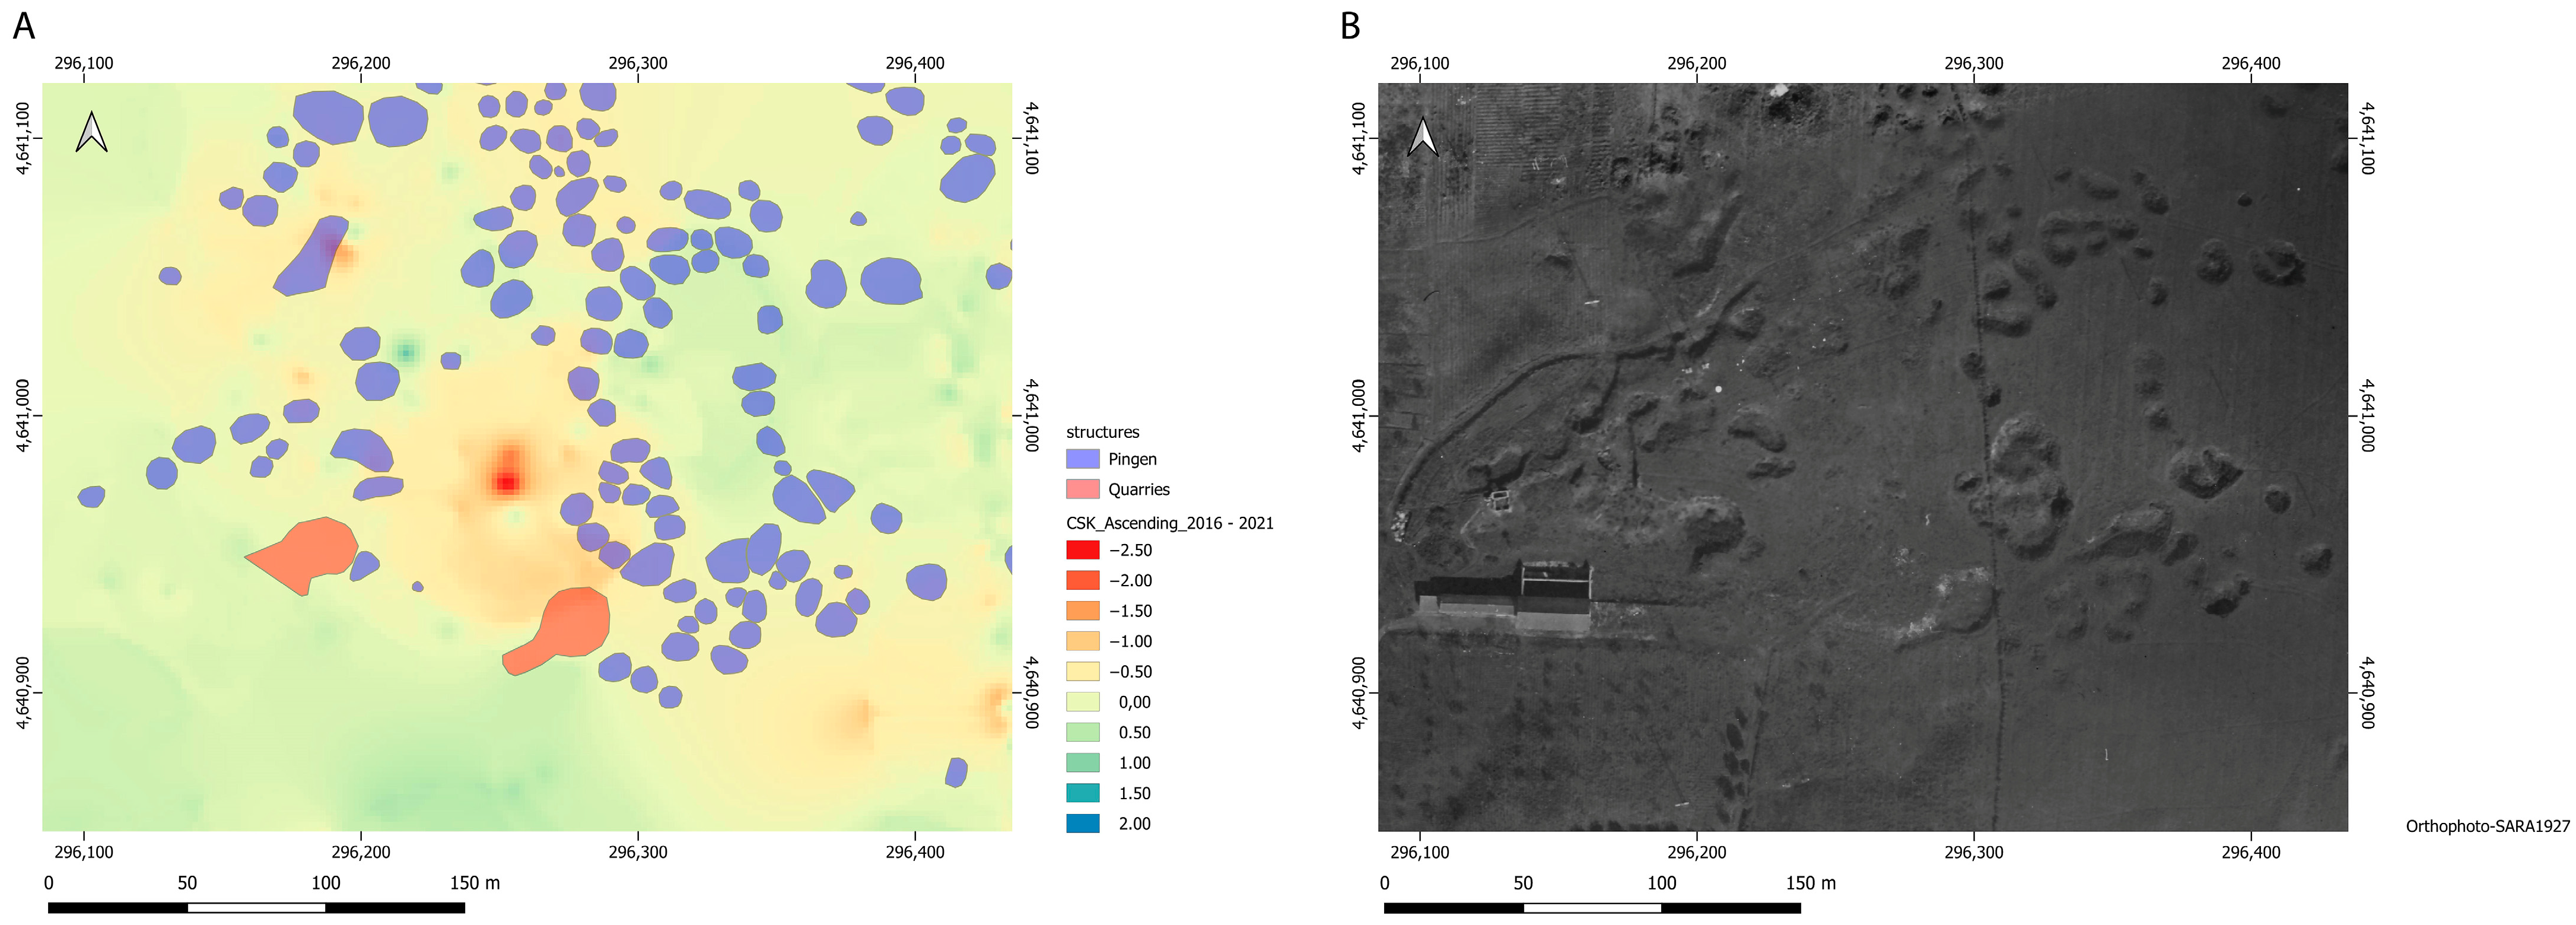
In the area immediately to the east (area Gordiani, in Figure 1B) and in the zone of Acqua Bullicante (sub-area of Casilino in Figure 1B), the study of the HAPs allowed the identification of some entrance ramps to quarries and numerous pingen (photographs of SARA_1927 and RAF_1944 in Figure 4A, northern sub-area, and Figure 12 and Figure 16). The depth of these structures is measurable in relative and viewable when employing tools for profile extraction (i.e., in QGIS and CloudCompare, as in Figure 10, Figure 11 and 
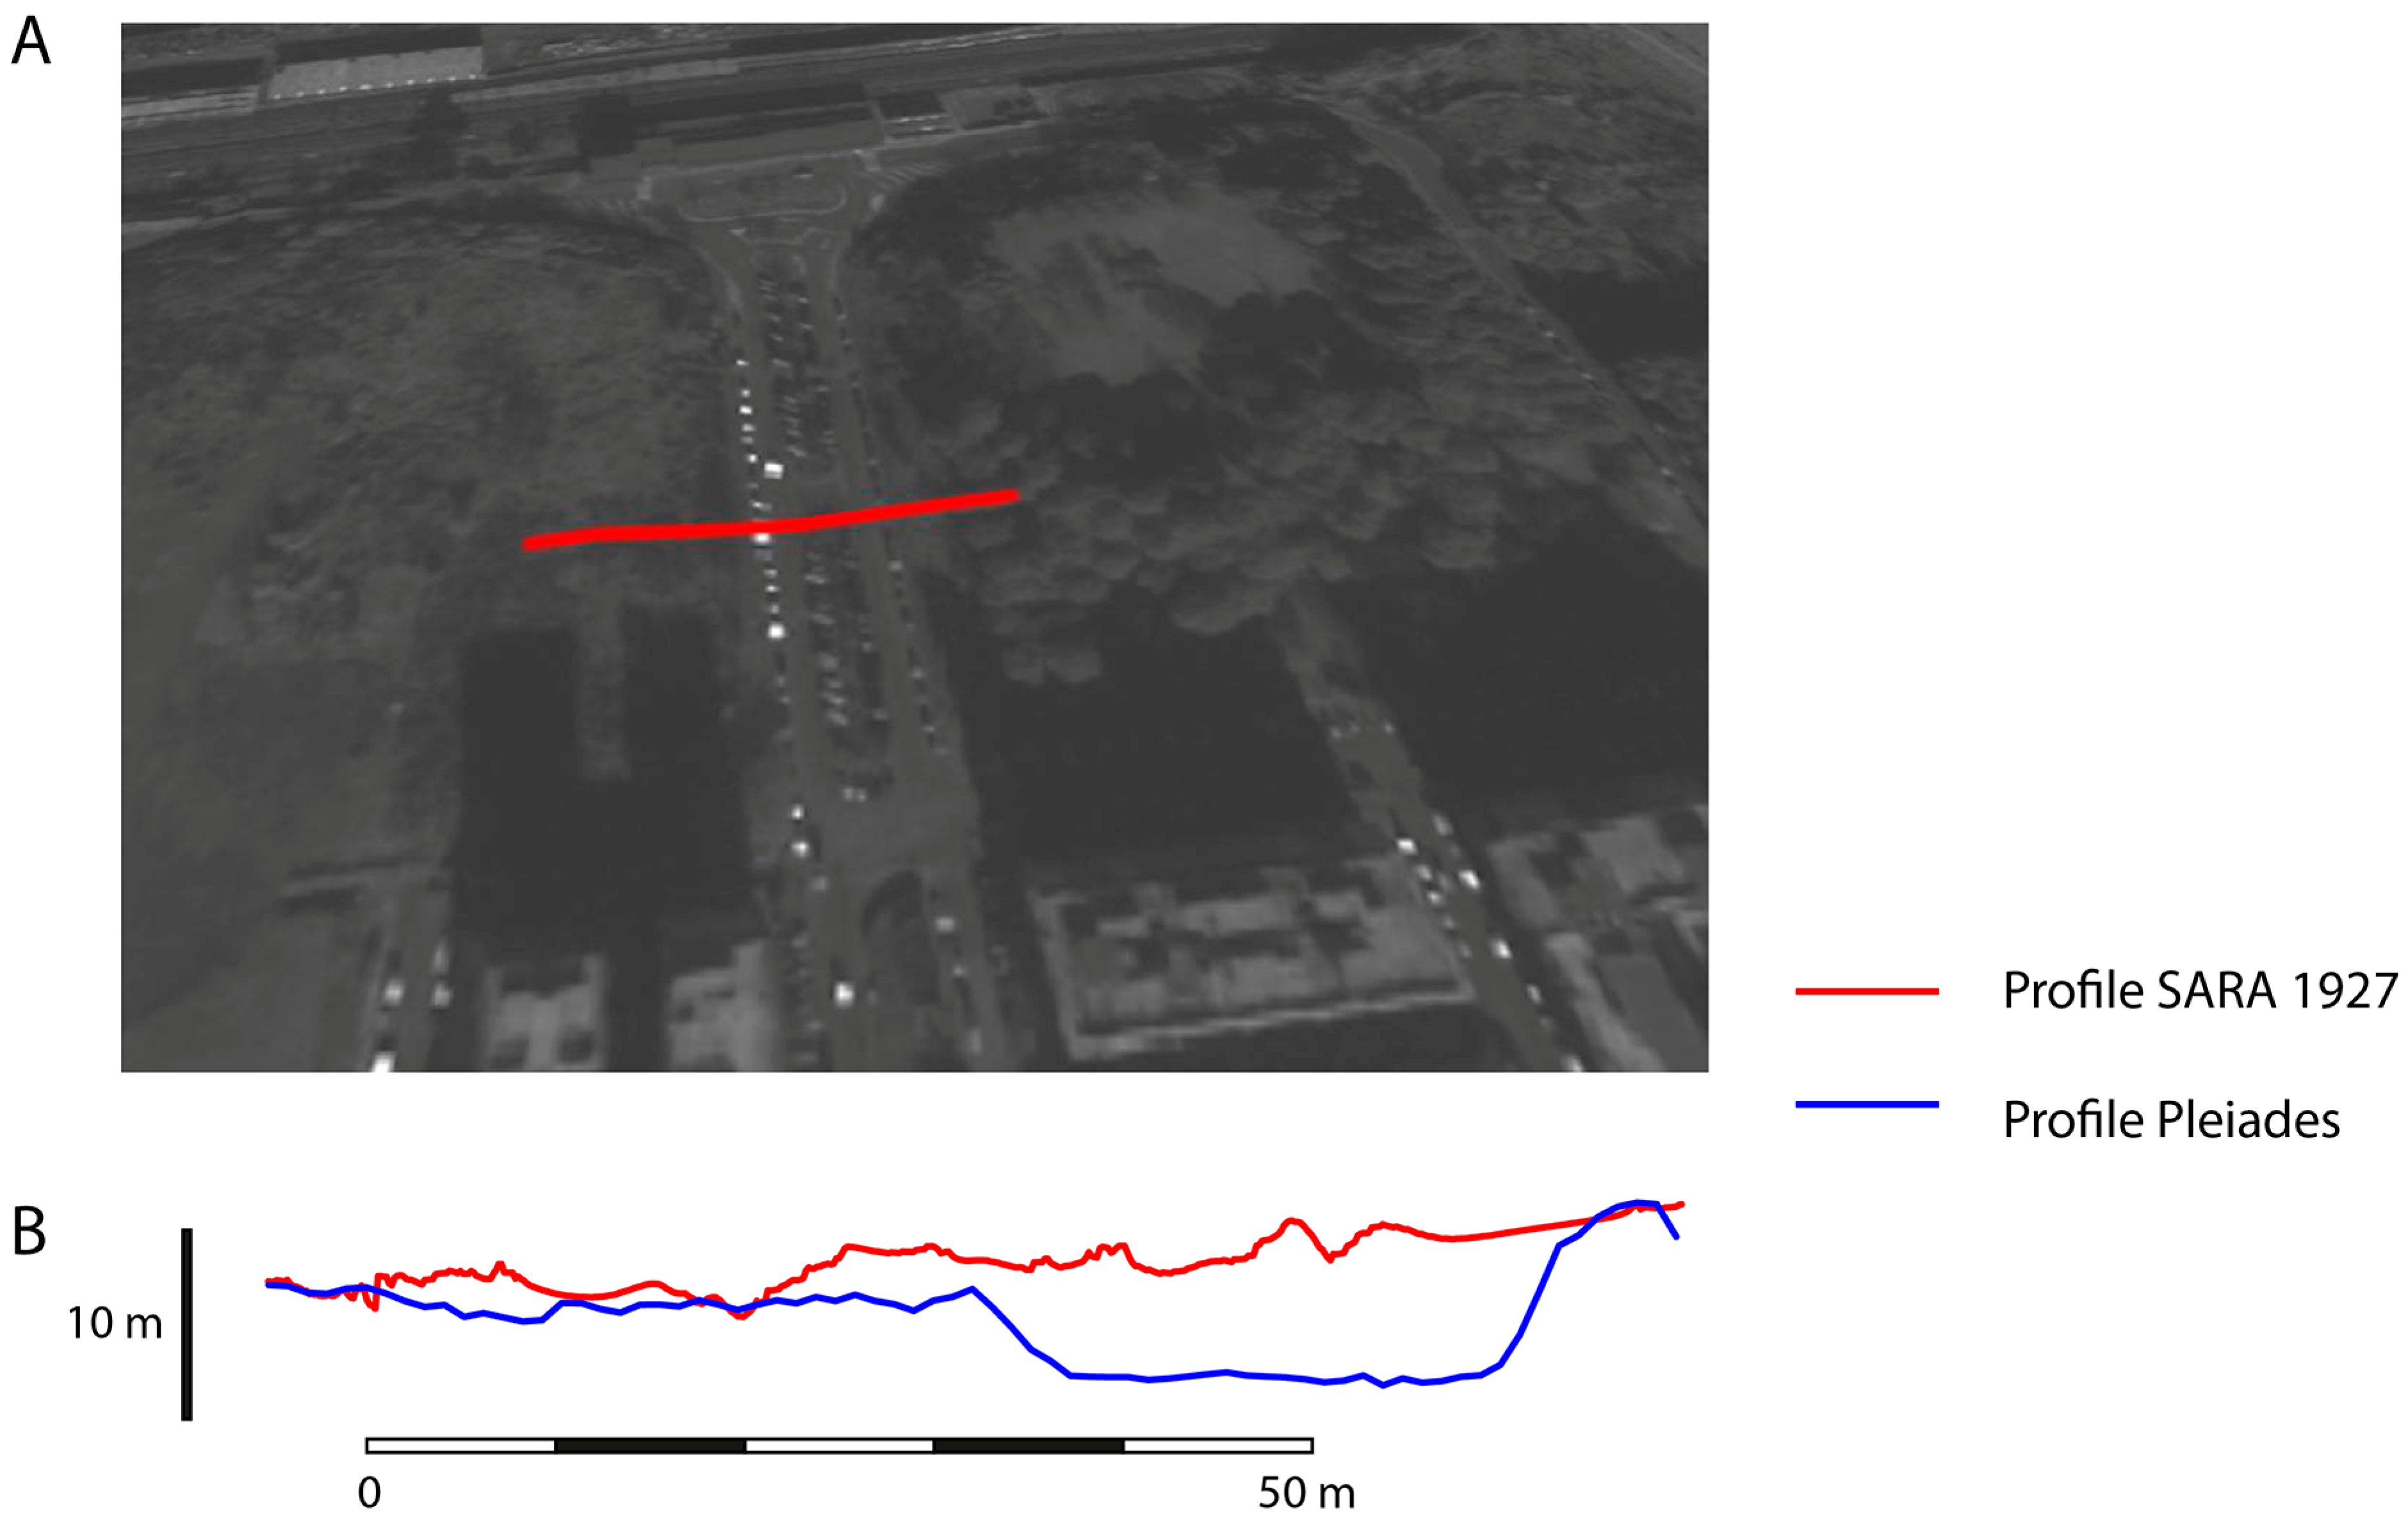
Figure 12). Moreover, for this peculiar zone, it is also possible to compare the relative shape of the historical DSM (extracted from the HAPs of SARA_1927, Figure 18A) with the recent DSM (extracted from Pléiades-HR stereo-pairs acquired in January 2017) to consider the variation of the topography (Figure 18B). This topography change is also testified by the presence of a step in the current morphology, which is still clearly visible, allowing the hypothesis that the area has been lowered after the cave-in phenomena occurred in the previous century and before being used as a residential zone in more recent times. Furthermore, it is in this area that several air raids have been aimed, as it is testified by the aforementioned air-raid shelter that was built inside one of the many underground quarries in the area, which was destroyed after a bombardment [53]: this event is a testimony that further justifies a subsequent rearrangement of the local topography.
In this area, however, the local quarries are placed on two levels (in [28,37]). Thus, even when the most superficial level collapsed in the last century, more recent sinking events were feasible. This peculiarity is, in fact, testified by the occurrence of sinkhole phenomena in more recent times (Figure 6). Subsequent geophysical investigations and speleological surveys highlighted a sizeable underground network with vaults at around 2.5–3 m from the ground level [37]. This set of data helps to interpret the velocity map with more details and allows a deeper understanding of ancient quarry structures, the pingen fields and the more recent sinkhole events.
The Gordiani area is also located at the intersection of the two geological profiles (as described in [28]). Thanks to this favorable position, the geological stratigraphies are particularly valid in this crossing point, and they can be used to gather information on the type of geological units and relative quarries locally present. The scarcity of lithoid tuff and the prevalence of black and red pozzolana of the incoherent type, where ancient subterranean quarries are documented in this area, can favor the establishment of raveling phenomena [28]. The presence of red and black pozzolana lithotypes, widely exploited in previous periods, justifies the intense quarrying activity in this area.
Further south, in the area between the Appio Latino district and Tor Fiscale (Figure 1B), the HAPs come in handy again, allowing the visualization of an extended area of quarry structures and pingen fields, similar in density and shape to those of the Gordiani area. In this case, similarities in geology with the Gordiani area and the occurrence of historical and recent sinkholes can also be associated with broad exploitation fields. Furthermore, the neighboring area of the park of Tor Fiscale and the park of Caffarella in the area of Appia Antica Nord (Figure 1B) is known for an extensive network of opencast underground quarries and large sinkholes opened in recent times in the park [2].
In the area near the southern edge of the AOI, it was possible to identify significant structures of opencast quarries in the HAPs. This type of exploitation, which is predominant in this zone, impacts the environment less, as it is also testified by a concomitant lower presence of underground cavities. The area is consequently also characterized by the almost absence of recent raveling phenomena (Figure 6).
Finally, the eastern border of the AOI is less characterized by structures that can be reconnected to exploitation areas. In fact, in this peripheral zone, quarry activities are also more seldom documented in the literature [18,22,24].
In detail, the query of the data stratification thus established made it possible to locate the co-presence of several anthropogenic factors, which are discussed here for the first time in their combination. Similar zonation is, in turn, also often highlighted in the velocity maps and further also characterized by a incidence of recent sinkhole phenomena. The strength of this approach is the non-hierarchical weighting of these factors, inherent in having transformed them into numerical values and variables otherwise considered as qualitative, anecdotal and less relevant. Thereby, this multifaceted dataset allows the enrichment of the discussion of the ancient quarrying landscape in urban areas and historical-recent sinkhole phenomena, involving aspects that belong to relevant recent history. The limitations of the approach are intrinsic to the characteristics of the datasets and of the methods. HAPs are data that do not allow real-time remote monitoring. In fact, the temporal but also spatial discontinuity of the strips makes it difficult to obtain homogeneous datasets for change detection. For the future development of the research, it is intended to increase the dataset of historical photographs under study, which shall allow to prove the presence of traces left by bombings and of quarry-related structures throughout the area in question. Furthermore, SAR monitoring is a very suitable method, albeit with limitations relating to large green areas and radar shadows in urban environments. In detail, the remote method requires a ground truthing phase on the presence of underground structures, which can be obtained with a field survey, partially already conducted, but also with the geophysical investigation and further underground prospecting. For the future development of the research, integration of the dataset with such additional information from specialized literature and from direct observations is foreseen.

5. Conclusions

The integration of historical, environmental and geological information and data gathered from this multi-platform method has therefore allowed the discussion of new factors related to the preservation of ancient quarries and the related phenomenon of sinkholes in urban areas.
The introduction of novel historical elements, such as bombardments, to the list of possible agents that may concur in the development of the sinkhole phenomena allowed evidencing a zonation of urban areas with a different conjunctionof factors. The ancient history of the city, which in the peripheral areas is closely linked to the exploitation of local lithic resources, and the recent history of the city, connected to world conflicts and to the rapid urban development that followed, are all critical elements that are considered in the broad discourse of urban security.
Concerning identifying the traces of quarries and pingen structures, the features extracted from 2D and 3D products obtained from photogrammetric processing have proven very useful in identifying ancient fields of exploitation for their characterization with better accuracy. Furthermore, the combination of historical/environmental factors also allowed to individuate zones where the quarries can be deemed to be in need of additional investigation. Potential applications of this analytical procedure, especially considering the 3D outputs and the amount of information they bring, are evaluated as beneficial for the interpretation of ancient quarry or mining activities in other areas of the city for a new reading of its complex mining landscape.
The identification of the conflict landscape through the recognition of craters left by bombardments by photointerpretation, which here is aimed at the identification of affected areas, can also be applied in the future to the aims of remediation/neutralization in other regions. Therefore, the validation of an automatic extraction with a deep-learning approach for computer vision is currently in progress. By means of RetinaNet, whose model shall allow the distinction between types of bombs (i.e., explosive and incendiary types) from the shape and dimension of their craters, the automatic identification will be attempted, furthermore allowing covering bigger areas to highlight possible long-term implications.
The use of SAR interferometric data in the form of interpolated velocity maps played the role of a connection link between the disparate environmental, archaeological and historical factors analyzed here and the local distribution of recent sinkholes. This monitoring method proved to be an excellent expeditious approach. A further study aimed at resolving the green canopy issue can be set by using additional SAR bands, such as L-band datasets, to extract PSs in integration with the more commonly used C and X-band interferometric products.
The method allows for the efficient and simultaneous study of disparate heterogeneous information and highlights the previously discussed correlations. In several areas, the concurrence of recent sinkholes, subsidence, bombardment hotspots, and quarry-related structures has allowed the formulation of cause–effect hypotheses.
The relevance of the topic for the preservation of underground archaeology and urban safety fosters additional efforts to further develop the analytical method and expand the areas under study, permitting new considerations of analogous territories where these historical factors appear concurrently.

Supplementary Materials

The following supporting information can be downloaded at: https://www.mdpi.com/article/10.3390/rs15082011/s1, Figure S1: Workflow; Table S1: Accuracies of orthophotos; Table S2: Accuracies of DSMs.

Author Contributions

Conceptualization, A.C. and M.M.; methodology, A.C. and M.M.; software, A.C., A.M., J.A.P.B., I.M., J.F.G.T. and P.J.V.D.; validation, A.C. and J.F.G.T.; formal analysis, A.C., A.M. and J.A.P.B.; investigation, A.C.; resources, A.C., I.M. and P.J.V.D.; data curation, A.C., I.M. and J.A.P.B.; writing—original draft preparation, A.C.; writing—review and editing, A.C., A.M., J.A.P.B., I.M. and J.F.G.T.; visualization, A.C. and A.M.; supervision, M.M.; funding acquisition, M.M. All authors have read and agreed to the published version of the manuscript.

Funding

This research was partially funded by the MoSCaS Project (Modelli e strumenti per la caratterizzazione delle cavità sotterranee—Coordinated by: Università degli Studi di Firenze, UNIFI, Istituto Superiore per la Protezione e la Ricerca Ambientale, ISPRA and Università Federico II di Napoli, UNINA) funded by MATTM-Ministero dell’Ambiente e della Tutela del Territorio e del Mare (now Ministero della Transizione ecologica-MiTE), Direzione Generale per la Salvaguardia del Territorio e delle Acque (project prot. n. 19689 of 27 September 2019). The APT has been provided by CRAS—Aerospace Research Center Sapienza, Sapienza University of Rome, responsible of the funds: Maria Marsella.

Data Availability Statement

Restrictions apply to the availability of COSMO-SkyMed data, which were obtained from ASI—Italian Space Agency and are licensed for scientific research purposes to the requesting users. Historical photographs were gathered by permission of the Istituto Centrale per il Catalogo e la Documentazione (ICCD)—MiC (Ministero della Cultura), and all the HAPs are therefore also linked to a user license. The ICCD prohibits further dissemination, reproduction and/or duplication by any means. The data presented in this study, such as the produced shapefiles, are available on request from the corresponding author.

Acknowledgments

The authors wish to thank the ICCD—Istituto Centrale per il Catalogo e la Documentazione, Aerofototeca Nazionale for their support in the selection of the photographs and for having authorized their study and the publication of these results. Furthermore, the authors acknowledge the ASI—Agenzia Spaziale Italiana, which supplied the COSMO-SkyMed dataset for research purposes. The referees are here mentioned with gratitude for their valuable review of the paper.

Conflicts of Interest

The authors declare no conflict of interest. The funders had no role in the design of the study; in the collection, analyses, or interpretation of data; in the writing of the manuscript; or in the decision to publish the results.

References

  1. Haicher, P.J. Guide to the Acqueducts of Ancient Rome; Bolzachi-Carducci Publishers: Wauconda, IL, USA, 1995. [Google Scholar]
  2. Chiocchini, U. Le voragini connesse all’attività estrattiva nella valle del Fosso Almone, Roma. Mem. Descr. Carta Geol. D’It. 2015, XCIX, 111–138. [Google Scholar]
  3. Arnoldus-Huyzendveld, A. La Geoarcheologia. In Centocelle I: Roma SDO–le Indagini Archeologiche; Gioia, P., Volpe, R., Eds.; Roma-Soveria Mannelli: Rubbettino, Italy, 2004; pp. 177–185. [Google Scholar]
  4. Mazza, R.; Capelli, G. Le cavità sotterranee. In Centocelle I Roma SDO–le Indagini Archeologiche; Gioia, P., Volpe, R., Eds.; Roma-Soveria Mannelli: Rubbettino, Italy, 2004; pp. 165–176. [Google Scholar]
  5. Volpe, R. Dalle cave della via Tiberina alle Mura repubblicane di Roma. In Arquelogía de la Construcción IV. Las Canteras en el Mundo Antiguo: Sistemas de Explotación y Procesos Productivo; Bonetto, J., Camporeale, S., Pizzo, A., Eds.; AespA: Madrid-Mérida, Spain, 2014; Volume LXIX, pp. 61–71. [Google Scholar]
  6. Colapietro, A.; Monti, G.M.; Paolini, A. Considerazioni sui paesaggi storici e di produzione nel suburbio Sud-Est di Roma. In Territorio: Rischio/Risorsa; Gallia, A., Ed.; Labgeo Caraci: Roma, Italy, 2020; pp. 11–28. [Google Scholar]
  7. Paolini, A. Il paesaggio rurale nel suburbio Sud-Est di Roma e le antiche cave di materiali edilizi: Alcuni casi di studio. In Città e Territorio. Conoscenza, Tutela e Valorizzazione dei Paesaggi Culturali; Galeotti, G., Paperini, M., Eds.; Debatte: Livorno, Italy, 2013; pp. 196–201. [Google Scholar]
  8. Mecchia, G.; Piro, M. Le Cave di Centocelle (Roma). Opera IPOGEA 2000, II, 37–46. [Google Scholar]
  9. Jackson, M.; Marra, F. Roman stone masonry: Volcanic foundations of the ancient city. AJA 2006, 110, 403–436. [Google Scholar] [CrossRef]
  10. Giampaolo, C.; Lombardi, G.; Mariottini, M. Pietre e costruito della città di Roma: Dall’antichità ai giorni nostri. La Geol. Di Roma Dal Cent. Stor. Alla Perif. Mem. Descr. Carta Geol. D’It. 2008, 80, 273–406. [Google Scholar]
  11. Adam, J.P. L’arte di Costruire Presso i Romani; Longanesi: Milano, Italy, 2008. [Google Scholar]
  12. Schatzmann, A. An Ancient Highway to the Tufa Quarries: New Considerations on a Forgotten Monument North of Rome. In Proceedings of the Hypogea 2015—Proceedings of International Congress of Speleology in Artificial Cavities, Rome, Italy, 11–17 March 2015; pp. 210–222. [Google Scholar]
  13. Celauro, A.; Marsella, M.A.; D’Aranno, P.J.V.; Maass, A.; Palenzuela Baena, J.A.; Guerrero Tello, J.F.; Moriero, I. Ancient Mining Landscapes and Habitative Sceneries in the Urban Area of Centocelle: Geomatic Applications for their Identification, Measurement, Documentation and Monitoring. ISPRS Arch. 2019, 42, 403–410. [Google Scholar] [CrossRef]
  14. Sciotti, M. Engineering geological problems due to old underground quarries in the urban area of Rome (Italy). In Proceedings of the IV congress of the International Association of Engineering Geology, New Delhi, India, 10–15 December 1982; Volume I, pp. 211–225. [Google Scholar]
  15. Crescenzi, R.; Piro, M.; Vallesi, R. Le cavità sotterranee a Roma. La Geol. Di Roma Il Cent. Stor. 1995, 50, 249–278. [Google Scholar]
  16. Berti, G.; Canuti, P.; Casagli, N. Criteri per la previsione e prevenzione del rischio connesso agli sprofondamenti catastrofici. In Le voragini catastrofiche, un nuovo problema per la Toscana. Att. Conv. 31 Marzo 2000 2002, 31, 82–98. [Google Scholar]
  17. Bianchi Fasani, G.; Bozzano, F.; Cardarelli, E.; Cercato, M. Underground cavity investigation within the city of Rome (Italy): A multi-disciplinary approach combining geological and geophysical data. Eng. Geol. 2013, 152, 109–121. [Google Scholar] [CrossRef]
  18. Ciotoli, G.; Corazza, A.; Finoia, M.G.; Nisio, S.; Serafini, R.; Succhiarelli, C. Sinkholes antropogenici nel territorio di Roma Capitale Anthropogenic sinkholes in the territory of Roma Capitale. Mem. Descr. Carta Geol. D’It 2013, 93, 143–182. [Google Scholar]
  19. Ciotoli, G.; Nisio, S.; Serafini, R. Analisi della suscettibilità ai sinkholes antropogenici nel centro urbano di Roma, XCIX. Mem. Descr. Carta Geol. D’It 2015, 99, 167–188. [Google Scholar]
  20. Nisio, S.; Caramanna, G.; Ciotoli, G. Sinkholes hazard in Italy: First results on the inventory and analysis of some case studies. In Natural and Anthropogenic Hazards in Karst Areas: Recognition, Analysis and Mitigation; Parise, M., Gunn, J., Eds.; Geo Soc Lond, Special Publications: London, UK, 2007; Volume 279, pp. 23–45. [Google Scholar]
  21. Nisio, S.; Ciotoli, G.; Ferri, F.; Moretti, P.; Puzzilli, L.M.; Ruscito, V.; Carlucci, G. Primo contributo allo studio delle cavità sotterranee nascoste sotto il Parco di Centocelle nell’area urbana di Roma. Mem. Descr. Carta Geol. D’It 2021, 108, 381–400. [Google Scholar]
  22. Nisio, S. La carta delle cavità antropogeniche di Roma Capitale. In Quaderno; Ordine degli Ingegneri della provincia di Roma: Roma, Italy, 2019; pp. 20–30. [Google Scholar]
  23. Ciotoli, G.; Ferri, G.; Nisio, S.; Succhiarelli, C. The underground cavities in the territory of Rome: Typologies, distribution and sinkhole susceptibility. In Proceedings of the Hypogea 2015–Proceedings of International Congress of Speleology in Artificial Cavities, Rome, Italy, 11–17 March 2015; pp. 433–439. [Google Scholar]
  24. Nisio, S.; Allevi, M.; Ciotoli, G.; Ferri, G.; Fiore, R.; Lanzini, M.; Roma, M.; Paolucci, R.; Stranieri, I.; Succhiarelli, C. Carta delle Cavità Sotterranee di Roma; ISPRA: Rome, Italy, 2017. Available online: https://www.isprambiente.gov.it/files2017/cartografia/carta_cavita_sotterranee_Roma_q_4.pdf (accessed on 2 January 2021).
  25. Ventriglia, U. La Geologia della città di Roma; Amministrazione Provinciale di Roma: Rome, Italy, 1971. [Google Scholar]
  26. Bianchi Fasani, G.; Bozzano, F.; Cercato, M. The underground cavity network of south-eastern Rome (Italy): An evolutionary geological model oriented to hazard assessment. B. Eng. Geol. Environ. 2011, 70, 533–542. [Google Scholar] [CrossRef]
  27. Fiore, A.; Lanzini, M. Problematiche di valutazione del rischio di crollo di cavità sotterranee. Geol. Territ. 2006, 4, 35–45. [Google Scholar]
  28. Mazza, R.; Capelli, G.; Lanzini, M. Rischio di crollo di cavità nel territorio del VI Municipio del Comune di Roma. Mem. Descr. Carta Geol. D’It. 2008, LXXX, 149–170. [Google Scholar]
  29. Esposito, C.; Belcecchi, N.; Bozzano, F.; Brunetti, A.; Marmoni, G.M.; Mazzanti, P.; Romeo, S.; Cammillozzi, F.; Cecchini, G.; Spizzirri, M. Integration of satellite-based A-DInSAR and geological modeling supporting the prevention from anthropogenic sinkholes: A case study in the urban area of Rome. Geomat. Nat. Hazards Risk 2021, 12, 2835–2864. [Google Scholar] [CrossRef]
  30. Intrieri, E.; Fontanelli, K.; Bardi, F.; Marini, F.; Carlà, T.; Pazzi, V.; Di Filippo, M.; Fanti, R. Definition of sinkhole triggers and susceptibility based on hydrogeomorphological analyses. Environ. Earth Sci. 2018, 77, 4. [Google Scholar] [CrossRef]
  31. Nof, R.N.; Abelson, M.; Raz, E.; Magen, Y.; Atzori, S.; Salvi, S.; Baer, G. SAR Interferometry for Sinkhole Early Warning and Susceptibility Assessment along the Dead Sea, Israel. Remote Sens. 2019, 11, 89. [Google Scholar] [CrossRef]
  32. Theron, A.; Engelbrecht, J.; Kemp, J.; Kleynhans, W.; Turnbull, T. Detection of sinkhole precursors through SAR interferometry: First results from South Africa. In Proceedings of the 2016 IEEE International Geoscience and Remote Sensing Symposium (IGARSS), Beijing, China, 10–15 July 2016; pp. 5398–5401. [Google Scholar]
  33. Melis, M.T.; Pisani, L.; De Waele, J. On the Use of Tri-Stereo Pleiades Images for the Morphometric Measurement of Dolines in the Basaltic Plateau of Azrou (Middle Atlas, Morocco). Remote Sens. 2021, 13, 4087. [Google Scholar] [CrossRef]
  34. Petschko, H.; Zehner, M.; Fischer, P.; Goetz, J. Terrestrial and Airborne Structure from Motion Photogrammetry Applied for Change Detection within a Sinkhole in Thuringia, Germany. Remote Sens. 2022, 14, 3058. [Google Scholar] [CrossRef]
  35. Intrieri, E.; Gigli, G.; Nocentini, M.; Lombardi, L.; Mugnai, F.; Fidolini, F.; Casagli, N. Sinkhole monitoring and early warning: An experimental and successful GB-InSAR application. Geomorphology 2015, 241, 304–314. [Google Scholar] [CrossRef]
  36. Balland, C.; Alheib, M.; Didier, C. Monitoring the long term stability and sinkhole of shallow underground cavities using micro-seismic technique—Gypsum mine (Jura, France). In Proceedings of the American Geophysical Union, Fall Meeting, San Francisco, CA, USA, 14–18 December 2009; p. 1759. [Google Scholar]
  37. Toro, B.; Di Filippo, M. Individuazione di cavità nel sottosuolo con metodi microgravimetrici. Il caso di via Buie d’Istria. Convegno su Le Cavità sotterranee nell’area urbana di Roma e nella Provincia. In Proceedings of the Le Cavità Sotterranee Nell’area Urbana di Roma e della Provincia. Problemi di Pericolosità e Gestione, Roma, Italy, 12 March 1999; pp. 73–82. [Google Scholar]
  38. Brahmi, S.; Fehdi, C.; Hadji, R.; Brahmi, S.; Hamad, A.; Hamed, Y. Karst-Induced Sinkhole Detection Using a Tomography Imaging Survey, Case of Setifian High Plain, NE Algeria. Geotech. Geol. Eng. 2023, 41, 11–16. [Google Scholar] [CrossRef]
  39. Mouici, R.; Bâali, F.; Hadji, R.; Boubaya, D.; Audra, P.; Fehdi, C.; Cailhol, D.; Jaillet, S.; Arfib, B. Geophysical, geotechnical, and speleologic assessment for karst-sinkhole collapse genesis in Cheria Plateau (NE Algeria). Min. Sci. 2017, 24, 59–71. [Google Scholar]
  40. Dhorti, K.; Chandar, K.R. Stability analysis of old underground coal workings using wireless sensor network. In Proceedings of the Recent Advances in Rock Engineering, Bengaluru, India, 16–18 November 2016; pp. 85–90. [Google Scholar]
  41. Khan, R.; Li, H.; Afzal, Z.; Basir, M.; Arif, M.; Hassan, W. Monitoring Subsidence in Urban Area by PSInSAR: A Case Study of Abbottabad City, Northern Pakistan. Remote Sens. 2021, 13, 1651. [Google Scholar] [CrossRef]
  42. D’Aranno, P.J.V.; Marsella, M.; Scifoni, S.; Scutti, M.; Bonano, M. Advanced DInSAR analysis for building damage assessment in large urban areas: An application to the city of Roma, Italy. SAR Image Anal. Model. Tech. XV 2015, 9642, 108–116. [Google Scholar]
  43. D’Aranno, P.J.V.; Di Benedetto, A.; Fiani, M.; Marsella, M.; Moriero, I.; Palenzuela, J.A. An Application of Persistent Scatterer Interferometry (PSI) Technique for Infrastructure Monitoring. Remote Sens. 2021, 13, 1052. [Google Scholar] [CrossRef]
  44. Marsella, M.; D’Aranno, P.J.V.; Scutti, M.; Scifoni, S.; Sonnessa, A.; Gonzales, E.J.L.; Bonano, M.; Manunta, M.; Pepe, A.; Ojha, C. Quantifying the effects of ground settlement on buildings by the exploitation of long term DINSAR time series: The case of Roma. In Proceedings of the 15th International Conference on Environment and Electrical Engineering, EEEIC 2015, Rome, Italy, 10–13 June 2015; pp. 2226–2230. [Google Scholar]
  45. Ferretti, A.; Basilico, M.; Novali, F.; Prati, C. Possible utilizzo di dati radar satellitari per individuazione e monitoraggio di fenomini di sinkholes. In Proc. First Seminary on the State of the Art on Sinkhole Study and the Role of National and Local Administration on Land Management; Nisio, S., Panetta, S., Vita, L., Eds.; APAT: Rome, Italy, 2004; pp. 331–340. [Google Scholar]
  46. Jones, C.E. Capabilities, limitations and opportunities for studying sinkholes using synthetic aperture radar interferometry. In NCKRI Symposium 8: Proceedings of the 16th Multidisciplinary Conference on Sinkholes and the Engineering and Environmedntal Impacts of Karst National Cave and Karst Reseaarch Institute Symposium 8; Land, L., Kromhout, C., Byle, M.J., Eds.; National Cave and Karst Research Institute: Carlsbad, CA, USA, 2020; pp. 68–74. [Google Scholar]
  47. Tapete, D.; Morelli, S.; Fanti, R.; Casagli, N. Localising deformation along the elevation of linear structures: An experiment with space-borne InSAR and RTK GPS on the Roman Aqueducts in Rome, Italy. Appl. Geogr. 2015, 58, 65–83. [Google Scholar] [CrossRef]
  48. Celauro, A.; Palenzuela Baena, J.A.; Moriero, I.; Marsella, M.A. An Integration of SAR Time Series, Optical Data and Archival Documentation for the Identification of Hypogea as a Possible Factor of Vulnerability in Rome. In Proceedings Volume 11861, Microwave Remote Sensing: Data Processing and Applications; Bovenga, F., Notarnicola, C., Pierdicca, N., Santi, E., Eds.; SPIE: Online Only, Spain, 2021. [Google Scholar]
  49. IPTSAT srl, DatiOpen.it. Il Portale Italiano dell’OpenData. Roma Capitale-Mappa dei Municipi. Released under the Licence IODL 2.0. Available online: http://www.datiopen.it/en/opendata/Municipi_di_Roma_Capitale (accessed on 2 January 2023).
  50. Geoportale Comune di Roma. Limiti Amministrativi_ Zone Urbanistiche. Available online: https://geoportale.comune.roma.it/catalogo/ (accessed on 2 January 2023).
  51. Funiciello, R.; Giordano, G.; Mattei, M. Carta Geologica di Roma. In Scala 1:50,000, 2 voll. In La Geologia di Roma – dal centro storico alla periferia. Mem. Descr. Carta Geol. d’It, Funiciello, R.; Praturlon, A., Giordano, G. (Eds.) 2008, LXXX. Available online: https://www.isprambiente.gov.it/files/pubblicazioni/periodicitecnici/memorie/memorielxxx/memdes_80_comune.jpg. (accessed on 1 August 2022).
  52. Capelli, G.; Mazza, R.; Taviani, S. Carta idrogeologica dell’area di Roma. Attached to La geologia di Roma dal centro alla periferia, Mem. Descr. Carta Geol. d’It Funiciello, R.; Praturlon, A., Giordano G. (eds.), 2008, LXXX. Available online: https://www.isprambiente.gov.it/it/pubblicazioni/periodici-tecnici/memorie-descrittive-della-carta-geologica-ditalia/memdes_80_capelli.jpg (accessed on 1 August 2022).
  53. Grassi, L. Il Ricovero Antiaereo Industriale Dello Stabilimento Snia Viscosa di Roma. Available online: https://lagoexsnia.files.wordpress.com/2017/07/relazione_rifugio.pdf (accessed on 9 February 2022).
  54. PCI Geomatics. PCI Geomatica (Version 2017). Richmond Hill: Markham, ON, Canada, 2017; Available online: https://catalyst.earth/ (accessed on 24 January 2023).
  55. PCI Geomatics. PCI-Geomatica, 2017—Using PCI Software; Richmond Hill: Markham, ON, Canada, 2017. [Google Scholar]
  56. CloudCompare (Version 2.12). 2022. Available online: http://www.cloudcompare.org/ (accessed on 24 January 2023).
  57. AgiSoft, Agisoft Metashape Professional (Version 2.0). St. Petersburg, Russia. 2022. Available online: https://www.agisoft.com/ (accessed on 24 January 2023).
  58. QGIS Development Team. QGIS Geographic Information System. Open Source Geospatial Foundation Project. 2021. Available online: http://qgis.osgeo.org (accessed on 24 January 2023).
  59. Lin, T.-Y.; Goyal, P.; Girshick, R.; He, K.; Dollár, P. Focal Loss for Dense Object Detection. IEEE Trans. Pattern Anal. Mach. Intell. 2017, 42, 318–327. [Google Scholar] [CrossRef]
  60. Ezzy, H.; Charter, M.; Bonfante, A.; Brook, A. How the Small Object Detection via Machine Learning and UAS-Based Remote-Sensing Imagery Can Support the Achievement of SDG2: A Case Study of Vole Burrows. Remote Sens. 2021, 13, 3191. [Google Scholar] [CrossRef]
  61. Tan, L.; Huangfu, T.; Wu, L.; Chen, W. Comparison of RetinaNet, SSD, and YOLO v3 for real-time pill identification. BMC Med. Inform. Decis. Mak. 2021, 21, 324. [Google Scholar] [CrossRef]
  62. Coelho, C.; Costa, M.F.P.; Ferrás, L.L.; Soares, A.J. Object Detection with RetinaNet on Aerial Imagery: The Algarve Landscape. In Computational Science and Its Applications–ICCSA 2021. ICCSA 2021. Lecture Notes in Computer Science; Springer International Publishing: Cham, Switzerland, 2021; Volume 12950, pp. 1–35. [Google Scholar] [CrossRef]
  63. Redmon, J.; Farhadi, A. Yolov3: An incremental improvement. arXiv 2018, arXiv:1804.02767. [Google Scholar]
  64. Baldoli, C. I bombardamenti sull’Italia nella Seconda Guerra Mondiale. Strategia anglo-americana e propaganda rivolta alla popolazione civile. Deport. Esuli Profughe Riv. Telemat. Di Studi Sulla Mem. Femminile 2010, 13–14, 34–49. [Google Scholar]
  65. Gioacchini, M.; Massobrio, G. Bombardate l’Italia: Storia della Guerra di Distruzione Aerea 1940–1945; Rizzoli: Milano, Italy, 2007. [Google Scholar]
  66. Naso, G.L. Memorie di Guerra—I Bombardamenti del ‘43 a Porta Maggiore, Portonaccio e Delle Officine di Prenestina; ATAC: Roma, Italy, 2013. [Google Scholar]
  67. Riassunto Anno 1943(3)_Roma Colpita! Roma Brucia! Available online: https://www.cronologia.it/storia/a1943a. (accessed on 2 March 2022).
  68. Associazione Culturale info.roma.it. Cronologia della Storia di Roma. Available online: https://www.info.roma.it/cronologia.asp?form_categoria=Bombardamenti (accessed on 1 March 2022).
  69. Maranusager_Via Dell’acqua Bullicante, la Vecchia via Militare e i Forti Difensivi di Fine Ottocento a Roma. Available online: www.maranusager.wordpress.com (accessed on 1 May 2022).
  70. Archivio Luce. Available online: www.patrimonio.archivioluce.com (accessed on 1 May 2022).
  71. Rerum Romanarum_Bombardamento di San Lorenzo del 18 Lugio 1943. Available online: https://www.rerumromanarum.com/ (accessed on 7 January 2021).
  72. WebSIT_Città Metropolitana. Available online: https://geoportale.cittametropolitanaroma.it/sistema-informativo-territoriale-sit (accessed on 2 January 2021).
  73. Regione Lazio—Open Data. 2002 Carta Tecnica Regionale Numerica Scala 1:5.000—Provincia di Roma. Released under cc-by License. Available online: https://dati.lazio.it/catalog/en/dataset/carta-tecnica-regionale-2002-2003-5k-roma (accessed on 2 January 2023).
  74. Google LLC. Google Earth Pro (Version 7.3.6.9345); Google LLC: Mountain View, CA, USA, 2022; Available online: http://www.google.com/earth/index.html (accessed on 2 January 2023).
  75. Ferretti, A.; Prati, C.; Rocca, F. Analysis of Permanent Scatterers in SAR Interferometry. In Proceedings of the International Geoscience and Remote Sensing Symposium, Honolulu, HI, USA, 24–28 July 2000; pp. 761–763. [Google Scholar] [CrossRef]
  76. Ferretti, A.; Monti-Guarnieri, A.; Prati, C.; Rocca, F.; Massonnet, D. InSAR Principles: Guidelines for SAR Interferometry Processing and Interpretation; ESA Publications: Noordwijk, The Netherlands, 2007; Volume TM-19, ISBN 92-9092-233-8. [Google Scholar]
  77. L3Harris, ENVI (Version 5.3.1) and SARscape (Version 5.2.1), Exelis Visual Information Solutions, Boulder, Colorado. Available online: https://www.l3harris.com/ (accessed on 24 January 2023).
  78. Palenzuela Baena, J.A. MUSA—Monitoring Built-Up Area From Satellite, European Funded Project under the Programme H2020-EU.2.3.2.2.—Enhancing the Innovation Capacity of SMEs. 2017. Available online: https://cordis.europa.eu/project/id/739837 (accessed on 3 April 2022).
  79. Oxoli, D.; Prestifilippo, G.; Bertocchi, D.; Zurbarán, M. Enabling spatial autocorrelation mapping in QGIS: The hotspot analysis plugin. GEAM 2017, 151, 45–50. [Google Scholar]
  80. Anselin, L. Local Indicators of Spatial Association—LISA. Geogr. Anal. 1995, 27, 93–115. [Google Scholar] [CrossRef]
  81. Anselin, L. Interactive techniques and exploratory spatial data analysis. In Geographic Information Systems: Principles, Techniques, Management and Applications; Longley, P., Goodchild, M., Maguire, D., Rhind, D., Eds.; Geoinformation Int: Cambridge, UK, 1999; pp. 253–266. [Google Scholar]
  82. Waga, J.M.; Fajer, M. The heritage of the Second World War: Bombing in the forests and wetlands of the Koźle Basin. Environ. Sci. Antiq. 2021, 95, 417–434. [Google Scholar] [CrossRef]
  83. Maass, A.; Celauro, A.; Marsella, M. 3D shape of past human activities: The paradigmatic example of the mining landscape. In Proceedings of the Conference CAA2021 Digital Crossroads, Limassol, Cyprus, 14–18 June 2021. [Google Scholar]
Figure 1. (A) Area of Interest (AOI) and the fifteen districts (municipi and their conventional identification numbers) of the city of Rome (vector retrieved from [49] under a IODL 2.0 license); (B) detailed view of the AOI and the urban zones within the area (vector retrieved from [50]). The toponyms of the urban quarters used in the paper are reported in this map.
Remotesensing 15 02011 g001
Figure 2. Vectorization of geological units from the Carta Geologica del Comune di Roma, 1:50,000 [51], validated with the Carta Idrogeologica dell’area di Roma, 1:50,000 [52]. Geological Units: CIL (S. Cecilia Formation—conglomerate/sands/silts); FKB (formation of Madonna degli Angeli—Lava lithofacies); RED + PNR (red and black pozzolana); SFTba (silty-sandy and silty-clayey deposits), SKF (pyroclastic deposits); TAL (sequences of gravelly sandy deposits/volcanic elements); h (historical deposits) VSN1(formation of Villa Senni—Tufo Lionato); VSN2 (formation of Villa Senni—Pozzolanelle).
Remotesensing 15 02011 g002
Figure 3. Craters left by the bombardments of 1944 visible in a historical photograph (RAF_1944). Some of them are circled in red to exemplify their appearance. Photographs from © Istituto Centrale per il Catalogo e la Documentazione (ICCD)-Aerofototeca Nazionale, Fondo RAF, flight 1944.
Remotesensing 15 02011 g003
Figure 4. (A) Vectorization of quarry-related structures in the AOI from historical photographs; (B) The vector Bomb_Impacts_RAF_1944, categorized for the classes of bare soil and built areas.
Remotesensing 15 02011 g004
Figure 5. Display of the shapefile catalogs of the air-raid events that occurred during WWII through the use of vectors. (A) The Neighborhoods vector is displayed with a color-ramp on the Frequency attribute. The base polygon shapefile of the Neighborhoods layer comes from the vector retrieved from [72], whose attribute table was used to archive the historical information. (B) Detailed view of the AOI and direct surroundings with specific vectors that described the bombed roads, railroads, groups of buildings and neighborhoods. The baseline vector of roads and railroads comes from the CTR of Rome [73], shared under a cc-by license, whose attribute table was also used to archive historical information.
Remotesensing 15 02011 g005
Figure 6. The thematic map displays the development of urbanization in the AOI gathered from historical photographs and the selection of recent sinkhole events collected from the news recorded in a point-vector catalog. The base polygon vector of Buildings comes from the CTR of Rome [73] released under a cc-by license, whose attribute table has been used to record the dates of appearance of each building in the HAPs.
Remotesensing 15 02011 g006
Figure 7. Velocity maps obtained from the interpolation of PSs (2016–2021), extracted from CSK Descending (RD, in picture (A)) and Ascending (RA in picture (B)) datasets. The color ramp and min/max values are set to show ad compare clearly the trends of values.
Remotesensing 15 02011 g007
Figure 8. (A) Visualization of the denser residential zones in the ‘40s, expressed in square meters per cell, and the contemporary main traffic network (main roads and railways visible in RAF_1944); (B) display of the bombing-related vectors Roads and Railroads and Groups of Buildings over the Neighborhoods vector, expressed on the Frequency attribute in the AOI.
Remotesensing 15 02011 g008
Figure 9. (A) Vectorization of the craters of impact and classification of the diameters of the craters, expressed in m; (B) detail of the orthophoto and position of the profile and (C) extraction of a profile from a historical 3D model. Photographs RAF_1944 from © ICCD-Aerofototeca Nazionale, Fondo RAF, flight 1944.
Remotesensing 15 02011 g009
Figure 10. (A) Examples of heart-shaped and horn-shaped cave-in forms in the orthorectified photograms. (B) profile extraction of a heart-shaped pinge, visible in the plot below the figure. On the left side, the localization of the structures within the AOI border (red polygon). Photograph SARA_1927 from © ICCD-Aerofototeca Nazionale, Fondo SARA, flight 1927.
Remotesensing 15 02011 g010
Figure 11. (A) 3D visualization of the DSM and classification of the height in color ramps; (B) extraction and rendering of a profile (line in green) that clearly shows a central swelling, interpreted as the pillar or a wall. On the left side, the localization of the structure within the AOI border (red polygon).
Remotesensing 15 02011 g011
Figure 12. Top right: access ramp visible in the historical DSM (SARA_1927) in a prospective 3D view. The three profiles A, B and C are marked in red; below: profiles extracted from different points of the ramp (A,B,C). On the left side is the localization of the structures within the AOI border (red polygon).
Remotesensing 15 02011 g012
Figure 13. (A) Display of the vectored geological units and the pingen (centroids), classified for the distance from the RED-PNR unit; (B) display of the vectored geological units and the opencast quarries (centroids), classified for the distance from the RED-PNR unit; (C) distribution of quarries and pingen related to distance to the border of RED-PNR; (D) relative incidence of sinkholes and quarries related to all the geological units.
Remotesensing 15 02011 g013
Figure 14. (A) Standardized velocity map (CSK_ASC) and targets of the most relevant air strikes (Roads, Railways and strategic areas in Zones); (B) hotspot map calculated with the Bivariate Local Moran tool to visualize the correlation between the subsidence values recorded in the CSK-RD velocity map (cold clusters) and the higher bombardment frequencies (hot clusters) in the Low/High (LH) class, shown in the picture as blue cells.
Remotesensing 15 02011 g014
Figure 15. (A) Bomb impacts vector; (B) Bivariate Local Moran analysis to localize the correlation between the subsidence values recorded in the CSK-RA velocity map (cold clusters) and the hotspots of bomb impacts (hot clusters) in the Low/High (LH) class, shown in the picture as blue cells.
Remotesensing 15 02011 g015
Figure 16. (A) Detail of the pingen field, described by the vector Structures overlapped on the interpolation map (CSK_RA); (B) the corresponding localization of quarry-related structures in the photograph (SARA_1927). Photographs from © ICCD—Aerofototeca Nazionale, Fondo SARA, flight 1927.
Remotesensing 15 02011 g016
Figure 17. (A) Bivariate Local Moran analysis output shows the areas of inverse correlation between the cold spots of the CSK_RA velocity map and the hotspots of the quarry-related structures, shown in the Low/High (LH) class as blue cells and (B) heatmap of the centroids of historical quarry-related structures.
Remotesensing 15 02011 g017
Figure 18. (A) 3D prospective view of the Pléiades-HR orthophoto on the DSM and of the profile (in red); (B) relative comparison of the profile shape extracted from the DSM SARA_1927 with the profile shape from DSM Pléiades—HR (stereopairs of January 2017).
Remotesensing 15 02011 g018
Disclaimer/Publisher’s Note: The statements, opinions and data contained in all publications are solely those of the individual author(s) and contributor(s) and not of MDPI and/or the editor(s). MDPI and/or the editor(s) disclaim responsibility for any injury to people or property resulting from any ideas, methods, instructions or products referred to in the content.

