Article

Monitoring Glacier Lake Outburst Flood (GLOF) of Lake Merzbacher Using Dense Chinese High-Resolution Satellite Images

National Disaster Reduction Center, Ministry of Emergency Management, Beijing 100124, China
*
Author to whom correspondence should be addressed.
Remote Sens. 2023, 15(7), 1941; https://doi.org/10.3390/rs15071941
Submission received: 25 February 2023 / Revised: 3 April 2023 / Accepted: 4 April 2023 / Published: 5 April 2023

Abstract

:
Establishing an effective real-time monitoring and early warning system for glacier lake outburst floods (GLOFs) requires a full understanding of their occurrence mechanism. However, the harsh conditions and hard-to-reach locations of these glacial lakes limit detailed fieldwork, making satellite imagery a critical tool for monitoring. Lake Mercbacher, an ice-dammed lake in the central Tian Shan mountain range, poses a significant threat downstream due to its relatively high frequency of outbursts. In this study, we first monitored the daily changes in the lake area before the 2022 Lake Mercbacher outburst. Additionally, based on historical satellite images from 2014 to 2021, we calculated the maximum lake area (MLA) and its changes before the outburst. Furthermore, we extracted the proportion of floating ice and water area during the period. The results show that the lake area of Lake Mercbacher would first increase at a relatively low speed (0.01 km2/day) for about one month, followed by a relatively high-speed increase (0.04 km2/day) until reaching the maximum, which would last for about twenty days. Then, the lake area would decrease slowly until the outburst, which would last five days and is significant for early warning. Moreover, the floating ice and water proportion provides more information about the outburst signals. In 2022, we found that the floating ice area increased rapidly during the early warning stage, especially one day before the outburst, accounting for about 50% of the total lake area. Historical evidence indicates that the MLA shows a decreasing trend, and combining it with the outburst date and climate data, we found that the outburst date shows an obvious advance trend (6 days per decade) since 1902, caused by climate warming. Earlier melting results in an earlier outburst. This study provides essential references for monitoring Lake Mercbacher GLOFs and building an effective early warning system.

1. Introduction

Glacial deglaciation is becoming a worldwide phenomenon due to accelerating global warming [1,2,3,4]. As glaciers recede, their stability decreases, and they release stored water, which can lead to glacial hazards [5,6,7]. The melting water of glaciers, combined with overdeepenings in former glacier beds, has caused the global glacier lake volume and quantity to increase rapidly [8,9,10]. In fact, it has been suggested that the lakes formed from melting glaciers have increased by 50% in just 30 years (1990–2018). Dammed by abandoned moraines and ice, glacier lakes are susceptible to outbursts and can cause severe damage to human settlements and infrastructure downstream [7,11,12,13,14,15]. Statistics show more than 6300 people have died of glacier lake outburst floods (GLOFs) since the 1500s in High Mountain Asia alone [14]. Moreover, 15 million people globally are exposed to impacts from potential GLOFs, especially in High Mountains Asia (HMA) [13]. Real-time monitoring and early warning systems can effectively forecast active and high-frequency floods resulting from ice dam breaches [9]. However, GLOFs dynamics are challenging to measure and quantify due to unpredictable triggers and hard-to-reach locations [16]. Fortunately, increasingly detailed digital topographic data and satellite imagery provide more possibilities in GLOF monitoring [17,18,19].
Located in the upper reaches of the Kumarik River in Kyrgyzstan, a tributary of the Aksu River in China, Lake Merzbacher is the largest glacial lake in the central Tien Shan mountain range of northwestern HMA [19]. The lake derives its water from the melt of the Inylchek Glacier and is divided into two parts: an upper lake and a lower lake [20]. The lower lake is ice-dammed and much larger than the upper one during the warm season when it is filled with water. Studies and reports have shown that there were 80 recorded outbursts of lower lake from 1932 to 2021 [21]. The average elevation of the lower lake surface is about 3380 m, and the drop from the lake to 200 km far away downstream communities is approximately 2000 km. This substantial drop in elevation makes Lake Merzbacher outburst floods to be more destructive and pose a significant threat to human settlements and infrastructure downstream.
Lake Merzbacher, first discovered by Gottfried Merzbacher in 1903 [22], has been the focus of research on its formation and outburst mechanism since recording its first outburst flood in 1931. The mystery of the outburst mechanism was not solved until Ajrapet demonstrated the process in 1971, revealing that the northern Inylchek Glacier dammed the lake, and a hidden stream existed under the ice dam. Lake Merzbacher exhibits a unique outburst mechanism that differs from other glacial lakes. Research has shown that the northern Inylchek Glacier dams the lake, and a hidden stream flows beneath the ice dam. As the lake fills with water, the dam gradually rises, and water flows downstream through the hidden stream [23]. This process provides a short window of opportunity for early warning. Previous studies have explored the potential methods to capture this signal. An understanding of the outburst probability is central to early warning, and thus predicting the outburst probability of GLOFs draws much academic attention. By selecting the main factors which link to dam failure, the qualitative probability of dam failure was derived and mapped over a large region [24,25]. However, identifying potentially dangerous lakes is crucial to early warning efforts. Xie et al. [19] first build an index to monitor the outburst of Lake Merzbacher based on time series remote sensing images before and after the flood. Nonetheless, the temporal–spatial resolution of available satellite images can hardly capture all the details before the outburst of Lake Merzbacher. One possible scenario is that there would not be enough satellite shreds of evidence before the outburst, especially considering the frequent clouds in this region. Therefore, continuous monitoring of the lake before an outburst is vital for the timely and accurate forecast of disasters.
Research has identified four distinct periods in the outburst process of Lake Merzbacher during a GLOF: icefall, quick water storage, early warning, and post-drainage. However, the characteristics and duration of the four periods are still unclear. One chief reason for this is that there are not enough available images. Glacial lakes are often located in alpine regions, where the cloudy weather decreased the availability of the time series satellite images. Furthermore, widely used satellite images, including MODIS, Landsat, and Sentinel, are deficient for the long revisit period and thus can hardly support GLOF monitoring. During the past twenty years, China’s Earth observation activities have rapidly developed, creating a spaceship fleet resembling those from NASA, ESA, or JAXA, forming Chinese Earth Observation Satellite (CEOS) constellations [26,27]. Five major CEOS constellations are ready for use, including GaoFen satellites and HuanjingJianzai satellites, which have been widely used in land cover mapping [28,29,30,31]. The high resolution and short revisit period of (CEOS) constellations provide more opportunities in time series remote sensing monitoring. This study aims to obtain a comprehensive record of the Lake Merzbacher outburst using dense Chinese satellite images, and to analyze key elements during the outburst flood process, ultimately quantifying warning signals.

2. Materials and Methods
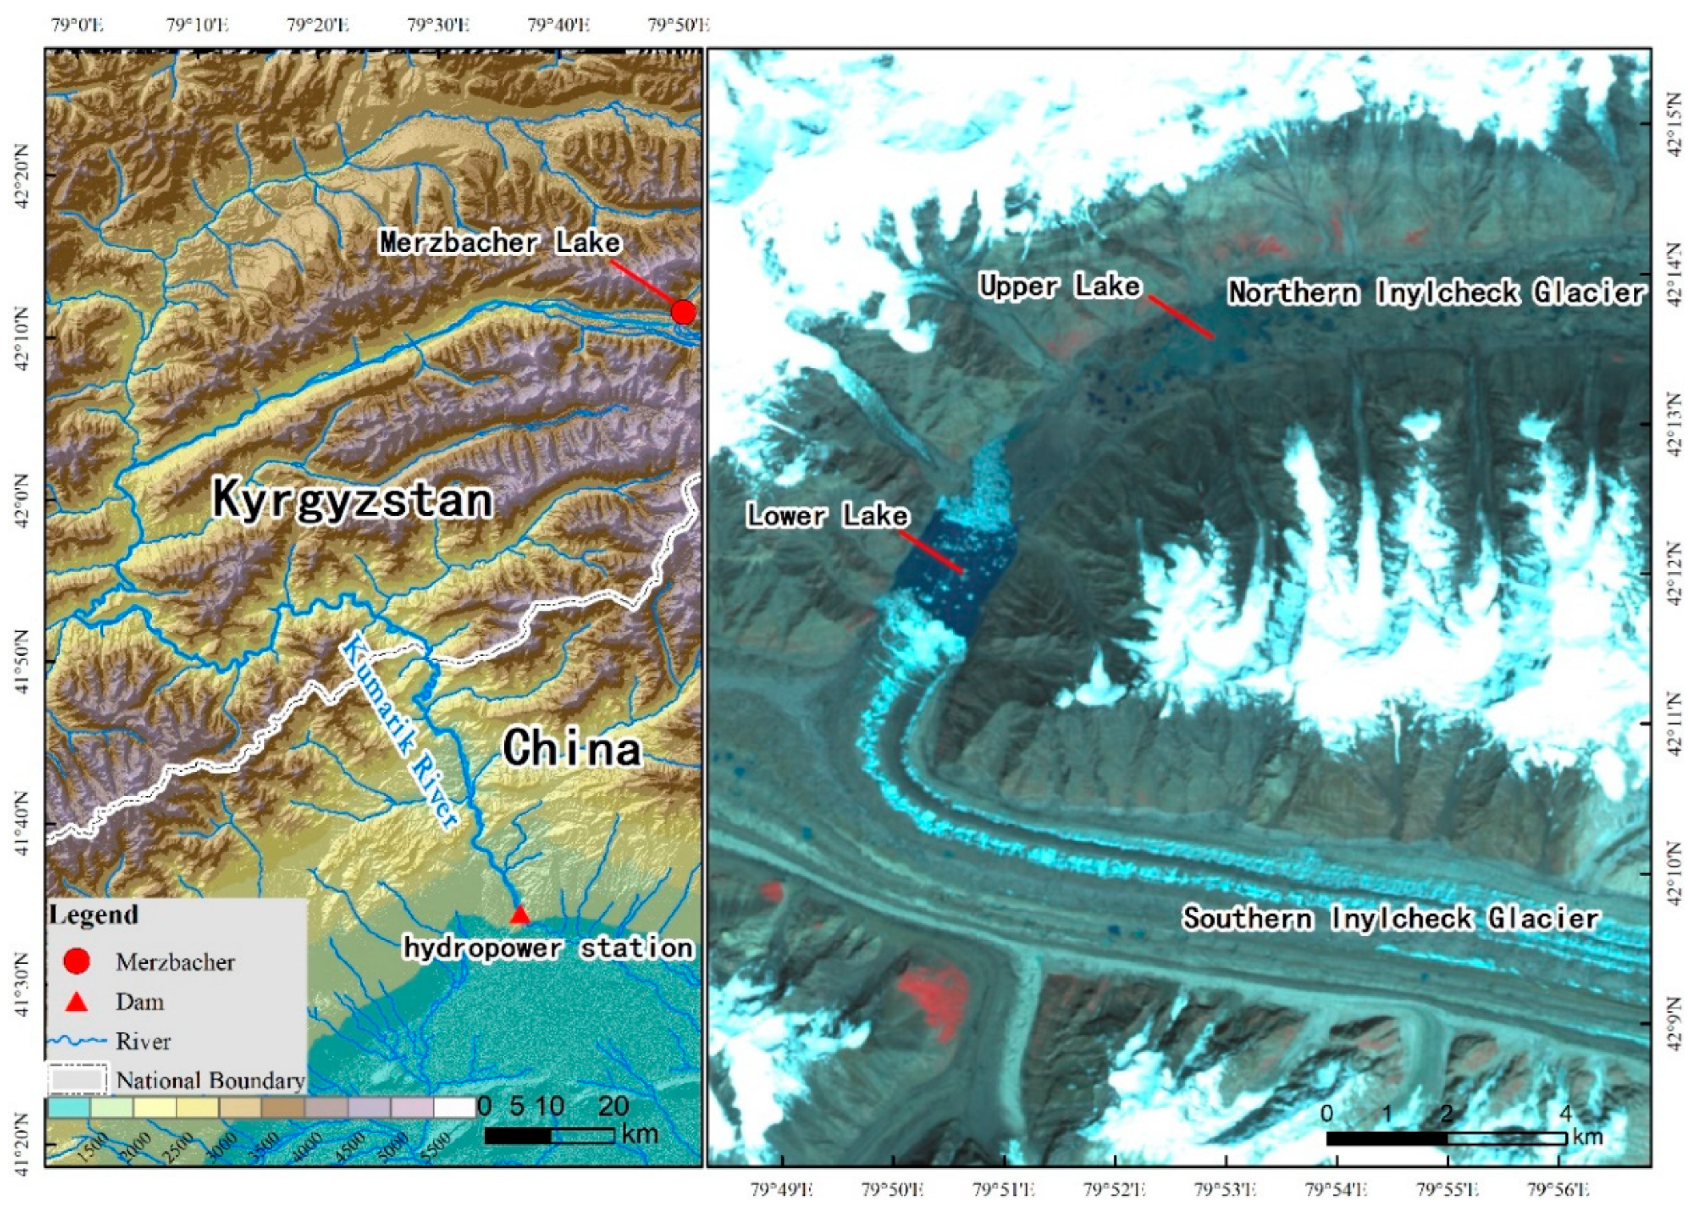
2.1. Study Area

Lake Merzbacher, located in the Inylchek Region at 79°52′E and 42°13′N, is situated in the central Tien Shan mountain range in Kyrgyzstan and close to the Chinese border [19,20]. It is considered the largest moraine lake in Central Asia, which was formed by Inylchek Glacier and first discovered and named by the German explorer Gottfried Merzbacher in 1903 [32]. Specifically, the northern branch of the Inylchek Glacier, with a length of 41 km and an area of 247 km2, retreat and the southern branch of the Inylchek Glacier, with a length of 61 km and an area of 574 km2, expansion together formed this glacier lake (Figure 1). This glacial lake plays a vital role in preventing the direct runoff of North Inylchek Glacier drainage water into the valley [33]. Lake Merzbacher comprises two small lakes connected by the Merzbacher River [32]: the upper one at 3400 m and the lower one at 3300 m. Lower Lake Merzbacher, dammed by the Southern Inylchek Glacier and larger than Upper Lake Merzbacher, is responsible for the glacier lake outburst flood (GLOF) that occurs regularly and has shown a decreasing trend since the beginning of the 20th century [34].
Located in the upper reaches of Kunmaalik River in Aksu Prefecture, Xinjiang Uygur Autonomous Region, Lake Merzbacher’s GLOF poses a significant threat to the downstream inhabitants. The lake’s primary water source is from the melting of glaciers and snow during the ablation season, starting in early March and ending in September due to the semi-continental climate. This is precisely why glacial lake outburst floods (GLOFs) occur more frequently during this season [35]. To monitor the Lake Merzbacher GLOF, Xiehela hydrographic station was established in 1956, which is downstream of the lake. Since then, outburst records have occurred almost every year. After extensive research by predecessors, the mechanism behind GLOFs is no longer a secret [36]. When the ice dam of a glacial lake lifts due to a continuous increase in water, the lake enters the drainage process. The concealed water channels beneath the dam open up, connecting the lake water with the outside world, and the lake water is rapidly drained.

2.2. Data Sources

  • Satellite data: All the satellite images were obtained from China Centre for Resources Satellite Data and Application, Beijing, China, (https://data.cresda.cn/#/home, accessed on 24 February 2023), except for Beijing-2 (BJ-2), which was obtained from Twenty First Century Aerospace Technology Co., Ltd., Beijing, China (https://www.21at.com.cn/, accessed on 24 February 2023) (Table 1).
Gaofen-1 (GF-1): The GF-1 satellite, the first satellite in the China high-resolution earth observation system, was launched on 26 April 2013, and was put into use on 30 December 2013 [37]. Two high-resolution (HR) cameras (2 m resolution panchromatic/8 m resolution multispectral cameras) and four wide field of view (WFV) cameras (16 m resolution multispectral cameras) were equipped with GF-1, which have four spectral channels (blue, green, red) distributed in the visible and NIR spectral domain ranging from 450 to 890 nm (Table 2) [38]. The repetition cycle of GF-1 WFV data can reach four days by combining the four cameras.
Gaofen-6 (GF-6): The GF-6 satellite was launched on 2 June 2018, and was officially put into use on 21 March 2019. GF-6 is a low-orbit optical satellite equipped with a panchromatic/multispectral high-resolution (PMS) camera and a wide field view (WFV) camera (Table 3) [39,40]. This study used the GF-6 WFV and PMS images obtained on 5 August 2020 and 13 July 2021. GF-6/WFV with 16 m resolution has 8 bands, except for one coastal band (400~450 nm) and three visible bands (450~520 nm, 520~590 nm, and 630~690 nm). Same as GF-1, the red-edge I band (0.69~0.73 μm), red-edge II band (0.73~0.77 μm), a purple band (0.40~0.45 μm), and a yellow band (0.59~0.63 μm) are newly added bands. GF-6/PMS contains one panchromatic band with 2 m resolution and four multispectral bands with 8 m resolution.
Gaofen-7 (GF-7): The GaoFen-7 (GF-7) satellite, launched on 3 November 2019, carries two laser altimeters with the full waveform for global stereo mapping and is the first submeter-level resolution mapping satellite in the Medium- and Long-Term Development Plan for China’s Civil Space Infrastructure (2015–2025) [41,42,43]. The GF-7 satellite operates in a sun-synchronous orbit with a designed lifespan of 8 years. Equipped with two line-array stereo cameras, it can effectively obtain full-color stereo images with a width of 20 km and a resolution better than 0.8 m and multispectral images with a resolution of 3.2 m. The two-beam laser altimeter on board conducts ground observation with a 3 Hz observation frequency, and the ground footprint diameter is less than 30 m. It acquires full-waveform data with a sampling frequency higher than 1 GHz. The laser altimeter system is designed to improve the elevation accuracy without ground control points of the two line-array stereo mapping cameras [44].
HuanjingJianzai-2 A/B (HJ-2A/B): As the successors of HuanjingJianzai-1 (HJ-1) A/B satellites, HuanjingJianzai-2 A/B (HJ-2A/B) are in a sun-synchronous orbit, with both satellites having the same technical status and a design life of 5 years [45,46]. Each satellite has 4 optical payloads, including a 16 m camera, a hyperspectral imager, an infrared camera, and an atmospheric correction instrument. The 16 m camera payload consists of four visible-light CCD cameras, which can provide a multispectral image with a width of 800 km through field-of-view stitching. The hyperspectral imager has a width of 96 km, while the infrared camera has a width of 720 km. For atmospheric radiation correction, the atmospheric correction instrument can synchronously acquire atmospheric multispectral information with the same field of view as the 16 m camera in orbit.
Beijing-2 (BJ-2): The Beijing-2 satellite (BJ-2) was successfully launched from the Satish Dhawan Space Center in Sriharikota, India, at 0:28 Beijing time on 11 July 2015 (16:28 UTC on 10 July 2015), carried by the PSLV-XL carrier rocket to a 651-km sun-synchronous orbit. The Beijing-2 constellation consists of three 0.8 m resolution optical remote sensing satellites [47]. The satellite, manufactured by Surrey Satellite Technology Ltd. (SSTL) in the UK, has a 7-sided structure, weighs about 450 kg, and is about 2.5 m high. The SSTL-300S1 agile platform can provide a fast-swinging ability of 45 degrees and in-orbit realization of 5 imaging modes, including multi-scene, strip, along-track stereo, cross-track stereo, and regional imaging. The VHRI-100 imaging instrument provides in-orbit panoramic and multispectral images with a swath width of about 24 km and a resolution of 0.8 m (ground sampling distance (GSD)) for panchromatic and 3.2 m for blue, green, red, and near-infrared multispectral images.
2.
Climate data: The land surface temperature data used in the article come from the ERA5-LAND reanalysis dataset provided by the European Centre for Medium-Range Weather Forecasts (ECMWF) [48]. ERA5-LAND uses the simulated land–atmosphere variables from the ECMWF’s fifth-generation reanalysis product ERA5 as forcing and is obtained using the modified land surface hydrology model HTESSEL and CY45R1. Although it has not undergone data assimilation, the observational data indirectly affect its simulation results. Compared with ERA5, ERA5-LAND has a higher spatial resolution, with a horizontal resolution of up to 0.1° (9 km) and a temporal resolution of 1 h. Due to the limitation of currently available data (https://developers.google.com/earth-engine/datasets/catalog/ECMWF_ERA5_LAND_MONTHLY_BY_HOUR#description, accessed on 24 February 2023), the hourly land surface temperature data of ERA5-LAND from 1 January 1981 to 1 December 2022 in the study area was used in the study.

2.3. Methods

  • Processing of the satellite images and climate data: Preprocessing methods are shared in multispectral data of GF-1, GF-6, HJ-2 A/B, and BJ-2, including five steps: (1) Radiometric calibration; (2) Atmospheric correction; (3) Orthorectification; (4) Image fusion; (5) Image registration. The radiometric calibration and atmospheric correction were performed with the ENVI FLAASH module [44]. After finishing the preprocessing, combining 2 m resolution panchromatic and 8 m resolution multispectral data by the ENVI Gram-Schmidt Pan-Sharpening module to enhance the spatial resolution of GF-1, GF-6, and BJ-2 images [45]. DSM with a 2 m spatial resolution was derived from GF-7 by using the rational polynomial coefficient (RPC) model [41]. Time series temperature data were extracted by Google Earth Engine (GEE) cloud platform (https://earthengine.google.com/, accessed on 24 February 2023).
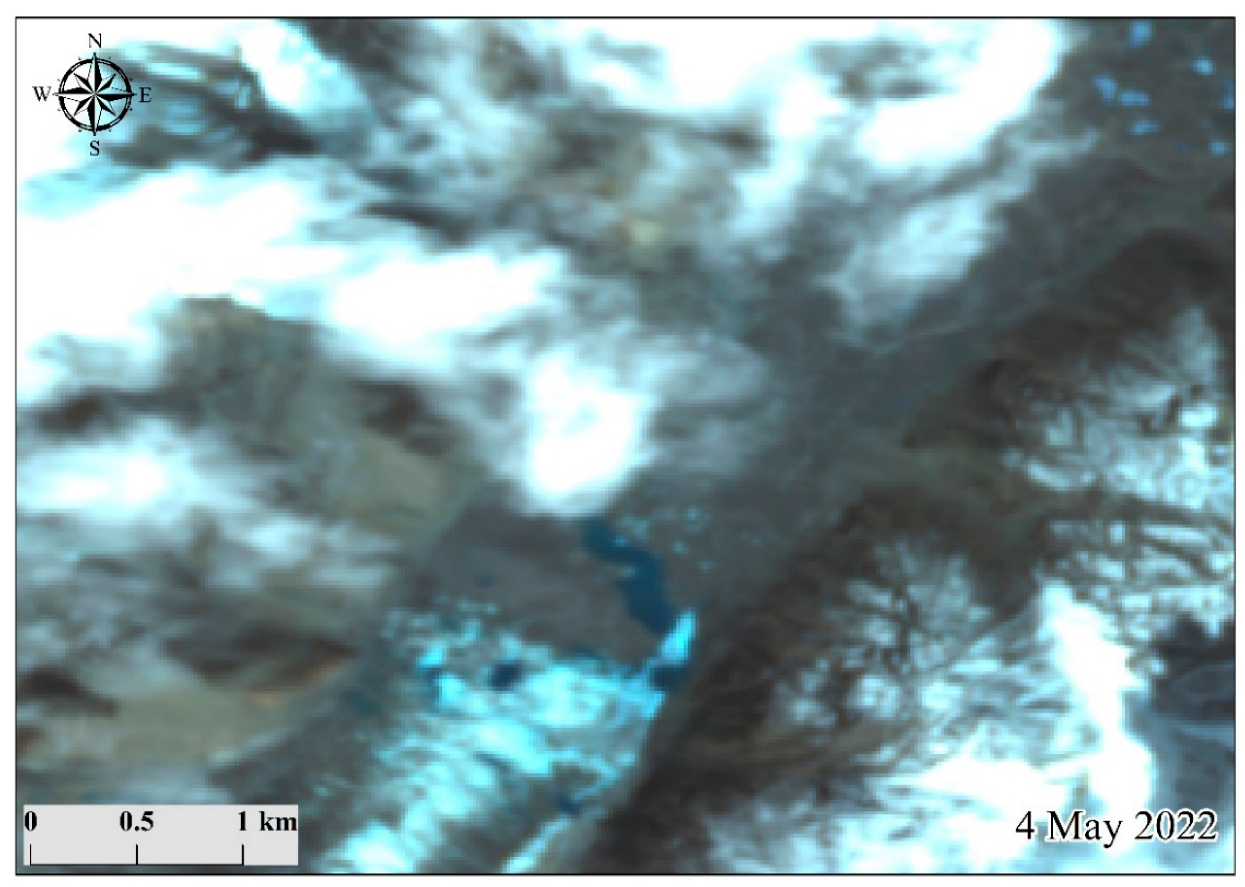
  • Lake area extraction and changes analysis. The visual interpretation method was applied in this study. To improve the interpretation accuracy, the normalized difference water index (NDWI) [47] was introduced to better distinguish water bodies (Figure 2). The NDWI can enhance the identification of water bodies and effectively distinguish water bodies from floating ice. By using the green channel (maximum reflectance of water) and the near-infrared (NIR) channel (minimum reflectance of water), the NDWI was calculated as below:
    N D W I = ρ G r e e n ρ N I R ρ G r e e n + ρ N I R
Lake area changes, including water and ice area changes, were calculated in ArcGIS 10.8. To characterize the direction of water surface changes, the centroid shift method was used to describe the expansion process of the lake surface (Figures S1 and S2).
3.
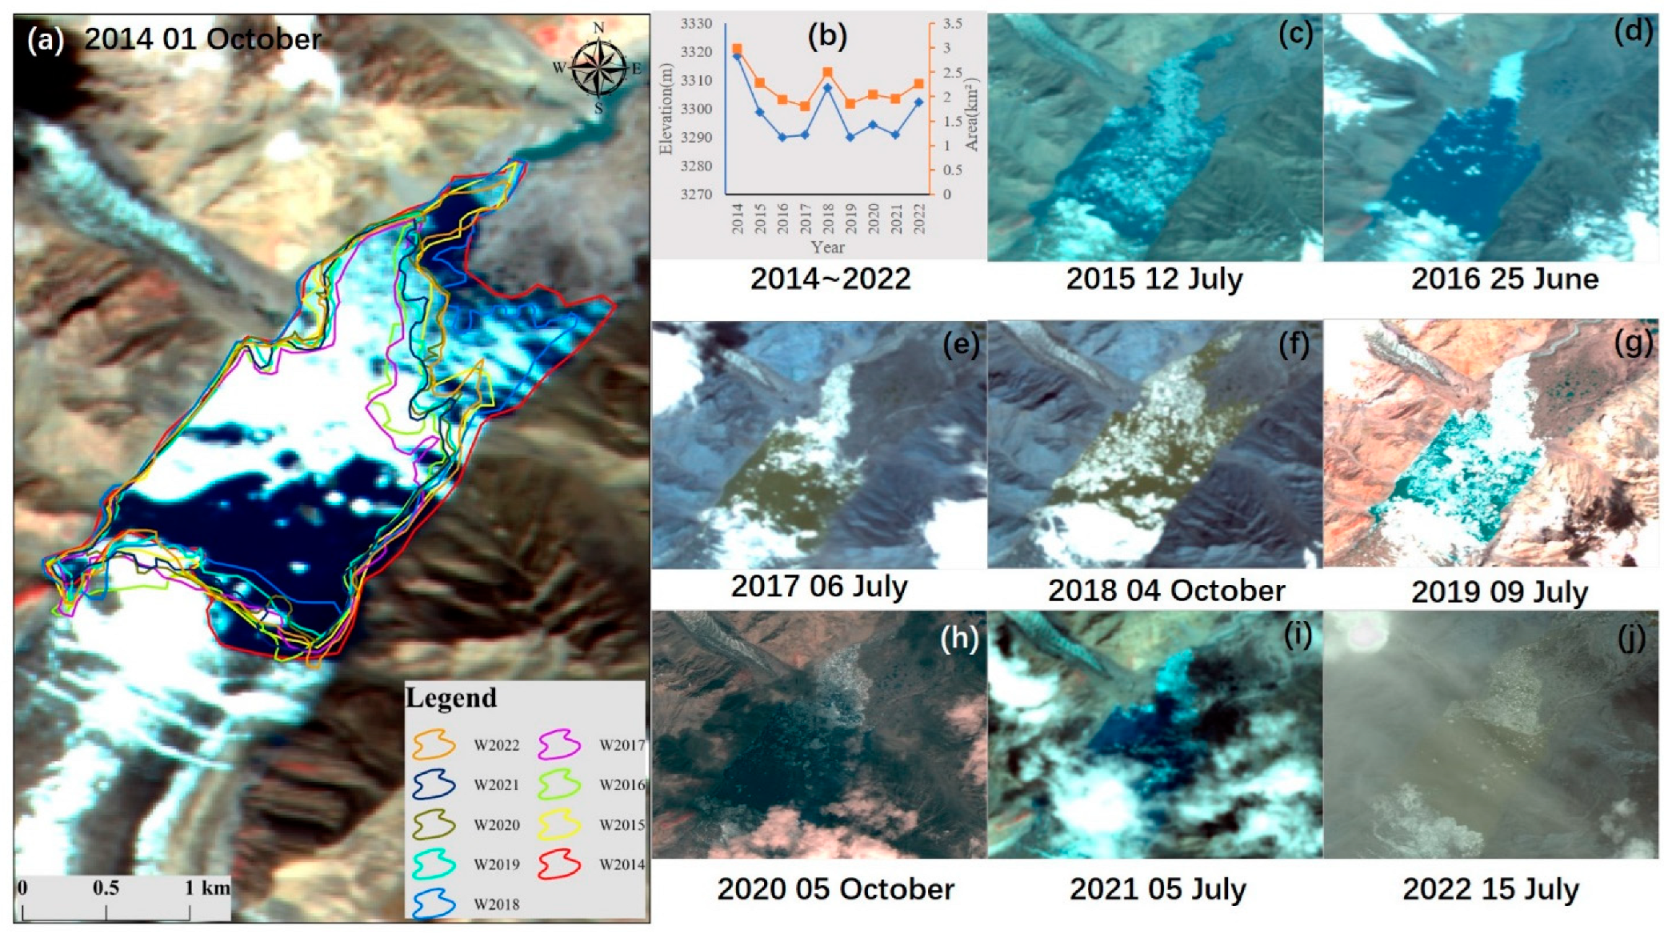
Uncertainty assessment of glacier lake area. Visual interpretation was employed in extracting the lake area, and errors are unavoidable. Research has shown that mixed pixels caused by spatial resolution are a key factor in error sources. Using an error of one pixel on either side of the defined lake boundary is more appropriate [49]. Therefore, the uncertainty of the individual lake area can be calculated as follows:
e = n 1 / 2 × m
R = e A × 100 %
where e is the absolute area error (m2) of each glacier lake, n represents the number of pixels on the lake boundary (approximately the ratio of lake circumference to spatial resolution), m is the area of each pixel in the remote sensing product, R is the relative error of a single lake, and A is the area of the lake. The area error obtained from the above equation shows that the total absolute area error of Lake Merzbacher is 0.08 km2, the average relative error is 0.22%, and the relative area error is between 0.2% and 0.68% (Table 4).

3. Results

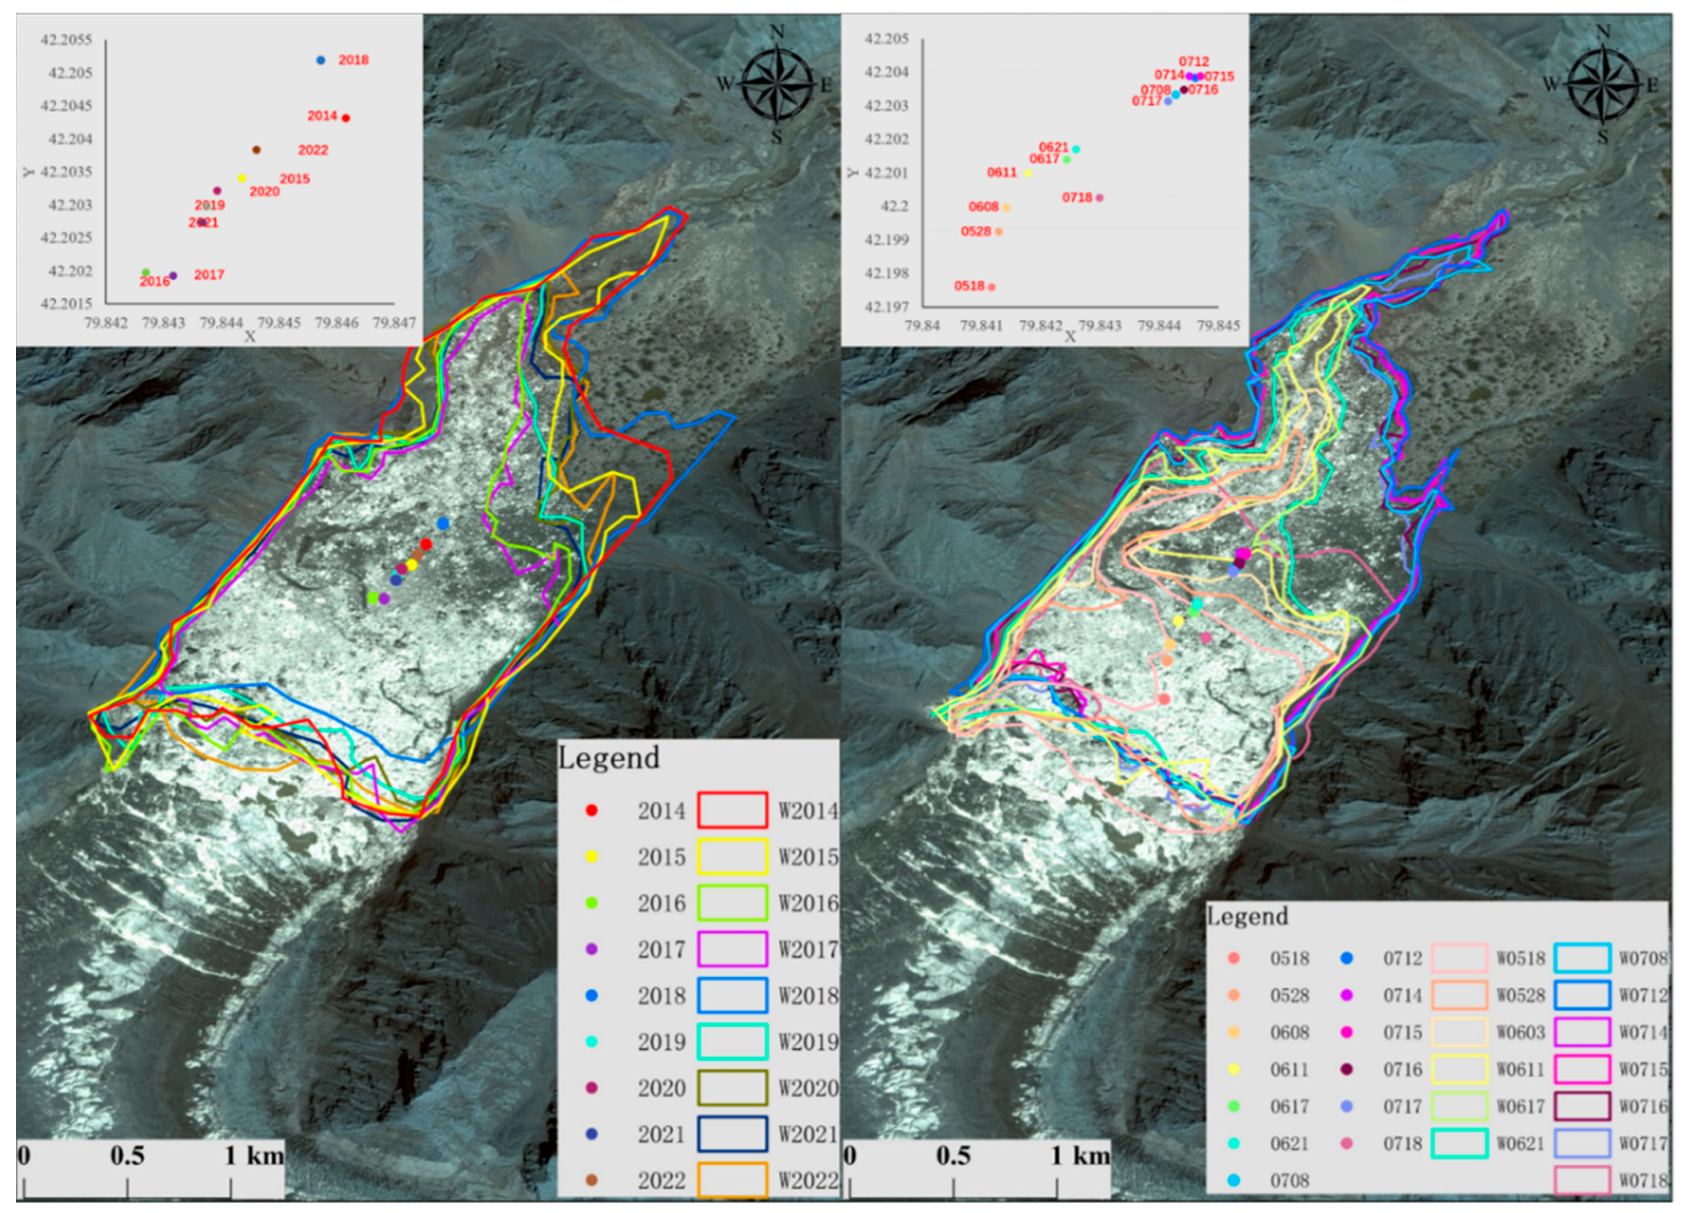
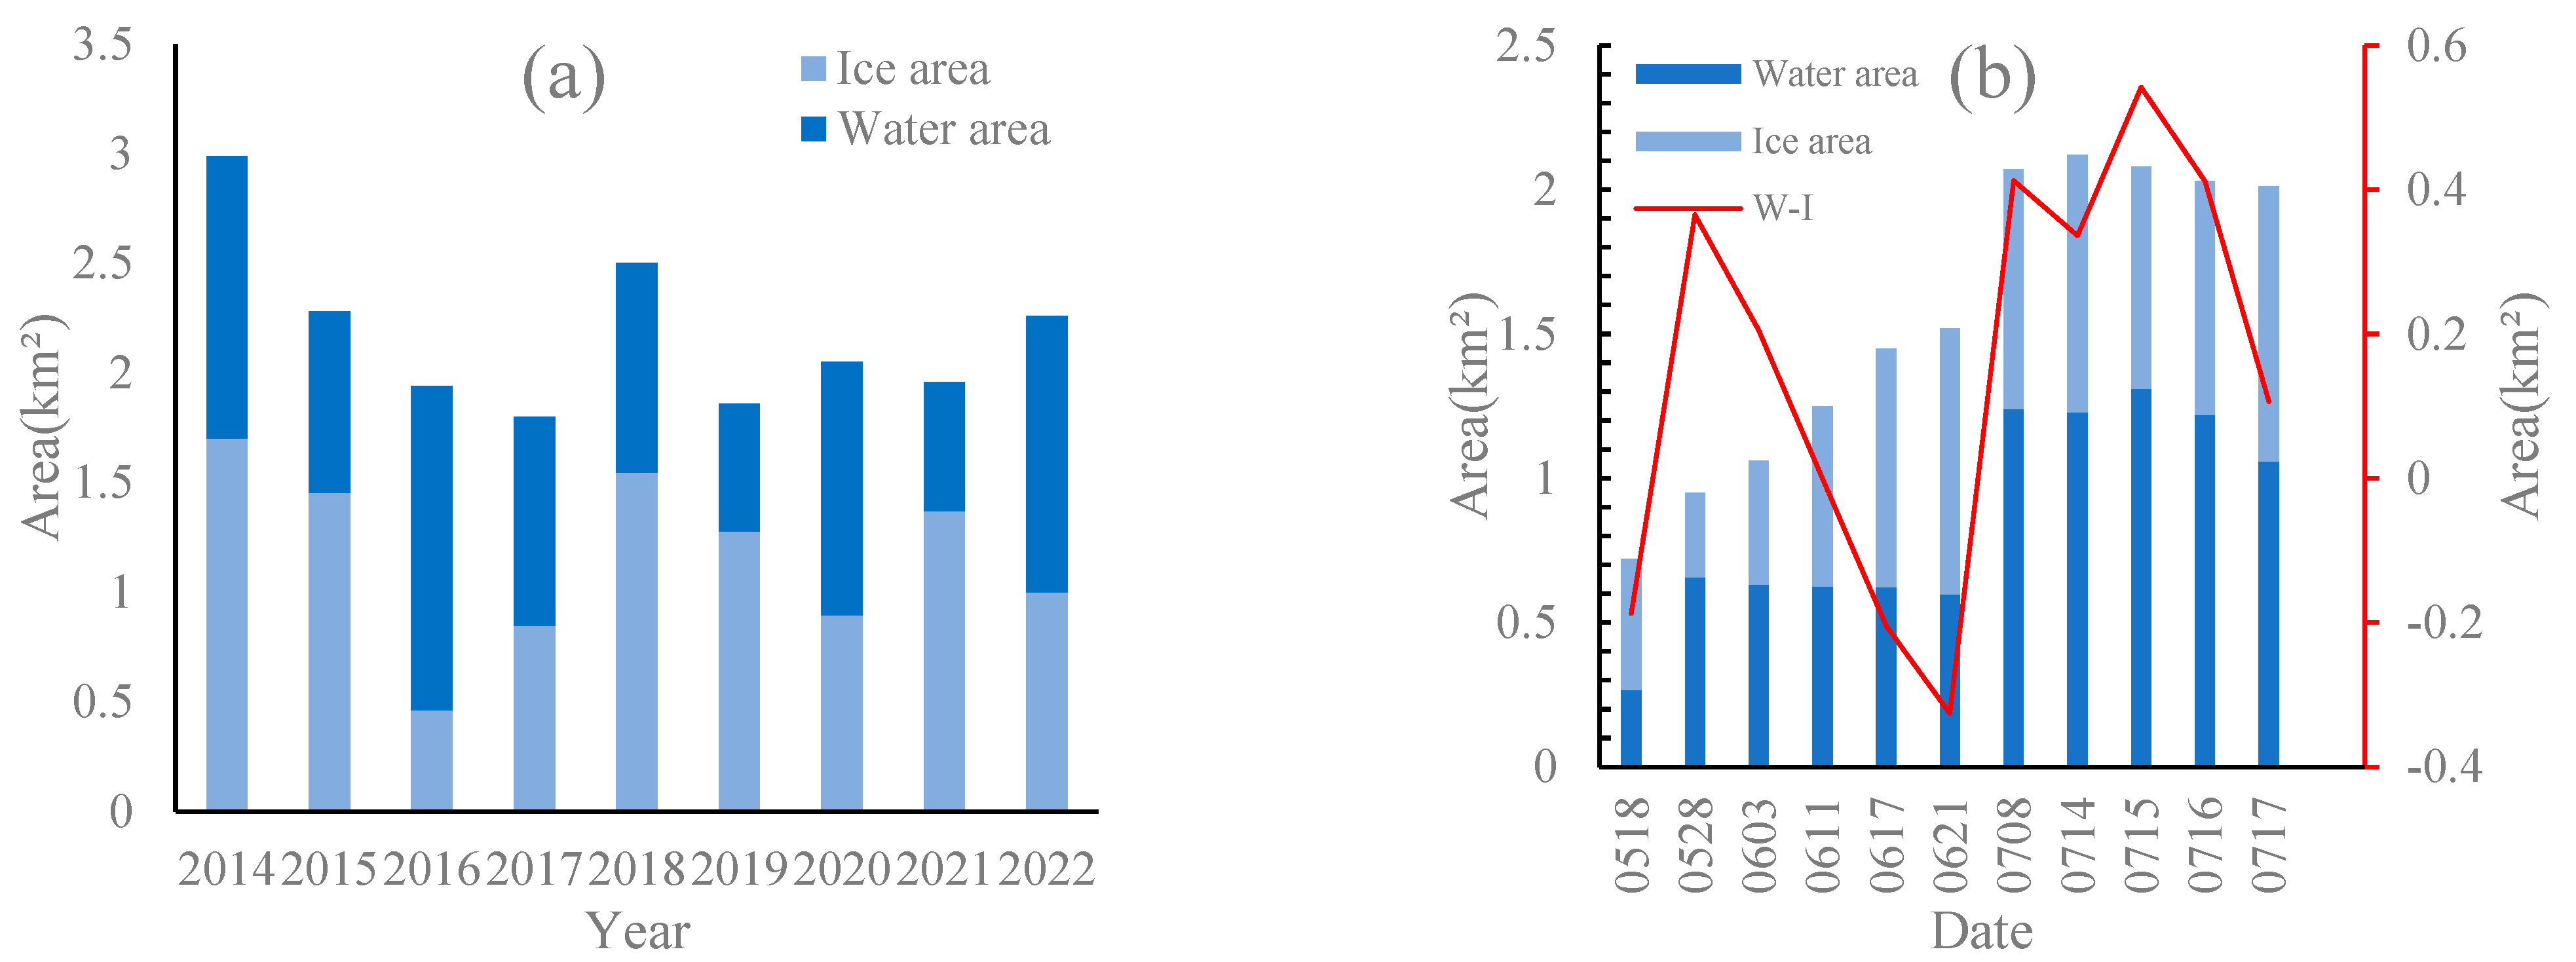
3.1. Maximum Lake Area (MLA) Change before Outburst from 2014 to 2022

Previous research has shown that the area of the lake continues to expand until the outburst occurs, and once the lake surface area starts to decrease, the GLOF event is imminent. Therefore, monitoring changes in the lake area prior to an outburst is crucial. Analysis of satellite images during the research period revealed a decreasing trend in the maximum lake area (MLA) from 2014 to 2021 (Figure 3b). Over the past nine years, the average MLA was 2.07 km2. The largest MLA was 2.99 km2 on 1 August 2014 (Figure 3a), and the smallest MLA was 1.67 km2 on 12 July 2016 (Figure 3d). From 2014 to 2022, the MLA occurred in July, except in 2014 and 2018 two years, which occurred in August. From the perspective of the average elevation of the lake, which shows a similar change trend as the MLA change from 2014 to 2022 (Figure 3b). The highest and the lowest average elevation of the MLA were observed in 2014 (3318.55 m) and 2019 (3289.97 m), respectively.
Based on the observation of Lake Merzbacher GLOF in 2022, which started at least from 18 May and lasted for about two months (Figure 4). Initially, water coalesces into the southern part of the lake by gravity with an area of 0.72 km². With the lake increasingly receiving meltwater from snow and ice, the lake area continues to increase. From 18 May to 28 May, the lake area increased at a rate of 0.023 km²/d. During the next 11 days (28 May~8 June), the lake area increased at a relatively low speed compared to the first ten days, with a rate of 0.01 km²/d. After that, the lake expanded rapidly from 8 June to 17 June, with a rate of 0.04 km²/d. For some time after that (17 June~8 July), the lake area increased rapidly, with a speed of 0.03 km²/d. The lake area reached its maximum in 12 July with a rate of 0.03 km²/d from 08 July to 12 July. However, the lake area decreased from 2.19 km² on 12 July to 2.12 km² on 14 July. In the next four days (15 July~18 July), the lake area continued to shrink with an average rate of 0.21 km²/d, especially during the period from 17 July to 18 July, and the lake area decreased rapidly from 2.01 km² to 1.28 km².
The centroid changes of the lake area from 2014 to 2022 are presented in Figure 5. The centroid of the maximum lake area in the nine-year period was mostly located along the central line in a direction from the northeast to the southwest. When using the southwestern boundary as a reference frame, the farthest centroid of the maximum lake area was observed in 2018, measuring 1.2 km from the centroid point to the southernmost boundary. Second to 2018, the centroid in 2014 was the second farthest centroid of the maximum lake area during the research period. Simultaneously, the two largest lake areas occurred in the above two years. Notably, even in the years with the largest lake area, the centroid of the maximum lake area remained within a certain distance from the southernmost boundary. Based on the dense records in 2022 prior to the outburst, from 18 May to 28 May, the lake area expanded 0.2 km toward the northeast. In the following 14 days (28 May to 11 June), it continued to expand approximately 0.2 km to the northeast, and from 11 June to 21 June, it continued to expand northeastward with a distance of about 0.1 km. Before reaching its maximum, the lake area expanded approximately 0.3 km northeastward. Subsequently, the lake area began to shrink back toward the southwestern boundary. For the first few days (12 July to 15 July), the centroid of the lake area had little change. However, since 15 July, a significant retreat of the centroid of the lake area was observed. The most significant retreat occurred in a 24 h period from 17 July to 18 July.

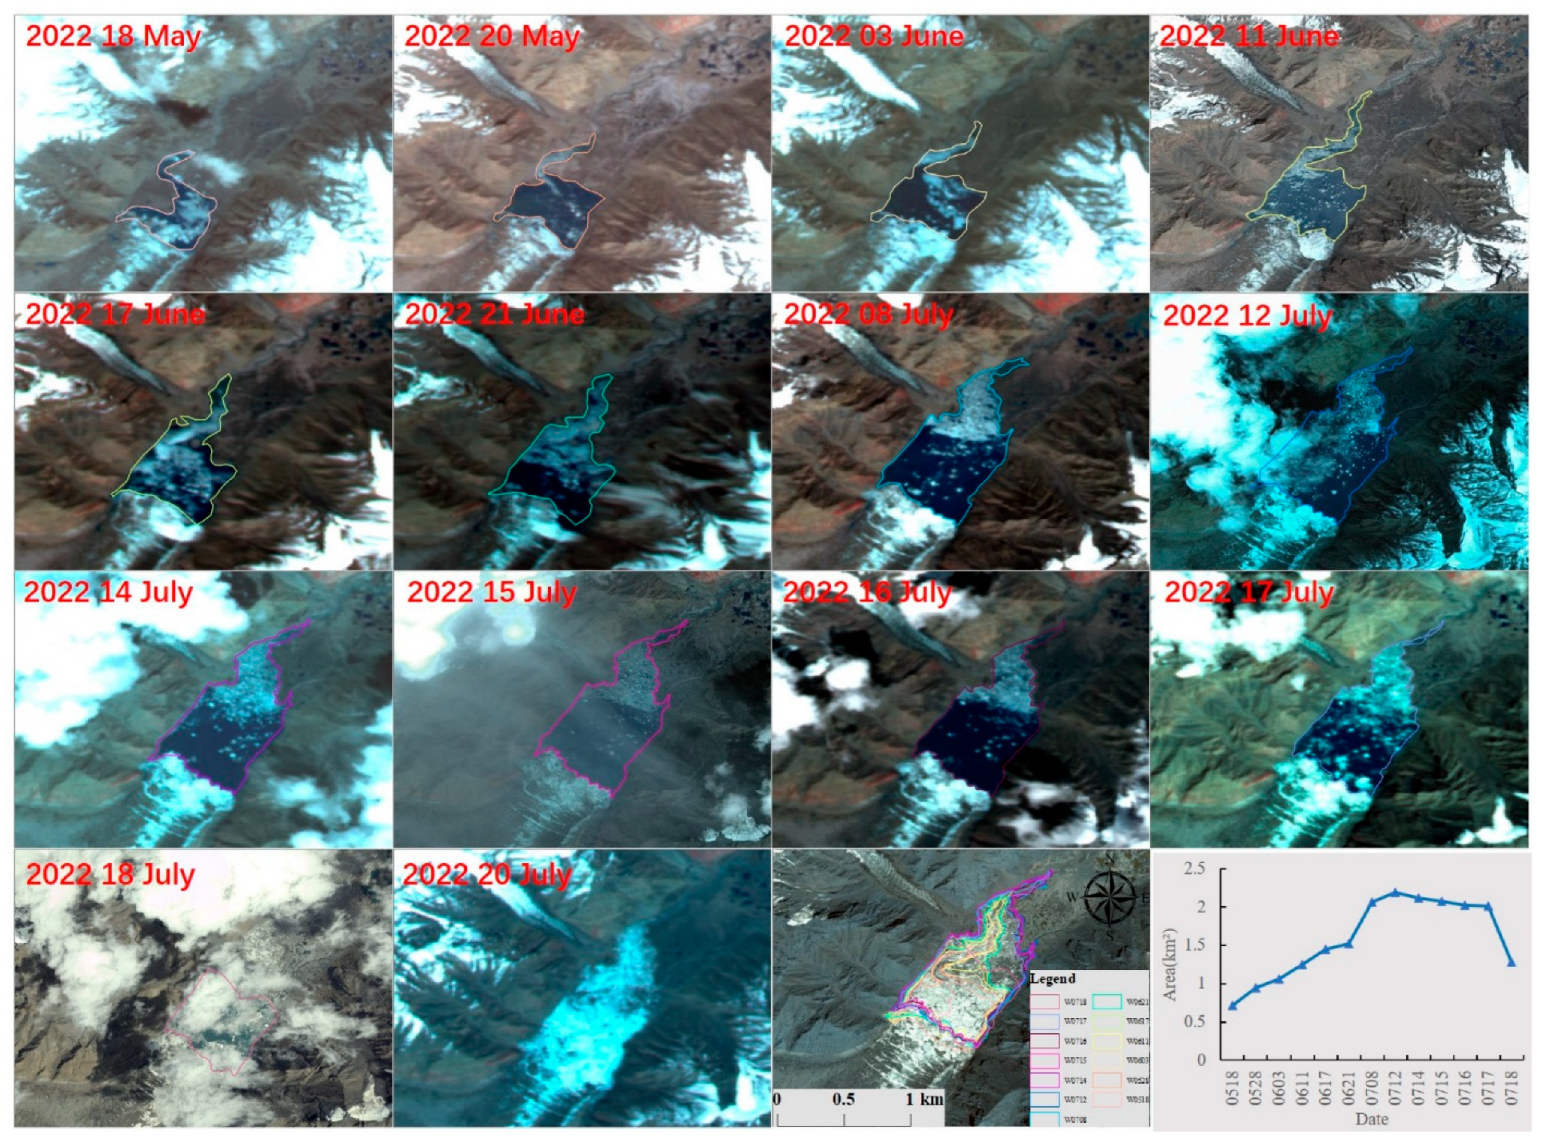
3.2. Using Lake Area and Ice Cover to Monitor Hazard of Glacier Lake Outburst Flood of Lake Merzbacher

Previous research has divided the entire outburst process of Lake Merzbacher into four stages: icefall (Stage I), quick water storage (Stage II), early warning (Stage III), and post-drainage (Stage IV). Therefore, the ice cover can be an essential index to predict the outburst. By setting the NDWI threshold value, we classified the lake as water and an ice area, two classes. As depicted in Figure 6, the ice area accounted for 53.3% of the total lake area on average from 2014 to 2022. The ice area proportion is the maximum (69.87%) in 2021, while that of 2016 is the minimum (23.83%). According to the records of the outburst date from 2014 to 2021, Lake Merzbacher outburst on 10 October, 9 July 2015, 25 June 2016~2 July 2016, 7 July 2017, 12 October 2018, 9 July 2019~12 July 2019, 7 October 2020, and 9 July 2021. During the first stage, the ice area is generally higher than the water area. In the second stage, the water area will expand rapidly, and the ice at the bottom of the lake will emerge from the water. Thus, the ice area will expand simultaneously before the outburst. When the dam body is raised, the lake area will shrink, and more floating ice will emerge, which indicates the lake has entered an early warning stage. As shown in Figure 6, water areas in 2014, 2015, 2018, 2019, and 2021 are smaller than ice areas, indicating that these images may have been captured during Stage II or Stage III.
Time series images captured in 2022 before and after the outburst provide more details. At the beginning of the observation period, the lake area was mainly covered by ice on 18 May. As the ice melted, the water area gradually increased and exceeded the ice area on 28 May and 3 June. During the storage process of the glacial lake, the ice originally deposited at the bottom of the lake basin was lifted by the water body and floated on the surface of the lake, resulting in ice dominating the lake area again on 17 June and 21 June. As the meltwater continued to merge, the water area surpassed the ice area again until reaching the maximum lake area on 8 July to 12 July. As the ice dam body rose from 12 July to 17 July, the gap between the water and ice area gradually increased and narrowed. During this period, ice deposited at the bottom of the ice dam was lifted by the water body, and the lake was dominated by ice again before the outburst.

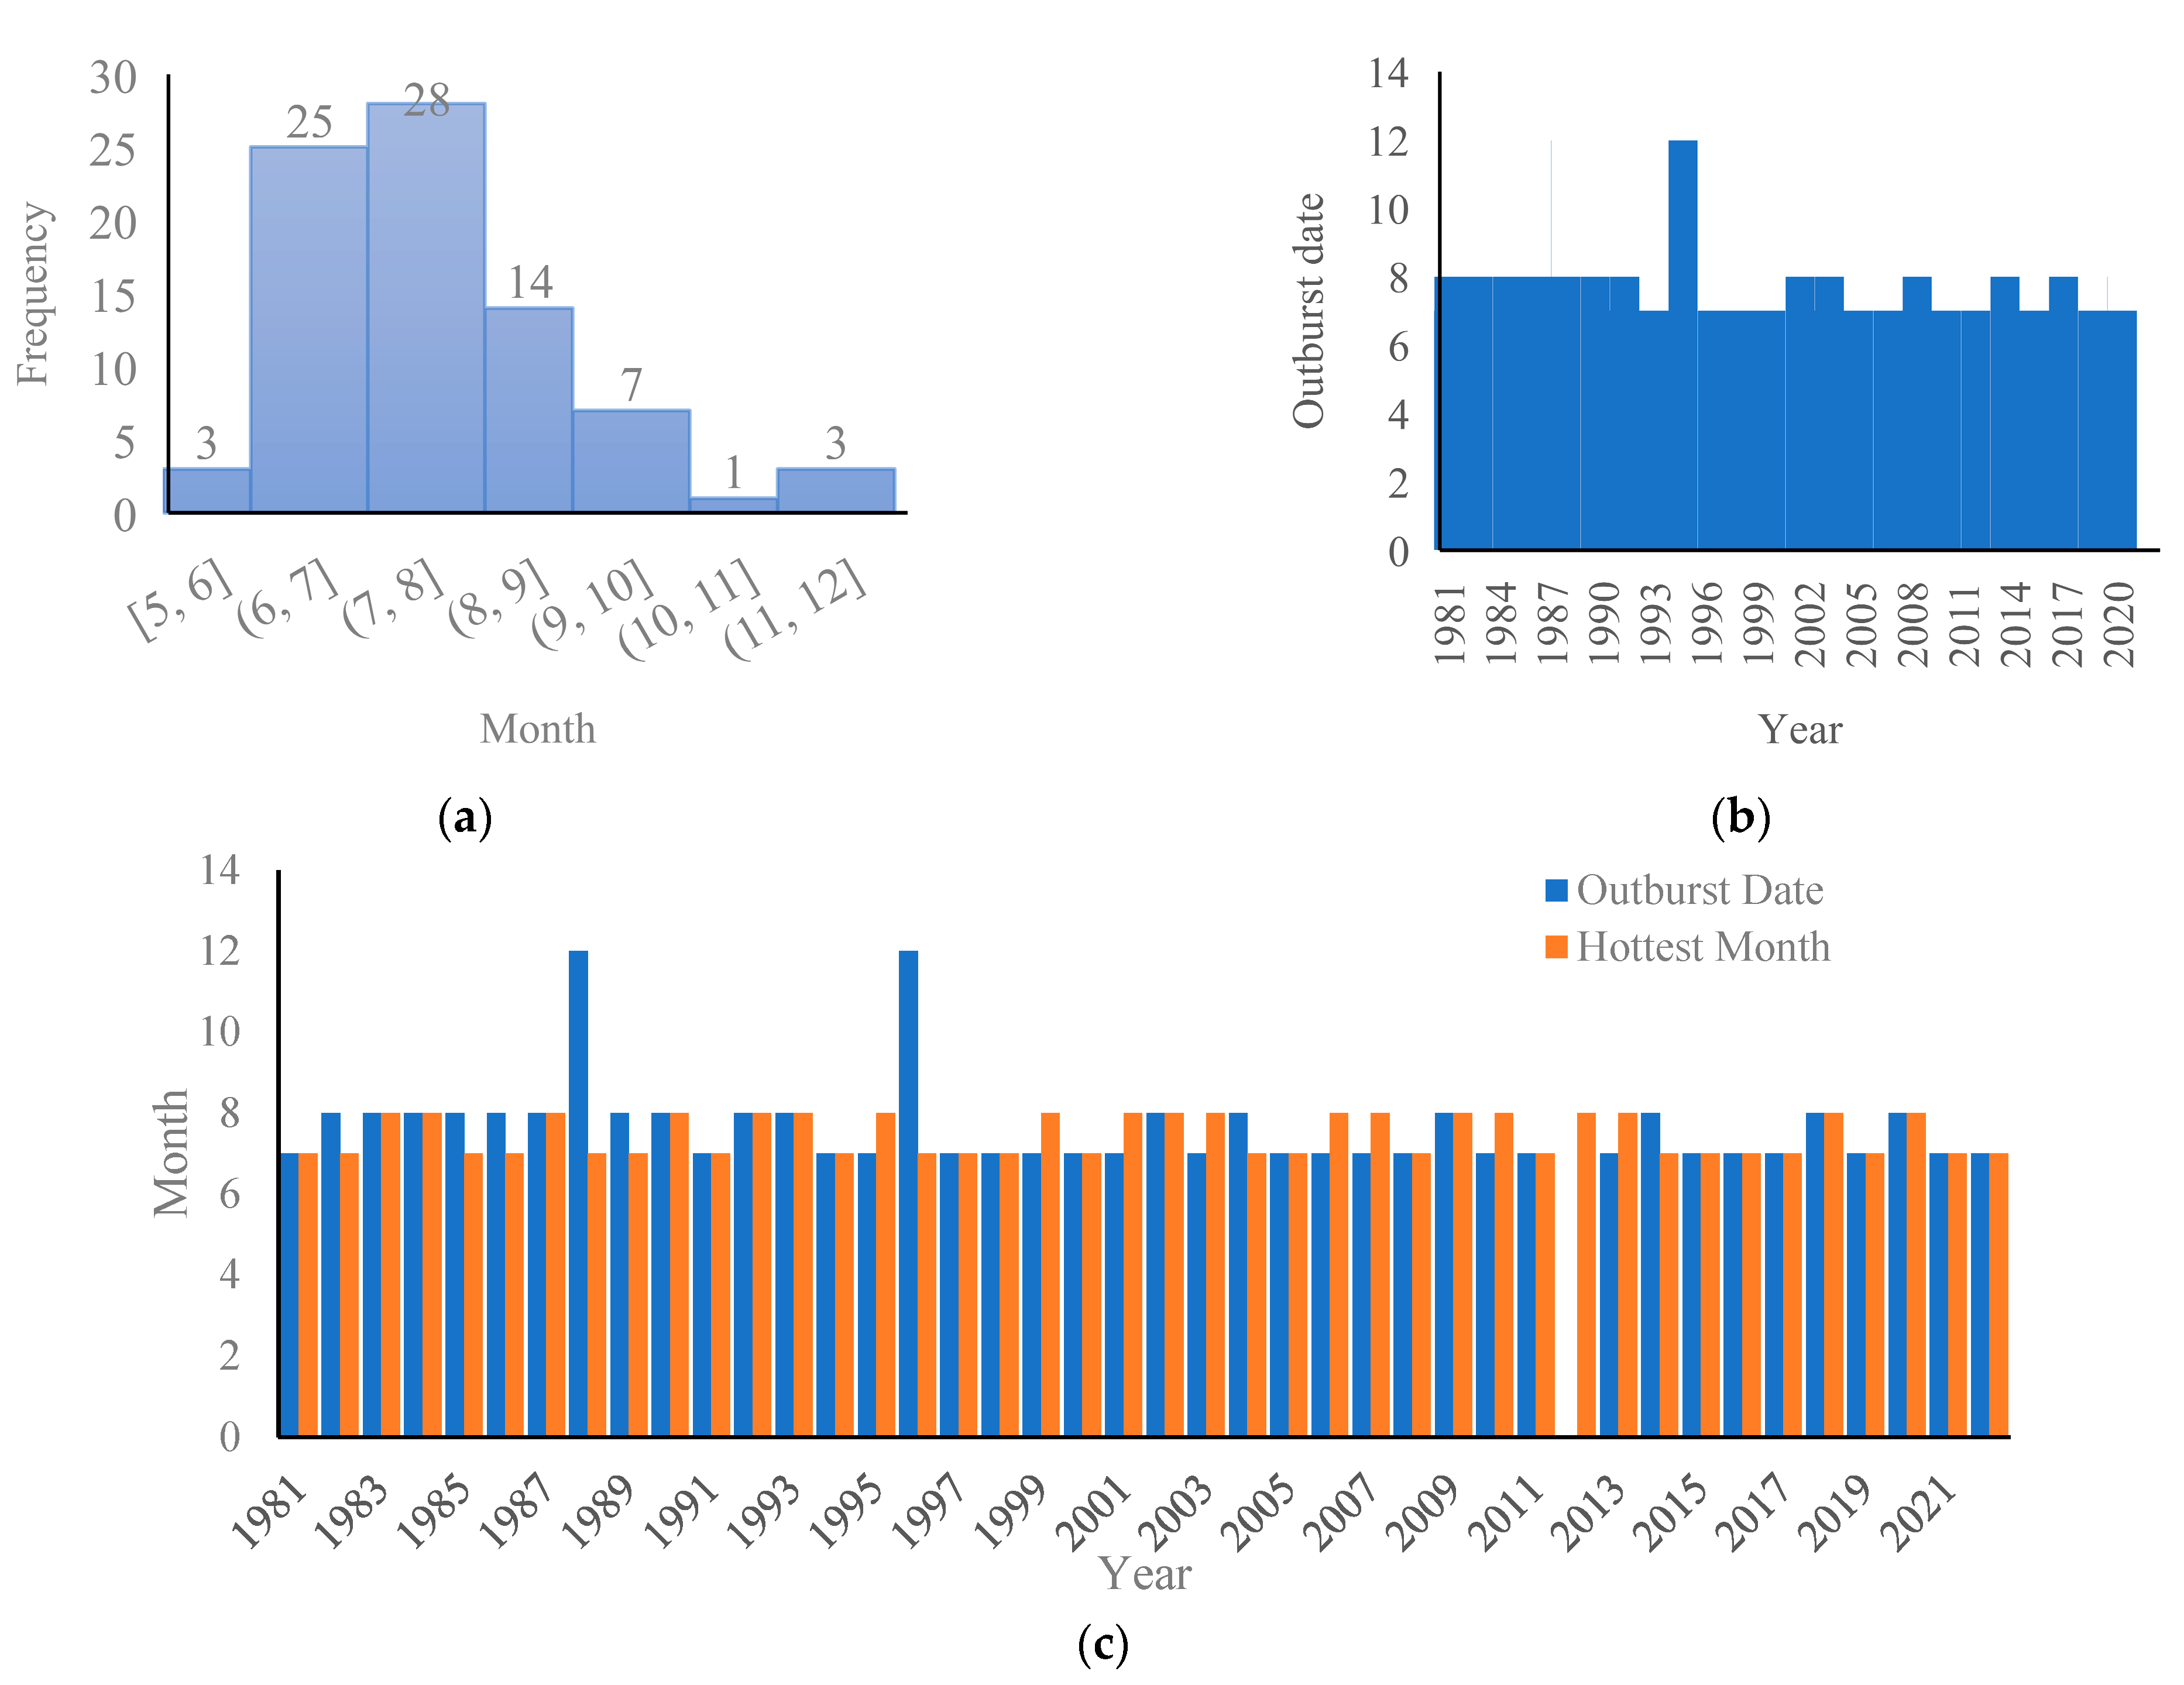
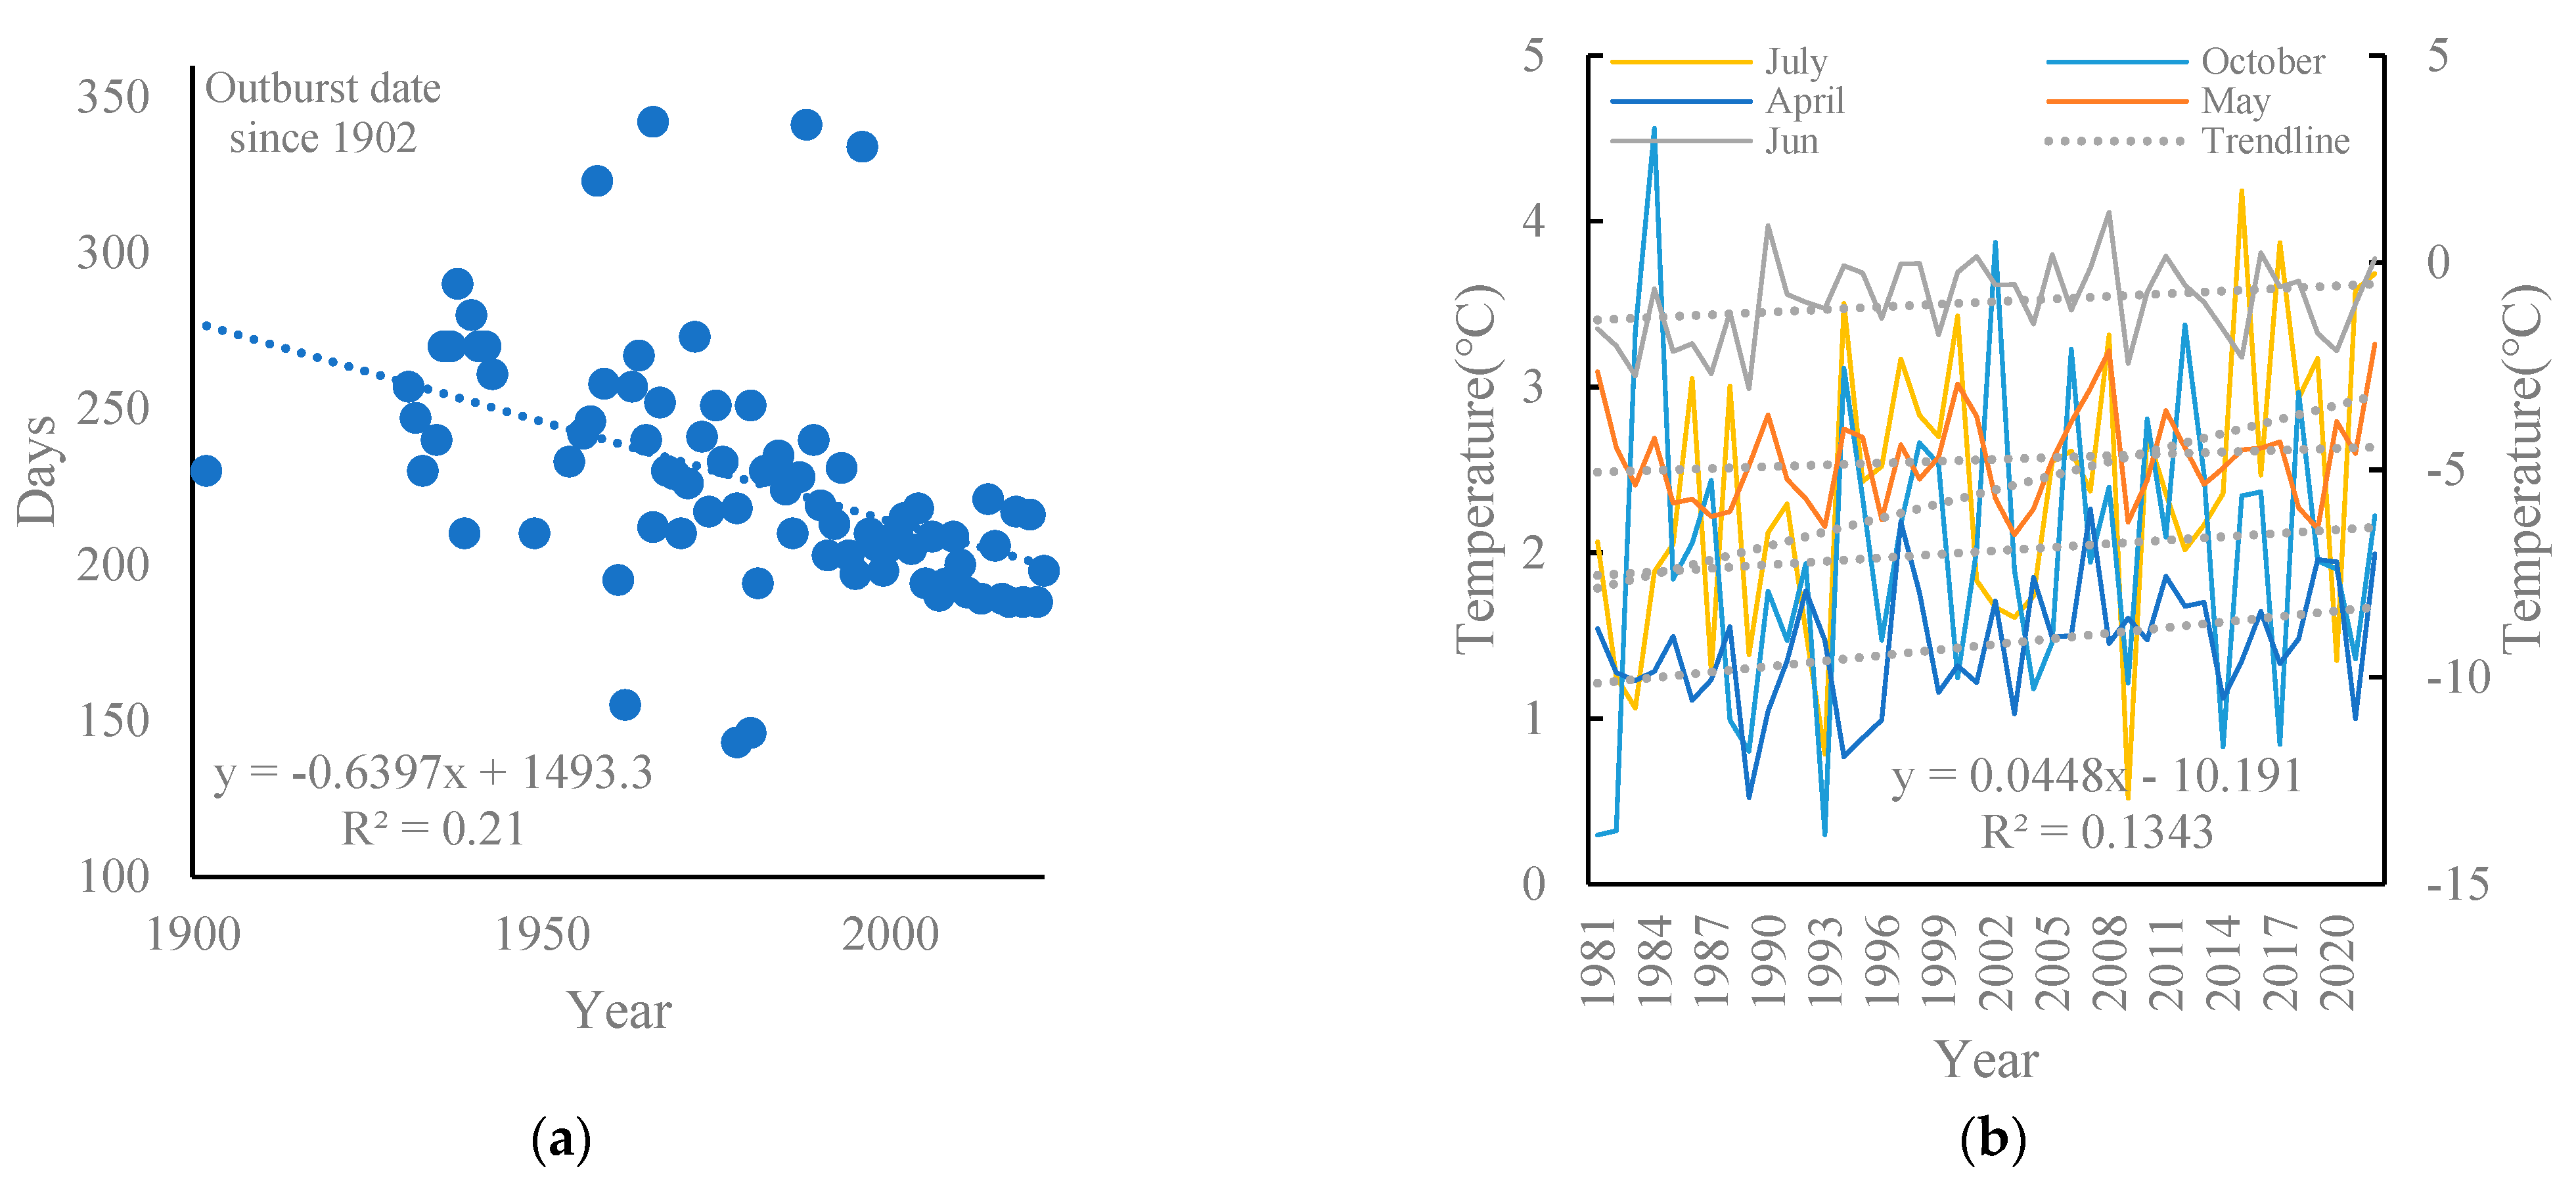
3.3. The Relationship between the Temperature and the Outburst Date since 1980

According to the relevant records of the published studies and news reports, Lake Merzbacher has experienced nearly yearly outbursts since 1902 (Figure 7). From the perspective of the outburst date, it can be found that over 80% of outburst events occurred on 25 June, 28 July, and 14 October. From 1981 to 2022, almost every outburst event occurred on 23 July and 16 October, except in 1988 and 1996. Based on ERA5 climate data, the hottest month in every year since 1981 was extracted (Figure 7). As depicted in Figure 7, the hottest month occurred on 24 July or 20 October since 1981. From 1981 to 2022, the hottest month and the outburst date were the same in 25 years. Especially from 2015 to 2022, Lake Merzbacher outburst occurred in the hottest month every year. Lake Merzbacher outburst occurred in the second hottest month in 11 years, of which 5 years is one month ahead of the hottest month, while the rest of the 6 years are one month later than the hottest month. Only two outburst events occurred in the cold season. The main water storage source of Lake Merzbacher is the meltwater of North Inylchek Glacier, so the water storage of the glacial lake strongly depends on air temperature.
Further analysis of the outburst time reveals that since the 1930s, the outbursts of Lake Merzbacher have tended to occur earlier in the year (Figure 8). Over the period from 1902 to 2022, the Lake outburst earlier on average 6 days per decade (R2 = 0.21). Since the water storage of Lake Merzbacher comes from glacial meltwater, one potential reason for this fact can be climate warming, which is melting glaciers earlier. Climate change has raised average temperatures in the surrounding area of Lake Merzbacher (Figure 8). From 1981 to 2021, the average temperature increased from −9.59 °C to −9.06 °C, increasing at a rate of 0.18 °C per decade. From the perspective of April, May, June, July, and October, the average temperature increased during the same period. Among them, the fastest growth in average temperature has been seen in April, which increased at a rate of 0.45 °C per decade. In other words, Lake Merzbacher has shown an early warming trend.

4. Discussion

The glacier lake outburst flood (GLOF) significantly threatens downstream communities, infrastructure, and livelihoods [50,51,52]. Establishing an early warning system is crucial in mitigating disasters and reducing damage [53]. GLOFs release large amounts of water stored in glacier lakes rapidly downstream [54]. Therefore, capturing the signals of an imminent GLOF is essential for early warning. Previous studies have shown Lake Merzbacher outbursts at a high frequency, especially after entering the twenty century. Additionally, there is a certain regularity in Lake Merzbacher’s outburst mechanism [19,20]. The lake area expands before reaching its maximum, after which it rapidly shrinks until the outburst. This study analyzed the lake’s daily changes in area leading up to the 2022 outburst. To the best of our knowledge, this is the first study to observe these changes daily before a Lake Merzbacher outburst.
When analyzing the maximum lake area (MLA) before the outburst of Lake Merzbacher from 2014 to 2022, it was found that the MLA did not exceed 3 km2 and showed a decreasing trend, which is consistent with the findings of Li et al. [30]. In fact, the MLA has shown a decreasing trend, at least after entering the new century. On the contrary, glacier lakes showed an increasing trend in the Tienshan region reported by Wang et al. [55]. The upper lake area also showed an increasing trend [30]. The lake area expansion or shrinkage are all the consequences of climate change. On the one hand, climate change can lead to glacial ablation and thus provide more melting water for the glacier lakes. Therefore, the quantities and volume of glacier lakes showed an increasing trend. However, Lake Merzbacher was dammed by the southern branch of the Inylchek Glacier. The increase in temperature will also accelerate the piping inside the ice dam [56]. As a result, the outbursts tended to occur earlier (Figure 8). However, this does not mean Lake Merzbacher is not dangerous anymore. Under the effects of climate change, glaciers in the Tien Shan of Central Asia have generally retreated over the past half-century [57]. A general increasing trend has prevailed in the temporal variation of peak and total discharges of the jokulhlaup floods of the lake [49,58]. Furthermore, the southern branch of the Inylchek Glacier proceeds northward and flows into Lake Merzbacher, which may break the stability of the ice dam and thus significantly increase the GLOF risk for Lake Merzbacher. Therefore, the outburst of Lake Merzbacher requires our ongoing attention.
A previous study divided the entire process of the Lake Merzbacher outburst into four periods: icefall, quick water storage, early warning, and post-drainage [18]. According to satellite images in 2022, since at least 4 May, water starts to be injected into the lake (Figure 9). As the temperature keeps increasing, more and more glacier meltwater flows into Lake Merzbacher. The water area would expand at a relatively low speed during this period. This process continues for up to about one month, the same as in previous records. In the next month, the lake area would expand at a relatively high speed until reaching the maximum lake area. As the dam body gradually rises under the water pressure [20], a system of englacial channels hidden in the dam opens, and the lake water discharges through these channels. During this period, the lake area showed a relatively low decreasing speed and can be detected from some corners (S1–S3). This period lasts about 5 days and is significant to early warning. Furthermore, the entire outburst process of Lake Merzbacher will repeat nearly every year [16]. It means that Lake Merzbacher, because of its predictability, would be a promising candidate for an early warning system (EWS). Compared to other engineering measures on glacial lakes, establishing the EWS is a relatively inexpensive option. Generally, the GLOF EWS has been widely established in the HMA [58]. For example, a manual EWS was set up in 1997 by Ropal Tsho, a moraine-dammed located in the Rolwaling Valley of Nepal [49]. The manual EWS by Ropal Tsho evolved into a fully automatic system one year after its establishment, which constituted two components: a sensing system and a warning system [59]. Imja Tsho is another glacial lake located in the Solukhumbu District of Nepal, near the base of Mount Everest [60]. It is a glacial lake that formed as a result of the retreat of the Imja Glacier. The lake has grown rapidly in recent decades due to climate change, and there are concerns that it could breach its natural dam and cause flooding downstream. The EWS of Imja Tsho combined two monitoring stations (web camera) and two relay stations [56]. EWSs can be complicated or easy. In theory, only the installation of water-level sensors can achieve a simple prediction scheme. However, a comprehensive monitoring system, usually composed of glacial lake monitoring, parent glaciers monitoring, the downstream river environment change detection, formulating a disaster mitigation plan, releasing early-warning information, and training for evacuation, is of great significance to reveal the GLOF generation mechanism [53]. Therefore, though the advantage of dense satellite images has been demonstrated, field-based EWS components are still required.
The difficulty in using satellite images to provide warnings of outburst floods from glacier-dammed lakes is to identify the drainage date [61]. The proportion of ice and water could also provide important information during the process. Xie et al. [16] proposed an index by calculating the ratio of floating ice and total lake area change rates. They found that when this index is less than 0.5 and the lake area is larger than 3 km2, the outburst will occur in the next 5–8 days. It is still a rough calculation. This study also calculates the proportion of ice and water before the outburst. As depicted in Figure 6, W-I shows regular fluctuations. Especially in the early warning stage, we found that the W-I showed an obvious decreasing trend, which indicates that more and more ice arose over the lake’s surface. The ice and water areas are nearly the same size one day before the outburst. From the view of the satellite image, the lake area was almost dominated by ice. With the channel opening, water storage in the lake begins to flow downstream, and the floating ice over the lake’s surface moves to the dam. Therefore, we can also speculate on the status of the lake according to the proportion of floating ice. Historical images from 2014 to 2021 can also help verify the assumption. According to the accurate records of outburst dates in 2020 and 2021, only two or four days are left before the outburst. As is shown in Figure 3, the floating ice almost bestrews the lake’s surface in 2020 and 2021. It is speculated that the corresponding date of images in 2018 and 2019 are also near the outburst date. On the other hand, field-based EWS components may improve the timeliness and accuracy of early warning greatly.
The uncertainty and limitations in this research can be summarized below. As mentioned before, this is the first research to fully record the whole outburst process using high-resolution images. However, it is a pity that we failed to obtain an effective image on 19 July 2022 because of the cloudy weather. It is on this day the outburst occurred. Synthetic aperture radar (SAR) is not vulnerable to weather conditions and can be applied as an effective reinforcement [62]. Even though we frequently monitor the lake area, hydrographic station data are significant for early warning. As the lake water flows out, the downstream hydrographic station would also witness the process of rapid increase followed by a rapid decrease of water [17]. Therefore, combining hydrographic station records or other field-based EWS components and dense satellite images can achieve accurate surveillance.

5. Conclusions

This study demonstrates the potential of using dense Chinese high-resolution satellite images to monitor glacier lake outburst flood (GLOF) and release early warning. Based on the dense high-resolution satellite images, this study monitored the whole process of the Lake Merzbacher GLOF in 2022 and further analyzed historical GLOF events in Lake Merzbacher. Our results show that the lake area would expand slowly (0.01 km²/d) and then rapidly expand (0.04 km²/d) until it reaches the maximum lake area. After entering the early warning stage, which would last five days, the lake area would decrease slowly until the outburst. Further analysis shows that the GLOF is not far away when the floating ice area accounts for 50% or larger than 50% of the total lake area. The Lake Merzbacher GLOF is closely related to the temperature, and the outburst mainly occurred in the hottest months (July and October), especially in the last ten years. With the average temperature increase under climate change, Lake Merzbacher outbursted earlier and earlier (6 days earlier per decade since 1902). Our study provides essential references for monitoring Lake Merzbacher and establishing the early warning system (EWS). We also suggest that adding some field observation equipment, including a meteorological station and a hydrologic station, can improve the timeliness and accuracy of early warning.

Supplementary Materials

The following supporting information can be downloaded at: https://www.mdpi.com/article/10.3390/rs15071941/s1, Figure S1: Changes in the lake area were observed at a regional scale; Figure S2: Changes in the connection between the upper and lower parts of the lake.

Author Contributions

Conceptualization, C.G. and M.L.; methodology, C.G.; software, C.G.; validation, M.L., K.H. and P.W.; formal analysis, C.G.; investigation, C.G.; resources, S.L.; data curation, C.G.; writing—original draft preparation, C.G.; writing—review and editing, S.L.; visualization, K.H.; supervision, S.L.; project administration, S.L.; funding acquisition, S.L. All authors have read and agreed to the published version of the manuscript.

Funding

This research was funded by the National Key Research and Development Program of China, grant number 2019YFE0127700; the National Key Research and Development Program of China, grant number 2021YFB3901200; and the China High-Resolution Earth Observation System, grant number 03-Y30F03-9001-20/22.

Data Availability Statement

Data used in this study will be available upon request from the first author.

Conflicts of Interest

The authors declare no conflict of interest.

References

  1. Osman, M.B.; Tierney, J.E.; Zhu, J.; Tardif, R.; Poulsen, C.J. Globally resolved surface temperatures since the Last Glacial Maximum. Nature 2021, 599, 239–244. [Google Scholar] [CrossRef]
  2. Hugonnet, R.; Mcnabb, R.; Berthier, E.; Menounos, B.; Kb, A. Accelerated global glacier mass loss in the early twenty-first century. Nature 2021, 592, 726–731. [Google Scholar] [CrossRef] [PubMed]
  3. Nie, Y.; Pritchard, H.D.; Liu, Q.; Hennig, T.; Wang, W.; Wang, X.; Liu, S.; Nepal, S.; Samyn, D.; Hewitt, K. Glacial change and hydrological implications in the Himalaya and Karakoram. Nat. Rev. Earth Environ. 2021, 2, 91–106. [Google Scholar] [CrossRef]
  4. Su, B.; Xiao, C.; Chen, D.; Huang, Y.; Che, Y.; Zhao, H.; Zou, M.; Guo, R.; Wang, X.; Li, X. Glacier change in China over past decades: Spatiotemporal patterns and influencing factors. Earth-Sci. Rev. 2022, 226, 103926. [Google Scholar] [CrossRef]
  5. Richardson, S.D.; Reynolds, J.M. An overview of glacial hazards in the Himalayas. Quat. Int. 2000, 65–66, 31–47. [Google Scholar] [CrossRef]
  6. Milner, A.M.; Khamis, K.; Battin, T.J.; Brittain, J.E.; Barrand, N.E.; Füreder, L.; Cauvy-Fraunié, S.; Gíslason, G.M.; Jacobsen, D.; Hannah, D.M. Glacier shrinkage driving global changes in downstream systems. Proc. Natl. Acad. Sci. USA 2017, 114, 9770–9778. [Google Scholar] [CrossRef] [Green Version]
  7. Stuart-Smith, R.F.; Roe, G.H.; Li, S.; Allen, M.R. Increased outburst flood hazard from Lake Palcacocha due to human-induced glacier retreat. Nat. Geosci. 2021, 14, 85–90. [Google Scholar] [CrossRef]
  8. Dan, H.S.; Burr, A.; Haritashya, U.K.; Kargel, J.S.; Strattman, K. Rapid worldwide growth of glacial lakes since 1990. Nat. Clim. Chang. 2020, 10, 939–945. [Google Scholar]
  9. Zheng, G.; Allen, S.K.; Bao, A.; Ballesteros-Cánovas, J.A.; Huss, M.; Zhang, G.; Li, J.; Yuan, Y.; Jiang, L.; Yu, T. Increasing risk of glacial lake outburst floods from future Third Pole deglaciation. Nat. Clim. Chang. 2021, 11, 411–417. [Google Scholar] [CrossRef]
  10. Zhang, G.; Yao, T.; Xie, H.; Wang, W.; Yang, W. An inventory of glacial lakes in the Third Pole region and their changes in response to global warming. Glob. Planet. Chang. 2015, 131, 148–157. [Google Scholar] [CrossRef]
  11. Veh, G.; Korup, O.; Walz, A. Hazard from Himalayan Glacier Lake Outburst Floods. Proc. Natl. Acad. Sci. USA 2019, 117, 907–912. [Google Scholar] [CrossRef]
  12. Taylor, C.; Robinson, T.R.; Dunning, S.; Rachel Carr, J.; Westoby, M. Glacial lake outburst floods threaten millions globally. Nat. Commun. 2023, 14, 487. [Google Scholar] [CrossRef]
  13. Wangchuk, S.; Bolch, T.; Robson, B.A. Monitoring glacial lake outburst flood susceptibility using Sentinel-1 SAR data, Google Earth Engine, and persistent scatterer interferometry. Remote Sens. Environ. 2022, 271, 112910. [Google Scholar] [CrossRef]
  14. Maurer, J.M.; Schaefer, J.M.; Russell, J.B.; Rupper, S.; Wangdi, N.; Putnam, A.E.; Young, N. Seismic observations, numerical modeling, and geomorphic analysis of a glacier lake outburst flood in the Himalayas. Sci. Adv. 2020, 6, a3645. [Google Scholar] [CrossRef] [PubMed]
  15. Aggarwal, S.; Rai, S.C.; Thakur, P.K.; Emmer, A. Inventory and recently increasing GLOF susceptibility of glacial lakes in Sikkim, Eastern Himalaya. Geomorphology 2017, 295, 39–54. [Google Scholar] [CrossRef]
  16. Xie, Z.; ShangGuan, D.; Zhang, S.; Ding, Y.; Liu, S. Index for hazard of Glacier Lake Outburst flood of Lake Merzbacher by satellite-based monitoring of lake area and ice cover. Glob. Planet. Chang. 2013, 107, 229–237. [Google Scholar] [CrossRef]
  17. Shangguan, D.; Ding, Y.; Liu, S.; Xie, Z.; Pieczonka, T.; Xu, J.; Moldobekov, B. Quick Release of Internal Water Storage in a Glacier Leads to Underestimation of the Hazard Potential of Glacial Lake Outburst Floods from Lake Merzbacher in Central Tian Shan Mountains. Geophys. Res. Lett. 2017, 44, 9786–9795. [Google Scholar] [CrossRef]
  18. Shen, Y.; Wang, G.; Ding, Y. Changes in Merzbacher Lake of Inylchek Glacier and glacial flash floods in Aksu River Basin, Tianshan during the period of 1903–2009. J. Glaciol. Geocryol. 2009, 31, 993–1002. [Google Scholar]
  19. Nandris, J. The Central Tian-Shan Mountains 1902–1903; HardPress Publishing: Madrid, Spain, 2013. [Google Scholar]
  20. Yan, S.; Li, Y.; Li, Z.; Liu, G.; Ruan, Z.; Li, Z. An insight into the surface velocity of Inylchek Glacier and its effect on Lake Merzbacher during 2006–2016 with Landsat time-series imagery. Environ. Earth Sci. 2018, 77, 773. [Google Scholar] [CrossRef]
  21. Zhang, T.; Wang, W.; Gao, T.; An, B.; Yao, T. An integrative method for identifying potentially dangerous glacial lakes in the Himalayas. Sci. Total Environ. 2022, 806, 150442. [Google Scholar] [CrossRef]
  22. McKillop, R.J.; Clague, J.J. Statistical, remote sensing-based approach for estimating the probability of catastrophic drainage from moraine-dammed lakes in southwestern British Columbia. Global Planet. Change 2007, 56, 153–171. [Google Scholar] [CrossRef]
  23. Zhang, Z.; Lu, L.; Zhao, Y.; Wang, Y.; Wei, D.; Wu, X.; Ma, X. Recent advances in using Chinese Earth observation satellites for remote sensing of vegetation. ISPRS J. Photogramm. 2023, 195, 393–407. [Google Scholar] [CrossRef]
  24. Chen, L.; Letu, H.; Fan, M.; Shang, H.; Tao, J.; Wu, L.; Zhang, Y.; Yu, C.; Gu, J.; Zhang, N.; et al. An Introduction to the Chinese High-Resolution Earth Observation System: Gaofen-1~7 Civilian Satellites. J. Remote Sens. 2022, 2022, 9769536. [Google Scholar] [CrossRef]
  25. Sun, Q.; Zhang, P.; Sun, D.; Liu, A.; Dai, J. Desert vegetation-habitat complexes mapping using Gaofen-1 WFV (wide field of view) time series images in Minqin County, China. Int. J. Appl. Earth Obs. 2018, 73, 522–534. [Google Scholar] [CrossRef]
  26. Li, Y.; Wu, J.; Zhong, B.; Shi, X.; Xu, K.; Ao, K.; Sun, B.; Ding, X.; Wang, X.; Liu, Q. Methods of Sandy Land Detection in a Sparse-Vegetation Scene Based on the Fusion of HJ-2A Hyperspectral and GF-3 SAR Data. Remote Sens. 2022, 14, 1203. [Google Scholar] [CrossRef]
  27. Ghimire, P.; Lei, D.; Juan, N. Effect of image fusion on vegetation index quality—A comparative study from Gaofen-1, Gaofen-2, Gaofen-4, Landsat-8 OLI and MODIS Imagery. Remote Sens. 2020, 12, 1550. [Google Scholar] [CrossRef]
  28. Chen, F. Comparing methods for segmenting supra-glacial lakes and surface features in the mount everest region of the himalayas using chinese gaofen-3 sar images. Remote Sens. 2021, 13, 2429. [Google Scholar] [CrossRef]
  29. Glazirin, G.E. A century of investigations on outbursts of the ice-dammed lake merzbacher (Central Tien Shan). Austrian J. Earth Sci. 2010, 103, 171–179. [Google Scholar]
  30. Da, L.; Donghui, S.; Weidong, H. Research on the area change of Lake Merzbacher in the Tianshan Mountains during 1998–2017. J. Glaciol. Geocryol. 2020, 42, 1126–1134. [Google Scholar]
  31. Mayer, C.; Lambrecht, A.; Hagg, W.; Helm, A.; Scharrer, K. Post-drainage ice dam response at lake merzbacher, inylchek glacier, kyrgyzstan. Geogr. Ann. Ser. A Phys. Geogr. 2008, 90, 87–96. [Google Scholar] [CrossRef] [Green Version]
  32. Zhaoguang, B. GF-1 Satellite—The First Satellite of CHEOS. Aerosp. China 2013, 11, 11–16. [Google Scholar]
  33. Chunling, L.; Zhaoguang, B. Characteristics and typical applications of GF-1 satellite. In Proceedings of the IGARSS 2015—2015 IEEE International Geoscience and Remote Sensing Symposium, Milan, Italy, 26–31 July 2015; pp. 1246–1249. [Google Scholar]
  34. Li, X.; He, X.; Pan, X. Application of Gaofen-6 images in the downscaling of land surface temperatures. Remote Sens. 2022, 14, 2307. [Google Scholar] [CrossRef]
  35. Yang, A.; Zhong, B.; Hu, L.; Wu, S.; Xu, Z.; Wu, H.; Wu, J.; Gong, X.; Wang, H.; Liu, Q. Radiometric cross-calibration of the wide field view camera onboard GaoFen-6 in multispectral bands. Remote Sens. 2020, 12, 1037. [Google Scholar] [CrossRef] [Green Version]
  36. Xingfa, G.; Xudong, T. Overview of China earth observation satellite programs [space agencies]. IEEE Geosci. Remote Sens. Mag. 2015, 3, 113–129. [Google Scholar] [CrossRef]
  37. Cao, H.; Zhang, X.; Zhao, C.; Xu, C.; Mo, F.; Dai, J. System design and key technolongies of the GF-7 satellite. Chin. Space Sci. Technol. 2020, 40, 1. [Google Scholar]
  38. Guoyuan, L.; Xinming, T.; Jiyi, C.; Jiaqi, Y.; Zhao, L.; Xiaoming, G.; Zhiqiang, Z.; Xiaoqing, Z. Processing and preliminary accuracy validation of the GF-7 satellite laser altimetry data. Acta Geod. Cartogr. Sin. 2021, 50, 1338. [Google Scholar]
  39. Xie, J.; Huang, G.; Liu, R.; Zhao, C.; Dai, J.; Jin, T.; Mo, F.; Zhen, Y.; Xi, S.; Tang, H. Design and data processing of China’s first spaceborne laser altimeter system for earth observation: GaoFen-7. IEEE J. Stars 2020, 13, 1034–1044. [Google Scholar] [CrossRef]
  40. Xie, Y.; Hou, W.; Li, Z.; Zhu, S.; Liu, Z.; Hong, J.; Ma, Y.; Fan, C.; Guang, J.; Yang, B. Columnar water vapor retrieval by using data from the polarized scanning atmospheric corrector (PSAC) onboard HJ-2 A/B satellites. Remote Sens. 2022, 14, 1376. [Google Scholar] [CrossRef]
  41. Lei, X.; Liu, Z.; Tao, F.; Hou, W.; Huang, H.; Xie, Y.; Zhao, X.; Dong, H.; Zou, P.; Song, M. Geolocation Error Estimation Method for the Wide Swath Polarized Scanning Atmospheric Corrector Onboard HJ-2 A/B Satellites. IEEE T. Geosci. Remote 2022, 60, 1–9. [Google Scholar] [CrossRef]
  42. Chu, J.; Chen, Y.; Zhao, J.; Wang, F. Evaluation on BJ-2 image fusion algorithms for satellite images of coastal aquaculture sea areas. In Proceedings of the IGARSS 2019—2019 IEEE International Geoscience and Remote Sensing Symposium, Yokohama, Japan, 28 July–2 August 2019; pp. 2826–2829. [Google Scholar]
  43. Muñoz-Sabater, J.; Dutra, E.; Agustí-Panareda, A.; Albergel, C.; Arduini, G.; Balsamo, G.; Boussetta, S.; Choulga, M.; Harrigan, S.; Hersbach, H. ERA5-Land: A state-of-the-art global reanalysis dataset for land applications. Earth Syst. Sci. Data 2021, 13, 4349–4383. [Google Scholar] [CrossRef]
  44. Sun, W.; Tian, Y.; Mu, X.; Zhai, J.; Gao, P.; Zhao, G. Loess landslide inventory map based on GF-1 satellite imagery. Remote Sens. 2017, 9, 314. [Google Scholar] [CrossRef] [Green Version]
  45. Laben, C.A.; Brower, B.V. Process for Enhancing the Spatial Resolution of Multispectral Imagery Using Pan-Sharpening. U.S. Patent 6,011,875, 4 January 2000. [Google Scholar]
  46. Zhu, X.; Tang, X.; Zhang, G.; Liu, B.; Hu, W. Accuracy Comparison and Assessment of DSM Derived from GFDM Satellite and GF-7 Satellite Imagery. Remote Sens. 2021, 13, 4791. [Google Scholar] [CrossRef]
  47. Gao, B. NDWI—A normalized difference water index for remote sensing of vegetation liquid water from space. Remote Sens. Environ. 1996, 58, 257–266. [Google Scholar] [CrossRef]
  48. Krumwiede, B.S.; Kamp, U.; Leonard, G.J.; Kargel, J.S.; Dashtseren, A.; Walther, M. Recent Glacier Changes in the Mongolian Altai Mountains: Case Studies from Munkh Khairkhan and Tavan Bogd. In Global Land Ice Measurements from Space; Springer: Berlin/Heidelberg, Germany, 2014; pp. 481–508. [Google Scholar]
  49. Shrestha, M.; Goodrich, C.; Udas, P.; Rai, D.; Gurung, M.; Khadgi, V. Flood Early Warning Systems in Bhutan: A Gendered Perspective; International Centre for Integrated Mountain Development (ICIMOD): Lalitpur, Nepal, 2016. [Google Scholar]
  50. Zhang, D.; Zhou, G.; Li, W.; Han, L.; Zhang, S.; Yao, X.; Duan, H. A robust glacial lake outburst susceptibility assessment approach validated by GLOF event in 2020 in the Nidu Zangbo Basin, Tibetan Plateau. Catena 2023, 220, 106734. [Google Scholar] [CrossRef]
  51. Singh, H.; Varade, D.; de Vries, M.V.W.; Adhikari, K.; Rawat, M.; Awasthi, S.; Rawat, D. Assessment of potential present and future glacial lake outburst flood hazard in the Hunza valley: A case study of Shisper and Mochowar glacier. Sci. Total Environ. 2023, 868, 161717. [Google Scholar] [CrossRef]
  52. Bazai, N.A.; Cui, P.; Liu, D.; Carling, P.A.; Wang, H.; Zhang, G.; Li, Y.; Hassan, J. Glacier surging controls glacier lake formation and outburst floods: The example of the Khurdopin Glacier, Karakoram. Global Planet. Change 2022, 208, 103710. [Google Scholar] [CrossRef]
  53. Wang, W.; Zhang, T.; Yao, T.; An, B. Monitoring and early warning system of Cirenmaco glacial lake in the central Himalayas. Int. J. Disaster Risk Reduct. 2022, 73, 102914. [Google Scholar] [CrossRef]
  54. Kumar, B.; Prabhu, T.S.M.; Sathyan, A.; Krishnan, A. Chapter 36—GLOF Early Warning System: Computational Challenges and Solutions. In Current Directions in Water Scarcity Research; Zakwan, M., Wahid, A., Niazkar, M., Chatterjee, U., Eds.; Elsevier: Amsterdam, The Netherlands, 2022; Volume 7, pp. 641–662. [Google Scholar]
  55. Wang, X.; Ding, Y.J.; Liu, S.Y.; Jiang, L.H.; Wu, K.P.; Jiang, Z.L.; Guo, W.Q. Changes of glacial lakes and implications in Tian Shan, central Asia, based on remote sensing data from 1990 to 2010. Environ. Res. Lett. 2013, 8, 575–591. [Google Scholar] [CrossRef]
  56. Ng, F.; Liu, S.; Mavlyudov, B.; Wang, Y. Climatic control on the peak discharge of glacier outburst floods. Geophys. Res. Lett. 2007, 34, L21503. [Google Scholar] [CrossRef] [Green Version]
  57. Zhang, Q.; Chen, Y.; Li, Z.; Xiang, Y.; Li, Y.; Sun, C. Recent Changes in Glaciers in the Northern Tien Shan, Central Asia. Remote Sens. 2022, 14, 2878. [Google Scholar] [CrossRef]
  58. Shiying, L.; Guodong, C.; Jingshi, L. Jokulhlaup Characteristics of the Lake Mertzbakher in the Tianshan Mountains and Its Relation to Climate Change. J. Glaciol. Geocryol. 1998, 20, 30–35. [Google Scholar]
  59. Gurung, D.R.; Bajracharya, S.; Shrestha, B.R.; Pradhan, P. Wi-Fi network at Imja Tsho (lake), Nepal: An early warning system (EWS) for glacial lake outburst flood (GLOF). Grazer Schr. Geogr. Raumforsch. 2010, 45, 321–326. [Google Scholar]
  60. Somos-Valenzuela, M.A.; McKinney, D.C.; Byers, A.C.; Rounce, D.R.; Portocarrero, C.; Lamsal, D. Assessing downstream flood impacts due to a potential GLOF from Imja Tsho in Nepal. Hydrol. Earth Syst. Sc. 2015, 19, 1401–1412. [Google Scholar] [CrossRef] [Green Version]
  61. Yan, W.; Liu, J.; Zhang, M.; Hu, L.; Chen, J. Outburst flood forecasting by monitoring glacier-dammed lake using satellite images of Karakoram Mountains, China. Quat. Int. 2017, 453, 24–36. [Google Scholar] [CrossRef]
  62. Bai, Y.; Sun, G.; Li, Y.; Ma, P.; Li, G.; Zhang, Y. Comprehensively analyzing optical and polarimetric SAR features for land-use/land-cover classification and urban vegetation extraction in highly-dense urban area. Int. J. Appl. Earth Obs. 2021, 103, 102496. [Google Scholar] [CrossRef]
Figure 1. The location of lake Merzbacher.
Remotesensing 15 01941 g001
Figure 2. Satellite image (a) and image after calculating the NDWI (b).
Remotesensing 15 01941 g002
Figure 3. Maximum lake area (MLA) change before outburst since 2014. (a) MLA extent in each year and overlay on the image obtained on 1 August 2014; (b) MLA changes from 2014 to 2022; (cj) MLA overlay on images obtained from 2015 to 2022.
Remotesensing 15 01941 g003
Figure 4. Lake extent change in 2022 before and after the outburst.
Remotesensing 15 01941 g004
Figure 5. Centroid changes of lake area in historical and 2022 before the outburst.
Remotesensing 15 01941 g005
Figure 6. Water area and Ice area of Lake Merzbacher before the outburst from 2014 to 2022 (a); Water area and Ice area daily changes before the outburst (b).
Remotesensing 15 01941 g006
Figure 7. Date of Lake Merzbacher outburst since 1902. (a) Lake Merzbacher outburst Frequency in different months since 1902; (b) Lake Merzbacher outburst date since 1902; (c) The relationship between the outburst date and the hottest date since 1902.
Remotesensing 15 01941 g007
Figure 8. Detailed records of outburst date from Lake Merzbacher from 1902 to 2022 (a). Temperature changes in Lake Merzbacher from 1981 to 2022 (b).
Remotesensing 15 01941 g008
Figure 9. Satellite image of Lake Merzbacher captured in 4 May 2022.
Remotesensing 15 01941 g009
Table 1. Satellite images from 2014 to 2022.
DateSensorResolutionDateSensorResolution
1 August 2014GF-1 WFV116 m29 July 2021GF-1B_PMS2/8 m
10 August 2014GF-1 WFV316 m18 May 2022HJ-2A_CCD216 m
12 July 2015GF-1 WFV316 m28 May 2022HJ-2A_CCD316 m
9 August 2015GF-1 WFV116 m3 June 2022HJ-2B_CCD316 m
25 June 2016GF-1 WFV416 m11 June 2022GF-1C_PMS2/8 m
2 July 2016GF-1 WFV116 m17 June 2022HJ-2A_CCD416 m
6 June 2017GF-1 WFV216 m21 June 2022/HJ-2A_CCD416 m
28 July 2017GF-1 WFV416 m8 July 2022HJ-2A_CCD316 m
6 July 2018GF-1 WFV216 m12 July 2022GF-1B_PMS2/8 m
10 July 2018GF-1 WFV116 m13 July 2022GF-1B_PMS2/8 m
19 July 2018GF-1 WFV316 m14 July 2022GF-1C_PMS2/8 m
4 August 2018GF-1 WFV216 m14 July 2022HJ-2B_CCD316 m
13 August 2018GF-1 WFV416 m15 July 2022GF-1D_PMS2/8 m
5 July 2019GF-1D PMS2/8 m16 July 2022HJ2A_CCD316 m
23 July 2019GF-1 WFV316 m17 July 2022GF1_WFV22 m
5 August 2020GF-6 PMS2/8 m18 July 2022BJ-20.8 m
3 July 2021GF-6 WFV16 m20 July 2022HJ2A_CCD416 m
Table 2. Technical parameter of GaoFen-1 (GF-1) (wide field of view (WFV) and panchromatic/multispectral high resolution (PMS)).
PayloadSpectral TypeSpectral Range (nm)Spatial Resolution (m)Swath Width (km)Revisit Interval
WFVBlue450~52016800 (Set of 4 cameras)Four days (side-swing)
Green520~590
Red630~690
Near infrared770~890
PMSPanchromatic450~900260 (Set of 2 cameras)
Blue450~5208
Green520~590
Red630~690
Near infrared770~890
Table 3. Technical parameters of GaoFen-6 (GF-6) (wide field of view (WFV) and panchromatic/multispectral high-resolution (PMS)).
PayloadSpectral NumberSpectral TypeSpectral Range (nm)Spatial Resolution (m)Swath Width (km)Revisit Interval
WFV1Blue450~52016800Four days
2Green520~590
3Red630~690
4Near infrared770~890
5Costal400~450
6Yellow590~630
7RedEdge1690~730
8Rededge2730~770
PMS1Panchromatic450~900290
2Blue450~5208
3Green520~590
4Red630~690
5Near infrared770~890
Table 4. Absolute and relative area error of Lake Merzbacher.
DateArea (km²)Perimeter (m)Absolute Area Error (km²)Relative Area Error (%)DateArea (km²)Perimeter (m)Absolute Area Error (km²)Relative Area Error (%)
1 August 20142.999.940.010.2111 June 20221.258.5200.02
12 July 20152.289.570.010.2717 June 20221.457.920.010.39
25 June 20161.948.820.010.3121 June 20221.527.540.010.37
6 July 20171.88.7400.018 July 20222.078.910.010.29
3 August 20182.510.150.010.2612 July 20222.1510.0300.01
5 July 20191.868.6100.0113 July 20222.19.9100.01
5 August 20202.058.2500.0114 July 20222.099.760.010.30
3 July 20211.968.700.010.3015 July 20222.089.8500.01
18 May 20220.725.8400.6816 July 20222.039.270.010.30
28 May 20220.956.710.010.5517 July 20222.019.1200.01
3 June 20221.066.820.010.5018 July 20221.285.2600
Disclaimer/Publisher’s Note: The statements, opinions and data contained in all publications are solely those of the individual author(s) and contributor(s) and not of MDPI and/or the editor(s). MDPI and/or the editor(s) disclaim responsibility for any injury to people or property resulting from any ideas, methods, instructions or products referred to in the content.

