Article

Center-Ness and Repulsion: Constraints to Improve Remote Sensing Object Detection via RepPoints

1
School of Computer Science and Engineering, University of Electronic Science and Technology of China, Chengdu 611700, China
2
Kash Institute of Electronics and Information Industry, Kash 844000, China
3
School of Information and Software Engineering, University of Electronic Science and Technology of China, Chengdu 611700, China
4
Sichuan Huakun Zhenyu Intelligent Technology Co., Ltd., Chengdu 610095, China
*
Author to whom correspondence should be addressed.
Remote Sens. 2023, 15(6), 1479; https://doi.org/10.3390/rs15061479
Submission received: 6 February 2023 / Revised: 4 March 2023 / Accepted: 5 March 2023 / Published: 7 March 2023

Abstract

:
Remote sensing object detection is a basic yet challenging task in remote sensing image understanding. In contrast to horizontal objects, remote sensing objects are commonly densely packed with arbitrary orientations and highly complex backgrounds. Existing object detection methods lack an effective mechanism to exploit these characteristics and distinguish various targets. Unlike mainstream approaches ignoring spatial interaction among targets, this paper proposes a shape-adaptive repulsion constraint on point representation to capture geometric information of densely distributed remote sensing objects with arbitrary orientations. Specifically, (1) we first introduce a shape-adaptive center-ness quality assessment strategy to penalize the bounding boxes having a large margin shift from the center point. Then, (2) we design a novel oriented repulsion regression loss to distinguish densely packed targets: closer to the target and farther from surrounding objects. Experimental results on four challenging datasets, including DOTA, HRSC2016, UCAS-AOD, and WHU-RSONE-OBB, demonstrate the effectiveness of our proposed approach.

Graphical Abstract

1. Introduction

With the improvement of imaging quality, remote sensing images have been applied in many fields. As the basis of many remote sensing image applications, the quality of remote sensing object detection directly affects the effect of downstream applications. Generally speaking, object detection aims at identifying the categories of objects of interest and locating their position and can be divided into horizontal object detection and oriented object detection according to the expression of the bounding box. Since the seminal creative work: R-CNN [1] and its successive improvements [2,3], horizontal object detection has achieved significant progress. As a fundamental yet essential sub-task in object detection, the development of oriented object detection has fallen behind horizontal object detection since it requires a more sophisticated mechanism to locate objects precisely. Recently, remote sensing object detection has drawn increasing attention. However, a significant and recurrent problem is that remote sensing objects are often in multiple scales with arbitrary orientations [4,5,6] and in densely packed distributions with complex background contexts [7,8,9]. Based on the horizontal bounding box, oriented object detection utilizes an angle parameter to position large aspect ratio objects and small remote sensing objects in a crowded environment. Besides, oriented bounding boxes can minimize the error effect caused by the non-maximum suppression compared with horizontal bounding boxes.
The mainstreamed-oriented object detection approaches typically take the perspective that horizontal object detection is a special case for oriented object detection. Accordingly, most oriented object detectors are often inherited from the classical horizontal detectors with an extra orientation parameter θ . As shown in Figure 1, oriented object detectors utilize an extra parameter θ to describe the orientation information of the target object, in other words, five parameters ( x , y , w , h , θ ) . The oriented bounding box provides a more precise localization of the objects. Especially for the large aspect ratio and small targets, the angle parameter θ and center point ( x , y ) play a more significant role in the positioning paradigm. Taking ship detection as an example, detecting a ship in Figure 1a using a horizontal bounding box has an inferior performance compared with using an oriented bounding box in Figure 1b as more than half the area of the horizontal bounding box does not belong to the ship.
Most approaches treat oriented object detection as a problem of oriented object localization and the orientation regression-based methods [4,10,11] play the most important role in the research area. Benefiting from [12,13,14], these methods have achieved gratifying performance in research and application. However, the mechanism of angle-based regression methods has congenital drawbacks, including loss discontinuity and regression inconsistency [15,16,17]. These shortcomings are attributed to the periodicity of angular orientation and the specification of the oriented bounding box. For example, a bounding box rotated one degree clockwise or counterclockwise around the ground truth is equivalent under the Intersection over Union (IoU) evaluation metric. The transformation of five parameters ( x , y , w , h , θ ) and eight parameters ( x 1 , y 1 , x 2 , y 2 , x 3 , y 3 , x 4 , y 4 ) also contains discontinuity of the loss problem caused by the order of the four points. The set { ( x i , y i ) , i = 1 , 2 , 3 , 4 } denotes four corner points of an oriented bounding box, respectively. Besides, some two-stage methods such as [4,9,18] design various complex modules to extract rotated features from the Region of Interest (RoI) and increase the computational complexity of the detectors.
Besides the discontinuity and complexity problems, orientated object detection has the challenge of precisely locating small and cluttered objects. This is especially true for aerial images, which are vital in remote sensing applications. To address this issue, SCRDet [9] proposed a pixel attention network and a channel attention network to suppress the noise and highlight object features. DRN [19] proposed a feature selection module and a dynamic refinement head to improve the receptive fields in accordance with the shapes and orientations of small and cluttered objects. However, these mainstream methods ignore spatial interaction among targets. While a vast majority of aerial images are taken from the bird’s-view perspective, most targets are insufficiently covered by their surrounding targets. This fundamental feature of aerial targets is underutilized, and hence, spatial relative information should be considered in detector regression procedures.
Another challenge for oriented object detection is the design of sample assessment. As reported in [20,21,22,23], the selection, verification, and evaluation of samples can significantly improve the detectors’ performance. ATSS [20] proved that the selection of positive and negative samples can improve the performance of detectors and proposed an adaptive sample assignment strategy. Chen et al. [21] discovered that joint inference with sample verification has a promising improvement over its foundation [24]. Hou et al. [22] considered shape information and measured the quality of proposals. Li et al. [23] proposed adaptive points assessment and assignment to improve the classification confidence and localization score. As pointed out in [25], the center-ness information plays a significant role in object localization. However, existing works do not have an effective measure of it.
As discussed above, the challenges associated with oriented object detection can be summarized as follows:
  • The discontinuity of loss and the regression inconsistency caused by the expression of the oriented bounding box.
  • The difficulty of locating small and cluttered objects precisely and the lack of spatial interaction among targets.
  • Effective selection, verification, and assessment of samples and proposals, especially center-ness quality.
In this paper, we proposed repulsion and center-ness constraints based on RepPoints to improve remote sensing object detection. Firstly, we explore the representation of oriented objects in order to avoid the challenges caused by the oriented bounding box. As determined in RepPoints [21,24], point sets have demonstrated great potential while capturing vital semantic features produced by the multiple convolutional layers. In contrast to the conventional convolutional neural networks, RepPoints can have a weighted and wider reception field benefiting from [26]. To generate bounding boxes, a conversion function is applied to transform points into rectangles. For example, the conversion function MinAreaRect uses the oriented rectangle with minimum area to cover all the points in the learned point set over a target object. Secondly, as RepPoints only regresses the key points in the semantic feature maps but ignores measuring the quality of point sets, it attains an inferior performance for images with densely packed distributions and complex scenes. Therefore, we introduce the addition of a measuring strategy of center-ness to filter noisy samples located away from the center points of bounding boxes based on [23]. Thirdly, we design a novel loss function named oriented repulsion regression loss to illustrate the spatial interaction among targets. Specifically, we make the predicted bounding boxes closer to their corresponding ground truth boxes and farther from other ground truth boxes and predicted boxes, inspired by [
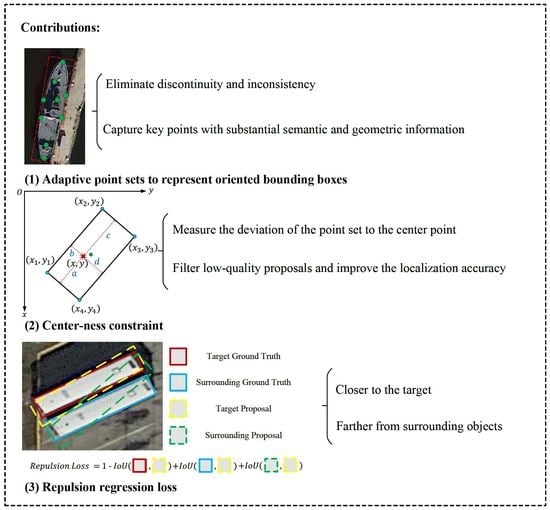
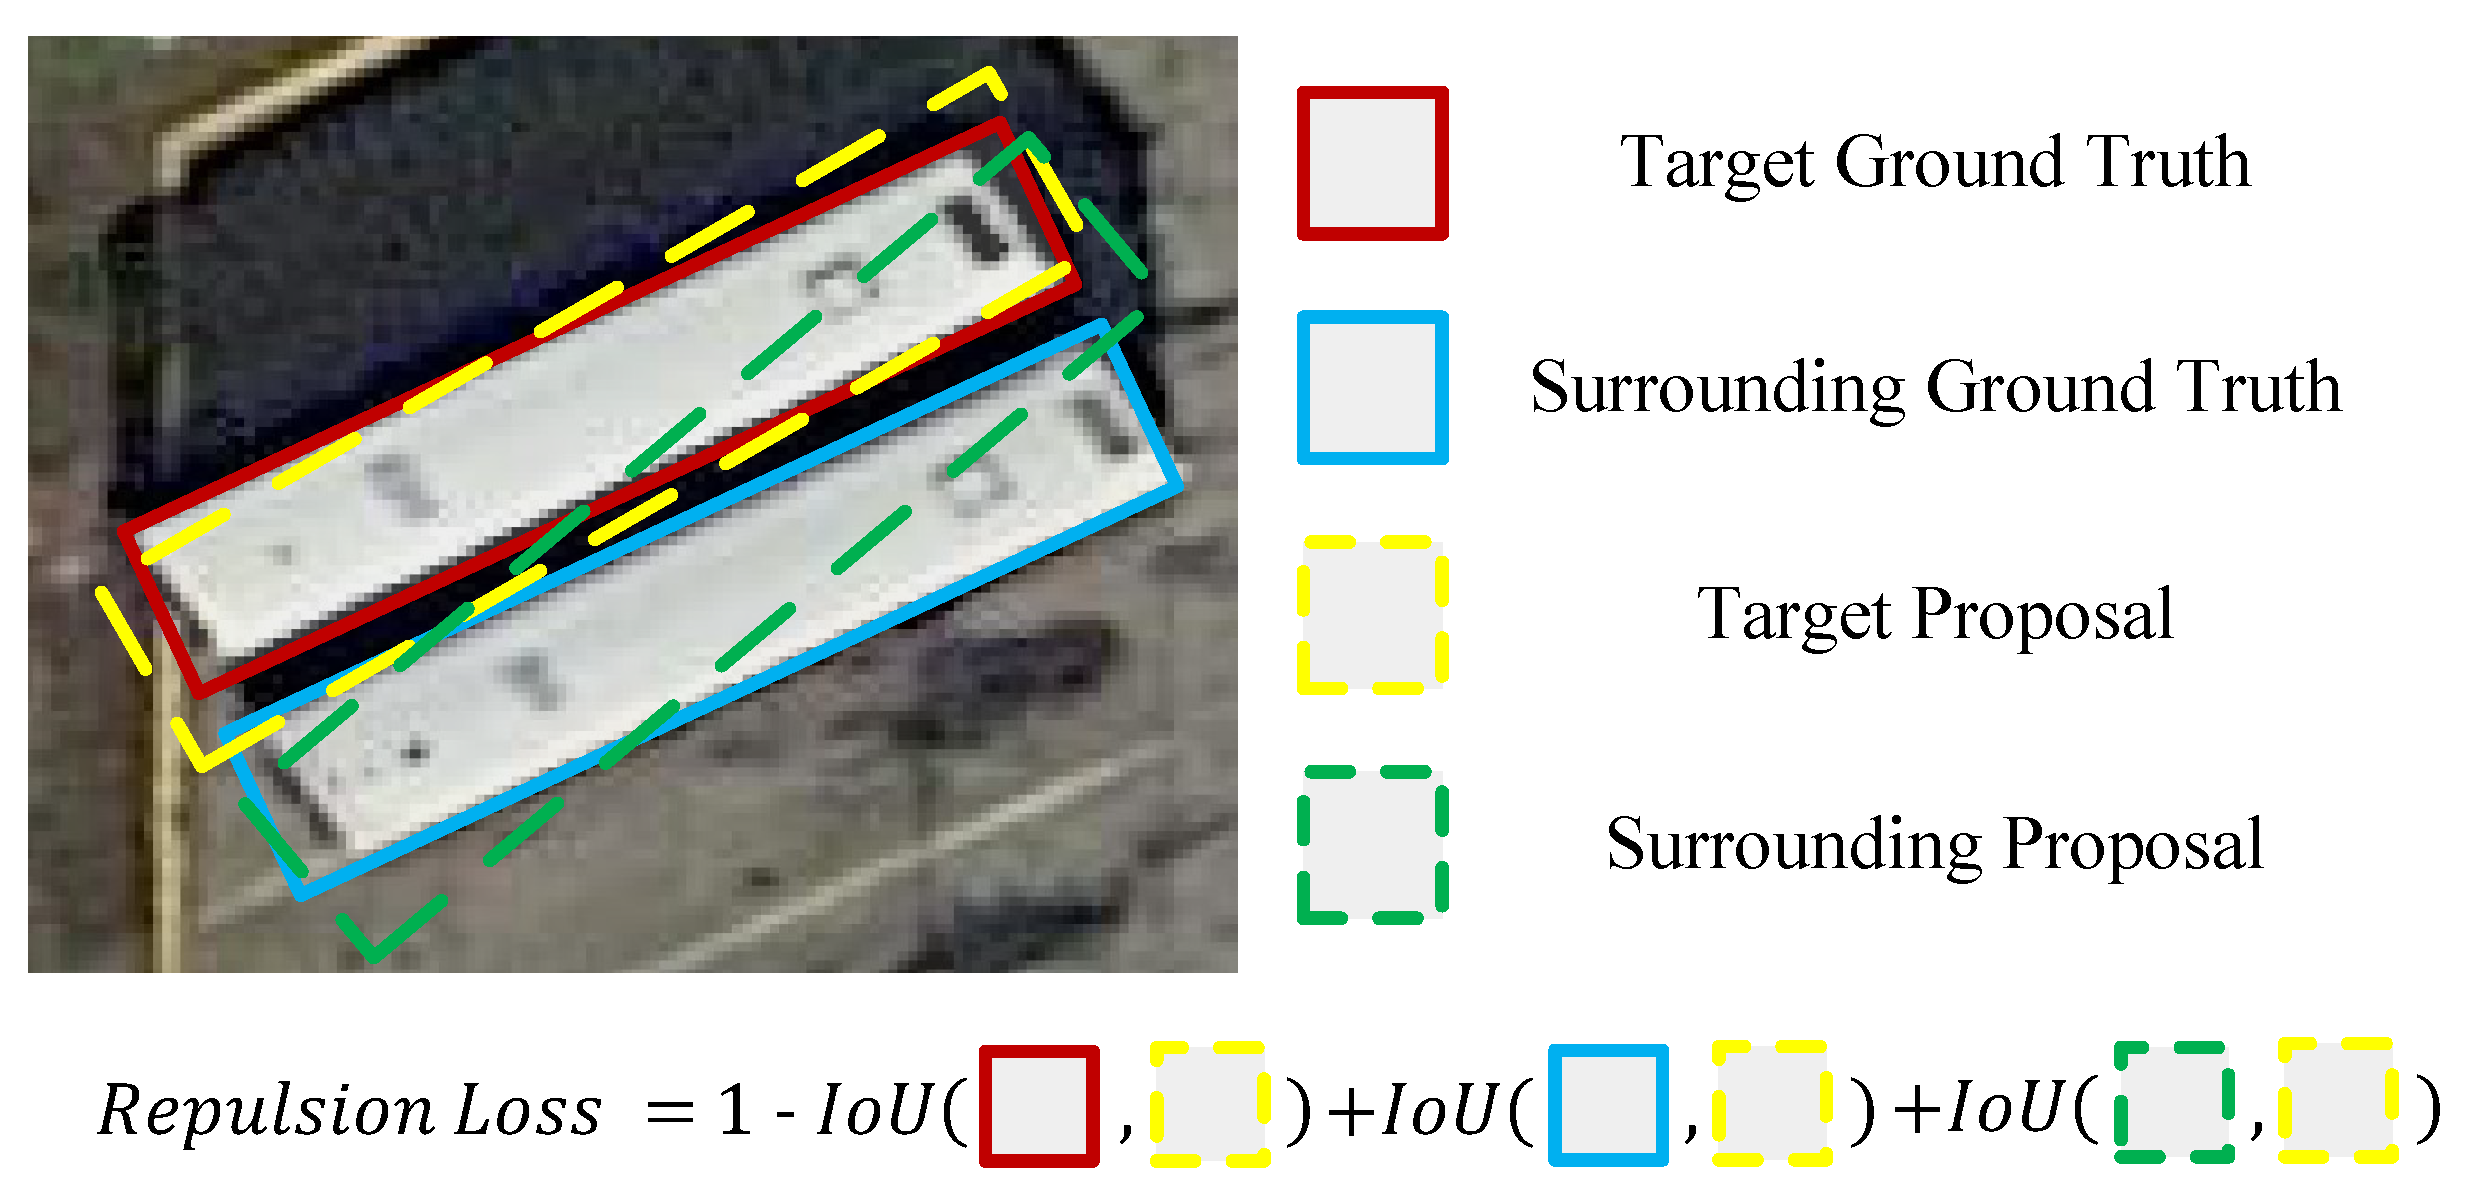
27]. The main contributions of this paper are summarized as follows:
  • We utilize adaptive point sets to represent oriented bounding boxes to eliminate discontinuity and inconsistency and to capture key points with substantial semantic and geometric information.
  • We propose a center-ness constraint to measure the deviation of the point set to the center point in the feature map aiming to filter low-quality proposals and improve the localization accuracy.
  • We design a novel repulsion regression loss to effectively illustrate spatial information among remote sensing objects: closer to the target and farther from surrounding objects, especially helpful for small and cluttered objects.
In addition, to evaluate the effectiveness of our proposed method, we conducted a series of experiments on four challenging datasets, DOTA [28], HRSC2016 [29], UCAS-AOD [30], and WHU-RSONE-OBB [31], and obtained consistent and promising state-of-the-art results.

2. Related Work and Method

In this section, we first review the related studies of oriented object detection before providing sufficient information to illustrate our proposed methods.

2.1. Related Work

2.1.1. Oriented Object Detection

For several years, the representation of bounding boxes in object detection has been dominated by horizontal bounding boxes. With the increasing demand for object detection with arbitrary orientations, such as text localization and remote sensing object positioning, oriented object detection has drawn more attention. Recent advances in oriented object detection [4,9,16,32] are mainly derived from classical object detectors adapting horizontal object detectors with oriented bounding boxes to satisfy multi-oriented object detection. Generally, anchor-based oriented object detection can be divided into four categories: (1) generating rotated proposal regions directly and classifying the class of selected regions [4,10]; (2) regressing the angle parameter θ in a five parameter representation ( x , y , w , h , θ ) directly or based on horizontal proposal regions [5,9,33,34,35]; (3) using shape mask predicted by the mask branch to locate the object region [36]; and (4) transforming regression of the angle parameter into classification problem to address the periodicity of the angle and boundary discontinuity [16,17]. Although the anchor-based methods have achieved promising results, there are still some limitations for anchor-based detectors, such as various hyperparameters, complex post-processing, and overlapping calculation.
To further improve the efficiency of oriented object detection, some modifications have been made to anchor-free detectors for horizontal object detection, including key point-based methods [37,38], pixel-based methods [25], and point set-based methods [21,24]. Many superior methods have emerged verifying the effectiveness of the representation mentioned above. For example, O 2 -Det [39] uses a pair of corresponding middle lines to locate rotated objects. In terms of overlapping calculation and boundary discontinuity, Yang et al. [40,41] transform the regression of the rotated bounding box to the Wasserstein Distance or Kullback–Leibler Divergence of 2-D Gaussian distributions, which achieves desirable results in oriented object detection.

2.1.2. Sample Assignment for Object Detection

Conventional object detection methods select positive and negative samples based on the fixed IoU threshold, i.e., MaxIoU strategy, which adopts IoU values as the only matching metric. Nevertheless, IoU-based assignment methods ignore the quality of training samples caused by the noise in the surroundings [42]. Various excellent adaptive sample assignment strategies have been proposed recently, which convert sample assignment into an optimization problem to select high-quality training samples. ATSS [20] uses a dynamic IoU threshold based on the statistical characteristic from the ground truth for the sample selection. FreeAnchor [43] enables the network to autonomously learn which anchor to match with the ground truth under the maximum likelihood principle. PPA [44] models the anchor assignment as a probabilistic procedure and calculates the scores of all anchors based on a probability distribution to determine the positive samples. DAL [45] defines a matching degree and sensitive loss to measure the localization potential of anchors, which enhances the correlation between classification and regression. SASM [22] utilizes the mean and standard deviation of the objects to capture shape information and add loss weights to each positive sample based on the quality.
In this paper, we divide the assignment into two phases: the initial stage and the refinement stage. In the initial stage, we utilize an IoU-based sample assignment, while we add a series of quality assessment strategies in the refinement stage, including center-ness constraint to filter noisy samples that can significantly enhance the effectiveness of adaptive points learning.

2.2. Overview of the Proposed Method

To alleviate boundary discontinuity, we adopt the adaptive point set proposed by [24] as a sophisticated representation of oriented bounding boxes instead of directly regressing the five parameters ( x , y , w , h , θ ) . As a fine-grained representation, a point set enables the detectors to capture key points with substantial semantic information and geometric structure, which helps locate small and densely packed objects with arbitrary orientations. To converge from the ground truth boxes, a differentiable conversion function is applied to get oriented bounding boxes from the representative points. In the backward process, the coordinates are updated through the loss designed to adaptively cover an oriented object. To improve the effectiveness of adaptive point sets, we suggest a center-ness quality assessment strategy based on [23] for an additional constraint on the selected positive samples, which can make adaptive points concentrate more on the object rather than the background. To further address the issue of the localization of small and cluttered objects, we design a repulsion constraint in the form of a loss function, which makes the proposal bounding boxes closer to their ground truth boxes while farther from the other surrounding ground truth or proposal boxes. The assignment of samples is divided into two phases. In the initial stage, the detector selects positive samples according to the IoU values. To improve the qualities of the selected samples, we design an assessment module to score each sample, where the center-ness constraint score is calculated to filter low-quality samples alongside the orientation, classification, and localization quality measurement strategies. In the refinement stage, only high-quality samples selected by the assessment module are used to calculate loss values. Figure 2 illustrates an overview of our proposed anchor-free oriented object detector based on Reppoint.

2.3. Deformable Convolutional Network

Traditional object detectors mainly use Convolutional Neural Networks (CNN) for feature encoding. However, the fixed receptive field of CNN leads to the defect that CNN can not capture information in the neighboring area. In the remote sensing images, objects are often sharply variable shapes, e.g., square tennis court and slender ship. While the defect appears to be more apparent, we alleviate it by adopting the Deformable Convolutional Network (DCN) [26] both in the classification and regression branches to capture shape-aware features of the objects. The process of DCN can be formulated as shown in Equation (1).
y ( p 0 ) = p n R w ( p n ) · x ( p o + p n + Δ p n ) ,
where w ( · ) denotes the filter weights, R = { ( 1 , 1 ) , ( 1 , 0 ) , , ( 1 , 0 ) , ( 1 , 1 ) } is receptive field size and dilation taking a 3 × 3 kernel with dilation 1 as an example. { Δ p n | n = 1 , , N } , N = | R | is the offset set of each point in the receptive field, and is calculated as shown in Equation (2).
Δ p n = C o n v ( F i ) R , i { 1 , , 5 } ,
where F i denotes the i-th scale feature map, and R is the standard CNN receptive field. The function C o n v ( · ) denotes a series of CNN layers and the dimension of its output is w × h × 18 , where w and h are the width and height of F i , respectively.
As shown in Figure 3, benefitting from the offset parameters, DCN gains the ability to aggregate information from the wider neighboring areas. As the offsets and the convolutional kernels are learned simultaneously during training, DCN can obtain dynamic and adaptive features of objects and is more sensitive to the variable shapes. More importantly, the inherent characteristic of DCN, i.e., learnable offset, perfectly fits the adaptive point set, which provides a more accurate localization of the oriented objects.

2.4. Center-Ness Constraint for Oriented Object Detection

Sample selection plays a critical role in the performance of detectors. Conventional IoU-based sample selection strategies overlook the shape information of the selected samples, which introduces many noisy samples and deteriorates the unbalance of positive and negative samples. In our proposed method, we divide the sample assignment into two phases: the initial stage and the refinement stage. In the refinement stage, all selected samples are assessed through our designed center-ness constraint alongside other strategies proposed by [23]. The center-ness constraint is first suggested in FCOS [25], aiming to remove redundant and meaningless proposal bounding boxes for horizontal object detection. Simply applying it in oriented object detection will introduce additional inconsistency between the distribution of the center-ness score and the oriented box. Concretely, the horizontal center-ness quality can not fit the oriented bounding box, as shown in Figure 4a. To modify this defect, we re-formulate the center-ness calculation process and make it fit the oriented bounding box appropriately. A horizontal bounding box can be simply expressed by ( x , y , w , h ) , where ( x , y ) , w, h denote the center point, width, and height of the horizontal bounding box, respectively. The center-ness score can be directly calculated by the offsets of the center point to the four edges.
In our proposed method, we utilize a point set P with nine points to represent an oriented bounding box, which is defined in Equation (3).
P = { ( x i , y i ) | i { 1 , , 9 } } ,
where each ( x i , y i ) in P is calculated by the corresponding offset Δ p n and point ( x , y ) in the feature map projected to the original size of the input image. The process can be expressed as shown in Equation (4).
( x i , y i ) = ( x , y ) + Δ p i .
To simplify the computation procedure, the point set P is converted into a rotated rectangle through the M i n A e r a R e c t ( · ) function to measure the center-ness quality. M i n A r e a R e c t uses the oriented rectangle with minimum area to cover all the points in P . Equation (5) demonstrates how this conversion is formulated.
( x 1 , y 1 , x 2 , y 2 , x 3 , y 3 , x 4 , y 4 ) = MinAeraRect ( P ) ,
where ( x 1 , y 1 , x 2 , y 2 , x 3 , y 3 , x 4 , y 4 ) denotes the four corner points of an oriented bounding box.
Since the vanilla center-ness proposed by FCOS [25] is measured w.r.t the axis-aligned edges, which can not be directly applied in oriented object detection, as shown in Figure 4, we suggest a distance function in the form of the cross product between the feature map point ( x , y ) and two adjacent corner points ( c x 1 , c y 1 ) and ( c x 2 , c y 2 ) , as shown in Equation (6).
c r o s s d i s t ( c x 1 , c y 1 , c x 2 , c y 2 | x , y ) = v 1 × v 2 v 1 = | ( c x 2 c x 1 ) ( c y 1 y ) ( c x 1 x ) ( c y 2 c y 1 ) | ( c x 2 c x 1 ) 2 + ( c y 2 c y 1 ) 2
With this formula, we can obtain four distance values between the four corner points ( x 1 , y 1 , x 2 , y 2 , x 3 , y 3 , x 4 , y 4 ) , as defined in Equation (7), given an oriented bounding box and feature map point ( x , y ) .
a = c r o s s d i s t ( x 1 , y 1 , x 2 , y 2 | x , y ) b = c r o s s d i s t ( x 2 , y 2 , x 3 , y 3 | x , y ) c = c r o s s d i s t ( x 3 , y 3 , x 4 , y 4 | x , y ) d = c r o s s d i s t ( x 4 , y 4 , x 1 , y 1 | x , y )
The oriented center-ness quality is then calculated as shown in Equation (8).
Q c e n t e r n e s s = m i n ( a , c ) m a x ( a , c ) · m i n ( b , d ) m a x ( b , d ) 1 γ ,
where γ is a hyper-parameter to control the sensitivity of the center-ness quality. As shown in Figure 5, the oriented center-ness constraint measured by the function above sufficiently evaluates the quality of an oriented bounding box. Q c e n t e r n e s s ranges from 0 to 1, depending on whether the feature point is on the edges or at the center point, respectively. The closer the feature point is to the center point of an oriented bounding box, the higher the quality score. The goal of oriented center-ness is to remove redundant and low-quality bounding boxes generated in the initial stage, which will reduce the computational cost in the post-processing steps, e.g., NMS.
Based on the quality measurement strategy Q, we re-assign the samples selected in the initial stage according to the quality scores. Only the top k samples are selected for each ground truth. To retrieve high-quality samples, a ratio σ is utilized to control the number of samples. The value of k is calculated as shown in Equation (9).
k = σ N t , N t 2 N t , N t < 2
where N t denotes the number of proposals for each oriented object.

2.5. Repulsion Constraint for Oriented Object Detection

To address the issue of locating small and cluttered objects, we propose a repulsion constraint to discriminate the densely distributed objects. As mentioned before, the vast majority of aerial images are taken from the bird’s-view and small objects are mostly in crowded scenes such as a parking lot. To locate them precisely, we should consider the spatial relative information, which means narrowing the gap between a proposal bounding box and its corresponding ground truth box and being away from other surrounding proposal and ground truth boxes. As illustrated in Figure 6, we utilize an IoU-based loss function to realize the repulsion constraint. A perfect proposal bounding box should have a maximum IoU to its ground truth while keeping IoUs within the surrounding ground truth and proposal bounding boxes.
Inspired by [27], we divide the oriented repulsion loss into three components, defined as shown in Equation (10).
L r e p u l s i o n = L a t t r + α L r g t + β L r p ,
where L a t t r aims to narrow the gap between predicted boxes and ground truth boxes, while L r g t and L r p are designed to minimize the intersection among the surrounding ground truth and predicted boxes, respectively. Hyper-parameters α and β are used to balance the loss weight.
In practice, there is an accommodation relationship among objects of different categories, e.g., aircraft and airports. For simplicity, we only consider the repulsion constraint for the objects from the same category. Let P + and G denote the sets of all positive samples and all ground truth boxes, respectively.
Given a ground truth box G G , we assign the proposal containing the maximum rotated IoU to it, denoted by P a t t r G = argmax P P + rIoU ( G , P ) . Then, L a t t r can be calculated as shown in Equation (11).
L a t t r = G G rIoU ( G , P a t t r G ) | G | ,
where rIoU ( · ) is used to calculate the IoU between the two oriented boxes.
L r g t is designed to repel a predicted box from its neighboring ground truth box. Here, we use intersection over ground truth: IoG ( P , G ) = area ( P G ) area ( G ) ( 0 , 1 ) to describe the spatial relationship between a predicted box and its neighboring ground truth box. For each G G , we define L r g t as shown in Equation (12).
L r g t = P P + \ P a t t r G Smooth ln IoG P , G | P + | ,
where Smooth ln function is applied to adjust the sensitivity of L r g t . Equation (13) provides a definition of Smooth ln .
Smooth ln = ln ( 1 x ) , x σ x σ 1 σ ln ( 1 σ ) , x > σ
NMS is an essential post-processing step in most detectors to select or merge the primary predicted bounding boxes. Especially for small and cluttered objects, NMS has a significant effect on the detection results. To alleviate the detectors’ sensitivity to NMS, we use an additional constraint L r p to minimize the overlap of two predicted boxes P i and P j , which are designated to different ground truth boxes. Equation (14) defines the definition of L r p .
L r p = i j Smooth ln rIoU P i , P j i j 1 rIoU P i , P j 0 + ϵ ,
where 1 ( · ) denotes the identity function and ϵ is introduced in case divided by 0.
Benefiting from the repulsion constraint, the loss L r e p u l s i o n preserves the independence among predicted boxes, while preventing them from shifting toward nearby ground truth boxes, which makes the detector more robust to small and cluttered objects.
Eventually, the loss function of our proposed detector is formulated as shown in Equation (15).
L = L c l s + λ 1 L l o c + λ 2 L r e p u l s i o n ,
where L c l s denotes the object classification loss, L l o c denotes regression loss for object localization, and L r e p u l s i o n is repulsion constraint loss. In the experiment, we use focal loss [13] for classification and GIoU loss [46] for oriented polygon regression.

3. Results

In this section, we first introduce four challenging datasets that we use to verify the effectiveness of our proposed method, then describe the details of our experiment settings, and finally illustrate our results on the datasets.

3.1. Datasets

DOTA [28] is one of the largest datasets for oriented object detection in aerial images; it contains 15 categories: plane (PL), baseball diamond (BD), ground track field (GTF), small vehicle (SV), large vehicle (LV), bridge (BR), tennis court (TC), storage tank (ST), ship (SH), soccer ball field (SBF), harbor (HA), roundabout (RA), helicopter (HC), swimming pool (SP), and basketball court (BC). Labeled objects are in a wide range of scales, shapes, and orientations. DOTA contains 2806 images and 188,282 instances collected from different sensors and platforms. Each images size ranges from 800 × 800 to 20,000 × 20,000 pixels. The proportions of the training set, validation set, and testing set in DOTA are 1/2 (1411 images), 1/6 (458 images), and 1/3 (937 images), respectively. In our experiments, both the training and validation sets are utilized to train the proposed detector and the testing set without annotations for evaluation. All the images used for training were split into patches of 1024 × 1024 pixels with a stride of 200 pixels. Data augmentation operations, including random resizing and flipping, were employed in the training stage to avoid overfitting.
HRSC2016 [29] is a dataset for ship recognition that contains a large number of deformed strip and oriented ship objects collected from several famous harbors. The entire dataset contains 1061 images with sizes ranging from 300 × 300 to 1500 × 900. For a fair comparison, the training and validation sets (436 images and 181 images, 617 images in total) are used for training, while the testing set (444 images) is used for evaluation. All images are resized to 800 × 512 pixels for training and testing.
UCAS-AOD [30] is an aerial image dataset that labels airplanes and cars with oriented bounding boxes. The dataset contains 1510 images with approximately 1280 × 659 pixels (510 images for car detection and 1000 images for airplane detection). There are 14,596 instances in total. The entire dataset is randomly divided into the training set, validation set, and testing set with a ratio of 5:2:3, i.e., 755 images, 302 images, and 453 images, respectively.
WHU-RSONE-OBB [31] is a large-scale object detection dataset with oriented bounding boxes that contains 5977 images ranging from 600 × 600 pixels to 1372 × 1024 pixels. WHU-RSONE-OBB is a high spatial resolution remote sensing image dataset with spatial resolution ranging from 0.5 m to 0.8 m. Objects are of three: airplanes, storage tanks, and ships. Likewise, the training set (4781 images) and the validation set (598 images) were employed for training while the testing set (598 images) was used for evaluation. All images were resized to 1024 × 1024 pixels for both training and testing.

3.2. Implementation Details

We implement our proposed method based on MMRotate [47], an open-source toolbox for rotated object detection based on PyTorch, and utilize ResNet-50 and ResNet-101 [48] as the backbone with FPN [12]. The FPN block consists of P 3 to P 7 pyramid levels in the experiments. The SGD optimizer was selected during training with an initial learning rate of 0.008. The number of warming-up iterations was 500. At each decay step, the learning rate was decreased by a factor of 0.1. The momentum and weight decay of SGD were set to 0.9 and 10 4 , respectively. We trained the detector with 40 epochs, 120 epochs, 120 epochs, and 40 epochs for DOTA, HRSC2016, UCAS-AOD, and WHU-RSONE-OBB, respectively. In Equation (8), we set the sensitivity of center-ness to γ = 4 . We set the balance weight to α = 0.5 and β = 0.5 empirically in Equation (10). Meanwhile, the weights for L l o c and L r e p u l s i o n were set to λ 1 = 1.0 and λ 2 = 0.25 in Equation (15), respectively.
We conducted all the experiments on a server with 2 NVIDIA RTX 3090 GPUs with a total batch size of four (two images per GPU) for training and a single NVIDIA RTX 3090 GPU for inference.

3.3. Comparisons with State-of-the-Art Methods

To verify the effectiveness of our proposed method, we conducted a series of experiments on DOTA, HRSC, UCAS-AOD, and WHU-RSONE-OBB. We adopted mean average precision (mAP) as the evaluation criteria for oriented object detection results, which can be calculated as shown in Equation (16).
m A P = 1 n i n A P i
where A P i denotes the value of the area under the precision–recall curve for the i-th class and n is the number of categories in one dataset.
Results on DOTA. As shown in Table 1, we report all the experimental results on the single-scale DOTA dataset to make fair comparisons with previous methods. The proposed method based on RepPoints obtains 76.93% mAP and 76.79% mAP with the backbone ResNet-50 and Resnet-101, respectively. It outperformed other methods with the same backbones. Using the tiny version of Swin-Transformer [49] with FPN, we achieved the best performance with 77.79% mAP. Notably, our results for the small vehicle (SV), which is a typical class of small and cluttered objects, consistently achieved the best performances under three different backbones, which demonstrates the effectiveness of our proposed method for small and cluttered objects.
Results on HRSC2016. Ship detection is a vital application direction of remote sensing images, where ships have large aspect ratios. Experiments on HRSC2016 have also verified the superiority of our proposed method. As shown in Table 2, our proposed method obtained 90.29% mAP, outperforming other methods listed in the table.
Results on UCAS-AOD. The UCAS-AOD dataset contains a mass of small and cluttered objects, which is competent to evaluate the effectiveness of our proposed method. All the experimental results are shown in Table 3 with our proposed method obtaining the best performance with 90.11% mAP. Although YOLOv7 [56] performs better in airplane detection, it lacks the ability to capture small and densely packed targets, such as cars, in remote sensing images.
Results on WHU-RSONE-OBB. To further verify the effectiveness of the proposed method, we conducted a series of experiments on the WHU-RSONE-OBB dataset. As shown in Table 4, our proposed method achieved the best AP values for plane and ship with 92.83% mAP.
Model size and efficiency. The parameter size and the inference speed are shown in Table 5. Our proposed model requires additional memory to compute the repulsion loss during the training stage. However, as center-ness and repulsion constraints are only calculated in the training stage, the inference speed is not affected by these two constraints during the inference stage.

3.4. Visualization of Results

To have an intuitive view of our proposed method, we selected some images from the testing set of the DOTA dataset to show the promising performance, as shown in Figure 7.

4. Discussion

In this section, we first demonstrate the superiority of the adaptive point set to represent the oriented bounding box. Secondly, we verify the effectiveness of our proposed center-ness quality assessment and repulsion constraint through a series of ablation studies. Thirdly, we explore the relationship among different categories via the confusion matrix on the DOTA validation set. Then, we further discuss how center-ness and repulsion constraints improve the distribution of localization scores. Finally, we discuss the limitation of the methods and possible future improvements.

4.1. Superiority of Adaptive Point Set

To examine the superiority of the adaptive point set to represent oriented boxes, we compare RepPoints with the anchor-based methods RoI-Trans [4] and R 3 Det [34] on the HRSC2016 dataset. RoI-Trans proposes a transformation module to effectively mitigate the misalignment between RoIs and targets, while R 3 Det utilizes a feature refinement module to reconstruct features. As shown in Table 6, the adaptive point set obtained nearly one percent enhancement with no bells and whistles, which displays its inherent superiority for the representation of oriented boxes.

4.2. Effectiveness of Center-Ness and Repulsion Constraints

To investigate the effectiveness of center-ness quality assessment and repulsion constraint, we compared them against the baseline method [23] without using them. Table 7 shows the experimental results.
Obviously, both center-ness and repulsion constraints improve the accuracy of the detector, especially the repulsion constraint, which considers the spatial correlation information and obtained a 0.34 mAP improvement compared with the baseline. Meanwhile, APs of three classic small and cluttered objects, plane, small vehicle, and ship, obtained consistent improvements. Although the center-ness constraint only has a slight improvement, with the collaboration of the repulsion constraint, the detector obtained a promising improvement with 0.96 mAP. This is because the center-ness constraint enforces the adaptive points to concentrate more on the center of objects, which is helpful to the localization tasks.

4.3. Correlation between Localization and Classification

To further explore how our proposed center-ness and repulsion constraints improve the quality of the proposals, we statistically analyze the correlation between the localization scores (IoU) and classification confidence of the predicted boxes. The closer the center of the distribution to the upper left corner is, the higher the quality of the predicted boxes the detector generates. In application scenarios, all the predicted boxes are filtered during the post-processing stage where NMS and IoU-thresholds are usually adopted. For a fair comparison, we only selected predicted boxes with no less than the IoU value of 0.5. All the experiments were conducted on the validation set of the DOTA dataset.
The experimental results are visualized in Figure 8. Obviously, the quality of the predicted boxes generated by the detector is more stable under the application of our two proposed constraints, compared to the baseline with no sample assessment strategy to filter low-quality samples. Furthermore, the center of quality distribution tends to move towards a higher degree under two constraints compared with simply applying one constraint.

4.4. Relationship among Categories

The confusion matrix is a standard format for expressing accuracy evaluation, which can visualize the detection results and discover the relevant information among categories. We provide the confusion matrix on the DOTA validation set to explore the detailed classification accuracy.
As shown in Figure 9, the detector is inferior at distinguishing between ground track and soccer ball fields, as they usually have similar shapes. Furthermore, in most scenarios, a soccer ball field is located within a ground track field. Moreover, we noticed that the detector mostly misidentifies the background targets as small and clustered targets such as small vehicles, which is mainly influenced by the complex scene environment. Meanwhile, the detector mostly misses objects such as ground track fields because they usually have the same color as the environment, and the iconic features are occluded by surrounding vegetation.

4.5. Failure Analysis

During the validation stage, we noticed some failure cases, as shown in Figure 10. The yellow ellipses are the targets missed by the detector. Obviously, the detector missed the ship full of containers and classified the containers on board as ships in the left image. While in the right image, the detector missed the black car and truck covered by a gray patch. In the first case, the container on the ship completely covers the texture features of the ship, which is such an abstract situation. Although humans can make correct judgments through prior knowledge, it is difficult to obtain the hidden global semantic information for the detector. In the second case, similar colors with background and image noises (the irregular patch) lead to the omission. As we adopt the adaptive point set for the representation of oriented boxes, backgrounds with similar color and image noises may lead to the absence of some key points of objects. In the future, we may explore the attention mechanism similar to [59,60] for feature fusion to address this issue.

4.6. Limitations and Future Directions

As mentioned before, we have verified the effectiveness of our proposed method through a series of carefully designed experiments on four challenging datasets. However, there are still some unsolved issues in our proposed method.
Since the measurement and assessment of samples are only carried out during the training process, it will not affect the speed of inference. Nevertheless, DCN requires more parameters than conventional CNN to obtain an adaptive receptive field, which leads to slower convergence of DCN during training.
In addition, there are usually hundreds or thousands of objects in one image under crowded scenarios, which leads to a sharp rise in computation cost in repulsion loss, especially computing rotated IoU values. In the experiments, we use a small trick to reduce the computation cost, where we use horizontal IoU values to exclude ulterior targets. In the future, we will try to exploit the Gaussian approximation methods proposed by [40,41] to simplify the calculation of the rotation IoU.
Finally, we notice that objects of some categories have a dependency relationship with each other, e.g., airplanes parking in airports and soccer ball fields inside ground track fields. We can utilize the prior knowledge of relationships between classes to improve the design of the repulsion loss.

5. Conclusions

In this work, we have presented an effective method for remote sensing object detection utilizing the adaptive point set to represent rotated boxes, which is able to capture key points with substantial semantic and geometric information. To improve the quality of sample selection and assignment, we introduce the center-ness constraint to assess the proposals and acquire high-quality samples. Furthermore, the repulsion constraint in the form of a loss function is designed to enhance the robustness of detecting small and clustered objects. Therefore, the extensive experiments on the four challenging datasets demonstrate the effectiveness of our proposed method.

Author Contributions

Conceptualization, L.G.; methodology, L.G. and H.G.; software, L.G. and Y.W.; validation, L.G. and Y.W.; formal analysis, L.G. and Y.W.; investigation, L.G., Y.W. and D.L.; resources, L.G. and H.G.; data curation, D.L.; writing—original draft preparation, L.G., Y.W. and B.M.M.; writing—review and editing, L.G. and B.M.M.; visualization, D.L.; supervision, H.G.; project administration, L.G. All authors have read and agreed to the published version of the manuscript.

Funding

This research work was supported by Sichuan Science and Technology Program (No. 2023YFG0021, No. 2022YFG0038, and No. 2021YFG0018), and by Xinjiang Science and Technology Program (No. 2022D01B185).

Data Availability Statement

DOTA, HRSC2016, UCAS-AOD, and WHU-RSONE-OBB are available at https://captain-whu.github.io/DOTA/index.html (accessed on 17 January 2023), https://www.kaggle.com/datasets/guofeng/hrsc2016 (accessed on 17 January 2023), https://github.com/fireae/UCAS-AOD-benchmark (accessed on 17 January 2023), and https://pan.baidu.com/share/init?surl=_Gdeedwo9dcEJqIh4eHHMA (password: 1234) (accessed on 17 January 2023), respectively. The source code is available at https://github.com/luilui97/Centerness-Repulsion-Object-Detection-OBB, (accessed on 6 March 2023).

Acknowledgments

We sincerely appreciate the constructive comments and suggestions of the anonymous reviewers, which have greatly helped to improve this paper.

Conflicts of Interest

The authors declare no conflict of interest.

Abbreviations

The following abbreviations are used in this manuscript:
CNNConvolution Neural Network
DCNDeformable Convolution Network
IoUIntersection over Union
FPNLinear Feature Pyramid Networks
SGDStochastic Gradient Descent
mAPMean Average Precision
NMSNon-Maximum Suppression
RoIRegion of Interests

References

  1. Girshick, R.; Donahue, J.; Darrell, T.; Malik, J. Rich Feature Hierarchies for Accurate Object Detection and Semantic Segmentation. In Proceedings of the IEEE Conference on Computer Vision and Pattern Recognition (CVPR), Columbus, OH, USA, 23–28 June 2014. [Google Scholar]
  2. Girshick, R.B. Fast R-CNN. In Proceedings of the IEEE International Conference on Computer Vision (ICCV), Santiago, Chile, 7–13 December 2015; pp. 1440–1448. [Google Scholar]
  3. Ren, S.; He, K.; Girshick, R.B.; Sun, J. Faster R-CNN: Towards Real-Time Object Detection with Region Proposal Networks. IEEE Trans. Pattern Anal. Mach. Intell. 2017, 39, 1137–1149. [Google Scholar] [CrossRef] [PubMed] [Green Version]
  4. Ding, J.; Xue, N.; Long, Y.; Xia, G.; Lu, Q. Learning RoI Transformer for Oriented Object Detection in Aerial Images. In Proceedings of the IEEE/CVF Conference on Computer Vision and Pattern Recognition (CVPR), Long Beach, CA, USA, 15–20 June 2019; pp. 2849–2858. [Google Scholar]
  5. Han, J.; Ding, J.; Li, J.; Xia, G. Align Deep Features for Oriented Object Detection. IEEE Trans. Geosci. Remote Sens. 2022, 60, 1–11. [Google Scholar] [CrossRef]
  6. Ding, J.; Xue, N.; Xia, G.; Bai, X.; Yang, W.; Yang, M.Y.; Belongie, S.J.; Luo, J.; Datcu, M.; Pelillo, M.; et al. Object Detection in Aerial Images: A Large-Scale Benchmark and Challenges. IEEE Trans. Pattern Anal. Mach. Intell. 2022, 44, 7778–7796. [Google Scholar] [CrossRef]
  7. Guo, Z.; Liu, C.; Zhang, X.; Jiao, J.; Ji, X.; Ye, Q. Beyond bounding-box: Convex-hull feature adaptation for oriented and densely packed object detection. In Proceedings of the IEEE/CVF Conference on Computer Vision and Pattern Recognition, Nashville, TN, USA, 20–25 June 2021; pp. 8792–8801. [Google Scholar]
  8. Yang, F.; Fan, H.; Chu, P.; Blasch, E.; Ling, H. Clustered Object Detection in Aerial Images. In Proceedings of the IEEE International Conference on Computer Vision (ICCV), Seoul, Republic of Korea, 27 October–2 November 2019; pp. 8310–8319. [Google Scholar]
  9. Yang, X.; Yang, J.; Yan, J.; Zhang, Y.; Zhang, T.; Guo, Z.; Sun, X.; Fu, K. SCRDet: Towards More Robust Detection for Small, Cluttered and Rotated Objects. In Proceedings of the IEEE International Conference on Computer Vision (ICCV), Seoul, Republic of Korea, 27 October–2 November 2019; pp. 8231–8240. [Google Scholar]
  10. Azimi, S.M.; Vig, E.; Bahmanyar, R.; Körner, M.; Reinartz, P. Towards Multi-class Object Detection in Unconstrained Remote Sensing Imagery. In Lecture Notes in Computer Science, Proceedings of the ACCV, Perth, Australia, 2–6 December 2018; Springer: Berlin/Heidelberg, Germany, 2018; Volume 11363, pp. 150–165. [Google Scholar]
  11. Jiao, J.; Zhang, Y.; Sun, H.; Yang, X.; Gao, X.; Hong, W.; Fu, K.; Sun, X. A Densely Connected End-to-End Neural Network for Multiscale and Multiscene SAR Ship Detection. IEEE Access 2018, 6, 20881–20892. [Google Scholar] [CrossRef]
  12. Lin, T.; Dollár, P.; Girshick, R.B.; He, K.; Hariharan, B.; Belongie, S.J. Feature Pyramid Networks for Object Detection. In Proceedings of the IEEE Conference on Computer Vision and Pattern Recognition (CVPR), Honolulu, HI, USA, 21–26 July 2017; pp. 936–944. [Google Scholar]
  13. Lin, T.; Goyal, P.; Girshick, R.B.; He, K.; Dollár, P. Focal Loss for Dense Object Detection. In Proceedings of the IEEE International Conference on Computer Vision (ICCV), Venice, Italy, 22–29 October 2017; pp. 2999–3007. [Google Scholar]
  14. Zhou, X.; Wang, D.; Krähenbühl, P. Objects as Points. arXiv 2019, arXiv:1904.07850. [Google Scholar]
  15. Qian, W.; Yang, X.; Peng, S.; Yan, J.; Guo, Y. Learning Modulated Loss for Rotated Object Detection. In Proceedings of the AAAI Conference on Artificial Intelligence, Vancouver, BC, Canada, 2–9 February 2021; pp. 2458–2466. [Google Scholar]
  16. Yang, X.; Yan, J. Arbitrary-Oriented Object Detection with Circular Smooth Label. In Lecture Notes in Computer Science, Proceedings of the European Conference on Computer Vision (ECCV), Glasgow, UK, 23–28 August 2020; Springer: Berlin/Heidelberg, Germany, 2020; Volume 12353, pp. 677–694. [Google Scholar]
  17. Yang, X.; Hou, L.; Zhou, Y.; Wang, W.; Yan, J. Dense Label Encoding for Boundary Discontinuity Free Rotation Detection. In Proceedings of the IEEE Conference on Computer Vision and Pattern Recognition (CVPR), Nashville, TN, USA, 20–25 June 2021; pp. 15819–15829. [Google Scholar]
  18. Li, C.; Xu, C.; Cui, Z.; Wang, D.; Zhang, T.; Yang, J. Feature-Attentioned Object Detection in Remote Sensing Imagery. In Proceedings of the 2019 IEEE International Conference on Image Processing (ICIP), Taipei, Taiwan, 22–25 September 2019; pp. 3886–3890. [Google Scholar]
  19. Pan, X.; Ren, Y.; Sheng, K.; Dong, W.; Yuan, H.; Guo, X.; Ma, C.; Xu, C. Dynamic Refinement Network for Oriented and Densely Packed Object Detection. In Proceedings of the IEEE Conference on Computer Vision and Pattern Recognition (CVPR), Seattle, WA, USA, 13–19 June 2020; pp. 11204–11213. [Google Scholar]
  20. Zhang, S.; Chi, C.; Yao, Y.; Lei, Z.; Li, S.Z. Bridging the Gap Between Anchor-Based and Anchor-Free Detection via Adaptive Training Sample Selection. In Proceedings of the 2020 IEEE/CVF Conference on Computer Vision and Pattern Recognition (CVPR), Seattle, WA, USA, 13–19 June 2020; pp. 9756–9765. [Google Scholar] [CrossRef]
  21. Chen, Y.; Zhang, Z.; Cao, Y.; Wang, L.; Lin, S.; Hu, H. RepPoints v2: Verification Meets Regression for Object Detection. In Proceedings of the NeurIPS, Virtual, 6–12 December 2020. [Google Scholar]
  22. Hou, L.; Lu, K.; Xue, J.; Li, Y. Shape-Adaptive Selection and Measurement for Oriented Object Detection. In Proceedings of the Thirty-Sixth AAAI Conference on Artificial Intelligence (AAAI 2022), Thirty-Fourth Conference on Innovative Applications of Artificial Intelligence (IAAI 2022), The Twelveth Symposium on Educational Advances in Artificial Intelligence (EAAI 2022), Virtual Event, 22 February–1 March 2022; pp. 923–932. [Google Scholar]
  23. Li, W.; Chen, Y.; Hu, K.; Zhu, J. Oriented RepPoints for Aerial Object Detection. In Proceedings of the IEEE Conference on Computer Vision and Pattern Recognition (CVPR), New Orleans, LA, USA, 18–24 June 2022; pp. 1819–1828. [Google Scholar]
  24. Yang, Z.; Liu, S.; Hu, H.; Wang, L.; Lin, S. RepPoints: Point Set Representation for Object Detection. In Proceedings of the IEEE International Conference on Computer Vision (ICCV), Seoul, Republic of Korea, 27 October–2 November 2019; pp. 9656–9665. [Google Scholar]
  25. Tian, Z.; Shen, C.; Chen, H.; He, T. FCOS: Fully Convolutional One-Stage Object Detection. In Proceedings of the IEEE International Conference on Computer Vision (ICCV), Seoul, Republic of Korea, 27 October–2 November 2019; pp. 9626–9635. [Google Scholar]
  26. Dai, J.; Qi, H.; Xiong, Y.; Li, Y.; Zhang, G.; Hu, H.; Wei, Y. Deformable Convolutional Networks. In Proceedings of the IEEE International Conference on Computer Vision (ICCV), Venice, Italy, 22–29 October 2017; pp. 764–773. [Google Scholar]
  27. Wang, X.; Xiao, T.; Jiang, Y.; Shao, S.; Sun, J.; Shen, C. Repulsion Loss: Detecting Pedestrians in a Crowd. In Proceedings of the IEEE Conference on Computer Vision and Pattern Recognition (CVPR), Salt Lake City, UT, USA, 18–22 June 2018; pp. 7774–7783. [Google Scholar]
  28. Xia, G.; Bai, X.; Ding, J.; Zhu, Z.; Belongie, S.J.; Luo, J.; Datcu, M.; Pelillo, M.; Zhang, L. DOTA: A Large-Scale Dataset for Object Detection in Aerial Images. In Proceedings of the IEEE Conference on Computer Vision and Pattern Recognition (CVPR), Salt Lake City, UT, USA, 18–22 June 2018; pp. 3974–3983. [Google Scholar]
  29. Liu, Z.; Yuan, L.; Weng, L.; Yang, Y. A High Resolution Optical Satellite Image Dataset for Ship Recognition and Some New Baselines. In Proceedings of the 6th International Conference on Pattern Recognition Applications and Methods (ICPRAM), Porto, Portugal, 24–26 February 2017; pp. 324–331. [Google Scholar]
  30. Zhu, H.; Chen, X.; Dai, W.; Fu, K.; Ye, Q.; Jiao, J. Orientation robust object detection in aerial images using deep convolutional neural network. In Proceedings of the 2015 IEEE International Conference on Image Processing (ICIP), Quebec City, QC, Canada, 27–30 September 2015; pp. 3735–3739. [Google Scholar]
  31. Dong, Z.; Wang, M.; Wang, Y.; Liu, Y.; Feng, Y.; Xu, W. Multi-Oriented Object Detection in High-Resolution Remote Sensing Imagery Based on Convolutional Neural Networks with Adaptive Object Orientation Features. Remote Sens. 2022, 14, 950. [Google Scholar] [CrossRef]
  32. Han, J.; Ding, J.; Xue, N.; Xia, G. ReDet: A Rotation-Equivariant Detector for Aerial Object Detection. In Proceedings of the IEEE Conference on Computer Vision and Pattern Recognition (CVPR), Nashville, TN, USA, 20–25 June 2021; pp. 2786–2795. [Google Scholar]
  33. Zhang, G.; Lu, S.; Zhang, W. CAD-Net: A Context-Aware Detection Network for Objects in Remote Sensing Imagery. IEEE Trans. Geosci. Remote Sens. 2019, 57, 10015–10024. [Google Scholar] [CrossRef] [Green Version]
  34. Yang, X.; Yan, J.; Feng, Z.; He, T. R3Det: Refined Single-Stage Detector with Feature Refinement for Rotating Object. In Proceedings of the AAAI Conference on Artificial Intelligence, Vancouver, BC, Canada, 2–9 February 2021; pp. 3163–3171. [Google Scholar]
  35. Yang, X.; Yan, J.; Liao, W.; Yang, X.; Tang, J.; He, T. Scrdet++: Detecting small, cluttered and rotated objects via instance-level feature denoising and rotation loss smoothing. IEEE Trans. Pattern Anal. Mach. Intell. 2022, 45, 2384–2399. [Google Scholar] [CrossRef] [PubMed]
  36. Li, Y.; Huang, Q.; Pei, X.; Jiao, L.; Shang, R. RADet: Refine Feature Pyramid Network and Multi-Layer Attention Network for Arbitrary-Oriented Object Detection of Remote Sensing Images. Remote Sens. 2020, 12, 389. [Google Scholar] [CrossRef] [Green Version]
  37. Zhou, X.; Zhuo, J.; Krähenbühl, P. Bottom-Up Object Detection by Grouping Extreme and Center Points. In Proceedings of the IEEE Conference on Computer Vision and Pattern Recognition (CVPR), Long Beach, CA, USA, 16–20 June 2019; pp. 850–859. [Google Scholar] [CrossRef] [Green Version]
  38. Duan, K.; Bai, S.; Xie, L.; Qi, H.; Huang, Q.; Tian, Q. CenterNet: Keypoint Triplets for Object Detection. In Proceedings of the 2019 IEEE/CVF International Conference on Computer Vision (ICCV), Seoul, Republic of Korea, 27 October–2 November 2019; pp. 6568–6577. [Google Scholar] [CrossRef] [Green Version]
  39. Wei, H.; Zhang, Y.; Chang, Z.; Li, H.; Wang, H.; Sun, X. Oriented objects as pairs of middle lines. ISPRS J. Photogramm. Remote Sens. 2020, 169, 268–279. [Google Scholar] [CrossRef]
  40. Yang, X.; Yan, J.; Ming, Q.; Wang, W.; Zhang, X.; Tian, Q. Rethinking Rotated Object Detection with Gaussian Wasserstein Distance Loss. In Proceedings of the International Conference on Machine Learning (ICML), Virtual Event, 18–24 July 2021; pp. 11830–11841. [Google Scholar]
  41. Yang, X.; Yang, X.; Yang, J.; Ming, Q.; Wang, W.; Tian, Q.; Yan, J. Learning High-Precision Bounding Box for Rotated Object Detection via Kullback-Leibler Divergence. In Proceedings of the NeurIPS, Virtual, 6–14 December 2021; pp. 18381–18394. [Google Scholar]
  42. Li, H.; Wu, Z.; Zhu, C.; Xiong, C.; Socher, R.; Davis, L.S. Learning From Noisy Anchors for One-Stage Object Detection. In Proceedings of the 2020 IEEE/CVF Conference on Computer Vision and Pattern Recognition (CVPR), Seattle, WA, USA, 13–19 June 2020; pp. 10585–10594. [Google Scholar] [CrossRef]
  43. Zhang, X.; Wan, F.; Liu, C.; Ji, R.; Ye, Q. FreeAnchor: Learning to Match Anchors for Visual Object Detection. In Proceedings of the Advances in Neural Information Processing Systems 32: Annual Conference on Neural Information Processing Systems 2019 (NeurIPS 2019), Vancouver, BC, Canada, 8–14 December 2019; pp. 147–155. [Google Scholar]
  44. Kim, K.; Lee, H.S. Probabilistic Anchor Assignment with IoU Prediction for Object Detection. In Lecture Notes in Computer Science, Proceedings of the Computer Vision–ECCV 2020—16th European Conference, Glasgow, UK, 23–28 August 2020; Vedaldi, A., Bischof, H., Brox, T., Frahm, J., Eds.; Springer: Berlin/Heidelberg, Germany, 2020; Volume 12370, pp. 355–371. [Google Scholar] [CrossRef]
  45. Ming, Q.; Zhou, Z.; Miao, L.; Zhang, H.; Li, L. Dynamic Anchor Learning for Arbitrary-Oriented Object Detection. In Proceedings of the AAAI Conference on Artificial Intelligence, Vancouver, BC, Canada, 2–9 February 2021; pp. 2355–2363. [Google Scholar]
  46. Rezatofighi, H.; Tsoi, N.; Gwak, J.; Sadeghian, A.; Reid, I.D.; Savarese, S. Generalized Intersection Over Union: A Metric and a Loss for Bounding Box Regression. In Proceedings of the IEEE Conference on Computer Vision and Pattern Recognition (CVPR), Long Beach, CA, USA, 16–20 June 2019; pp. 658–666. [Google Scholar] [CrossRef] [Green Version]
  47. Zhou, Y.; Yang, X.; Zhang, G.; Wang, J.; Liu, Y.; Hou, L.; Jiang, X.; Liu, X.; Yan, J.; Lyu, C.; et al. MMRotate: A Rotated Object Detection Benchmark using PyTorch. In Proceedings of the 30th ACM International Conference on Multimedia, Lisboa, Portugal, 10–14 October 2022. [Google Scholar]
  48. He, K.; Zhang, X.; Ren, S.; Sun, J. Deep Residual Learning for Image Recognition. In Proceedings of the 2016 IEEE Conference on Computer Vision and Pattern Recognition (CVPR), Las Vegas, NV, USA, 27–30 June 2016; pp. 770–778. [Google Scholar] [CrossRef] [Green Version]
  49. Liu, Z.; Lin, Y.; Cao, Y.; Hu, H.; Wei, Y.; Zhang, Z.; Lin, S.; Guo, B. Swin Transformer: Hierarchical Vision Transformer using Shifted Windows. In Proceedings of the 2021 IEEE/CVF International Conference on Computer Vision (ICCV), Montreal, QC, Canada, 10–17 October 2021; pp. 9992–10002. [Google Scholar] [CrossRef]
  50. Wang, J.; Yang, W.; Li, H.; Zhang, H.; Xia, G. Learning Center Probability Map for Detecting Objects in Aerial Images. IEEE Trans. Geosci. Remote Sens. 2021, 59, 4307–4323. [Google Scholar] [CrossRef]
  51. Wang, J.; Ding, J.; Guo, H.; Cheng, W.; Pan, T.; Yang, W. Mask OBB: A Semantic Attention-Based Mask Oriented Bounding Box Representation for Multi-Category Object Detection in Aerial Images. Remote Sens. 2019, 11, 2930. [Google Scholar] [CrossRef] [Green Version]
  52. Xu, Y.; Fu, M.; Wang, Q.; Wang, Y.; Chen, K.; Xia, G.; Bai, X. Gliding Vertex on the Horizontal Bounding Box for Multi-Oriented Object Detection. IEEE Trans. Pattern Anal. Mach. Intell. 2021, 43, 1452–1459. [Google Scholar] [CrossRef] [PubMed] [Green Version]
  53. Xie, X.; Cheng, G.; Wang, J.; Yao, X.; Han, J. Oriented R-CNN for Object Detection. In Proceedings of the IEEE International Conference on Computer Vision (ICCV), Montreal, QC, Canada, 10–17 October 2021; pp. 3500–3509. [Google Scholar]
  54. Chen, Z.; Chen, K.; Lin, W.; See, J.; Yu, H.; Ke, Y.; Yang, C. PIoU Loss: Towards Accurate Oriented Object Detection in Complex Environments. In Lecture Notes in Computer Science, Proceedings of the European Conference on Computer Vision (ECCV), Glasgow, UK, 23–28 August 2020; Springer: Berlin/Heidelberg, Germany, 2020; Volume 12350, pp. 195–211. [Google Scholar]
  55. Liao, M.; Zhu, Z.; Shi, B.; Xia, G.; Bai, X. Rotation-Sensitive Regression for Oriented Scene Text Detection. In Proceedings of the 2018 IEEE Conference on Computer Vision and Pattern Recognition (CVPR), Salt Lake City, UT, USA, 18–22 June 2018; pp. 5909–5918. [Google Scholar] [CrossRef] [Green Version]
  56. Wang, C.Y.; Bochkovskiy, A.; Liao, H.Y.M. YOLOv7: Trainable bag-of-freebies sets new state-of-the-art for real-time object detectors. arXiv 2022, arXiv:2207.02696. [Google Scholar]
  57. Redmon, J.; Farhadi, A. Yolov3: An incremental improvement. arXiv 2018, arXiv:1804.02767. [Google Scholar]
  58. Dong, Z.; Wang, M.; Wang, Y.; Zhu, Y.; Zhang, Z. Object Detection in High Resolution Remote Sensing Imagery Based on Convolutional Neural Networks With Suitable Object Scale Features. IEEE Trans. Geosci. Remote Sens. 2020, 58, 2104–2114. [Google Scholar] [CrossRef]
  59. Sun, L.; Cheng, S.; Zheng, Y.; Wu, Z.; Zhang, J. SPANet: Successive Pooling Attention Network for Semantic Segmentation of Remote Sensing Images. IEEE J. Sel. Top. Appl. Earth Obs. Remote Sens. 2022, 15, 4045–4057. [Google Scholar] [CrossRef]
  60. Yin, P.; Zhang, D.; Han, W.; Li, J.; Cheng, J. High-Resolution Remote Sensing Image Semantic Segmentation via Multiscale Context and Linear Self-Attention. IEEE J. Sel. Top. Appl. Earth Obs. Remote Sens. 2022, 15, 9174–9185. [Google Scholar] [CrossRef]
Figure 1. Horizontal bounding box (a) versus oriented bounding box (b), taking ship detection as an example. Point ( x , y ) denotes the coordinates of the center point of the target, while ( w , h ) denotes the width and height of the bounding boxes, respectively. The oriented bounding box, in particular, utilizes an extra parameter θ to represent the angle information making it better for locating aerial targets.
Remotesensing 15 01479 g001
Figure 2. The pipeline of our proposed object detector. The proposed method is an anchor-free detector based on Reppoint [24] with adaptive point sets as the representation of an oriented bounding box, where a classical backbone with FPN [12] network is employed to encode multi-scale features. Deformable Convolutional Network (DCN) is utilized to capture shape-aware features. To cope with the harmony of the classification branch and the regression branch, the offset parameter is shared in the DCN block.
Remotesensing 15 01479 g002
Figure 3. Illustration of standard CNN in (a) and DCN in (b). DCN utilizes an additional offset learned from the feature map to obtain a wider receptive field compared with CNN.
Remotesensing 15 01479 g003
Figure 4. Heatmap of the horizontal and oriented center-ness. The distributions of horizontal and oriented center-ness scores are indicated by the ellipses with a yellow dotted outline.
Remotesensing 15 01479 g004
Figure 5. Illustration of the oriented center-ness. The four blue dots, red dots, and green dots denote the corner points of an oriented bounding box, the feature map point ( x , y ) , and the center point of the oriented bounding box, respectively.
Remotesensing 15 01479 g005
Figure 6. Visualization of repulsion constraint in the form of the loss function.
Remotesensing 15 01479 g006
Figure 7. Visualization of the example detection results on DOTA testing set.
Remotesensing 15 01479 g007
Figure 8. The correlation between the localization scores and classification confidence of predicted oriented boxes under four conditions: no center-ness and no repulsion constraints, center-ness constraint only, repulsion constraints only, and both center-ness and repulsion constraints. All the experiments adopt ResNet-50 with FPN as the backbone. The baseline is Rotated RepPoints [24].
Remotesensing 15 01479 g008
Figure 9. Normalized confusion matrix of detection results on the DOTA validation set.
Remotesensing 15 01479 g009
Figure 10. Failure cases for ship detection and small vehicle. Failures are marked by yellow ellipses.
Remotesensing 15 01479 g010
Table 1. Comparisons with state-of-the-art methods on the DOTA dataset. All the reported results were performed on the single-scale DOTA. The results with red color denote the best results in each column.
TypeMethodsBackbonePLBDBRGTFSVLVSHTCBCSTSBFRAHASPHCmAP
Single-stageRetinaNet-O [13]R-5088.6777.6241.8158.1774.5871.6479.1190.2982.1874.3254.7560.6062.5769.6760.6468.43
DAL [45]R-10188.6179.6946.2770.3765.8976.1078.5390.8479.9878.4158.7162.0269.2371.3260.6571.78
RSDet [15]R-15290.1082.0053.8068.5070.2078.7073.6091.2087.1084.7064.3068.2066.1069.3063.7074.10
R 3 Det [34]R-15289.4981.1750.5366.1070.9278.6678.2190.8185.2684.2361.8163.7768.1669.8367.1773.74
S 2 A-Net [5]R-5089.1182.8448.3771.1178.1178.3987.2590.8384.9085.6460.3662.6065.2669.1357.9474.12
R 3 Det-DCL [17]R-15289.7883.9552.6369.7076.8481.2687.3090.8184.6785.2763.5064.1668.9668.7965.4575.54
Two-stageFaster RCNN [3]R-5088.4473.0644.8659.0973.2571.4977.1190.8478.9483.9048.5962.9562.1864.9156.1869.05
CAD-Net [33]R-10187.8082.4049.4073.5071.1063.5076.6090.9079.2073.3048.4060.9062.0067.0062.2069.90
CenterMap [50]R-5088.8881.2453.1560.6578.6266.5578.1088.8377.8083.6149.3666.1972.1072.3658.7071.74
SCRDet [9]R-10189.9880.6552.0968.3668.3660.3272.4190.8587.9486.8665.0266.6866.2568.2465.2172.61
FAOD [18]R-10190.2179.5845.4976.4173.1868.2779.5690.8383.4084.6853.4065.4274.1769.6964.8673.28
RoI-Trans. [4]R-10188.6582.6052.5370.8777.9376.6786.8790.7183.8382.5153.9567.6174.6768.7561.0374.61
MaskOBB [51]R-5089.6185.0951.8572.9075.2873.2385.5790.3782.0885.0555.7368.3971.6169.8766.3374.86
Gliding Vertex [52]R-10189.6485.0052.2677.3473.0173.1486.8290.7479.0286.8159.5570.9172.9470.8657.3275.02
ReDet [32]ReR-5088.7982.6453.9774.0078.1384.0688.0490.8987.7885.7561.7660.3975.9668.0763.5976.25
Oriented R-CNN [53]R-10188.8683.4855.2776.9274.2782.1087.5290.9085.5685.3365.5166.8274.3670.1557.2876.28
Anchor-freeCenterNet-O [14]DLA-34 [14]81.0064.0022.6056.6038.6064.0064.9090.8078.0072.5044.0041.1055.5055.0057.4059.10
PIoU [54]DLA-3480.9069.7024.1060.2038.3064.4064.8090.9077.2070.4046.5037.1057.1061.9064.0060.50
O 2 -DNet [39]H-10489.3182.1447.3361.2171.3274.0378.6290.7682.2381.3660.9360.1758.2166.9861.0371.04
DRN [19]H-10489.7182.3447.2264.1076.2274.4385.8490.5786.1884.8957.6561.9369.3069.6358.4873.23
CFA [7]R-10189.2681.7251.8167.1779.9978.2584.4690.7783.4085.5454.8667.7573.0470.2464.9675.05
Oriented RepPoints [23]R-10189.5384.0759.8671.7679.9580.0387.3390.8487.5485.2359.1566.3775.2373.7557.2376.52
OursR-5088.3984.0054.6873.5880.8980.3887.6090.9085.3386.9364.4869.8574.7272.3259.9876.93
OursR-10188.5083.8454.3571.1180.9380.2587.6490.9085.1187.0064.0770.1275.1272.8560.1576.79
OursSwin-T88.9084.1355.2475.6881.8482.9887.7590.9086.1286.4564.1769.1076.9073.4763.2577.79
Table 2. Results on HRSC2016. The best result is bolded.
MethodsBackbonemAP
RRD [55]VGG1684.30
RoI-Trans. [4]R-101-FPN86.20
R 3 Det-KLD [41]R-101-FPN87.45
CenterNet-O [14]DLA-3487.89
Gliding Vertex [52]R-101-FPN88.20
RetinaNet-O [13]R-101-FPN89.18
PIOU [54]DLA-3489.20
R 3 Det [34]R-101-FPN89.26
R 3 Det-DCL [17]R-101-FPN89.46
FPN-CSL [16]R-101-FPN89.62
DAL [45]R-101-FPN89.77
OursR-50-FPN90.29
Table 3. Results on UCAS-AOD. The best result is bolded in each column.
MethodsCarAirplanemAP
YOLOv3-O [57]74.6389.5282.08
RetinaNet-O [13]84.6490.5187.57
Faster RCNN [3]86.8789.8688.36
RoI Trans. [4]87.9989.9088.95
DAL [45]89.2590.4989.87
YOLOv7-O [56]83.3596.5389.94
Oriented RepPoints [23]89.5190.7090.11
Ours89.7390.7890.26
Table 4. Result on WHU-RSONE-OBB. The best result is bolded in each column.
MethodsAirplaneStorage-TankShipmAP
Faster-RCNN [3]94.8656.3476.3875.86
CNN-SOSF [58]95.2174.6175.2081.67
YOLOv3-O [57]97.7687.0978.6587.84
CNN-AOOF [31]98.5788.3179.2088.69
YOLOv7-O [56]98.6595.6979.0291.12
Ours99.5790.5488.3892.83
Table 5. Model size and efficiency. For a fair comparison, all the models utilized ResNet-50 as the backbone with a single NVIDIA RTX 2080S GPU.
MethodBackboneParamInf Time (fps)
RetinaNet-O [13]R-5036.42 M17.2
S 2 A-Net [5]R-5038.6 M15.5
Gliding Vertex [52]R-5041.14 M16.4
RoI-Trans. [4]R-5055.13 M16.5
R 3 Det [34]R-5041.9 M12.4
OursR-5036.61M16.8
Table 6. Comparisons between anchor-based orientation regression methods and our adaptive-point-set-based method. The best result is bolded.
MethodsBackbonemAP
RoI-Trans. [4]R-10186.20
R3Det [34]R-10189.26
RepPoints(adaptive point set)R-5090.02
Table 7. Performance evaluation on center-ness quality assessment and repulsion constraint. PL, SV, and SH denote the categories of plane, small vehicle, and ship, respectively. All the experiments adopt ResNet-50 with FPN as the backbone. ‘✓’ and ‘✕’ in the Center-ness and Repulsion columns denote the results with or without the corresponding constraint, respectively. We adopted ConvexGIoULoss for regression loss if the repulsion constraint is not applied. The best result is bolded in each column.
Center-nessRepulsionPLSVSHmAPΔ
87.0280.1887.2875.97-
88.3080.7887.5176.050.08
88.6680.7387.5476.310.34
88.3980.8887.6076.930.96
Disclaimer/Publisher’s Note: The statements, opinions and data contained in all publications are solely those of the individual author(s) and contributor(s) and not of MDPI and/or the editor(s). MDPI and/or the editor(s) disclaim responsibility for any injury to people or property resulting from any ideas, methods, instructions or products referred to in the content.

