Article

Mapping Maize Tillage Practices over the Songnen Plain in Northeast China Using GEE Cloud Platform

1
College of Information Technology, Jilin Agricultural University, Changchun 130118, China
2
Northeast Institute of Geography and Agroecology, Chinese Academy of Sciences, Changchun 130102, China
*
Author to whom correspondence should be addressed.
Remote Sens. 2023, 15(5), 1461; https://doi.org/10.3390/rs15051461
Submission received: 3 February 2023 / Revised: 2 March 2023 / Accepted: 3 March 2023 / Published: 5 March 2023
(This article belongs to the Section Remote Sensing in Agriculture and Vegetation)

Abstract

:
As the population grows, the development of conservation tillage offers a means of promoting the sustainability of agricultural engineering. Remote sensing images with high spatial and temporal resolutions enable the accurate monitoring of conservation tillage on a broad spatial scale, further promoting conservation tillage research. This paper describes using streamlined time series Sentinel-2 images based on the Google Earth Engine (GEE) cloud platform for mapping maize tillage practices in the Songnen Plain region of Northeast China. Based on the correlation with the normalized difference tillage index (NDTI) and maize residue coverage (MRC) data, the optimal time series and streamlining functions in the GEE cloud platform are determined. Estimates of MRC and the mapping of tillage practices in the Songnen Plain for 2019–2022 are then determined using GEE and a previous model. Geostatistical analysis using ArcGIS is applied to analyze the spatial and temporal distribution characteristics of MRC and conservation tillage over the Songnen Plain. The results show that time series images from 20–30 May achieve an r value of 0.902 and an R2 value of 0.8136 when using the median streamlining function. The mean MRC for the study area in 2022 is 2.3%, and an overall upward trend in conservation tillage is observed (from 0.08% in 2019 to 0.25% in 2022). Our analysis shows that MRC monitoring and conservation tillage mapping can be performed over a broad spatial scale using remote sensing technology based on the GEE cloud platform. Spatial and temporal information on farm practices provides a theoretical basis for agricultural development planning efforts, which can promote sustainable agricultural development.

1. Introduction

According to the UN Department of Economic and Social Affairs, the world population is expected to increase to 8.5 billion by 2030, 9.7 billion by 2050, and 11.2 billion by 2100 [1]. As the population grows, food security and environmental safety will be threatened, and agricultural technology will play an essential role in responding to these threats. The development of conservation tillage can promote the sustainability of agricultural technology in many ways. For example, conservation tillage can increase crop yields by 4–6%, increase soil organic matter content by 7–45%, reduce wind and water erosion by up to 70%, reduce CO2 emissions by up to 80%, and reduce planting costs by 35.6–44.4% compared with conventional tillage [2]. Conservation tillage has been implemented since the 1990s. Crop residue management is one of the most important measures in the application of conservation tillage technology, so the degree of stover cover is the primary technical means for determining the optimal tillage method. After tillage and planting, conservation tillage typically achieves a maize residue coverage (MRC) of more than 30% [3]. Therefore, estimates of the MRC can be used to determine the scope of conservation tillage implementation [4].
Current methods of MRC evaluation rely on roadside surveys, farmer questionnaires, and line-transect methods [5]; these methods are costly, time-consuming, and prone to visual interpretation errors [6]. The advent of remote sensing technology provides a means whereby arable land images can be collected quickly and accurately, thus allowing objective crop MRC assessments to be made [7].
During the development of remote sensing technology, some researchers have estimated the crop MRC using one or more tillage indices (TIs). For instance, Serbin et al. (2009) proposed a shortwave infrared normalized difference residual index for evaluating the MRC. This approach uses bands 6 and 7 of the data acquired by the Terra satellite, which carries an ASTER SWIR sensor with a spatial resolution of 30 m, to obtain a good correlation [8]. Daughtry et al. (2006) combined Landsat5 TM data with EO-1 Hyperion data at a spatial resolution of 30 m to estimate the MRC through the cellulose absorption index. Ultimately, the spectral index of Landsat5 TM was found to be weakly correlated with the MRC. However, the spectral index of the EO-1 Hyperion data exhibited a high degree of correlation with the May MRC (R2 = 0.85) and a slightly lower correlation with the June MRC (R2 = 0.77). The classification accuracy for three tillage intensities (intensive, reduced, and conservation tillage) based on the EO-1 Hyperion data ranged from 66–68%, whereas that for two tillage intensities (conventional and conservation tillage) reached 80–82% [9]. With the development of remote sensing technology, data with higher spatial resolutions can be obtained. Xiang et al. (2022) constructed an MRC estimation model using partial least-squares regression based on Sentinel-2A data with a spatial resolution of 20 m. The final results demonstrated a good correlation between combining TIs and texture features [4]. Najafi et al. (2019) combined Sentinel-2A data with a spatial resolution of 20 m and Landsat-8 data with a spatial resolution of 30 m to estimate the MRC based on the Normalized Difference Tillage Index (NDTI), the Simple Tillage Index (STI), and Object-Based Image Analysis (OBIA). The coefficients of determination (R2) resulting from the calculation of NDTI and STI using Landsat-8 data, and thus for estimating the MRC, were 0.727 and 0.722, respectively, while the R2 values resulting from the estimation of MRC using Sentinel-2A data combined with NDTI and STI were 0.760 and 0.759, respectively. Based on the OBIA method, Landsat-8 and Sentinel-2A estimated the MRC with an accuracy of 0.891 and 0.948, respectively [10]. These results show that using data with a higher spatial resolution for MRC estimation contributes to improved modeling accuracy.
Although remote sensing technology provides an objective and convenient method for estimating the MRC, small-scale experimental or agricultural fields still dominate the current study area. Yue et al. (2020) estimated the MRC distribution at a site (1.5 km × 0.5 km) using the broadband spectral angle index (BAI) and BAI-NDVI based on Sentinel-2 data. The final results showed that BAI-NDVI (R2 = 0.881) is superior to BAI (R2 = 0.716) in estimating the MRC [11]. In contrast, Gao et al. (2022) used the residue-adjusted normalized difference residue index for MRC predictions based on Sentinel-2 MSI data at only four plots in the northeastern region of Daan City, Jilin Province, China [12]. Local area studies have limitations, and MRC estimations for extensive farmland are better for monitoring the spatial distribution and specific implementation of conservation tillage. Currently, the reason for limiting research to a small area is the lack of solid capacity to store and process massive amounts of remote sensing data [13]. Without data at broad spatial scales, high spatial resolutions, short revisit cycles, and very high levels of computing power, the accurate mapping of farming practices at broad spatial scales is impossible. Google Earth Engine (GEE) is an online geospatial processing cloud platform for large-scale environmental monitoring and analysis [14]. The introduction of GEE has brought about the possibility of research on a broad spatial scale.
Currently, the GEE cloud platform is being fully utilized for land cover mapping. Orusa et al. (2022) completed a land cover mapping of the Aosta Valley in northwestern Italy based on Sentinel-1 and Sentinel-2 remote sensing images in the GEE cloud platform and obtained good results [15]. Mandal et al. (2018) used a clustering algorithm in the GEE cloud platform to classify early planted and late planted rice in three regions of West Bengal. They achieved an overall accuracy of >85%, Kappa ~ 0.86 [16]. These studies show that the GEE cloud platform has great potential and advantages in dealing with wide-area spatial-scale problems. The GEE platform provides petabytes of publicly available remote sensing data recorded in the last 40 years. It offers several ready-to-use products for free, including Sentinel-2 satellite imagery with a 5-day revisit time and 10/20/60-m spatial resolutions as well as Sentinel-1 satellite imagery with a 6-day revisit time and 10-m spatial resolution. Fast and easy access to time-continuous remote sensing data overcomes the difficulties in data acquisition [17]. The GEE platform can flexibly allocate computing resources, cloud storage offers the ability to store big data, and the GEE platform is based on Google’s computing facilities, which gives the platform a very high level of computing power [14]. GEE uses parallel computing to process big geospatial data, effectively reducing the computation time [18]. Only a few conservation tillage studies have used the GEE platform for estimating the MRC and mapping tillage practices. The GEE platform provides a complete suite for the acquisition, storage, and calculation of geospatial data and is, therefore, ideal for research on conservation tillage.
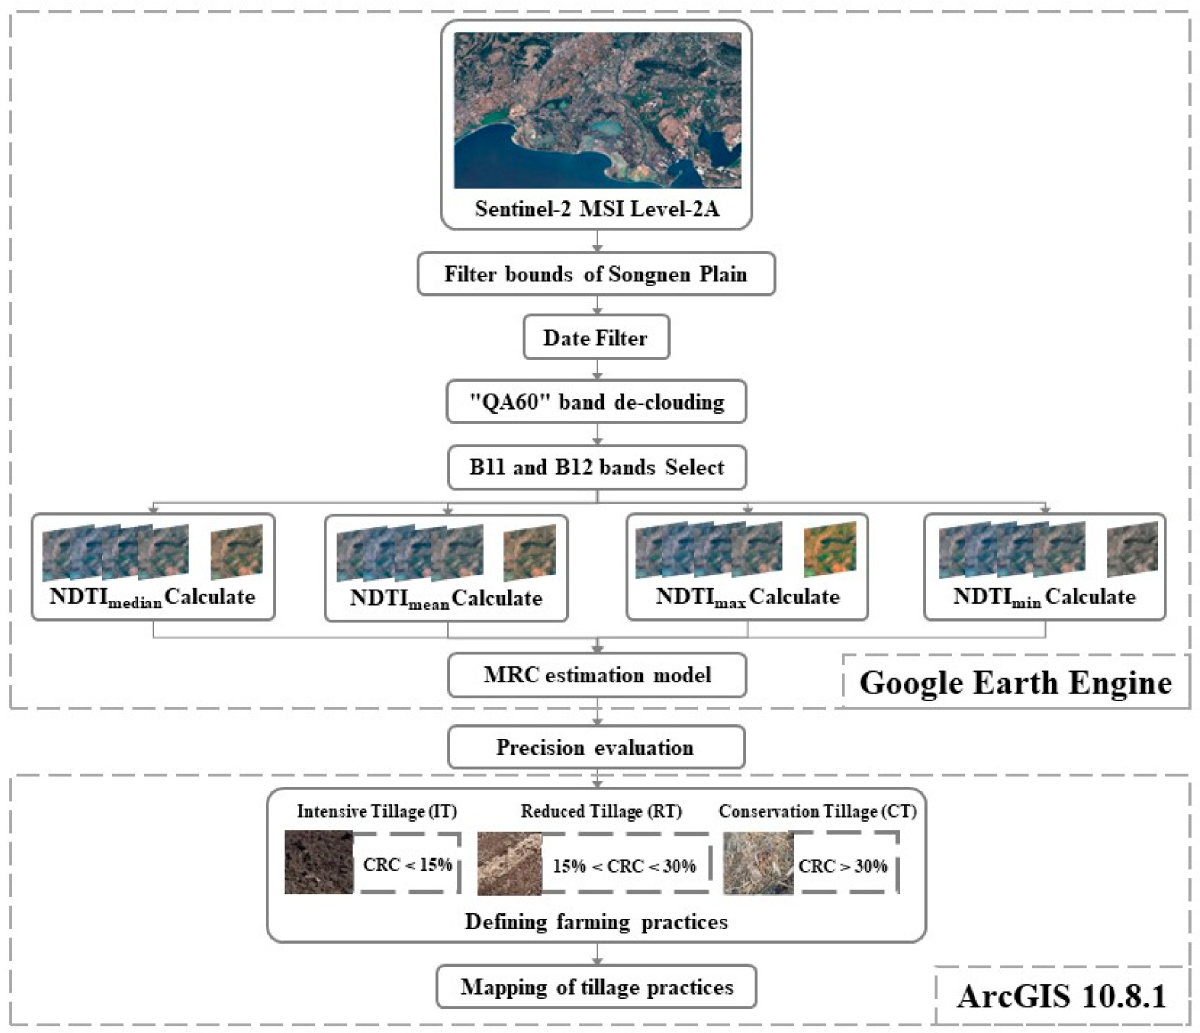
This study used Sentinel-2 remote sensing data to implement a method for mapping wide-area spatial-scale farming practices based on the GEE cloud platform. In this process, the accuracy of four image refinement strategies (medium, mean, max, and min streamlining functions) offered by the GEE cloud platform were evaluated for MRC estimation, providing a sound basis for the mapping of tillage practices. The objectives of this study were as follows: (1) build a wide-area spatial-scale mapping model of tillage practices based on the GEE cloud platform; (2) explore the best choice of four refinement strategies offered by the GEE cloud platform for MRC estimation; (3) ensure the accessibility of the methodology, which is freely available as Supplementary Material and downloadable from https://code.earthengine.google.com/b9b845bafade0b6d38c0759212a1d0c0, (accessed on 1 March 2023).

2. Materials and Methods

2.1. Study Area

The Songnen Plain covers 239,187 km2 from 121°38′–128°15′E and 42°49′–49°11′N, between Heilongjiang and Jilin provinces in China (Figure 1). The area includes 37 cities and counties in Heilongjiang and Jilin provinces. It is a critical agricultural production base in China. It has a typical temperate continental monsoon climate, with an annual average temperature of 2–6 °C and annual precipitation of 400–600 mm, 80% of which falls from June–September. These temperature and rainfall conditions are conducive to the growth of many crops [19]. At the end of 2016, grain cultivation in the Songnen Plain area covered 8.158 million hectares, accounting for 51.40% of the total arable land and making it one of China’s critical grain-producing regions [20]. The main soil types across the Songnen Plain are black soils, chernozems, aeolian soils, and meadow soils. The region is located in the “Golden Maize Belt”, which includes 80% of the total cultivated area of maize in China accounts for about 20% of the country’s total area, and is responsible for 31.2% of the country’s total maize production [4,21,22]. In the last 40 years, the central part of the Songnen Plain, which is prone to flooding and tends to use traditional farming methods, has seen a marked reduction in soil fertility. Over the same period, soil erosion, including wind and water erosion, has increased. Thus, conservation tillage is urgently required to sustain agriculture [23]. For this, fast and accurate MRC estimations and the mapping of tillage practices on the Songnen Plain are vital in determining the development of agricultural activities while ensuring sustainability.

2.2. In Situ MRC Data

Field sampling data for this study were collected from 27 March–4 April 2019 and from 20–30 May 2022. The data collected in 2019 were used to validate the estimation effects of the four streamlined functions and verify the applicability of the model developed by [4]. Photos taken with a CCFC field digital camera (Figure 2) from Campbell Scientific (https://www.campbellsci.com/, accessed on 15 October 2022) were used to validate the implementation of conservation tillage. The CCFC has an 18× optical zoom lens that automatically captures sharp photos with a resolution of 2592 × 1944 pixels. The mounted head can rotate 0–350° horizontally, 30° vertically upward, and 90° vertically downward to achieve multi-angle shooting. The captured photos are sent directly to a computer or webpage for subsequent use. The MRC of the field sampling area was measured using the line-transect method (Figure 2). The farmland sampled should be away from roads or villages. In the selected sampling area, two 10-m-long ropes, each marked with red paint at 1-m intervals, were used to measure the MRC. The two ropes were arranged diagonally, and the amount of surface residue at each paint spot was recorded. The MRC was calculated by averaging the number of markers. The GPS coordinates of each sampling point were also recorded. The spatial distributions of the field sampling data and the CCFC images are shown in Figure 1. A total of 54 field measurements were collected in 2019, 36 of which were used for model construction. Sixty field measurements were collected in 2022, with high and low MRC values of 42% and 0.5%.

2.3. Sentinel-2 MSI Time-Series Data

The remote sensing images used in the study were captured by the Sentinel-2 satellites, namely Sentinel-2A (Segarra et al., 2020), which launched on 23 June 2015, and Sentinel-2B, which launched on 7 March 2017. Data from both satellites’ multispectral instruments (MSI) are available through the GEE cloud platform (Table 1). Since the launch of the second satellite, the global revisit frequency has been enhanced to 5 days [24]. This improved revisit frequency allows for more detailed observations of changes in the Earth’s surface, which improves the estimation capability of MRC and the mapping accuracy. In previous studies, the Sentinel-2 images were downloaded from the ESA Copernicus Data Centre (https://scihub.copernicus.eu/dhus/#/home, accessed on 13 October 2022) [4]. Single-period images with no or few clouds are usually chosen when estimating the MRC. Higher accuracy, stability, and applicability levels can be derived using time-series images instead of single-period images [21]. The emergence of maize is around ten days, with the average emergence of maize in Jilin Province mainly in mid to late May (DOY131-140) and in Heilongjiang Province mainly in early June (DOY141-151) [25]. Maize emergence changes the value of the tillage index [5]. To capture the MRC situation closest to the pre-sowing period and consider the revisit time of the Sentinel-2 satellites, time series covering ten days were obtained. Based on actual field surveys from 2019–2022, farmers sowed maize after 1 May. Finally, time series from 1–10 May, 10–20 May, 20–30 May, and 30 May–8 June were selected for analysis. The start and end times were input into the GEE cloud platform, and all images for the desired period were returned. The Level-2A product, which is an atmospherically corrected surface reflectance product available directly on the GEE cloud platform, was used in this study. The Level-2A data for Sentinel-2 in the GEE platform are available from 28 March 2017; earlier Level-2 data do not have global coverage [26]. Therefore, remote sensing images were collected over the Songnen Plain in 2019, 2020, 2021, and 2022 after spring planting. The Sentinel-2 MSI Level-2 data preprocessing process is shown in Figure 3. First, the vector boundary (Datum: WGS_1984) of the Songnen Plain is uploaded to GEE, and the images of the study area are filtered. The “filterDate” function filters the required time series images. The “QA60” band was used to construct a de-clouding function to eliminate the effect of clouds. The number of images for the four time series in 2019 are 181, 189, 157, and 153. The number of images for the four time series in 2020 are 157, 183, 190, and 183. The number of images for the four time series in 2021 are 157, 183, 189, and 177. The number of images for the four time series in 2022 are 157, 182, 182, and 177. The images are ortho-projected in WGS84. After calculating the NDTI and MRC in Google Earth Engine, we resampled the retrieved results with a spatial resolution of 10 m by setting the “Scale (m/px)” in the module of Initiate image export. The Sentinel-2 MSI Level-2 remote sensing image information used is shown in Table 2.

2.4. Methods

2.4.1. Tillage Index

The use of TIs is a standard method for estimating the MRC. Due to the unique absorption peaks near 2100 nm of cellulose and lignin in crop residues, TIs can be used to construct line regression models for MRC inversion [27]. Of the 12 spectral bands offered by the MSI carried by Sentinel-2, bands 11 and 12 are close to the unique absorption regions of cellulose and lignin. In a previous study, seven TIs containing bands 11 and 12 were selected to construct the MRC estimation model (Table 3). Seven regression equations for estimating the MRC were constructed using the partial least-squares method, and the correlation between the TI and MRC using each regression equation was calculated. The NDTI gave the best correlation with MRC, with an r value of 0.845 and an R2 value of 0.729 [4,28]. On this theoretical basis, the present study used the regression equation constructed based on NDTI for MRC estimation. This regression equation is:
MRC = 0.31 + 1.66 * NDTI + 19.55 * NDTI 2 61.97 * NDTI 3
In the GEE cloud platform, bands B11 and B12 were selected to calculate NDTI using the normalized difference function. The calculated NDTI was then added to the band list using the “add bands” function. Finally, the TI was calculated using the map function for each image within the data source.

2.4.2. Image Streamlining

All the time series images must be streamlined to a single image in the GEE cloud platform. The streamlining process contains all the information for the selected time series image set. Each image in the set is used as an input, and a single image is output after the streamlining function has been applied. The streamlining process is performed on all bands in the image set for each image element position. The final value of each image element in a single streamlined image is derived through an arithmetic function. The GEE cloud platform includes four streamlining functions (median, mean, max, and min) [33]. In this study, these four functions were each used for image refinement. The median (NDTImedian), mean (NDTImean), maximum (NDTImax), and minimum (NDTImin) values of NDTI were calculated as the output of the single refined image. Regression equations for NDTI and MRC were constructed using multiply, add, and subtract functions in the GEE cloud platform to find the most suitable streamlining method for MRC estimation [34]. After streamlining, the processed single image was uploaded to the Google Cloud hard drive for subsequent mapping of farming practices.

2.5. Statistical and Validation Analysis

Pearson’s correlation coefficient (PPMCC, r), the coefficient of determination (R2), and the root mean square error (RMSE) were used to validate the study results. These three evaluation indicators were calculated as follows:
r = i = 1 n X i X ¯ Y i Y ¯ i = 1 n X i X ¯ 2 i = 1 n Y i Y ¯ 2
R 2 = i = 1 n y ^ i y ¯ 2 i = 1 n y i y i ¯ 2
RMSE = i = 1 n y i y ^ i 2 n
PPMCC analyzes the correlation between the four image streamlining functions and MRC by calculating the quotient of covariance and standard deviation between the NDTI values and the MRC obtained from the median, mean, max, and min functions, respectively. The function with the highest correlation is most suitable for estimating the MRC [35]. The decision coefficients quantify the accuracy of the models constructed based on the four streamlined functions. The RMSE indicates the deviation of MRCmedian, MRCmean, MRCmax, and MRCmin estimated by the regression equations based on NDTImedian, NDTImean, NDTImax, and NDTImin, respectively, from the field validation data. The slightest deviation indicates the highest accuracy of the MRC estimation model.

2.6. Mapping of Maize Tillage Practices

The MRC during tillage and post-planting is the primary method for determining tillage practices. As defined by the Conservation Technology Information Center (CTIC) and previous studies, tillage methods with MRC values below 15% are defined as intensive tillage (IT), tillage methods with MRC values from 15–30% are defined as reduced tillage (RT), and those with MRC values above 30% are defined as conservation tillage (CT) [9,36]. Using this as a theoretical basis, MRC images were downloaded from the Google Cloud Drive to a local disk and mapped using the reclassification feature in Arc GIS 10.8.1 for tillage practices. Because the MRC images in the study area were huge, Google Cloud Drive automatically cropped single images into multiple smaller images. Therefore, we used Arc GIS 10.8.1 to stitch multiple small images back together into the original image before plotting.

2.7. Other Auxiliary Data

In addition to remote sensing imagery, other data (Table 2) were used to develop tillage practice mapping. This study used cropland data from the 10 m crop-type map of Northeast China (a dataset developed by the Chinese Academy of Sciences from Sentinel-2 data) to limit analysis of the extent of cropping in the study area and reduce the impact of non-cropland areas [37]. Mountain shadows often obscure some cultivated areas. This study is based on digital elevation data and uses the Hillshade tool in ArcGIS 10.8.1 to remove the effects of mountain shadows. The digital elevation data are from NASDEM. NASADEM is the DEM product reprocessed from the original Shuttle Radar Topography Mission data using improved algorithms by National Aeronautics and Space Administration. The spatial resolution of NASADEM is 30 m [38]. The original 30 m resolution DEM product was resampled to 10 m using the nearest-neighbor resampling tool of ArcGIS 10.8.1.

3. Results

3.1. Correlation between TI and MRC

This study analyzed the correlation between the streamlined NDTImedian, NDTImean, NDTImax, and NDTImin and the MRC based on the streamlined images of four time series and a validation dataset of 60 field samples. By constructing the regression equation, the correlation of the streamlined TI with MRC was determined; the results are presented in Table 4. The R2 obtained by the median streamlining function for 1–10 May, 10–20 May, 20–30 May, and 30 May–8 June are 0.0399, 0.1064, 0.8136, and 0.0847, respectively. The median has the highest R2 value and the best correlation (r = 0.902) for the period 20–30 May. The mean streamlined function achieved an R2 of 0.0415, 0.0608, 0.6379, and 0.0703 in the four time series and was the same as the median streamlined function in that the highest value of R2 also occurred on 20–30 May. Max and min streamlined functions had lower correlation and accuracy. The highest values of r were 0.6833 and 0.3191, respectively, and the highest values of R2 were 0.4698 and 0.1018, respectively. However, the highest values of both r and R2 also appear on 20–30 May. Therefore, the remote sensing images of the 20–30 May time series were selected for MRC estimation and tillage mapping in the Songnen Plain.

3.2. Spatial Distribution of MRC in the Songnen Plain

The remote sensing images from 20–30 May 2022 were input into the GEE cloud platform. Four streamlined functions were used to operate on this time series separately. The output obtained NDTImedian, NDTImean, NDTImax, and NDTImin. The NDTI values obtained from the four streamlining functions were brought into the selected MRC estimation model (Equation (1)) to obtain four MRC estimations (MRCmedian, MRCmean, MRCmax, and MRCmin). Error analysis was applied to the measured MRC data at 60 sampling points and the four MRC estimation values. Based on RMSE analysis, the relationship between the measured and estimated MRC data is presented in Table 5. The errors in MRCmedian, MRCmean, and MRCmax with respect to the measured MRC are similar, with RMSE values of 4.66, 4.73, and 4.44, respectively. MRCmin had the largest error, with an RMSE value of 6.06. These results suggest that the model constructed in the previous study is still applicable to the MRC estimation work in 2022. Further analysis revealed that the RMSE based on the max function is smaller than that based on the median function, but the R2 value using the max function is much lower than that given by the median function. Taking this into account, the median function is finally selected as the streamlining function for the MRC estimation model.
Based on this streamlining function and the resulting MRC estimation model, MRC distribution in the Songnen Plain for 2019–2022 was mapped (Figure 4). The MRC of the Songnen Plain is in the range of 0–33% in 2019. In terms of spatial distribution, the areas with higher MRC occur in the northern (46°7′N–49°1′N) and central (44°4′N–46°2′N) parts of the Songnen Plain. In 2020 and 2021, the MRC of the Songnen Plain is 0–34%. The MRC is higher in the central part of the Songnen Plain. The MRC of the Songnen Plain in 2022 was in the range of 0.18–46%. The MRC is higher in the northern and central parts of the Songnen Plain and lower in the southern (44°3′N–42°8′N) part. The zoning statistics function of ArcGIS 10.8.1 was used to calculate the MRC of each region. Further analysis of the 2022 data reveals that the mean MRC of the Heilongjiang region (3.7%) is relatively high compared with the mean MRC of the Jilin region (3.1%). Heihe and Harbin, in Heilongjiang province, have the highest MRC mean values of 7.8% and 4.8%, respectively, while Qiqihar, Daqing, and Suihua have similar MRC mean values of 3.3%, 3.6%, and 2.6%, respectively. The mean MRC value of 3.7% is relatively high in Changchun, while the mean MRC values of 3.2%, 2.7%, and 2.6% are relatively low in Siping, Baicheng, and Songyuan cities, respectively, in Jilin province.

3.3. Mapping and Spatial and Temporal Distributions of Tillage Practices in the Songnen Plain, 2019–2022

Based on the estimated 2022 Songnen Plain MRC and CTIC definitions of tillage practices, the predicted 2022 Songnen Plain tillage practices mapping was completed (Figure 5d). Combined with the measured data in 2022, a confusion matrix was constructed to classify the three tillage practices in the Songnen Plain in 2022 (Table 6). The overall accuracy was 97% with kappa~0.32. We now classify and map the tillage practices across the Songnen Plain from 2019–2022 based on the MRC data. Every image between the eastern and western parts of the Songnen Plain on 23 May 2021 contained cloud percentages above 97%. Most images of the eastern part of the Songnen Plain on 25 May 2020 and on 26 May 2019 had cloud percentages above 80%, and many images were considered unusable. To extract valid images, the start date of these three years was brought forward from 20 May to 10 May in the GEE cloud platform. Tillage practices were plotted for each of the four years using the NDTImedian-based model (Figure 5), and the specific distribution of tillage practices for each year was determined (Table 7). At the same time, the CCFC data were used to validate the tillage practices in the northern and western parts of the Songnen Plain. The results in Figure 6 show that the classification of tillage practices using the proposed model to estimate MRC is consistent with the results obtained using the CCFC.

4. Discussion

4.1. Time Series Analysis of Sentinel-2 MSI Images

The advantage of introducing the GEE cloud platform is the ease of using time series data of any length. The phase of images with minimal cloud coverage from 20–30 May 2022 was selected for NDTI and MRC correlation analysis to compare the effects of using time series data and individual phase data. The results of the correlation analysis using the traditional single image method, shown in Figure 7, show an R2 value of 0.7541, which is less accurate than the time series image method using the 20–30 May median streamlining function (R2 = 0.8136). These results suggest that using time series image streamlining improves the accuracy of MRC estimation and conservation tillage mapping. Through practical operation and analysis, there are two reasons why using streamlined time series data is better than using single-period image data when performing MRC estimation and tillage method mapping. First, this study was based on the GEE cloud platform, where the effect of partial clouds can be removed using the de-clouding function. In time series image data, the de-clouding function removes the cloud-covered image elements and uses cloud-free images of those elements at other dates. This method allows more cloud-free images to be used compared with single-period image data and significantly improves the utilization of images. Second, because the date range covered by the images is more extensive, the use of streamlined time series data is closer to the local pre-emergence crop moment at a broad spatial scale compared with the use of single-period images, thus improving estimation and mapping accuracy.

4.2. Selection of Median Streamlining Functions

In comparing previous studies using time series data, Zheng et al. (2012) proposed a method for MRC estimation using minNDTI based on Landsat data and reported good results in central Indiana [39]. The median streamlining functions for all four time series were jointly analyzed with the relevant MRC data, and the results are shown in Figure 8. The NDTI values from 1–10 May are evenly distributed from 0–0.06, those from 10–20 May are evenly distributed from 0–0.05, those from 20–30 May are evenly distributed from 0.02–0.05, and those from 30 May–8 June are evenly distributed from 0.04–0.14. The overall distribution of NDTI values from the four-time series exhibits a decrease, followed by an increasing trend. To investigate the variation of NDTI values in the time series in more detail, we analyzed the NDTI values for two straw cover levels (MRC = 42% and MRC = 4%) in the time series from 1 May–8 June. The results are shown in Figure 9. Both cases exhibit a declining then rising area, and the minimum NDTI occurs from 20–30 May. This is in line with the findings of Zheng et al. (2012), who observed that the minimum NDTI in the time series indicates the closest ground state when tillage or seeding was carried out [39]. Therefore, data refinement using the 20–30 May time series yields better results than the other three time series.
These results indicate that there are good prospects for estimating the MRC using the GEE cloud platform based on NDTImedian, derived by applying the median streamlining function to time series images. According to the results of Wu et al. (2021), the median streamlining function effectively reduces the spectral overlap effect of different vegetation compared with the min and max streamlining functions, and therefore improves the accuracy of MRC estimation based on spectral methods [20]. Daughtry and Huntjr (2008) showed that the absorption feature at 2100 nm decreases as the water content of maize stover increases, and at the point of water saturation, the absorption feature at 2100 nm is almost completely masked [40]. Therefore, the increased water content of maize stover caused by rainfall may be the reason for the poor correlation between NDTImin and MRC. Zheng et al. (2012) showed that vegetation growth causes a rebound in NDTI values, so the sprouting of green plants reduces the phase relationship between NDTImax and MRC [39]. NDTImean is the mean value of all data in the time series, which is obtained mathematically rather than directly from the images and will therefore be influenced by extreme values. Hence, the accuracy of NDTImean is lower than that of NDTImedian.

4.3. Efficiency of GEE Cloud Platform in Estimating MRC of the Songnen Plain

In this study, we introduced the GEE cloud platform to construct an MRC estimation model based on TIs. The accuracy of the estimation model was verified by comparing the field validation MRC data with the estimated MRC data. The results showed that the optimal MRC estimation model was that constructed using the median streamlining function (R2 = 0.8136, RMSE = 4.66). Regarding model accuracy, the results are similar to, or even better than, the traditional method used by Xiang et al. (2022). The introduction of the GEE platform resulted in a significant improvement in processing efficiency. Using the GEE cloud platform enhances the processing area from the county scale to the Songnen Plain scale in the same processing time as the traditional method. The GEE platform is based on cloud computing and storage and, at the same time, uses interactive webpages for writing programs and executing related operations. Therefore, when processing the same data area, using the GEE platform significantly reduces the computing resources of local computers compared with traditional image processing methods. In an image fusion study, Nietupski et al. (2021) showed that processing evaluation images using the GEE cloud platform was 2.8 times faster than running them locally [41]. Thus, the emergence of the GEE cloud platform dramatically improves the efficiency of remote sensing technology usage. Remote sensing technology requires a large amount of image data for MRC estimation and the mapping of tillage practices. The acquisition, storage, and processing of these data is the most challenging step in the research process. The results of this study provide meaningful recommendations for selecting appropriate methods for MRC estimation and tillage practice mapping. When performing MRC estimation and mapping of tillage practices at a broad spatial scale, using the GEE platform significantly improves the processing efficiency while ensuring model accuracy. The GEE platform facilitates further research, even if confined to a small area.

4.4. Distribution of Conservation Tillage in the Songnen Plain

Based on Table 7. Further analysis of the four-year percentage of tillage practices in the Songnen Plain shows that the overall trend in conservation tillage is on the rise, with the area given over to conservation tillage increasing from 0.08% in 2019 to 0.25% in 2022, a four-year increase of 212.5%. This result is most likely due to the government’s increased efforts to promote conservation tillage, agricultural workers’ increased popularization of conservation tillage, and farmers’ increased awareness of conservation tillage [42]. The percentage of conservation tillage area is the same in 2020 and 2021, both at 0.18%, but the reduced tillage area increases from 2.73% to 3.55%. Xiao et al. (2020) showed that carrying out straw mulching conservation tillage can reduce runoff and soil erosion; in terms of reducing runoff, the protection effect of no-tillage is better than that of minimum tillage. In terms of reducing soil erosion, however, straw mulching may have severe negative effects, so the protective effect of minimum tillage is better than that of no-tillage, which may be the reason for the increased percentage of minimum tillage [43].
By determining the percentage of tillage practices in the study area, it was found that 95.56%, 4.18%, and 0.26% of the overall cultivated area across the Songnen Plain in 2022 was used for traditional tillage, reduced tillage, and no-tillage, respectively. The distribution of tillage practices in each province and the city was determined separately, and the results are presented in Table 8. Heihe, Daqing, and Songyuan have higher percentages of no-tillage areas, at 0.74%, 0.38%, and 0.38%, respectively. The lowest percentage of no-tillage area within the Songnen Plain is 0.09%, in Baicheng. Daqing and Songyuan are areas with a high drought risk [44,45]. The occurrence of drought disasters can increase the adoption of conservation tillage [41]. Therefore, this could be the reason for the high percentages of no-till areas in Daqing and Songyuan. In the results, a smaller value for the denominator leads to a more significant proportion [46]. The maize cultivation area in Heihe only accounts for 23% of the total cultivation area. As the statistical tillage method used in this study operates at the city level, the smaller maize cultivation area in Heihe results in a higher share of no-tillage areas [47]. In western Jilin, more than half of the saline land is located within Baicheng [48]. The current awareness of conservation farming on highly saline land is low, and severe salinization of the land will limit the implementation of conservation farming to a certain extent [44].

5. Conclusions

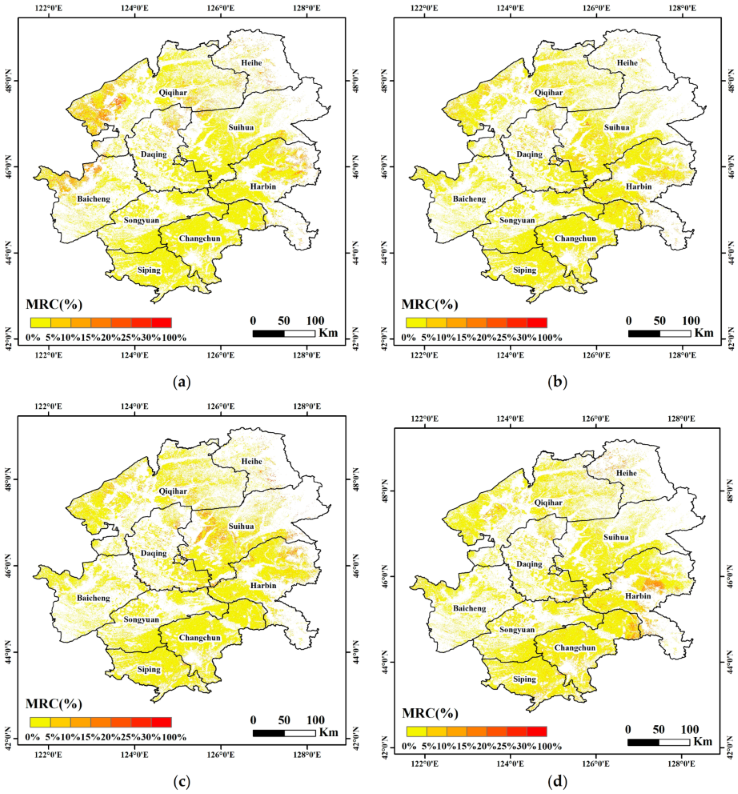
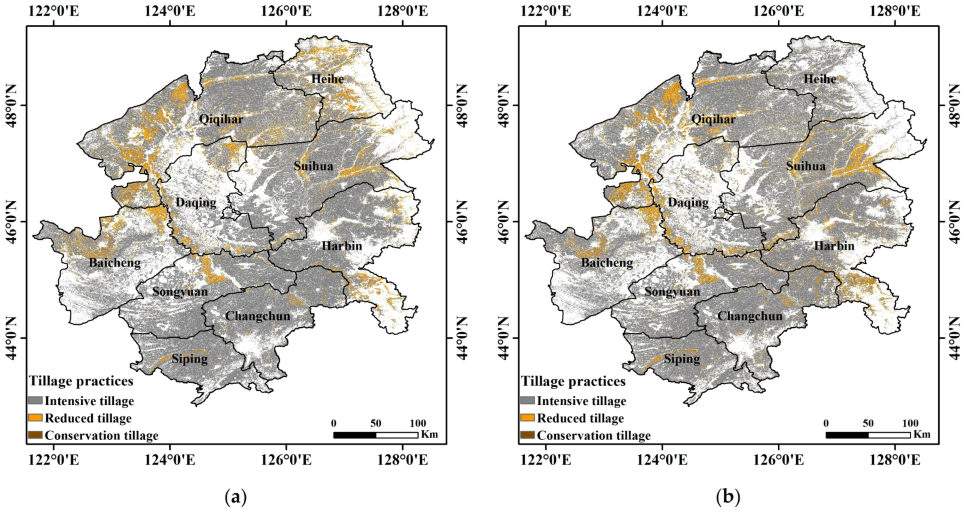
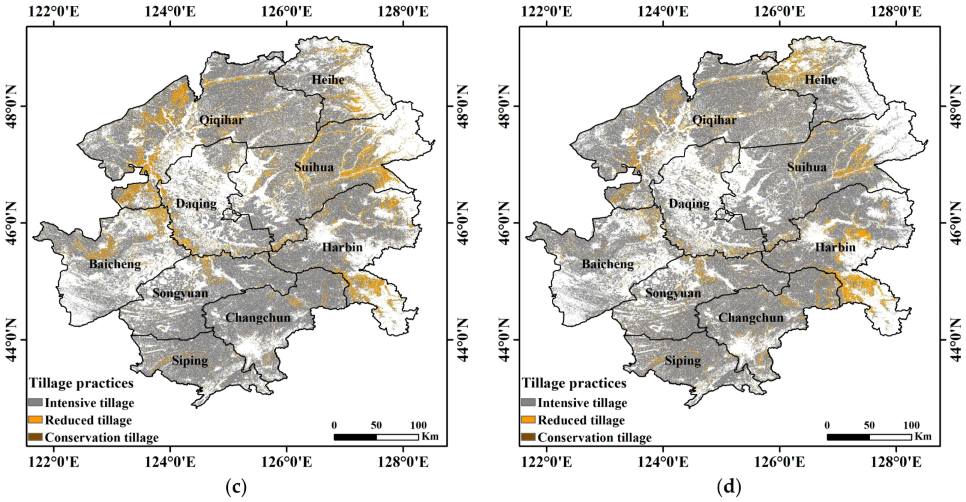
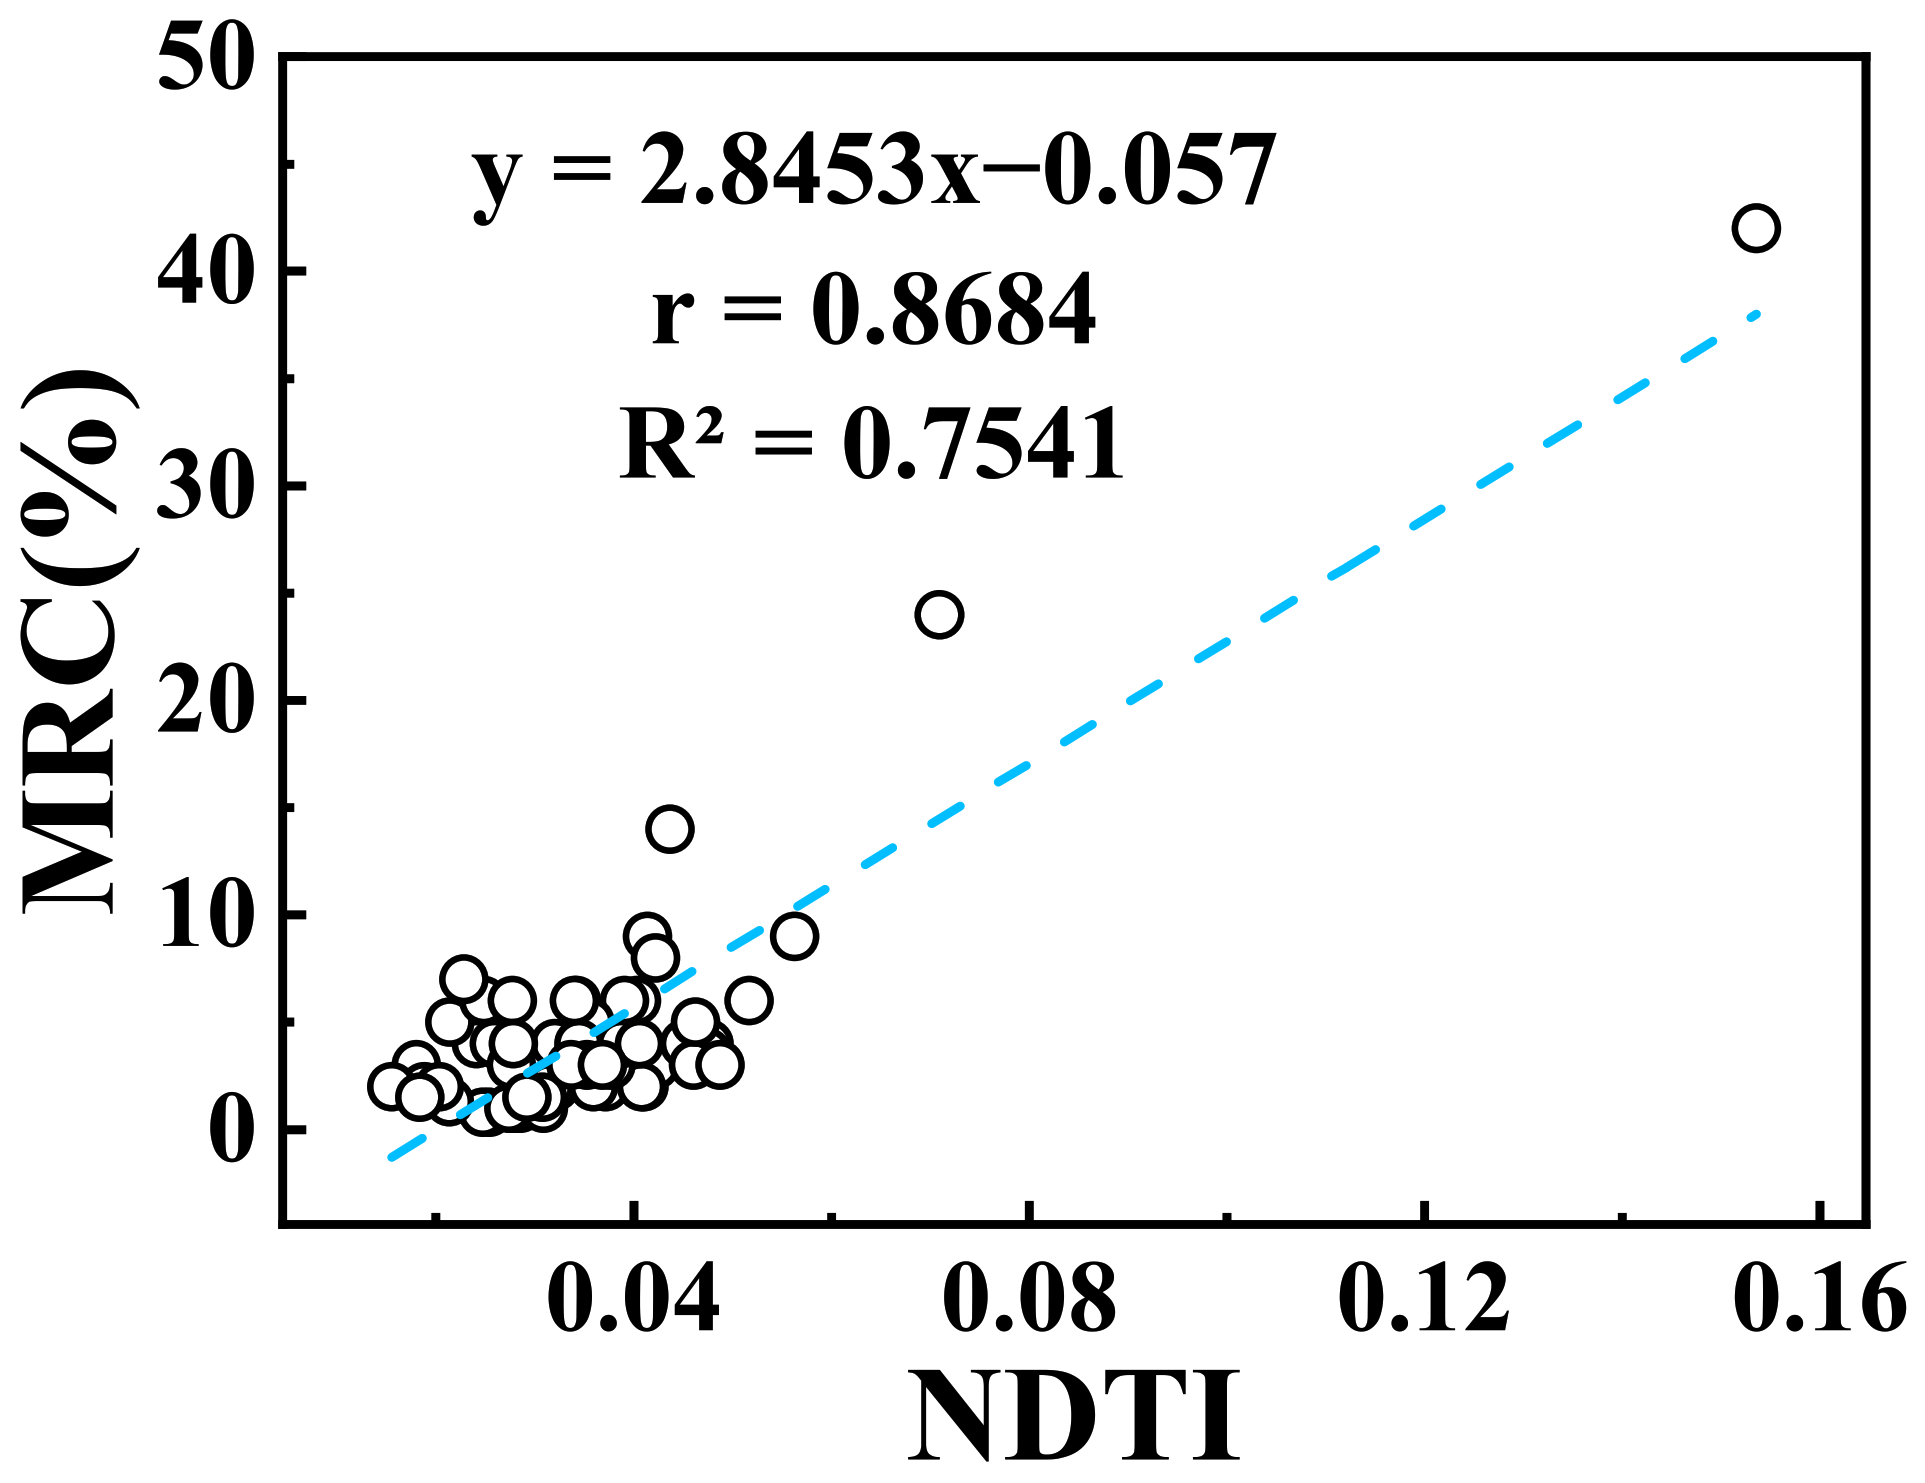
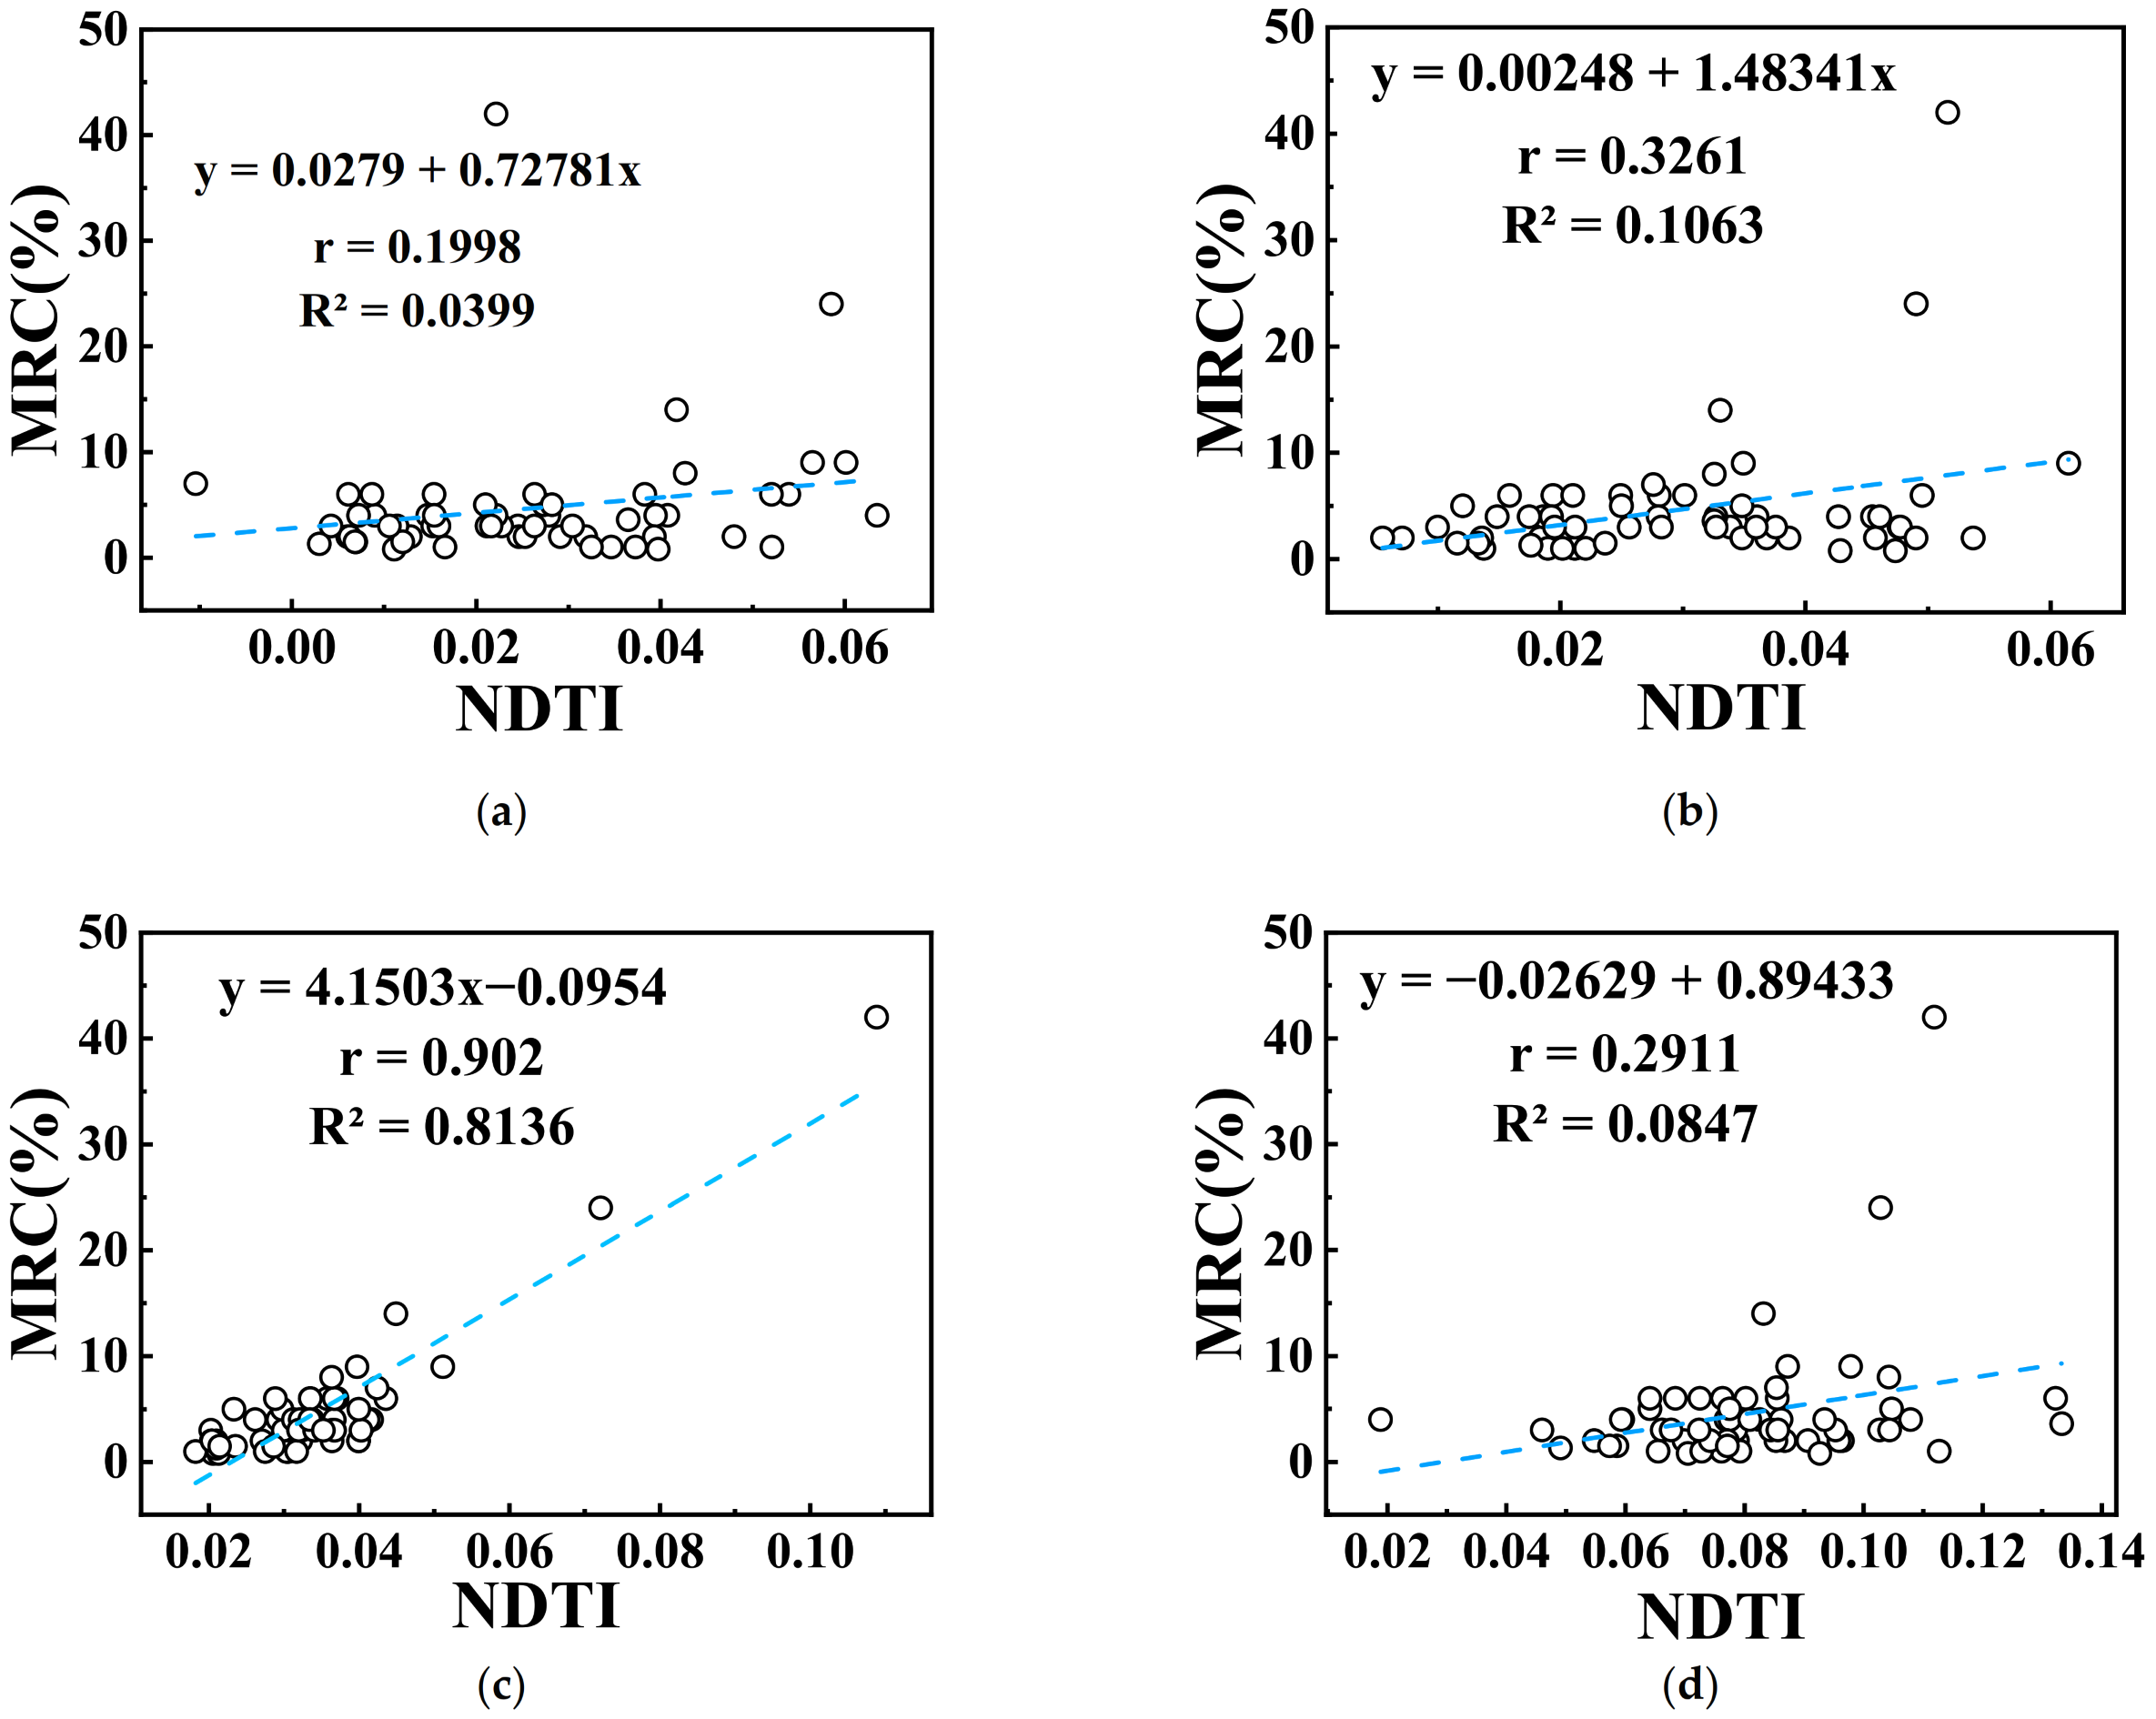
Based on the GEE cloud platform, this study determined the best time series and streamlining functions based on the correlation coefficients of NDTI and MRC measured data. The MRC estimation and mapping of tillage practices in the Songnen Plain for 2019–2022 were then determined using the cloud computing platform and the model of Xiang et al. (2022). Geostatistical analysis using ArcGIS was applied to identify the spatial and temporal distribution characteristics of the MRC and conservation tillage in the Songnen Plain. In terms of the correlation between the TI and MRC, the median streamlining function produced the best R2 value of 0.8136 and r value of 0.902. The mean streamlining function gave an R2 value of 0.6379 and an r value of 0.7987. The max and min streamlining functions gave the lowest correlation, with R2 values of 0.4698 and 0.1018 and r values of 0.6855 and 0.3191, respectively. Error analysis of the estimated and measured MRC showed that the RMSE of the max streamlining function (4.44) was slightly lower than that of the median streamlining function (4.66). However, the R2 value of the max streamlining function was much lower than that of the median streamlining function. Thus, the median streamlining function was selected for MRC estimation and conservation tillage mapping of the Songnen Plain from 2019–2022. The estimations indicated that the mean MRC in 2022 was 3.4% across the Songnen Plain, with higher values in the northern (46°7′N–49°1′N) and central (44°4′–46°2′N) parts of the Songnen Plain and lower values in the southern (44°3′–42°8′N) parts. The mapping of tillage practices in the Songnen Plain was completed according to the definitions of tillage practices in the MRC and CTIC of the Songnen Plain. A confusion matrix was constructed for the classification of tillage practices in the Songnen Plain in 2022, and the overall accuracy of 97% and kappa~0.32 were obtained. Further analysis revealed that there is an overall upward trend in conservation tillage in the Songnen Plain region, with the conservation tillage area increasing from 0.08% in 2019 to 0.25% in 2022, a four-year increase of 212.5%. The area of reduced tillage also increased from 3.32% in 2019 to 4.18% in 2022, a four-year increase of 25.9%. These results show that MRC monitoring and conservation tillage mapping can be performed at a broad spatial scale using remote sensing technology based on the GEE cloud platform. This information provides a theoretical basis for research and extended efforts to promote the development of sustainable agriculture and protect food security.
Finally, to encourage other researchers to reuse and improve our algorithm, this methodology is freely available for download from https://code.earthengine.google.com/b9b845bafade0b6d38c0759212a1d0c0 (accessed on 1 March 2023).

Supplementary Materials

The following supporting information can be downloaded at: https://code.earthengine.google.com/b9b845bafade0b6d38c0759212a1d0c0, (accessed on 1 March 2023).

Author Contributions

Conceptualization, J.D. and J.L.; methodology, J.D. and X.X.; software, W.Y.; validation, W.Y., X.X., Y.Z., W.Z. and Z.Z.; formal analysis, J.D., J.L. and K.S.; investigation, H.L., Y.W. and Y.S.; resources, J.D.; data curation, W.Y.; writing—original draft preparation, W.Y.; writing—review and editing, J.D.; visualization, W.Y.; supervision, J.D. and J.L.; project administration, J.D.; funding acquisition, J.D. All authors have read and agreed to the published version of the manuscript.

Funding

This research was funded by the National Key Research and Development Program of China, grant number 2021YFD1500103, Science and Technology Project for Black Soil Granary, grant number XDA28080500, Environmental Protection Program of Jilin Province, China, grant number E139S311, National Science & Technology Fundamental Resources Investigation Program of China, grant number 2018FY100300, and, Changchun Science and Technology Development Plan China, grant number 21ZGN26.

Data Availability Statement

Not applicable.

Acknowledgments

The authors would especially like to thank Charlesworth Author Services for their support and feedback regarding the proofreading of this work.

Conflicts of Interest

The authors declare no conflict of interest.

References

  1. United Nations (UN). World Population Prospects: The 2015 Revision; United Nations: New York, NY, USA, 2015. [Google Scholar]
  2. Chimsah, F.A.; Cai, L.; Wu, J.; Zhang, R. Outcomes of Long-Term Conservation Tillage Research in Northern China. Sustainability 2020, 12, 1062. [Google Scholar] [CrossRef] [Green Version]
  3. Conservation Tillage Information Center (US); Conservation Technology Information Center. National Survey Conservation Tillage Practices; The Center: West Lafayette, IN, USA, 1990. [Google Scholar]
  4. Xiang, X.; Du, J.; Jacinthe, P.-A.; Zhao, B.; Zhou, H.; Liu, H.; Song, K. Integration of tillage indices and textural features of Sentinel-2A multispectral images for maize residue cover estimation. Soil Tillage Res. 2022, 221, 105405. [Google Scholar] [CrossRef]
  5. Zheng, B.; Campbell, J.B.; Serbin, G.; Daughtry, C.S.T. Multitemporal remote sensing of crop residue cover and tillage practices: A validation of the minNDTI strategy in the United States. J. Soil Water Conserv. 2013, 68, 120–131. [Google Scholar] [CrossRef]
  6. Pacheco, A.; McNairn, H. Evaluating multispectral remote sensing and spectral unmixing analysis for crop residue mapping. Remote Sens. Environ. 2010, 114, 2219–2228. [Google Scholar] [CrossRef]
  7. Zheng, B.; Campbell, J.B.; Serbin, G.; Galbraith, J.M. Remote sensing of crop residue and tillage practices: Present capabilities and future prospects. Soil Tillage Res. 2014, 138, 26–34. [Google Scholar] [CrossRef]
  8. Serbin, G.; Hunt, E.R.; Daughtry, C.S.; McCarty, G.; Doraiswamy, P. An Improved ASTER Index for Remote Sensing of Crop Residue. Remote Sens. 2009, 1, 971–991. [Google Scholar] [CrossRef] [Green Version]
  9. Daughtry, C.S.T.; Doraiswamy, P.C.; Hunt, E.R.; Stern, A.J.; McMurtrey, J.E.; Prueger, J.H. Remote sensing of crop residue cover and soil tillage intensity. Soil Tillage Res. 2006, 91, 101–108. [Google Scholar] [CrossRef]
  10. Najafi, P.; Navid, H.; Feizizadeh, B.; Eskandari, I.; Blaschke, T. Fuzzy Object-Based Image Analysis Methods Using Sentinel-2A and Landsat-8 Data to Map and Characterize Soil Surface Residue. Remote Sens. 2019, 11, 2583. [Google Scholar] [CrossRef] [Green Version]
  11. Yue, J.; Tian, Q.; Dong, X.; Xu, N. Using broadband crop residue angle index to estimate the fractional cover of vegetation, crop residue, and bare soil in cropland systems. Remote Sens. Environ. 2020, 237, 111538. [Google Scholar] [CrossRef]
  12. Gao, L.; Zhang, C.; Yun, W.; Ji, W.; Ma, J.; Wang, H.; Li, C.; Zhu, D. Mapping crop residue cover using Adjust Normalized Difference Residue Index based on Sentinel-2 MSI data. Soil Tillage Res. 2022, 220, 105374. [Google Scholar] [CrossRef]
  13. Xie, Z.; Phinn, S.R.; Game, E.T.; Pannell, D.J.; Hobbs, R.J.; Briggs, P.R.; McDonald-Madden, E. Using Landsat observations (1988–2017) and Google Earth Engine to detect vegetation cover changes in rangelands—A first step towards identifying degraded lands for conservation. Remote Sens. Environ. 2019, 232, 111317. [Google Scholar] [CrossRef]
  14. Kumar, L.; Mutanga, O. Google Earth Engine Applications Since Inception: Usage, Trends, and Potential. Remote Sens. 2018, 10, 1509. [Google Scholar] [CrossRef] [Green Version]
  15. Orusa, T.; Cammareri, D.; Borgogno Mondino, E.B. A Possible Land Cover EAGLE Approach to Overcome Remote Sensing Limitations in the Alps Based on Sentinel-1 and Sentinel-2: The Case of Aosta Valley (NW Italy). Remote Sens. 2022, 15, 178. [Google Scholar] [CrossRef]
  16. Mandal, D.; Kumar, V.; Bhattacharya, A.; Rao, Y.S.; Siqueira, P.; Bera, S. Sen4Rice: A Processing Chain for Differentiating Early and Late Transplanted Rice Using Time-Series Sentinel-1 SAR Data With Google Earth Engine. IEEE Geosci. Remote Sens. Lett. 2018, 15, 1947–1951. [Google Scholar] [CrossRef]
  17. Gorelick, N.; Hancher, M.; Dixon, M.; Ilyushchenko, S.; Thau, D.; Moore, R. Google Earth Engine: Planetary-scale geospatial analysis for everyone. Remote Sens. Environ. 2017, 202, 18–27. [Google Scholar] [CrossRef]
  18. Tamiminia, H.; Salehi, B.; Mahdianpari, M.; Quackenbush, L.; Adeli, S.; Brisco, B. Google Earth Engine for geo-big data applications: A meta-analysis and systematic review. ISPRS J. Photogramm. Remote Sens. 2020, 164, 152–170. [Google Scholar] [CrossRef]
  19. Zhang, Y.; Zang, S.; Sun, L.; Yan, B.; Yang, T.; Yan, W.; Meadows, M.E.; Wang, C.; Qi, J. Characterizing the changing environment of cropland in the Songnen Plain, Northeast China, from 1990 to 2015. J. Geogr. Sci. 2019, 29, 658–674. [Google Scholar] [CrossRef] [Green Version]
  20. Wu, N.; Shi, R.; Zhuo, W.; Zhang, C.; Zhou, B.; Xia, Z.; Tao, Z.; Gao, W.; Tian, B. A Classification of Tidal Flat Wetland Vegetation Combining Phenological Features with Google Earth Engine. Remote Sens. 2021, 13, 443. [Google Scholar] [CrossRef]
  21. Chen, B.; Xiao, X.; Li, X.; Pan, L.; Doughty, R.; Ma, J.; Dong, J.; Qin, Y.; Zhao, B.; Wu, Z.; et al. A mangrove forest map of China in 2015: Analysis of time series Landsat 7/8 and Sentinel-1A imagery in Google Earth Engine cloud computing platform. ISPRS J. Photogramm. Remote Sens. 2017, 131, 104–120. [Google Scholar] [CrossRef]
  22. Dou, X.; Wang, X.; Liu, H.; Zhang, X.; Meng, L.; Pan, Y.; Yu, Z.; Cui, Y. Prediction of soil organic matter using multi-temporal satellite images in the Songnen Plain, China. Geoderma 2019, 356, 113896. [Google Scholar] [CrossRef]
  23. Du, G.; Guo, T.; Ma, C. Effects of Topographic Factors on Cultivated-Land Ridge Orientation in the Black Soil Region of Songnen Plain. Land 2022, 11, 1489. [Google Scholar] [CrossRef]
  24. Segarra, J.; Buchaillot, M.L.; Araus, J.L.; Kefauver, S.C. Remote Sensing for Precision Agriculture: Sentinel-2 Improved Features and Applications. Agronomy 2020, 10, 641. [Google Scholar] [CrossRef]
  25. Li, Z.; Yang, P.; Tang, H.; Wu, W.; Yin, H.; Liu, Z.; Zhang, L. Response of maize phenology to climate warming in Northeast China between 1990 and 2012. Reg. Environ. Chang. 2014, 14, 39–48. [Google Scholar] [CrossRef]
  26. Luo, C.; Zhang, X.; Wang, Y.; Men, Z.; Liu, H. Regional soil organic matter mapping models based on the optimal time window, feature selection algorithm and Google Earth Engine. Soil Tillage Res. 2022, 219, 105325. [Google Scholar] [CrossRef]
  27. Daughtry, C.S.T. Discriminating Crop Residues from Soil by Shortwave Infrared Reflectance. Agron. J. 2001, 93, 125–131. [Google Scholar] [CrossRef]
  28. van Deventer, A.P.; Ward, A.D.; Gowda, P.H.; Lyon, J.G. Using Thematic Mapper Data to Identify Contrasting Soil Plains and Tillage Practices. Photogramm. Eng. Remote Sens. 1997, 63, 87–93. [Google Scholar]
  29. McNairn, H.; Protz, R. Estimation of Maize Residue Cover Using Landsat-8 OLI Image Spectral Information and Textural Features. Can. J. Remote Sens. 1993, 19, 152–159. [Google Scholar] [CrossRef]
  30. Jin, X.; Ma, J.; Wen, Z.; Song, K. Estimation of Maize Residue Cover Using Landsat-8 OLI Image Spectral Information and Textural Features. Remote Sens. 2015, 7, 14559–14575. [Google Scholar] [CrossRef] [Green Version]
  31. Qi, J.; Marsett, R.; Heilman, P.; Bieden-bender, S.; Moran, S.; Goodrich, D.; Weltz, M. RANGES improves satellite-based information and land cover assessments in southwest United States. Eos Trans. Am. Geophys. Union 2002, 83, 601–612. [Google Scholar] [CrossRef]
  32. Sullivan, D.G.; Truman, C.C.; Schomberg, H.H.; Endale, D.M.; Strickland, T.C. Evaluating Techniques for Determining Tillage Regime in the Southeastern Coastal Plain and Piedmont. Agron. J. 2006, 98, 1236–1246. [Google Scholar] [CrossRef]
  33. Praticò, S.; Solano, F.; Di Fazio, S.; Modica, G. Machine Learning Classification of Mediterranean Forest Habitats in Google Earth Engine Based on Seasonal Sentinel-2 Time-Series and Input Image Composition Optimisation. Remote Sens. 2021, 13, 586. [Google Scholar] [CrossRef]
  34. Tazmul Islam, M.; Meng, Q. An exploratory study of Sentinel-1 SAR for rapid urban flood mapping on Google Earth Engine. Int. J. Appl. Earth Obs. Geoinf. 2022, 113, 103002. [Google Scholar] [CrossRef]
  35. Benesty, J.; Chen, J.; Huang, Y.; Cohen, I. Pearson Correlation Coefficient. In Noise Reduction in Speech Processing; Springer Topics in Signal Processing: Berlin/Heidelberg, Germany, 2009; Volume 2, pp. 1–4. ISBN 978-3-642-00295-3. [Google Scholar]
  36. CTIC Tillage Type Definitions, Conservation Technology Information Center. 2002. Available online: https://www.ctic.org/ (accessed on 12 October 2022).
  37. You, N.; Dong, J.; Huang, J.; Du, G.; Zhang, G.; He, Y.; Yang, T.; Di, Y.; Xiao, X. The 10-m crop type maps in Northeast China during 2017–2019. Sci. Data 2021, 8, 41. [Google Scholar] [CrossRef]
  38. NASA JPL. NASA Nasadem Merged Dem Global 1 Arc Second v001; NASA EOSDIS Land Process DAAC: Sioux Falls, SD, USA, 2020. [Google Scholar]
  39. Zheng, B.; Campbell, J.B.; de Beurs, K.M. Remote sensing of crop residue cover using multi-temporal Landsat imagery. Remote Sens. Environ. 2012, 117, 177–183. [Google Scholar] [CrossRef]
  40. Daughtry, C.; Huntjr, E. Mitigating the effects of soil and residue water contents on remotely sensed estimates of crop residue cover. Remote Sens. Environ. 2008, 112, 1647–1657. [Google Scholar] [CrossRef]
  41. Guo, H.; Zhao, W.; Pan, C.; Qiu, G.; Xu, S.; Liu, S. Study on the Influencing Factors of Farmers’ Adoption of Conservation Tillage Technology in Black Soil Region in China: A Logistic-ISM Model Approach. Int. J. Environ. Res. Public Health 2022, 19, 7762. [Google Scholar] [CrossRef]
  42. Xiao, L.; Zhao, R.; Kuhn, N.J. No tillage is not an ideal management for water erosion control in China. Sci. Total Environ. 2020, 736, 139478. [Google Scholar] [CrossRef]
  43. Cao, Y.; Chen, S.; Wang, L.; Zhu, B.; Lu, T.; Yu, Y. An Agricultural Drought Index for Assessing Droughts Using a Water Balance Method: A Case Study in Jilin Province, Northeast China. Remote Sens. 2019, 11, 1066. [Google Scholar] [CrossRef] [Green Version]
  44. Pei, W.; Fu, Q.; Liu, D.; Li, T.; Cheng, K.; Cui, S. Spatiotemporal analysis of the agricultural drought risk in Heilongjiang Province, China. Theor. Appl. Climatol. 2018, 133, 151–164. [Google Scholar] [CrossRef]
  45. Ding, Y.; Schoengold, K.; Tadesse, T. The Impact of Weather Extremes on Agricultural Production Methods: Does Drought Increase Adoption of Conservation Tillage Practices? J. Agric. Resour. Econ. 2009, 34, 395–411. [Google Scholar]
  46. Friedrich, J.O.; Adhikari, N.K.; Beyene, J. The ratio of means method as an alternative to mean differences for analyzing continuous outcome variables in meta-analysis: A simulation study. BMC Med. Res. Methodol. 2008, 8, 32. [Google Scholar] [CrossRef] [PubMed] [Green Version]
  47. Shen, Y.; McLaughlin, N.; Zhang, X.; Xu, M.; Liang, A. Effect of tillage and crop residue on soil temperature following planting for a Black soil in Northeast China. Sci. Rep. 2018, 8, 4500. [Google Scholar] [CrossRef] [PubMed] [Green Version]
  48. Liu, H.-q.; Xu, J.-w.; Wu, X.-q. Present situation and tendency of saline-alkali soil in west Jilin Province. J. Geogr. Sci. 2001, 11, 321–328. [Google Scholar] [CrossRef]
Figure 1. Geographic location of the Songnen Plain in China and distribution of field sampling sites and digital cameras.
Remotesensing 15 01461 g001
Figure 2. (a) Line-transect method; (b) field digital camera.
Remotesensing 15 01461 g002
Figure 3. Workflow diagram for mapping maize tillage practices.
Remotesensing 15 01461 g003
Figure 4. (ad) The distribution of MRC in the Songnen Plain from 2019–2022, respectively. Note: Spatial resolution is 10 m.
Remotesensing 15 01461 g004
Figure 5. (ad) The spatial distribution of each tillage method across the Songnen Plain from 2019–2022, respectively.
Remotesensing 15 01461 g005aRemotesensing 15 01461 g005b
Figure 6. Determination of tillage practices based on model estimation of MRC and determination of tillage practices based on CCFC photos. (a) Map of tillage practices in the northern region of the Songnen Plain in 2022 based on the MRC estimation model; (b) photo taken in the northern region of the Songnen Plain on 23 May 2022; (c) map of tillage practices in the western region of the Songnen Plain in 2022 based on the MRC estimation model; and (d) photo taken in the western region of the Songnen Plain on 20 May 2022.
Remotesensing 15 01461 g006aRemotesensing 15 01461 g006b
Figure 7. Correlation between NDTI and MRC for single-phase images.
Remotesensing 15 01461 g007
Figure 8. Relationship between NDTI and MRC derived from the median streamlining function for each time series: (ad) 1–10 May time series, 10–20 May time series, 20–30 May time series, and 30 May–8 June time series, respectively.
Remotesensing 15 01461 g008
Figure 9. Comparison of different MRC levels with time series NDTI values.
Remotesensing 15 01461 g009
Table 1. Sentinel-2 band parameters used in this research.
Band SpecificationColorWavelength (nm)
Band 1Coastal433–453
Band 2Blue458–523
Band 3Green543–578
Band 4Red650–680
Band 5Vegetation red edge698–713
Band 6Vegetation red edge734–748
Band 7Vegetation red edge765–785
Band 8NIR785–900
Band 8aVegetation red edge855–875
Band 9Water vapor930–950
Band 10SWIR (Cirrus)1365–1385
Band 11SWIR1565–1655
Band 12SWIR2100–2280
Table 2. Spatial data information.
NameTimeResolutionInstituteReference
Sentinel 2 MSI Level-2A2019–202210 m/20 mEuropean Space Agencyhttps://scihub.copernicus.eu/dhus/#/home (accessed on 13 October 2022)
The 10 m crop-type maps in Northeast China from 2017–2019201910 mNational Earth System Science Data Centerhttp://www.geodata.cn (accessed on 9 October 2022)
NASDEM202030 mNational Aeronautics and Space Administrationhttps://search.earthdata.nasa.gov/search?q=nasadem (accessed on 10 October 2022)
Table 3. TIs used in previous studies.
TIAbbreviationFormulaRef.
Normalized difference tillage indexNDTI B 11 B 12 / B 11 + B 12 [28]
Simple tillage indexSTI B 11 / B 12 [28]
Normalized difference index 7NDI7 B 8 a B 12 / B 8 a + B 12 [29]
Shortwave red normalized difference indexSRNDI B 12 B 4 / B 12 + B 4 [30]
Normalized difference index 5NDI5 B 8 a + B 11 / B 8 a B 11 [29]
Normalized difference senescent vegetation indexNDSVI B 11 B 4 / B 11 + B 4 [31]
Modified crop residue coverMCRC B 11 B 3 / B 11 + B 3 [32]
Table 4. Relationship between NDTI and MRC obtained by different streamlining functions.
Time SeriesStreamlining FunctionRegression Equationr R 2
1–10 Maymediany = 0.0279 + 0.72781x0.19980.0399
meany = 0.02871 + 0.69695x0.20380.0415
maxy = 0.02845 + 0.40339x0.15790.0249
miny = 0.04182 + 0.70152x0.20370.0415
10–20 Maymediany = 0.00248 + 1.48341x0.32610.1064 *
meany = 0.01953 + 0.94001x0.24660.0608
maxy = 0.01998 + 0.54031x0.21190.0449
miny = 0.04501 + 0.22813x0.09850.0097
20–30 Maymediany = −0.0954 + 4.1503x0.9020.8136 **
meany = −0.0574 + 3.1696x0.79870.6379 **
maxy = −0.0328 + 1.7471x0.68550.4698 *
miny = 0.0339 + 0.7145x0.31910.1018 *
30 May–8 Junemediany = −0.02629 + 0.89433x0.29110.0847 *
meany = −0.02102 + 0.81631x0.26510.0703 *
maxy = 0.05277 + −0.04631x−0.02747.48 × 10−4
miny = 0.03048 + 0.48609x0.28730.0825 *
Note: ** and * indicate a significant relationship at the 0.01 and 0.05 probability level, respectively.
Table 5. Relationship between the estimated and measured MRC values obtained by the streamlining functions.
Streamlining FunctionRegression Equation R 2 RMSE (%)
mediany = 4.1503x − 0.09540.8136 **4.66
meany = 3.1696x − 0.05740.6379 **4.73
maxy = 1.7471x − 0.03280.4698 *4.44
miny = 0.7145x + 0.03390.1018 *6.06
Note: ** and * indicate a significant relationship at the 0.01 and 0.05 probability level, respectively.
Table 6. Confusion matrix for the classification of farming practices in the Songnen Plain in 2022.
Prediction
ITRTCT
ReferenceIT5810
RT001
CT000
Table 7. Share of tillage practices across the Songnen Plain, 2019–2022.
YearPercentage of Tillage (%)
ITRTCT
201996.603.320.08
202097.092.730.18
202196.253.550.18
202295.564.180.25
Table 8. Share of farming practices in the Songnen Plain and its provinces and cities in 2022.
RegionPercentage of Tillage (%)
ITRTCT
Songnen Plain95.564.180.26
Heilongjiang94.695.060.25
Daqing94.794.830.38
Harbin91.578.190.24
Heihe81.2518.010.74
Qiqihar96.243.550.21
Suihua97.582.250.17
Jilin96.613.120.27
Baicheng98.391.520.09
Changchun95.334.350.32
Siping96.463.170.38
Songyuan97.262.510.23
Disclaimer/Publisher’s Note: The statements, opinions and data contained in all publications are solely those of the individual author(s) and contributor(s) and not of MDPI and/or the editor(s). MDPI and/or the editor(s) disclaim responsibility for any injury to people or property resulting from any ideas, methods, instructions or products referred to in the content.

