Article

Identification and Analysis of Heatwave Events Considering Temporal Continuity and Spatial Dynamics

1
College of Surveying and Geo-Informatics, North China University of Water Resources and Electric Power, Zhengzhou 450046, China
2
Key Laboratory of Hydrology-Water Resources and Hydraulic Engineering, Hohai University, Nanjing 210098, China
3
Hydraulics and Geotechnics Section, KU Leuven, Kasteelpark Arenberg 40, BE-3001 Leuven, Belgium
4
Department of Environment, Tabas Branch, Tabas 9791735618, Iran
5
Department of Biosystems and Agricultural Engineering, Oklahoma State University, Stillwater, OK 74078, USA
6
State Key Laboratory of Desert and Oasis Ecology, Xinjiang Institute of Ecology and Geography, Chinese Academy of Sciences, Urumqi 830011, China
7
National Institute of Natural Hazards, Ministry of Emergency Management of China, Beijing 100085, China
8
Key Laboratory of Compound and Chained Natural Hazards Dynamics, Ministry of Emergency Management of China, Beijing 100085, China
*
Author to whom correspondence should be addressed.
Remote Sens. 2023, 15(5), 1369; https://doi.org/10.3390/rs15051369
Submission received: 19 January 2023 / Revised: 18 February 2023 / Accepted: 23 February 2023 / Published: 28 February 2023
(This article belongs to the Special Issue Prediction of Extreme Weather Events)

Abstract

:
In the context of global warming, the general increase in temperature has led to an increase in heatwave events, as well as a dramatic intensification of economic losses and social risks. This study employs the latest intensity–area–duration (IAD) framework that takes into account the temporal continuity and spatial dynamics of extreme events to identify regional heatwave events, and extracts key parameters of heatwave events to study the associated changes in frequency, intensity, influence area, and duration in seven geographic subregions of China in the 1979–2018 period. Heatwaves of all durations increased in frequency and intensity during the research period, with shorter heatwaves increasing in frequency and intensity at a faster rate than longer heatwaves. Among the seven geographic subregions, Xinjiang (XJ) and Southern China (SC) are the regions with the most frequent heatwave occurrence, while the Southwest (SW) and SC have the highest increase in heatwave frequency. In terms of regional distributions, XJ has the strongest heatwave event intensity and the largest affected area, while SC has the longest duration. However, in terms of spatial trends, SC, XJ, and the SW have the highest rates of intensity growth, influence area, and duration, respectively. In addition, heatwaves with extended durations and vast influence areas are more likely to occur in SC, and their frequency is on the rise. During the study period, the intensity, influence area, and length of heatwave occurrences in China exhibited an upward tendency, and it was shown that the longer the duration, the greater the intensity and the broader the influence area. In addition, the evolutionary characteristics of heatwave events with the longest duration indicate a certain consistency in their intensity and influence. These findings can contribute to the development of strategies to prepare for and mitigate the adverse effects of heatwave occurrences.

Graphical Abstract

1. Introduction

According to the Sixth Assessment Report of the Intergovernmental Panel on Climate Change (IPCC) [1], climate-resilient development already faces obstacles at the current rate of warming. If global warming exceeds 1.5 °C, climate resilience will be hampered even further [2]. Nonetheless, if global warming reaches 2 °C, such a development will be impossible in some locations [3], a crucial result that highlights the urgency of climate action. Particularly, some of the climate system changes that have already begun will be irreversible for hundreds to thousands of years, and with a global warming of 1.5 °C, heatwave events will increase, warm seasons will lengthen, and cold seasons will shorten; with a global warming of 2 °C, extreme high temperatures will reach critical tolerance thresholds for agricultural production and human health [4]. According to a study conducted by Rahmstorf and Coumou [5], the frequency of excessive summer heat in Moscow has increased by a factor of five in comparison to earlier decades. As the temperature continues to fluctuate, the intensity and frequency of heatwave occurrences in China have also grown [6], and the number of high temperature days in Shanghai in 2003 reached 42, the largest number in the last 50 years [7,8]. The risks associated with heatwaves are diverse [9]. In other words, in addition to having a significant impact on human health, agricultural production, and economic systems [10], heatwaves can also result in water pollution, ecological damage, droughts, and forest fires [11,12,13,14]. The number of fatalities and economic losses caused by heatwaves is significantly higher than other extreme weather events [15]. More than 60,000 people died directly or indirectly as a result of the 2003 European heatwave, which also cost over USD 10 billion in agricultural losses [16]. Moreover, 55,000 people were killed by the heatwave in Russia in 2010 [17]. According to a recent estimate, by the year 2100, nearly half of the world’s population may experience a lethal heatwave annually [18]. The detrimental effects of heatwaves have garnered broad attention from government agencies and the scientific community in numerous nations, and have become a popular topic in meteorological-hazard-relevant research [19,20].
Numerous climate-based studies have acknowledged that an accurate measurement of a heatwave requires more than simply counting over temperature thresholds or the magnitude of temperatures on the hottest days of the month or year. Meehl and Tebaldi [21] studied the variation in severity, frequency, and duration of heatwaves in North America and Europe using two heatwave definitions based on daily maximum and minimum temperatures. Fischer and Schar [22] investigated the variability of several heatwave indices in Europe, including hot days/cold nights, apparent temperature, and multi-observation indices. In that study, a heatwave was defined as temperatures above the 90th percentile of their respective maximum temperature on calendar days for at least six consecutive days. Using the 90th percentile of daily mean temperatures, Vautard et al. [23] evaluated the amplitude and durability of heatwaves in Europe. Schoetter et al. [24] examined the cumulative severity of heatwaves based on average intensity, average range, and duration for the days when the 98th percentile of maximum temperatures was surpassed for at least three consecutive days. Russo et al. [25] suggested a heatwave magnitude index by calculating the maximum magnitude of events that occurred over the 90th percentile of calendar daily maximum temperatures for at least three consecutive days between 1981 and 2010. Stefanon et al. [26] categorized the length and spatial distribution of occurrences by employing the 95th percentile of daily temperature. While a substantial number of climate-based studies appear to have classified heatwaves as multi-characteristic occurrences, there are also studies that identify heatwaves based on single characteristics such as intensity [27], length [28,29], or frequency [30]. Some studies examine heatwaves using monthly rather than daily temperatures [31]. Almost every climatic study on heatwaves has employed a distinct metric. Notably, the heatwave index dataset included in the present investigation was generated by a complex algorithm that Huang et al. [32] developed specifically for China. For additional information, readers might refer to our earlier work [33].
In addition, as research on extreme climate events has expanded, a change has occurred from a single-point extreme value analysis to a temporal and spatial approach for regional extreme events [34,35]. Ren et al. [36] suggested an objective identification approach for regional extreme climate events, relating the duration of the event and the impact range; nevertheless, for different types of extreme events, it must be improved mainly based on the event’s own characteristics. Gong et al. [37] established a library of related regional extreme low-temperature occurrences based on an objective technique for identifying regional extreme events. Subsequently, Wang et al. [38] investigated the spatial distribution and temporal variation characteristics of regional extreme low-temperature events from the perspective of spatial distribution and temporal variation trends, revealing the overall trend of regional extreme low-temperature events in China from 1960 to 2009. When an extreme event happens at a station, several studies [39,40] have suggested utilizing indications such as the probability of extreme events occurring at the remaining stations in the country, or the number of stations near a station with a high probability of extreme precipitation. Tu et al. [41] defined a cluster storm occurrence as precipitation over 50 mm at more than ten meteorological stations within 200 km. Recent studies [42,43,44] have utilized the intensity–area–duration (IAD) technique to detect extreme precipitation events and extreme high-temperature events with a particular intensity and effect area on a given time scale. Consequently, the most recent framework of the IAD technique, which takes temporal continuity and spatial dynamics into account, was used to identify the regional heatwave occurrences in this investigation, as described in Section 2.3.2.
This study focused on the identification of regional heatwave events and the associated analysis of spatiotemporal variation in China, which refers primarily to the following four aspects: (1) identifying regional heatwave events with a consideration of temporal continuity and spatial dynamics using the IAD algorithm; (2) investigating the frequency of regional heatwave events using the identified regional heatwave events; (3) analyzing the intensity, including the average and strongest center, influence area, and duration of regional heatwave events; and (4) illustrating the spatiotemporal dynamic evolution of heatwave events. The main breakthroughs of the present study are providing a comprehensive understanding of regional-scale heatwave dynamic patterns, and conducting a holistic analysis of heatwave events from the perspectives of intensity, influence area, and duration. The authors believe this investigation can help us better comprehend the causes and effects of heatwaves in specific geographic areas, and assist researchers in identifying the specific impacts of climate change on heatwaves and how they may evolve in the future. Additionally, it can help the public mitigate the impacts of heatwaves and reduce the risk of damage. Additionally, all acronyms and corresponding full names presented in this study were illustrated in Table A1 to better the reader’s understanding.

2. Materials and Methods
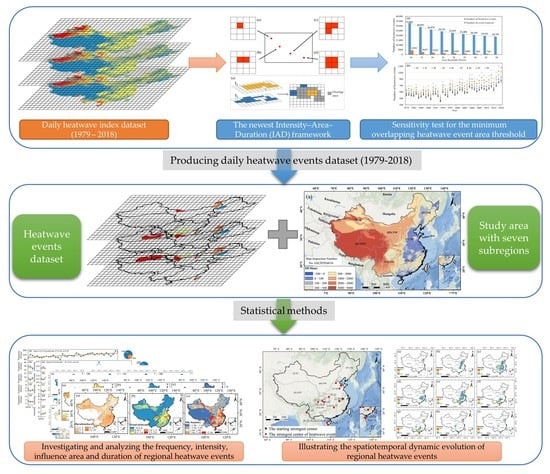
2.1. Study Area

China is located in eastern Eurasia and on the western shore of the Pacific Ocean. Its topography is diversified, with a terraced distribution of high land in the west and low terrain in the east. China has the greatest population of any emerging nation in the world. China’s population had surpassed 1.4 billion by 2021, representing around 18% of the global population. In 2020, the overall gross domestic product (GDP) amounted to CNY 14,72 trillion, or approximately 17.4% of the global total [45]. However, heatwaves caused around 1% of China’s GDP losses, and heatwave-related deaths have quadrupled in China since 1990 [46]. By 2019, the number of deaths attributable to heatwaves reached 26,800, and the resulting economic loss equaled the average yearly income of 1.4 million Chinese people [47]. China is huge, encompasses a wide variety of latitudes, and varies substantially based on its distance from the ocean and terrain elevations. As a result, diverse combinations of temperature and precipitation exist, resulting in a variety of climates. In order to better understand the variance characteristics of heatwaves in China, a geographic subregions method, which was adopted in our earlier research [33], was utilized in this study. The subregions can be described as follows (Figure 1): (I) Xinjiang (XJ), which is characterized by a temperate continental climate; (II) the Qinghai–Tibetan Plateau (QTP), characterized by a subfrigid climate; (III) the Northwest (NW), with an arid and semiarid climate; (IV) the Northeast (NE), with a humid and semihumid climate; (V) North China (NC), which has a semihumid climate; and (VI) the Southwest (SW) and (VII) South China (SC), both of which are characterized by a humid climate.

2.2. Data Collection

In this investigation, we employed the heatwave index (HWI) dataset created in our earlier work [33], which has a temporal and spatial resolution of 1 day and 0.1° × 0.1°, respectively. It is calculated using daily maximum temperature (MAXT) and specific humidity (SH) using Huang et al.’s [32] HWI method. The MAXT dataset, derived from the National Meteorological Information Center (NMIC) and the National Tibetan Plateau/Third Pole Environment Data Center (TPDC), was interpolated by the Thin Plate Spline (TPS) using in situ observations from approximately 2400 national meteorological stations, with an average deviation of 0.2 °C and an RMSE of 0.25 °C [48]. The SH dataset, derived from the TPDC, was created by combining various types of data, such as in situ observations, Tropical Rainfall Monitoring Mission (TRMM) 3B42 precipitation data, Global Land Data Assimilation System (GLDAS), etc. For additional information on the MAXT and SH datasets, the interested reader is directed to the aforementioned works [33,49,50,51]. In this study, the HWI dataset from 1979 to 2018 was used to identify heatwaves and assess their dynamic properties, taking temporal continuity and spatial dynamics into account.

2.3. Methodology

2.3.1. Heatwave Index and Levels

Huang et al. [32] created a discriminant index of heatwaves and its grading standards relevant to China based on the fact that a heatwave is defined as an extended period of exceptionally high temperatures during hot and humid days. This score is based on the premise that the impact of heatwaves on human health differs greatly across China’s climate zones. The heatwave index (WHI) is a comprehensive index that takes temperature and humidity into account, and it may be represented as Equation (1):
H W I i = 1.2 ( E T E T ) + 0.35 i = 1 N 1 1 n d i × ( E T i E T ) + 0.15 i = 1 N 1 1 n d i + 1
where ET is the heat index of the present day representing the comfort of the human body to the weather environment; E T denotes the heat critical value where larger values indicate sensing heat; E T i is the heat index of the i-th day before the present day; ndi is the number of days between the i-th day and the present day; and N is the duration of the hot weather process. For a more detailed description of the algorithm, please refer to Liu et al. [33] and Huang et al. [32].
On the basis of the above-obtained heatwave index, heatwaves can be divided into three groups based on the varying degrees of socio-economic and human health impacts: light, moderate, and severe. Table 1 displays the categorization scheme.

2.3.2. Intensity–Area–Duration (IAD) Analysis

The majority of studies on high-temperature events use a single station/pixel extreme threshold or a multi-station (weighted) average threshold within a specified range for event identification and analysis [52,53,54,55]. Even though a complex natural phenomenon that has a tendency to migrate through time and space, heatwaves have received scant consideration for their temporal continuity and geographical migration features. Due to this characteristic, even the same heatwave event will alter spatially over time, making it extremely difficult to identify. This is due to the fact that during a heatwave, not only must the events be identified simultaneously, but it must also be determined whether occurrences happening at different times and of unclear duration are equivalent. Dracup et al. [56] proposed that a drought event comprises duration, intensity (average water deficit, AWD), and severity (cumulative water deficit, CWD). Then, Sheffield [57] extended this method further, introduced the severity–area–duration (SAD) algorithm, and studied worldwide regional drought episodes from 1950 to 2000. Unfortunately, this approach does not account for the spatial dynamics characteristic of extreme occurrences.
The Jiang laboratory conceived and developed the intensity–area–duration (IAD) algorithm [42,58] to identify drought occurrences and high-temperature events on a space–time scale, which is a further development of the algorithm based on SAD, in order to handle such a complex challenge. In light of temporal continuity and spatial dynamics, the current framework of the IAD algorithm was utilized in this study and coded using Matlab 2021b to recognize heat-wave occurrences and examine their related properties. The following is a full description of the IAD framework:
(1)
Finding the strongest center. On the basis of the heatwave index dataset, the grid point with the highest heatwave index in the study region on the present day is identified as the onset of an event (Figure 2a), and the intensity and area are recorded.
(2)
Obtaining the event influence range. Next, the second strongest grid point among the eight neighborhood grid points around the current grid point is identified and merged into the event range (Figure 2b). The range of the current two grid points is used as the next starting point, and the intensity and area are recorded. The intensity is the average of the existing grid points that have been merged into the event range, and the area is the sum of the areas of the established grid points. This method is continued until there are no more grid points in the continuous space that surpass the threshold value, and the set of all grid points identified in this process is classified as a full heatwave event (Figure 2c,d).
(3)
Identification of all regional heatwave events on the current day. Steps 1 and 2 are repeated until there are no points exceeding the threshold in the area on the present day.
(4)
Identification of all regional heatwave events on a daily basis. Steps 1, 2, and 3 are repeated to identify all regional heatwave events in the HWI dataset on a daily basis from 1979 to 2018. Each heatwave event is marked with a different number for each year.
(5)
Event continuity determination. The area threshold is used to determine the time continuity between events. Only events whose areas are larger than the area threshold are considered. If the overlapping region of two events at contiguous times exceeds the area threshold, they are considered to be part of the same heatwave event (Figure 2e). Notably, the threshold will be determined experimentally later in this investigation. In accordance with this rule, events at contiguous moments are compared, and eventually, all events are linked in space–time and assigned a unique number.
(6)
Extraction of the events’ key parameters according to the marked number. This study characterizes heatwave episodes using four variables: event frequency, severity, duration, and impact area. Frequency is the number of events, intensity is the mean value of the heatwave index at all grid points within an event, duration is the number of days from incidence to termination, and impact area is the maximum impact area of an event.

2.3.3. Mann–Kendall Trend Test

In this study, the Mann–Kendall (MK) trend test was also used to determine the significance of factors connected to heatwave episodes which is a non-parametric statistical test that assesses the presence of trends in time series data without making any assumptions about the underlying distribution [59]. The null hypothesis (H0) of the test states that there is no trend and that the data are ordered randomly and independently. The null hypothesis’s judgment is checked by alternative hypothesis (H1), which presupposes the presence of a trend [60]. The MK trend test statistic S can be obtained through Equation (2):
S = i = 1 n 1 j = i + 1 n s i g n ( x j x i )
where n represents the length of observations and xi and xj are the sequential data values. Moreover, the sign of the test statistic can be expressed as Equation (3):
s i g n ( x j x k ) = 1 i f ( x j x k ) > 0 0 i f ( x j x k ) = 0 1 i f ( x j x k ) < 0
It is worth noting that the statistic S can be approximately normally distributed with a mean value of 0. Additionally, the variance can be calculated through Equation (4):
V a r ( S ) = n ( n 1 ) ( 2 n + 5 ) i = 1 m t i ( t i 1 ) ( 2 t i + 5 ) 18
where m denotes the number of tied groups and ti represents the number of ties of extent i. A tied group means a set of sample data having the same value. Finally, the MK rank trend test statistic Z value can be calculated as Equation (5):
Z = S 1 V a r ( S ) i f ( S > 0 ) 0 i f ( S = 0 ) S + 1 V a r ( S ) i f ( S < 0 )
where a positive or negative value of Z shows an upward or downward trend. Specifically, at the 95% significance level or p of <0.05, the null hypothesis (H0) of no trend is rejected if the absolute value of Z is greater than 1.96; similarly, at the 90% significance level or p of <0.1, the null hypothesis (H0) of no trend is rejected if the absolute value of Z is greater than 1.64.

3. Results

3.1. Analysis of Variations in the Frequency of Heatwave Events

The frequency represents the number of heatwave occurrences in the research region between 1979 and 2018. This study identified regional heatwave occurrences in China using the most recent IAD algorithm and the heatwave index dataset. As seen in Figure 3, a total of 6026 heatwave events with an impact range of more than 40 grid points occurred in the research region between 1979 and 2018, with an average of approximately 150 occurrences per year and a rising trend of 17.4 times/decade. The years 2017 and 2018 were the years with the greatest frequency of heatwave events; more precisely, 2017 was the year with the highest frequency of heatwave events in the past 40 years, with 213 occurrences, while 2018 was the year with the second-highest frequency, with 207 occurrences. The year 1993, with a total of 90 occurrences, was, nonetheless, the year with the lowest frequency. In terms of decadal analysis, there was a falling trend from 1979 to 1988, with a decline rate of −13.9 times/decade, and a rising trend from 1989 to 1998, 1999 to 2008, and 2009 to 2018 with concomitant rise rates of 32.7, 24.4, and 31.2 times/decade. The frequency of heatwave occurrences climbed most rapidly in the 1990s, declined in the early 21st century, and then increased again during the past decade. From 1979 to 2018, the frequency of heatwave incidents in China exhibited a decreasing and then increasing trend.
Duration was split into five ranges: 1–2 days, 3–5 days, 6–8 days, 9–11 days, and longer than 12 days. As seen in Figure 4, the number of heatwave events lasting between 1–2 days was 4226, accounting for approximately 70% of all events, while the number of events lasting between 3–5 days accounted for around 19%. Consequently, the majority of heatwave events lasted fewer than six days, whereas the total number of incidents lasting six days or more was 665, representing almost 11%. The number of events lasting 9–11 days was the smallest, with 122 occurrences, while the frequency of events lasting 12 days or more was the highest, with 203 occurrences. As seen from the trend line in Figure 4, all frequencies of heatwave occurrences with varying durations exhibit an upward trend. Specifically, the trend of the increasing frequency of duration in 1–2 days, 3–5 days, 6–8 days, 9–11 days, and more than 12 days was 12.0 times/decade, 2.6 times/decade, 1.1 times/decade, 0.4 times/decade, and 1.3 times/decade, respectively, and all but the duration of 9–11 days passed the 95% significance test.
According to statistical data, heatwaves in China typically occur between mid-April and early October, with extensive outbreaks in July and August. Normally, heatwaves begin in SC in mid-April and continue until around the beginning of May, when they spread to the SW, XJ, NW, NC, etc. Heatwaves typically end in SC. As shown in Table 2, the frequency of heatwave events across the seven climatic zones of China from 1979 to 2018 varied significantly, with the most common heatwave events occurring in SC, accounting for around 37% of all events, with an annual average of 56 events. This was followed by XJ, which averaged 37 events per year and accounted for around 24% of all events. However, the QTP had the fewest heatwaves, with a total of five over the past four decades, including one in 1988, two in 2000, one in 2013, and one in 2016. Evidently, the majority of heatwave incidents in this region occurred since 2000, and the gap between occurrences decreased. In addition, the duration of the vast majority of heatwave episodes in each subregion is fewer than six days. Overall, the majority of heatwave events occurred in SC, XJ, and the SW, with the overall number of occurrences accounting for around 76% of all heatwave events. In addition, the risk of longer-duration heatwave occurrences happening in these three regions is comparatively greater, as is the longest duration and largest impact area of heatwave events.
According to the regional distribution of frequency for all durations (Figure 5a), the majority of heatwave occurrences in the research area occurred in XJ, SC, and NC. In the past 40 years, 1% of the studied region had more than 300 heatwave episodes, primarily in the east and south of XJ, with an average of roughly 10 events each year. The next high-value region is primarily found in southern SC and central NC. In contrast, the low-value zone is primarily concentrated in the eastern and southern NW, eastern NE, and southern SW, where the frequency of heatwave events is fewer than 10 times per 40 years, with the majority of heatwaves occurring once every three or four years. Figure 5b–d provides more evidence that the shorter the duration, the more frequent the heatwave events, and that the frequency and distribution area are both at a maximum for heatwave events lasting only 1–2 days. In general, heatwaves tend to persist longer when they occur more frequently.
From 1979 to 2018, the frequency of heatwave incidents in China exhibited distinct regional characteristics and durations (Figure 5e–h). From the trend of all heatwave events (Figure 5e), 65.6% of the study area exhibited an increasing trend in frequency, and 27.9% of the regions exhibited a significant increasing trend, primarily in the east of NC, northeast and south of SC, north of SW, west of NW, and east and south of XJ, whereas a small portion of western XJ exhibited a significant decreasing trend. The remainder of the country, however, shows no notable shifting trend. In terms of heatwaves lasting 1–2 days, the changes in the NE, NW, QTP, and southern SW were not substantial (Figure 5f). Nevertheless, a tiny portion of western XJ and central NC had a substantial decreasing tendency, accounting for roughly 3.7% of the research area, whereas the remainder of China exhibited a significant increasing trend, with the highest increase occurring in the south and northeast of SC. For heatwave occurrences lasting between 3 and 5 days (Figure 5g), there was no substantial change in the majority of China, with the exception of central and western XJ and central SC, where the frequency of heatwave events decreased significantly. As depicted in Figure 5h, the frequency of heatwave events with a duration greater than six days exhibited a significant increasing trend in the majority of SC and southeastern XJ, while the area with the highest value exhibited a highly significant increasing trend in the northern portion of the SW. The rapidly expanding area comprised 14.2% of the research area, whereas the remaining area exhibited no notable changes. In general, the frequency of heatwave events of varying durations tends to grow, and the amount of change in the frequency of heatwave events with durations longer than six days is greater than that of events with durations less than six days. Consequently, it can be predicted that the likelihood of long-lasting heatwaves will grow.

3.2. Intensity–Area–Duration Analysis of Heatwave Events

3.2.1. Variation in the Intensity of Heatwave Events

The intensity of a heatwave event is the mean value of the heatwave index at all affected grid points. However, the average intensity does not completely reflect the severity of heatwaves. Therefore, this study will examine the intensity changes in heatwave episodes in terms of both their average intensity and their strongest center intensity.
As depicted in Figure 6, from 1979 to 2018, the annual mean heatwave intensity in China was 4.09, and the annual mean central intensity was 6.67. Apparently, the temporal variation in the annual mean intensity and the strongest central intensity of heatwave episodes was nearly consistent, with the lowest and highest values occurring in 1993 and 2004, respectively. The minimum and maximum annual mean intensities were 3.87 and 4.61, while the annual strongest central intensities were 5.70 and 10.40. Overall, heatwave event intensities and the strongest central intensities increased at a rate of 0.28 and 0.05 per decade, respectively. An interdecadal study reveals that the intensities of heatwave events increased in stages. Specifically, 1979–1988 and 1989–1998 are the eras with the lowest intensity of heatwave events and the highest central intensity. For the majority of the first 20 years, the intensities of heatwave episodes were below the multi-year average. After 1998, there was a considerable increase in the intensity and frequency of heatwave events. In the 1999–2008 and 2009–2018 periods, the interdecadal mean values of the intensity of heatwave events were 4.20 and 4.13, respectively, more than the 40-year average intensity of heatwave events. Since the beginning of the 21st century, heatwave intensity has increased significantly, especially in the early 21st century as the peak intensity period. In terms of the entire study period, the late 1990s to the beginning of the 21st century and the years after 2013 are more intense than earlier periods. The years with the most intense heatwave events, 2003, 2004, and 2018, all happened after the turn of the 21st century.
As shown in Figure 7, the variations in the intensity of heatwave events and the greatest center of intensity for different durations are largely consistent, indicating that the longer the duration, the greater the intensity of the heatwave event and its strongest center of intensity. The correlation between the intensity and duration of heatwave occurrences was positive. The mean intensity of heatwave events with a period of 1 to 2 days was 3.79, and the strongest central intensity was 5.87. However, the mean intensity of heatwave events with a duration of more than 12 days was 6.02, and the strongest central intensity was 12.13.
Figure 8 demonstrates that the duration of heatwaves correlates with a rise in both the range and amplitude of their intensity ranges and variations. The intensity of heatwave events with a duration of 1–2 days has been relatively stable over the past four decades, with insignificant fluctuations, and the intensity of the heatwave generally has remained between 3.5 and 4, whereas the intensity of heatwave events with a duration of more than 12 days has a large fluctuation range, with the maximum in 2018 reaching 8.6 and a minimum of approximately 4.7. Therefore, it appears that heatwaves become more severe as their duration increases. Over the past four decades, the intensity of heatwave occurrences has increased, and this trend is particularly obvious for heatwave events that last for longer periods of time. The severity of heatwave episodes lasting 1–2 days, 3–5 days, 6–8 days, 9–11 days, and more than 12 days increased at a rate of 0.03, 0.04, 0.1, 0.18, and 0.34 per decade, respectively.
Based on the spatial distribution (Figure 9), approximately 65% of the study area exhibits heat-wave intensities between 2.8 and 6.5. The locations with the highest values are primarily found in the eastern portions of XJ, with intensities often greater than 6.5. In addition, a few places in the southern SW have a high score for heatwave event intensity, with values ranging from 6.5 to 10.5. From the spatial distribution of intensity trends, 37.4% of the research region exhibits a rising trend, with the most rapid increase occurring in the north of SC, southeast of XJ, and north of SW at a rate of more than 1.0 per decade, followed by NC and the west of NW. With the exception of the NE, the north, east, and south of the NW, the northwest of XJ, and the south of the SW, where the changing trend was not evident, the increasing tendency was quite significant in all regions. Overall, the spatial variation trend of intensity reveals obvious spatial regional differences. SC has the strongest and fastest-growing trend in increasing heatwave event intensity from 1979 to 2018, with practically all regions in the state showing extremely significant increasing trends. Therefore, special attention should be paid to preventing future high-temperature heatwave events in this region.

3.2.2. Variation in the Influence Area of Heatwave Events

Figure 10 depicts the annual cumulative influence area of regional heatwave events in China from 1979 to 2018. During the last 40 years, the average annual cumulative effect area was approximately 1.1 × 10⁷ km2. In 2001, the biggest annual cumulative influence area was 1.6 × 10⁷ km2, or approximately 1.7 times the whole size of the research region. This is followed by the years 2016, 2005, 2018, and 2017, which all surpass 1.5 × 10⁷ km2. It also shows that the value over the previous four decades is highest in the areas hit by heatwaves over the past three years. In 1993, the smallest cumulative effect area of a heatwave was 3.9 × 10⁶ km2. From 1979 to 2018, the cumulative effect area of heatwave episodes increased by 2.0 × 10⁶ km2 per decade. From the interdecadal analysis, it can be concluded that the first 20 years, namely 1979–1998, has a relatively smaller cumulative influence area with an average value of 8.8 × 10⁶ km2 when compared with the latter 20 years of the study period. With the exception of 1997, every year’s cumulative influence area is smaller than the long-term average during these 20 years. From 1999 to 2018, the cumulative influence area increased significantly, with an average of 1.3 × 10⁷ km2, which is greater than the 40-year average cumulative influence area and approximately 1.5 times the annual mean cumulative influence area of the previous 20 years.
Through the analysis of the heatwave event influence area statistics for the seven climate subregions from 1979 to 2018 (Table 3), it is revealed that XJ has the largest cumulative influence area by 16,847.13 × 104 km2, accounting for nearly 37.93% of the total area, followed by SC, accounting for 29.87%. The land area of XJ is smaller than SC, so it probably can be concluded that XJ is the most severely affected area by heatwave events. In addition, from trend analysis and significance testing of the annual cumulative influence area for each subregion from 1979 to 2018, the following can be suggested: The annual cumulative influence area in SC increased at the most rapid rate, followed by XJ and the SW, with increasing rates of 86.3 × 10⁴ km2/decade, 46.7 × 10⁴ km2/decade, and 29.8 × 10⁴ km2/decade, respectively, and all of them were significant at the level of 0.01, while the NW increased at a rate of 23.5 × 10⁴ km2/decade, which was significant at the level of 0.05. On the contrary, the increasing trends in the remaining regions of the study area were not significant.
As shown in Figure 11, the total number of heatwave events with durations greater than 12 days accounts for about 3% of all cases, with their cumulative influence area reaching 1.3 × 10⁸ km2, and the average influence area of individual events being 6.2 × 10⁵ km2, both of which are the maximum among all the five durations. This is followed by heatwave events lasting 3–5 days, with a cumulative impact area of 1.2 × 10⁸ km2. The number of heatwave events with a duration of 9–11 days accounts for less than 2% of the total number of events, and their cumulative influence area is also the smallest. However, its mean influence area is 3.3 × 10⁵ km2, which is just followed by heatwave events lasting 12 days or more. In addition, the results of the MK trend analysis show that the area affected by heatwave events with durations of 1–2 days, 3–5 days, and 12 days or more show a significant increasing trend. In particular, the heatwave events with a duration of 12 days or more showed the most significant increasing trend, with a rate of 9.9 × 10⁵ km2/decade; that is to say, the area affected and the rate of growth rise proportionally with the length of a heatwave event. In addition, comparing the influence area for events of varying durations makes it clear that the size of the affected area is directly related to the length of the heatwave. Accordingly, we need to pay more and closer attention to the development of the spatial dynamics of longer-lasting heatwave events, conduct in-depth analyses of their spatial patterns and evolution, and issue timely early warnings in both suitable time and space domains.

3.2.3. Variation in the Duration of Heatwave Events

The average duration of regional heatwave events in China between 1979 and 2018 was 2.8 days, and the national average duration of heatwave events exhibited a decreasing and then rising trend. There was an overall upward trend with a 0.16 days/decade rate (Figure 12). During the studied period, the shortest duration of heatwave episodes was 2.16 days in 1989, while the highest was 3.40 days in 2015 and 3.36 days in 2016. In addition, frequent heatwaves have occurred in China. The years 2002, 2005, 2014, 2015, and 2016 were all years with a high number of heatwave days in the 21st century. It is evident that three of the five years occurred within the last five years. In the context of global warming, it can be deduced that there would be a rising trend of heatwaves. The number of heatwave days decreased during the first 20 years, whereas the duration of heatwave episodes increased continuously during the last 20 years. The duration of heatwave episodes in the 1979–1988 and 1989–1998 periods was less than the average value for the research period by 0.19 and 0.16 days, respectively, compared to the multi-year average. The average duration of events between 1998 and 2008 and 2009 and 2018 was 2.8 days and 3.1 days, respectively, with 2009–2018 surpassing the average by 0.3 days.
In general, heatwave events in the south last longer than those in the north, and the likelihood of protracted heatwave event duration is greater in the south. Figure 13a further reveals that, among the seven subregions, SC and XJ were more likely to experience longer heatwaves. In the northern and central regions of SC and the southeastern regions of XJ, the heatwave lasted for more than six days, while in the northeastern regions of SC, they typically lasted for more than nine days, rendering them as areas with higher heatwave durations. The duration in NC, the western NW, and the northern SW are quite brief, ranging from 3 to 5 days, while the duration in the NE is only 1 to 2 days. In general, the frequency and spatial extent of heatwaves increase as their duration decreases. The area proportion of heatwave events with a duration of fewer than 9 days in the study area reached approximately 97%, whereas the area with a duration of 3–5 days accounted for 46.6% of the study area which was the largest proportion among the durations less than 9 days. Moreover, the areas with a duration of 1–2 days and 6–8 days accounted for 36.6% and 13.3% of the total area, respectively. Based on the changing trend (Figure 13b), the duration of heatwave events in the NE, QTP, south of SW, and east of NW exhibited a non-significant decreasing trend, whereas the duration of heatwave events in SC, NC, XJ, and the north of the SW exhibited an increasing trend, with the north of the SW and northeast of SC exhibiting the largest increasing trend, at a rate greater than 1d/decade. Some 70% of the areas with an increasing trend were significant at the 0.05 level. These areas were primarily located in SC, NC, and the north of the SW. The northern SW was an exceptional case with the largest rising trend (p < 0.01, Figure 13c). In the future, greater consideration should be given to the occurrence of heatwaves in this region.

3.3. Analysis of Spatiotemporal Evolution of Heatwave Events

Heatwave events are characterized by temporal continuity and spatial dynamics. Therefore, in order to conduct a comprehensive study on the identification of heatwave events, it is necessary to analyze them not only on a temporal scale but also from a spatial perspective. Based on the results of the heatwave identification, the 10 most severe heatwave episodes were chosen for this analysis. Finally, the longest-lasting heatwave occurrence among those recorded between 1979 and 2018 is examined as a case study in order to examine and assess the evolution process.
Table 4 shows the top 10 heatwave events ranked by duration from 1979 to 2018. The duration of these events was roughly distributed from early July to mid-late August, with the longest duration of 56 days. It occurred first in SC, with a duration from 12 July 2018 to 5 September 2018, affecting an area of 229.56 × 10⁴ km2 and a cumulative area of 3.48 × 10⁷ km2, covering SC, NC, and the SW. It can also be seen that 8 of the top 10 heatwave events in terms of duration occurred first in southern China, and two occurred in 2018, appearing within the last 5 years, accounting for 50% of the total area. It indicates that long-duration heatwave events are occurring more frequently and with increasing severity. The statistics of the top 10 heatwave events by influence area from 1979 to 2018 are shown in Table 5. The heatwave event with the largest influence area occurred in the NW with a duration of 49 days. It started on 9 July 2010 and ended on 27 August 2010, with an influence area of 386.35 × 10⁴ km2 and a cumulative influence area of 2.76 × 10⁷ km2. Of these 10 events, four occurred in SC, two in NC, two in XJ, and the remaining two in the NW and NE. In addition, in terms of occurrence, 4 of the 10 events occurred within the last five years. From the above analysis, it can be concluded that SC is the high occurrence area with a long duration and large influence area, and such heatwave events with a higher severity have appeared more frequently over the last 5 years. According to Table 4 and Table 5, there are four overlapping events indicating heatwave events with longer durations are often accompanied by a larger influence area. It suggests that there is a positive correlation between the two features to some extent.
The changes in the influence area and intensity of the longest-duration heatwave event in China from 1979 to 2018 are shown in Figure 14, showing an increasing–decreasing fluctuation in both influence area and intensity. The influence area of this episode reached the maximum value of 1.1 × 10⁶ km2 on the 29th day, and its intensity reached the maximum value of 12.72 on the 42nd day. There appears to be a lag between the intensity of heatwave occurrences and their area of influence, as shown by the distribution of peak values. The event’s influence area and intensity change process have a certain consistency.
In order to show the process of heatwave changes in more detail, we mapped the spatial strongest center variation for the whole event duration (Figure 15) and spatial distribution for the 1st, 5th, 10th, 20th, 40th, 45th, 50th, and 55th days of the event duration (Figure 16). By studying the spatial and temporal variation of this heatwave event, the following evolutionary process is revealed: the event first appeared in the north-eastern part of the SW, then moved northward to reach NC, where the strongest center was located for four consecutive days; after that, it moved southwestward to the SW, where the strongest center lasted for 7 days; on the 13th day, the strongest center reached the northern part of SC, and three days later, the strongest center returned to the SW and lasted until the 18th day; after that, the event dissipated. Between the 26th and 40th day of the heatwave’s duration, the province of Hainan in SC was the location where the heatwave’s strongest center was located.

4. Discussion

In this study, the spatio-temporal distributions and variations in the frequency of regional heatwave events of different durations (e.g., 1–2 days, 3–5 days, 6–8 days, 9–11 days, and more than 12 days) in China and its seven geographic subregions, including Xinjiang (XJ), the Qinghai–Tibetan Plateau (QTP), Northwest (NW), Northeast (NE), North China (NC), Southwest (SW), and South China (SC), in the 1979–2018 period were first analyzed. On the basis of the intensity–area–duration (IAD) approach and spatial analysis method, the spatial and temporal variation characteristics of heatwave occurrences’ intensity, influence area, and duration were explored. Compared to our previous work [33], the relatively higher heatwave frequency in XJ, SC and NC was also detected in the present study, although different methods and perspectives were employed. However, some uncertainties still exist in the present study, which can be described as follows:

4.1. Uncertainty in the Definition of Heatwave Index

Despite the fact that this uncertainty has been covered in our prior work [33], we nonetheless wish to provide fundamental descriptions due to its significance. The primary criterion for identifying heatwaves [61] is the degree of impact or danger that high temperatures pose to humans. The dangers of heatwaves are determined by a variety of factors, including geography, society, and the economy [62]. Various nations and areas have produced distinct criteria based on unique methodologies [63,64]. For instance, the World Meteorological Organization (WMO) defines a heatwave as daily maximum temperatures exceeding 32 °C for more than three days [65]. The IPCC defines a heatwave as a weather phenomenon in which daily maximum temperatures exceed the 90% quantile for multiple consecutive days [66]. The United States, Canada, and Israel issue heat advisories based on an index that combines the impacts of temperature and relative humidity [67,68]. On the other hand, the Royal Netherlands Meteorological Institute (KNMI) defines a heatwave as a daily maximum temperature above 25 °C that lasts for at least five days, including at least three days of maximum temperatures exceeding 30 °C [22]. When the daily maximum temperature reaches or surpasses 35 °C for at least three consecutive days, the China Meteorological Administration (CMA) classifies the weather as a heatwave [69].
As a result, there might be systematic underestimations because different countries and regions use different assessment methodologies with varying degrees of assessment error. In addition, most meteorological departments depend solely on temperature to identify heatwaves, yet the meteorological environment has a wide-ranging impact on human comfort. Although temperature is a highly essential element, air humidity can also affect human comfort by affecting the rate of heat dissipation. Relative humidity changes at the same temperature can have vastly different effects on human comfort. In order to objectively define heatwaves, it is necessary to examine the impacts of temperature and humidity on humans for a fuller evaluation of heatwaves. In addition, heatwaves are a continuous process. Therefore, integrating temperature, humidity, and cumulative effects provides a more accurate identification criterion. Lastly, communities and age groups differ in their tolerance for heatwaves. Therefore, additional study on the association between heatwaves and health in various places is required to develop appropriate criteria for identifying heatwaves in the region.

4.2. Determination of the Minimum Overlapping Heatwave Area Threshold

There are no particular ways to define the minimal overlapping area threshold required to determine the temporal and spatial continuity of an event. The minimum event overlapping threshold is a crucial parameter for estimating the frequency of occurrences, and the selection of the area threshold involves careful consideration of the size of the study area, the extreme climate effect range, and the type of extreme climate [70,71]. The impact range of various climate extremes is highly variable and cannot be generalized [72]. In addition, even for the same sort of extreme climate, there are different definition criteria, such as different drought indices [73]. In order to increase the rationality of the identification of extreme climate events and the applicability to the real world, the determination of these two thresholds must be based on the specific content of the study and take into account a number of contributing elements.
Andreadis et al. [74], in a study of drought events in the United States during the 20th century, defined the event minimum area threshold as 10 pixels with a spatial resolution of 0.5° × 0.5°, approximately 2.5 × 10⁴ km2, and a drought event with an influence area exceeding this threshold was defined as a drought event. Sheffield et al. [57] defined an area threshold of 50 × 104 km2 for global drought event analysis, which is significantly larger than the 2.5 × 10⁴ km2 previously adopted by Andreadis et al. [74]; their initial experimental study showed that if 2.5 × 10⁴ km2 and 10 × 104 km2 are adopted as thresholds, drought episodes would concentrate on a few pixels, leading to weak spatial connections between events. Additionally, to further focus on the temporal coherence of events, it was argued that the events with an overlapping spatial area below 50 × 104 km2 in continuous time are incoherent. Therefore, to avoid weak spatial linkages between events, Lloyd-Hughes [75] also employed the 50 × 104 km2 proposed by Sheffield et al. [57] as the minimum area threshold to determine drought events. To make the threshold more scientific and more reasonable, Wang et al. [76] tested the sensitivity of the number of drought events to the threshold by setting different minimum areas, and finally determined 150,000 km2 as the minimum area threshold to study the evolution of drought events in China. On this basis, Xu et al. [77] adopted 10 × 104 km2, which is 2/3 of the threshold suggested by Wang et al. [76], as the minimum area threshold, considering that the area of the non-arid zone accounts for about 2/3 of the territory of China. Therefore, to determine scientifically and accurately the minimum heatwave thresholds in this study, a sensitivity analysis is necessary.
As shown in Figure 17a, the total number of heatwave events decreased from 33,001 to 18,743 in the 1979–2018 period, when the minimum area threshold was increased from 10 to 50 grid points. It is noteworthy to mention that the change slope in the number of heatwave events becomes gradually stable when the minimum area threshold exceeds 40 pixels. The variation in the frequency of heatwave events for each year from 1979 to 2018 at different thresholds is plotted in Figure 17b. It can be clearly seen that the frequency difference of heatwave events is gradually getting smaller as the thresholds increase from 10 to 50 pixels. In particular, the annual heatwave event frequency tends to stabilize at a threshold exceeding 40 pixels. Similarly, we drew the same conclusion when analyzing the changes in the frequency of heatwave events under different area thresholds. Therefore, in this study, the minimum overlapping area threshold was set to 40 grid points, with a spatial resolution of 0.1° × 0.1°.

4.3. Perspectives on Comprehensive Indicator of Heatwave Event Severity

Previous research [42,78,79,80] has mostly categorized extreme occurrences based on their severity, duration, and region of influence. Due to the influence of boundary points on the intensity of heatwave events, the intensity of heatwave events with extended durations and vast effect areas is not always apparent. This study, therefore, proposed the concept of the strongest central indicator. Although a better categorization of heatwave occurrences than prior research, the intensity of heatwave events is still evaluated independently depending on each of these indications, which may cause complications. This is because a study with isolated indicators does not adequately characterize the history of heatwave occurrences, hence limiting our ability to measure the intensity of heatwaves and comprehend their dynamic evolution. In future research, the relationship between intensity, duration, and influence area can be investigated further, and a comprehensive index or joint distribution function can be identified as a new metric to evaluate the severity of heatwave events, which can characterize the multidimensional joint heatwave hazard.
Using 2016 as an example, a simple linear correlation, as shown below, illustrates the relationship between the severity, length, and influence area of heatwave events in China (Table 6). It should be highlighted that the scenario shown here is merely a summary of this concept. However, additional trials are needed to determine their relationship, which would be our next step. The correlation coefficients between intensity, duration, and influence area were 0.59 and 0.40, respectively, and the correlation coefficient between duration and influence area was 0.60, all of which passed the 0.01 significance test. Consequently, incidents with a greater influence area are likely to be accompanied by higher intensities and longer durations, and it may be extrapolated that there will be a highly probable joint distribution or an indication that more accurately reflects the severity of heatwave events.

5. Conclusions

The following is a summary of the major findings of the present study:
The distribution of heatwave events through time shows that shorter heatwaves occur more frequently. Among the seven geographic subregions, XJ and SC have the highest frequency of heatwave events, while the NE has the lowest frequency, with the exception of the QTP region, where heatwave events are less likely to occur. In terms of change rate, the growth in the SW and SC is more pronounced. In locations with a short duration and high frequency of heatwave events, the frequency of heatwave events with a longer durations is anticipated to be comparatively greater. Except for the QTP, the frequency of heatwave incidents of varied durations in China exhibited a general upward trend. It can be inferred that heatwave events tend to occur in the desert (e.g., XJ) but are rare in the mountains (e.g., the QTP).
Both the intensity and the central intensity of heatwave events exhibited an upward trend, and grew with an increasing duration. In terms of spatial distribution, the annual average intensity of heatwave occurrences was greatest in XJ, and the rate of growth was fastest in XJ and SC. Among the seven subregions, XJ has the highest cumulative influence area, while SC has the fastest-growing cumulative impact area. The annual average duration of heatwaves exhibits a general upward tendency. In terms of regional variations, heatwaves in the southern parts of China typically linger longer than those in the north. Among the seven subregions, SC and XJ are more susceptible to heatwaves with longer durations, but the SW and SC are the regions with the most rapid length increase.
By analyzing the top 10 heatwave events with the longest duration and the largest influence area, respectively, the results indicate that SC is a high-occurrence region for heatwave events with a longer duration and larger influence area among the seven subregions, and the frequency of heatwave events has also increased over time. In addition, the evolutionary characteristics of a typical heatwave event with a long duration indicate a certain correlation between its intensity and influence area.

Author Contributions

Conceptualization, Y.R. and J.L.; methodology, Y.R. and J.L.; software, J.L. and T.Z.; validation, Y.R., J.L., and T.Z.; formal analysis, Y.R. and J.L.; investigation, Y.R. and T.Z.; resources, J.L.; data curation, J.L.; writing—original draft preparation, Y.R., J.L., and T.Z.; writing—review and editing, Y.R., J.L., M.J.S., T.L., P.W., A.A., H.G., H.T., and T.W.; supervision, J.L. and T.L. All authors have read and agreed to the published version of the manuscript.

Funding

This research was jointly funded by K.C. Wong Education Foundation under Grant Number GJTD-2020-14, The Belt and Road Special Foundation of the State Key Laboratory of Hydrology-Water Resources and Hydraulic Engineering under Grant Number 2021491411, the Key Program of National Natural Science Foundation of China under Grant Number 42230708, and The Third Integrated Scientific Expedition Project in Xinjiang under Grant Number 2021xjkk070104.

Institutional Review Board Statement

Not applicable.

Informed Consent Statement

Not applicable.

Data Availability Statement

The data presented in this study are available on request from the corresponding author.

Acknowledgments

The authors would like to thank the National Meteorological Information Center (NMIC) and the National Tibetan Plateau/Third Pole Environment Data Center (TPDC) for providing support with the observational and assimilative data. Also, we would like to thank the anonymous reviewers for their useful feedback that improved this paper.

Conflicts of Interest

The authors declare no conflict of interest.

Appendix A

Table A1. All acronyms and corresponding full names presented in this study.
ClassificationAcronymFull Name
SubregionsXJXinjiang
QTPQinghai–Tibetan Plateau
NWNorthwest
NENortheast
NCNorthern China
SWSouthwest
SCSouthern China
Climate variablesMAXTMaximum temperature
SHSpecific Humidity
Heatwave parametersHWIHeatwave index
Program/MissionTRMMTropical Rainfall Monitoring Mission
GLDASGlobal Land Data Assimilation System
MethodIADIntensity–Area–Duration
TPSThin Plate Spline
MKMann–Kendall
OrganizationCMAChina Meteorological Administration
TPDCNational Tibetan Plateau/Third Pole Environment Data Center
NMICNational Meteorological Information Center
WMOWorld Meteorological Organization
IPCCIntergovernmental Panel on Climate Change

References

  1. Sutton, R.T.; Hawkins, E. ESD Ideas: Global climate response scenarios for IPCC AR6. Earth Syst. Dyn. Discuss 2020, 2020, 1–4. [Google Scholar]
  2. Allen, M.; Antwi-Agyei, P.; Aragon-Durand, F.; Babiker, M.; Bertoldi, P.; Bind, M.; Brown, S.; Buckeridge, M.; Camilloni, I.; Cartwright, A. Technical Summary: Global Warming of 1.5 °C. An IPCC Special Report on the Impacts of Global Warming of 1.5 °C above Pre-Industrial Levels and Related Global Greenhouse Gas Emission Pathways, in the Context of Strengthening the Global Response to the Threat of Climate Change, Sustainable Development, and Efforts to Eradicate Poverty; Intergovernmental Panel on Climate Change: Geneva, Switzerland, 2019. [Google Scholar]
  3. Wen, S.; Wang, Y.; Su, B.; Gao, C.; Chen, X.; Jiang, T.; Tao, H.; Fischer, T.; Wang, G.; Zhai, J. Estimation of economic losses from tropical cyclones in China at 1.5 °C and 2.0 °C warming using the regional climate model COSMO-CLM. Int. J. Climatol. 2019, 39, 724–737. [Google Scholar] [CrossRef]
  4. Nicholls, Z.; Meinshausen, M.; Lewis, J.; Smith, C.J.; Forster, P.; Fuglestvedt, J.S.; Rogelj, J.; Kikstra, J.; Riahi, K.; Byers, E. Changes in IPCC scenario assessment emulators between SR1.5 and AR6 unraveled. Geophys. Res. Lett. 2022, 49, e2022GL099788. [Google Scholar] [CrossRef] [PubMed]
  5. Rahmstorf, S.; Coumou, D. Increase of extreme events in a warming world. Proc. Natl. Acad. Sci. USA 2011, 108, 17905–17909. [Google Scholar] [CrossRef] [PubMed] [Green Version]
  6. Chen, Y.; Liao, Z.; Shi, Y.; Tian, Y.; Zhai, P. Detectable increases in sequential flood-heatwave events across China during 1961–2018. Geophys. Res. Lett. 2021, 48, e2021GL092549. [Google Scholar] [CrossRef]
  7. Tan, J.; Zheng, Y.; Tang, X.; Guo, C.; Li, L.; Song, G.; Zhen, X.; Yuan, D.; Kalkstein, A.J.; Li, F. The urban heat island and its impact on heat waves and human health in Shanghai. Int. J. Biometeorol. 2010, 54, 75–84. [Google Scholar] [CrossRef]
  8. Russo, S.; Sillmann, J.; Sterl, A. Humid heat waves at different warming levels. Sci. Rep. 2017, 7, 7477. [Google Scholar] [CrossRef] [Green Version]
  9. Adnan, M.S.G.; Dewan, A.; Botje, D.; Shahid, S.; Hassan, Q.K. Vulnerability of Australia to heatwaves: A systematic review on influencing factors, impacts, and mitigation options. Environ. Res. 2022, 213, 113703. [Google Scholar] [CrossRef]
  10. Smoyer-Tomic, K.E.; Kuhn, R.; Hudson, A. Heat Wave Hazards: An Overview of Heat Wave Impacts in Canada. Nat. Hazards 2003, 28, 465–486. [Google Scholar] [CrossRef]
  11. Zhan, Q.; Teurlincx, S.; van Herpen, F.; Raman, N.V.; Lürling, M.; Waajen, G.; de Senerpont Domis, L.N. Towards climate-robust water quality management: Testing the efficacy of different eutrophication control measures during a heatwave in an urban canal. Sci. Total Environ. 2022, 828, 154421. [Google Scholar] [CrossRef]
  12. García-Herrera, R.; Díaz, J.; Trigo, R.M.; Luterbacher, J.; Fischer, E.M. A review of the European summer heat wave of 2003. Crit. Rev. Environ. Sci. Technol. 2010, 40, 267–306. [Google Scholar] [CrossRef]
  13. Ye, L.; Shi, K.; Xin, Z.; Wang, C.; Zhang, C. Compound droughts and heat waves in China. Sustainability 2019, 11, 3270. [Google Scholar] [CrossRef] [Green Version]
  14. Rodrigues, R.R.; Taschetto, A.S.; Sen Gupta, A.; Foltz, G.R. Common cause for severe droughts in South America and marine heatwaves in the South Atlantic. Nat. Geosci. 2019, 12, 620–626. [Google Scholar] [CrossRef]
  15. Kovats, S.; Akhtar, R. Climate, climate change and human health in Asian cities. Environ. Urban. 2008, 20, 165–175. [Google Scholar] [CrossRef]
  16. Robine, J.-M.; Cheung, S.L.K.; Le Roy, S.; Van Oyen, H.; Griffiths, C.; Michel, J.-P.; Herrmann, F.R. Death toll exceeded 70,000 in Europe during the summer of 2003. Comptes Rendus Biol. 2008, 331, 171–178. [Google Scholar] [CrossRef]
  17. Guha-Sapir, D.; Hoyois, P.; Below, R. Annual Disaster Statistical Review 2011: The Numbers and Trends; Centre for REsearch on the Epidemiology of Disasters (CRED), Institute of Health and Society (IRSS) and Université catholique de Louvain: Louvain-la-neuve, Belgium, 2012. [Google Scholar]
  18. Mora, C.; Dousset, B.; Caldwell, I.R.; Powell, F.E.; Geronimo, R.C.; Bielecki, C.R.; Counsell, C.W.; Dietrich, B.S.; Johnston, E.T.; Louis, L.V. Global risk of deadly heat. Nat. Clim. Change 2017, 7, 501–506. [Google Scholar] [CrossRef] [Green Version]
  19. Conti, A.; Valente, M.; Paganini, M.; Farsoni, M.; Ragazzoni, L.; Barone-Adesi, F. Knowledge gaps and research priorities on the health effects of heatwaves: A systematic review of reviews. Int. J. Environ. Res. Public Health 2022, 19, 5887. [Google Scholar] [CrossRef]
  20. Dwyer, I.J.; Barry, S.J.; Megiddo, I.; White, C.J. Evaluations of heat action plans for reducing the health impacts of extreme heat: Methodological developments (2012–2021) and remaining challenges. Int. J. Biometeorol. 2022, 66, 1915–1927. [Google Scholar] [CrossRef]
  21. Meehl, G.A.; Tebaldi, C. More Intense, More Frequent, and Longer Lasting Heat Waves in the 21st Century. Science 2004, 305, 994–997. [Google Scholar] [CrossRef] [Green Version]
  22. Fischer, E.M.; Schär, C. Consistent geographical patterns of changes in high-impact European heatwaves. Nat. Geosci. 2010, 3, 398–403. [Google Scholar] [CrossRef]
  23. Vautard, R.; Gobiet, A.; Jacob, D.; Belda, M.; Colette, A.; Déqué, M.; Fernández, J.; García-Díez, M.; Goergen, K.; Güttler, I.; et al. The simulation of European heat waves from an ensemble of regional climate models within the EURO-CORDEX project. Clim. Dyn. 2013, 41, 2555–2575. [Google Scholar] [CrossRef]
  24. Schoetter, R.; Cattiaux, J.; Douville, H. Changes of western European heat wave characteristics projected by the CMIP5 ensemble. Clim. Dyn. 2015, 45, 1601–1616. [Google Scholar] [CrossRef]
  25. Russo, S.; Dosio, A.; Graversen, R.G.; Sillmann, J.; Carrao, H.; Dunbar, M.B.; Singleton, A.; Montagna, P.; Barbola, P.; Vogt, J.V. Magnitude of extreme heat waves in present climate and their projection in a warming world. J. Geophys. Res. Atmos. 2014, 119, 12500–12512. [Google Scholar] [CrossRef] [Green Version]
  26. Stefanon, M.; D’Andrea, F.; Drobinski, P. Heatwave classification over Europe and the Mediterranean region. Environ. Res. Lett. 2012, 7, 014023. [Google Scholar] [CrossRef]
  27. Hoerling, M.; Kumar, A.; Dole, R.; Nielsen-Gammon, J.W.; Eischeid, J.; Perlwitz, J.; Quan, X.-W.; Zhang, T.; Pegion, P.; Chen, M. Anatomy of an Extreme Event. J. Clim. 2013, 26, 2811–2832. [Google Scholar] [CrossRef]
  28. Diffenbaugh, N.S. Sensitivity of extreme climate events to CO2-induced biophysical atmosphere-vegetation feedbacks in the western United States. Geophys. Res. Lett. 2005, 320, 99–119. [Google Scholar] [CrossRef]
  29. Diffenbaugh, N.S.; Pal, J.S.; Trapp, R.J.; Giorgi, F. Fine-scale processes regulate the response of extreme events to global climate change. Proc. Natl. Acad. Sci. USA 2005, 102, 15774–15778. [Google Scholar] [CrossRef] [Green Version]
  30. Della-Marta, P.M.; Haylock, M.R.; Luterbacher, J.; Wanner, H. Doubled length of western European summer heat waves since 1880. J. Geophys. Res. Atmos. 2007, 112, D15103. [Google Scholar] [CrossRef] [Green Version]
  31. Coumou, D.; Rahmstorf, S. A decade of weather extremes. Nat. Clim. Chang. 2012, 2, 491–496. [Google Scholar] [CrossRef]
  32. Huang, Z.; Chen, H.; Tian, H. Research on the Heat Wave Index. Meteorol. Mon. 2011, 37, 345–351. [Google Scholar]
  33. Liu, J.; Ren, Y.; Tao, H.; Shalamzari, M.J. Spatial and Temporal Variation Characteristics of Heatwaves in Recent Decades over China. Remote Sens. 2021, 13, 3824. [Google Scholar] [CrossRef]
  34. Jiang, T.; Wang, Y.; Zhai, J.; Cao, L.; Su, B.; Wang, G.; Zeng, G.; Gao, C.; Xiong, M.; Li, X.; et al. Study on the Risk of Socio-economic Impacts of Extreme Climate Events: Theory, Methodology and Practice. Yuejiang Acad. J. 2018, 10, 90–105,147. [Google Scholar] [CrossRef]
  35. Ren, F.; Gao, H.; Liu, L.; Song, Y.; Gao, R.; Wang, Z.; Gong, Z.; Wang, Y.; Chen, L.; Li, Q.; et al. Research Progresses on Extreme Weather and Climate Events and Their Operational Applications in Climate Monitoring Prediction. Meteorol. Mon. 2014, 40, 860–874. [Google Scholar]
  36. Ren, F.; Cui, D.; Gong, Z.; Wang, Y.; Zou, X.; Li, Y.; Wang, S.; Wang, X. An Objective Identification Technique for Regional Extreme Events. J. Clim. 2012, 25, 7015–7027. [Google Scholar] [CrossRef]
  37. Gong, Z.; Wang, X.; Cui, D.; Wang, Y.; Ren, F.; Feng, G.; Zhang, Q.; Zou, X.; Wang, X. The Identification and Changing Characteristics of Regional Low Temperature Extreme Events. J. Appl. Meteorol. Sci. 2012, 23, 195–204. [Google Scholar]
  38. Wang, X.-J.; Gong, Z.-Q.; Ren, F.-M.; Feng, G.-L. Spatial-Temporal Characteristics of Regional Extreme Low Temperature Events in China during 1960–2009. Adv. Clim. Chang. Res. 2012, 3, 186–194. [Google Scholar] [CrossRef]
  39. Min, S.; Qian, Y.-F. Regionality and persistence of extreme precipitation events in China. Adv. Water Sci. 2008, 19, 765–771. [Google Scholar]
  40. Huang, D.; Qian, Y. The analysis method of regional characteristics of extreme temperature and its results. J. Nanjing Univ. (Nat. Sci.) 2009, 45, 715–723. [Google Scholar]
  41. Kai, T.; Zhong-Wei, Y.; Yi, W. A spatial cluster analysis of heavy rains in China. Atmos. Ocean. Sci. Lett. 2011, 4, 36–40. [Google Scholar] [CrossRef]
  42. Zhai, J.; Huang, J.; Su, B.; Cao, L.; Wang, Y.; Jiang, T.; Fischer, T. Intensity–area–duration analysis of droughts in China 1960–2013. Clim. Dyn. 2017, 48, 151–168. [Google Scholar] [CrossRef]
  43. Lü, Y.; Jiang, T.; Tao, H.; Zhai, J.; Wang, Y. Spatial-temporal patterns of population exposed to the extreme maximum temperature events in the Belt and Road regions. Sci. Technol. Rev. 2020, 38, 68–79. [Google Scholar]
  44. Jing, C.; Jiang, T.; Wang, Y.; Chen, J.; Jian, D.; Luo, L.; Buda, S. A study on regional extreme precipitation events and the exposure of population and economy in China. Acta Meteorol. Sin. 2016, 74, 572–582. [Google Scholar]
  45. Hou, Y. Evaluation of Utility and Disutility of China’s Economic Growth Based on Genuine Progress Indicator 2.0. Available online: https://papers.ssrn.com/sol3/papers.cfm?abstract_id=4265306 (accessed on 18 January 2023).
  46. Cai, W.; Zhang, C.; Suen, H.P.; Ai, S.; Bai, Y.; Bao, J.; Chen, B.; Cheng, L.; Cui, X.; Dai, H. The 2020 China report of the Lancet Countdown on health and climate change. Lancet Public Health 2021, 6, e64–e81. [Google Scholar] [CrossRef] [PubMed]
  47. Zhi, G.; Meng, B.; Wang, J.; Chen, S.; Tian, B.; Ji, H.; Yang, T.; Wang, B.; Liu, J. Spatial Analysis of Urban Residential Sensitivity to Heatwave Events: Case Studies in Five Megacities in China. Remote Sens. 2021, 13, 4086. [Google Scholar] [CrossRef]
  48. Liu, J.; Zhang, W.; Liu, T.; Li, Q. Runoff Dynamics and Associated Multi-Scale Responses to Climate Changes in the Middle Reach of the Yarlung Zangbo River Basin, China. Water 2018, 10, 295. [Google Scholar] [CrossRef] [Green Version]
  49. He, J.; Yang, K.; Tang, W.; Lu, H.; Qin, J.; Chen, Y.; Li, X. The first high-resolution meteorological forcing dataset for land process studies over China. Sci. Data 2020, 7, 25. [Google Scholar] [CrossRef] [Green Version]
  50. Kun, Y.; Jie, H. China Meteorological Forcing Dataset (1979–2018); National Tibetan Plateau Data Center: Beijing, China, 2019. [Google Scholar] [CrossRef]
  51. Yang, K.; He, J.; Tang, W.; Qin, J.; Cheng, C.C.K. On downward shortwave and longwave radiations over high altitude regions: Observation and modeling in the Tibetan Plateau. Agric. For. Meteorol. 2010, 150, 38–46. [Google Scholar] [CrossRef]
  52. Dai, A.; Rasmussen, R.M.; Liu, C.; Ikeda, K.; Prein, A.F. A new mechanism for warm-season precipitation response to global warming based on convection-permitting simulations. Clim. Dyn. 2020, 55, 343–368. [Google Scholar] [CrossRef]
  53. Kholodovsky, V.; Liang, X.Z. A generalized Spatio-Temporal Threshold Clustering method for identification of extreme event patterns. Adv. Stat. Clim. Meteorol. Oceanogr. 2021, 7, 35–52. [Google Scholar] [CrossRef]
  54. Gouveia, C.M.; Martins, J.P.A.; Russo, A.; Durão, R.; Trigo, I.F. Monitoring Heat Extremes across Central Europe Using Land Surface Temperature Data Records from SEVIRI/MSG. Remote Sens. 2022, 14, 3470. [Google Scholar] [CrossRef]
  55. Cook, B.I.; Smerdon, J.E.; Seager, R.; Cook, E.R. Pan-Continental Droughts in North America over the Last Millennium. J. Clim. 2014, 27, 383–397. [Google Scholar] [CrossRef] [Green Version]
  56. Dracup, J.A.; Lee, K.S.; Paulson, E.G., Jr. On the definition of droughts. Water Resour. Res. 1980, 16, 297–302. [Google Scholar] [CrossRef]
  57. Sheffield, J.; Andreadis, K.; Wood, E.; Lettenmaier, D. Global and continental drought in the second half of the twentieth century: Severity–area–duration analysis and temporal variability of large-scale events. J. Clim. 2009, 22, 1962–1981. [Google Scholar] [CrossRef]
  58. Wang, A.; Wang, Y.; Su, B.; Kundzewicz, Z.W.; Tao, H.; Wen, S.; Qin, J.; Gong, Y.; Jiang, T. Comparison of Changing Population Exposure to Droughts in River Basins of the Tarim and the Indus. Earth's Future 2020, 8, e2019EF001448. [Google Scholar] [CrossRef] [Green Version]
  59. Basarir, A.; Arman, H.; Hussein, S.; Murad, A.; Aldahan, A.; Al-Abri, M.A. Trend Detection in Annual Temperature and Precipitation Using Mann–Kendall Test—A Case Study to Assess Climate Change in Abu Dhabi; United Arab Emirates: Cham, Switzerland, 2018; pp. 3–12. [Google Scholar]
  60. Bihrat, Ö.; Bayazit, M. The power of statistical tests for trend detection. Turk. J. Eng. Environ. Sci. 2003, 27, 247–251. [Google Scholar]
  61. Oven, K.J.; Curtis, S.E.; Reaney, S.; Riva, M.; Stewart, M.G.; Ohlemüller, R.; Dunn, C.E.; Nodwell, S.; Dominelli, L.; Holden, R. Climate change and health and social care: Defining future hazard, vulnerability and risk for infrastructure systems supporting older people’s health care in England. Appl. Geogr. 2012, 33, 16–24. [Google Scholar] [CrossRef]
  62. Alonso, L.; Renard, F. A comparative study of the physiological and socio-economic vulnerabilities to heat waves of the population of the Metropolis of Lyon (France) in a climate change context. Int. J. Environ. Res. Public Health 2020, 17, 1004. [Google Scholar] [CrossRef] [Green Version]
  63. Nori-Sarma, A.; Benmarhnia, T.; Rajiva, A.; Azhar, G.S.; Gupta, P.; Pednekar, M.S.; Bell, M.L. Advancing our understanding of heat wave criteria and associated health impacts to improve heat wave alerts in developing country settings. Int. J. Environ. Res. Public Health 2019, 16, 2089. [Google Scholar] [CrossRef] [Green Version]
  64. Heo, S.; Bell, M.L.; Lee, J.-T. Comparison of health risks by heat wave definition: Applicability of wet-bulb globe temperature for heat wave criteria. Environ. Res. 2019, 168, 158–170. [Google Scholar] [CrossRef]
  65. Yin, Q.; Wang, J. The association between consecutive days’ heat wave and cardiovascular disease mortality in Beijing, China. BMC Public Health 2017, 17, 223. [Google Scholar] [CrossRef] [Green Version]
  66. Sánchez, E.; Gallardo, C.; Gaertner, M.; Arribas, A.; Castro, M. Future climate extreme events in the Mediterranean simulated by a regional climate model: A first approach. Glob. Planet. Chang. 2004, 44, 163–180. [Google Scholar] [CrossRef]
  67. Jendritzky, G.; de Dear, R.; Havenith, G. UTCI—Why another thermal index? Int. J. Biometeorol. 2012, 56, 421–428. [Google Scholar] [CrossRef] [Green Version]
  68. He, S.; Kosatsky, T.; Smargiassi, A.; Bilodeau-Bertrand, M.; Auger, N. Heat and pregnancy-related emergencies: Risk of placental abruption during hot weather. Environ. Int. 2018, 111, 295–300. [Google Scholar] [CrossRef] [PubMed]
  69. Liu, J.-M.; Ai, S.-Q.; Qi, J.-L.; Wang, L.-J.; Zhou, M.-G.; Wang, C.-J.; Yin, P.; Lin, H.-L. Defining region-specific heatwave in China based on a novel concept of “avoidable mortality for each temperature unit decrease”. Adv. Clim. Chang. Res. 2021, 12, 611–618. [Google Scholar] [CrossRef]
  70. Rita, A.; Camarero, J.J.; Nolè, A.; Borghetti, M.; Brunetti, M.; Pergola, N.; Serio, C.; Vicente-Serrano, S.M.; Tramutoli, V.; Ripullone, F. The impact of drought spells on forests depends on site conditions: The case of 2017 summer heat wave in southern Europe. Glob. Chang. Biol. 2020, 26, 851–863. [Google Scholar] [CrossRef]
  71. Yoon, D.; Cha, D.H.; Lee, G.; Park, C.; Lee, M.I.; Min, K.H. Impacts of synoptic and local factors on heat wave events over southeastern region of Korea in 2015. J. Geophys. Res. Atmos. 2018, 123, 12081–12096. [Google Scholar] [CrossRef]
  72. Rummukainen, M. Changes in climate and weather extremes in the 21st century. Wiley Interdiscip. Rev. Clim. Chang. 2012, 3, 115–129. [Google Scholar] [CrossRef]
  73. Ren, Y.; Liu, J.; Shalamzari, M.J.; Arshad, A.; Liu, S.; Liu, T.; Tao, H. Monitoring Recent Changes in Drought and Wetness in the Source Region of the Yellow River Basin, China. Water 2022, 14, 861. [Google Scholar] [CrossRef]
  74. Andreadis, K.M.; Clark, E.A.; Wood, A.W.; Hamlet, A.F.; Lettenmaier, D.P. Twentieth-century drought in the conterminous United States. J. Hydrometeorol. 2005, 6, 985–1001. [Google Scholar] [CrossRef]
  75. Lloyd-Hughes, B. A spatio-temporal structure-based approach to drought characterisation. Int. J. Climatol. 2012, 32, 406–418. [Google Scholar] [CrossRef] [Green Version]
  76. Wang, A.; Lettenmaier, D.P.; Sheffield, J. Soil Moisture Drought in China, 1950–2006. J. Clim. 2011, 24, 3257–3271. [Google Scholar] [CrossRef]
  77. Xu, K.; Yang, D.; Yang, H.; Li, Z.; Qin, Y.; Shen, Y. Spatio-temporal variation of drought in China during 1961–2012: A climatic perspective. J. Hydrol. 2015, 526, 253–264. [Google Scholar] [CrossRef]
  78. Nikolopoulos, E.; Borga, M.; Creutin, J.; Marra, F. Estimation of debris flow triggering rainfall: Influence of rain gauge density and interpolation methods. Geomorphology 2015, 243, 40–50. [Google Scholar] [CrossRef]
  79. Hallack-Alegria, M.; Watkins, D.W., Jr. Annual and warm season drought intensity–duration–frequency analysis for Sonora, Mexico. J. Clim. 2007, 20, 1897–1909. [Google Scholar] [CrossRef] [Green Version]
  80. Bonal, D.; Burban, B.; Stahl, C.; Wagner, F.; Hérault, B. The response of tropical rainforests to drought—Lessons from recent research and future prospects. Ann. For. Sci. 2016, 73, 27–44. [Google Scholar] [CrossRef] [Green Version]
Figure 1. Map of China with seven subregions, including (I) Xinjiang (XJ), (II) Qinghai–Tibetan Plateau (QTP), (III) Northwest (NW), (IV) Northeast (NE), (V) North China (NC), (VI) Southwest (SW), and (VII) South China (SC). (a) The detailed geographical location and terrain of China, (b) the location of China in the world, and (c) the spatial distribution of the maximum heatwave index (HWI) in the 1979–2018 period, where higher values indicate warmer regions.
Remotesensing 15 01369 g001
Figure 2. Schematic diagram of a regional heatwave event identification method considering temporal continuity and spatial dynamics (ad) Identification process for a single regional heatwave event; (e) The process of determining the continuity of heatwave events in time and space, which is cited from [58].
Remotesensing 15 01369 g002
Figure 3. Variations in frequency of heatwave events in the 1979–2018 period across China. Green bars represent the number of heatwave events less than the average of 150 times, while the red bars denote above 150 times; distinguished colors for lines illustrate change trends in different periods as: 1979–2018 (black), 1979–1988 (blue), 1989–1998 (orange), 1999–2008 (brown), and 2009–2018 (purple).
Remotesensing 15 01369 g003
Figure 4. Variations of heatwave event frequency of different durations between 1979 and 2018 across China. (a) 1–2 days, (b) 3–5 days, (c) 6–8 days, (d) 9–11 days, and (e) more than 12 days. Pies on the right side represent the percentage of individual-duration frequency to total frequency for the durations over 1979–2018, e.g., the percentage of 1-day event frequency to 1– and 2–day frequency in the 1979–2018 period is 74.3%.
Remotesensing 15 01369 g004
Figure 5. The spatial distribution of (ad) accumulated frequency of heatwave events during the period of 1979–2018 and (eh) associated Mann–Kendall (MK) analysis.
Remotesensing 15 01369 g005
Figure 6. Variations in intensity and the strongest central intensity of heatwave events in the 1979–2018 period across China. The black and gray horizontal dashed lines denote the annual mean intensity and the strongest central intensity, respectively, of heatwave events during the study period; the shadowed area in blue and red represents 95% confidence interval for the fitting line of intensity and the strongest central intensity, respectively; the vertical line in purple and green are the minimum and maximum year of intensity and the strongest central intensity.
Remotesensing 15 01369 g006
Figure 7. The intensity of heatwave events and the strongest center of intensity of different durations across China from 1979 to 2018. The pie charts beneath represent the percentage of the number of events of an individual duration to the total number of events in that stage of all durations. The outer and inner rings indicate the strongest center of intensity and event intensity, respectively, and the nearby numbers represent the average intensity value of the events for an individual duration.
Remotesensing 15 01369 g007
Figure 8. Variations in heatwave event intensity in the 1979–2018 period across China for different durations. (a) 1–2 days, (b) 3–5 days, (c) 6–8 days, (d) 9–11 days, and (e) more than 12 days. The pie charts on the right represent the percentage of individual duration frequency to total frequency for current all durations in the 1979–2018 period, and the values in brackets are the mean intensity for the corresponding duration between 1979 and 2018.
Remotesensing 15 01369 g008
Figure 9. The spatial distribution of (a) different intensities of heatwave events, (b) interannual change trend, and associated (c) Mann–Kendall statistics.
Remotesensing 15 01369 g009
Figure 10. Duration variations in cumulative influence area (CIA) of heatwave events in the 1979–2018 period across China. The orange dashed line denotes the mean CIA of heatwave events during the study period; the shadowed area in blue represents a 95% confidence interval for the fitting line of all CIAs, while the shadow in red shows the period of relatively higher durations in recent years; the vertical line in purple and green are the minimum and maximum year of CIA, respectively.
Remotesensing 15 01369 g010
Figure 11. The cumulative and average influence areas of heatwave events of different durations across China from 1979 to 2018. The pie chart on the right illustrates much more details about the percentage of the number of heatwave events of an individual duration to that of all durations.
Remotesensing 15 01369 g011
Figure 12. Duration variations of heatwave events in the 1979–2018 period across China. The orange dashed line denotes the mean duration of heatwave events during the study period; the shadowed area in blue represents a 95% confidence interval for the fitting line of all durations, while the shadow in red shows the period of relatively higher durations in recent years.
Remotesensing 15 01369 g012
Figure 13. The spatial distribution of (a) different mean durations of heatwave events, (b) interannual change trend, and associated (c) Mann–Kendall statistics during 1978–2018.
Remotesensing 15 01369 g013
Figure 14. The evolution process and comparison between intensity and influence area for the heatwave event with the longest duration.
Remotesensing 15 01369 g014
Figure 15. The dynamic variations in the strongest center location of the heatwave event with the longest duration. The number represents the i-th day of the duration.
Remotesensing 15 01369 g015
Figure 16. The temporal and spatial evolution process of the heatwave event with the longest duration. (ai) represent the distribution of heatwave events on 12 July, 16 July, 21 July, 31 July, 10 August, 20 August, 25 August, 30 August, and 5 September of 2018, respectively.
Remotesensing 15 01369 g016
Figure 17. Sensitivity test between the number of heatwave events and area thresholds. (a) Cumulative events in the 1979–2018 period and (b) heatwave events in an individual year from 1979 to 2018. It was noted that the number of heatwave events represents all individuals during the study period before judging whether they belong to the same event.
Remotesensing 15 01369 g017
Table 1. Criteria for classifying heatwave levels.
LevelClassification Criteria
Light2.8 ≤ HWI < 6.5
Moderate6.5 ≤ HWI < 10.5
SevereHWI ≥ 10.5
Table 2. The heatwave event frequency in seven regions of China in the 1979–2018 period. For the last two columns, the maximum duration and maximum influence area of the heatwave event in the region are given, and the associated onset dates of the heatwave events are listed in brackets. D and IA are the abbreviations for duration and influence area, respectively.
RegionFrequencyFrequency
(D < 6 Days)
Frequency
(D ≥ 12 Days)
Longest D
(Days)
Maximum IA
(104 km2)
XJ146312555951 (13 July 2002)263.88 (11 July 1999)
QTP5502 (25 July 2002)1.98 (25 July 2002)
NW578537549 (9 July 2010)386.35 (9 July 2010)
NE201194121 (7 July 2000)231.18 (7 July 2000)
NC6455951030 (11 June 2005)204.06 (11 June 2005)
SW9037466036 (6 August 2018)159.78 (25 July 2014)
SC223120296856 (12 July 2018)229.56 (12 July 2018)
Table 3. The cumulative influence area (CIA) of heatwave events in seven regions of China during the period of 1979–2018.
RegionXJQTPNWNENCSWSC
CIA (104 km2)16,847.135.143934.331615.905948.932799.7813,266.42
Percentage (%)37.930.018.863.6413.396.3029.87
Slope (104 km2/decade)46.7 **0.0023.5 *9.15.229.8 **86.3 **
Note: * and ** represent significance at the level of 0.05 and 0.01, respectively.
Table 4. List of top ten heatwave events ranked by duration in the 1979–2018 period in China.
NumberPeriod
(Day-Month-Year)
Duration (d)The Location of the Strongest Center
(Lon, Lat)
Influence Area (104 km2)IntensityRegion
112 July 2018–5 September 201856118.45, 30.75229.566.64SC
23 July 2013–25 August 201353117.75, 28.25200.175.90SC
313 July 2002–1 September 20025189.15, 42.7563.905.44XJ
49 July 2010–27 August 201049104.25, 41.25386.355.95NW
511 July 2017–6 August 201746118.25, 26.35221.095.36SC
61 July 2003–14 August 200344118.25, 26.35183.326.07SC
730 June 2007–13 August 200744121.45, 29.85134.455.29SC
87 July 2018–19 August 201843120.65, 21.852.767.15SC
928 July 2016–7 September 201642121.75, 24.253.117.40SC
1014 July 2014–23 August 201440120.55, 22.252.846.98SC
Table 5. List of top ten heatwave events ranked by influence area in the 1979–2018 period in China.
NumberPeriod
(Day-Month-Year)
Duration (d)Strongest Center Location
(Lon, Lat)
Influence Area (104 km2)IntensityRegion
19 July 2010–27 August 201049104.25, 41.25386.355.95NW
211 July 1999–6 August 19992692.25, 42.75263.887.14XJ
37 July 2000–27 July 200021121.25, 41.25231.186.42NE
412 July 2018–5 September 201856118.45, 30.75229.566.64SC
52 July 2017–2 August 20173188.85, 42.75221.456.99XJ
611 July 2017–26 August 201746118.25, 26.35221.095.36SC
711 June 2005–10 July 200530113.25, 35.25204.065.20NC
88 July 2002–20 July 200213116.75, 36.75203.265.36NC
93 July 2013–25 August 201353117.75, 28.25200.165.90SC
1015 July 2016–3 August 201420109.25, 19.75192.905.39SC
Table 6. The correlation between intensity, duration, and influence area.
IndicatorsIntensityDurationArea
Intensity1.000.59 **0.40 **
Duration0.59 **1.000.60 **
Area0.40 **0.60 **1.00
Note: ** represents significance at the level of 0.01.
Disclaimer/Publisher’s Note: The statements, opinions and data contained in all publications are solely those of the individual author(s) and contributor(s) and not of MDPI and/or the editor(s). MDPI and/or the editor(s) disclaim responsibility for any injury to people or property resulting from any ideas, methods, instructions or products referred to in the content.

