
Icequakes and Large Shear Wave Velocity Drop in the Kuoqionggangri Glacier of Tibetan Plateau Observed with Fiber Optic Seismometer Array

 ,
,  and
and 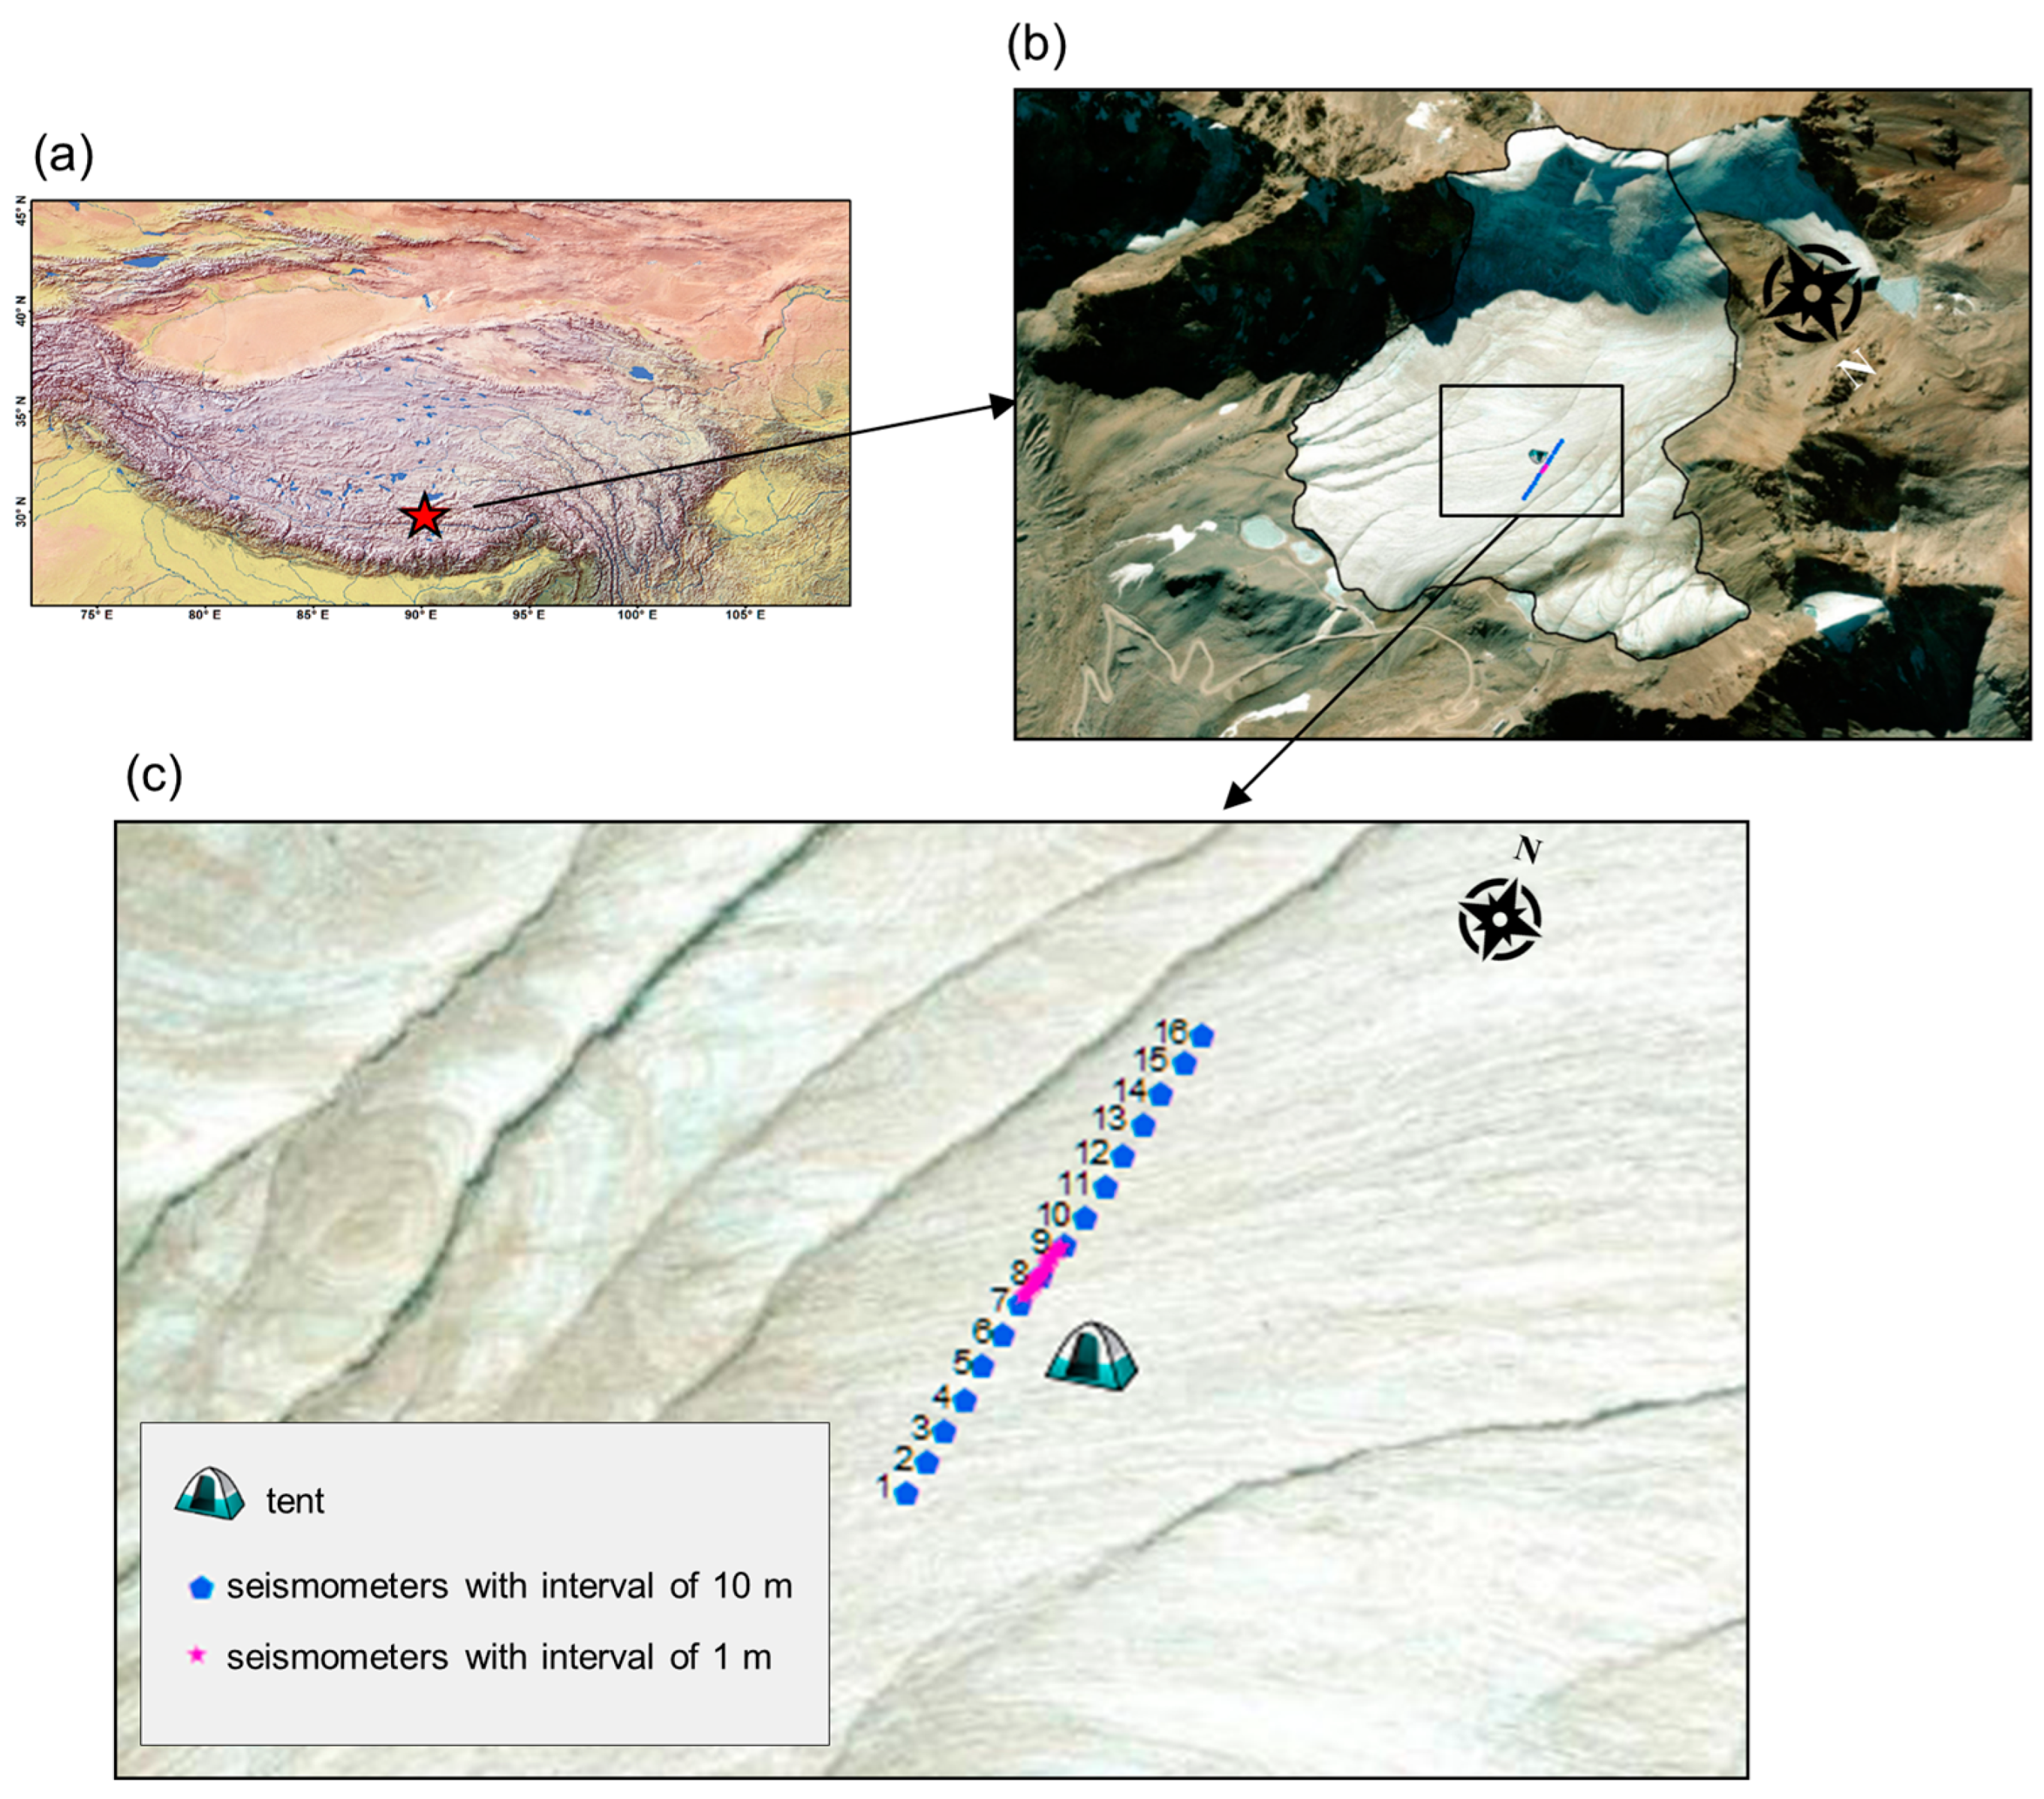
Abstract
:1. Introduction
2. Seismic Observations
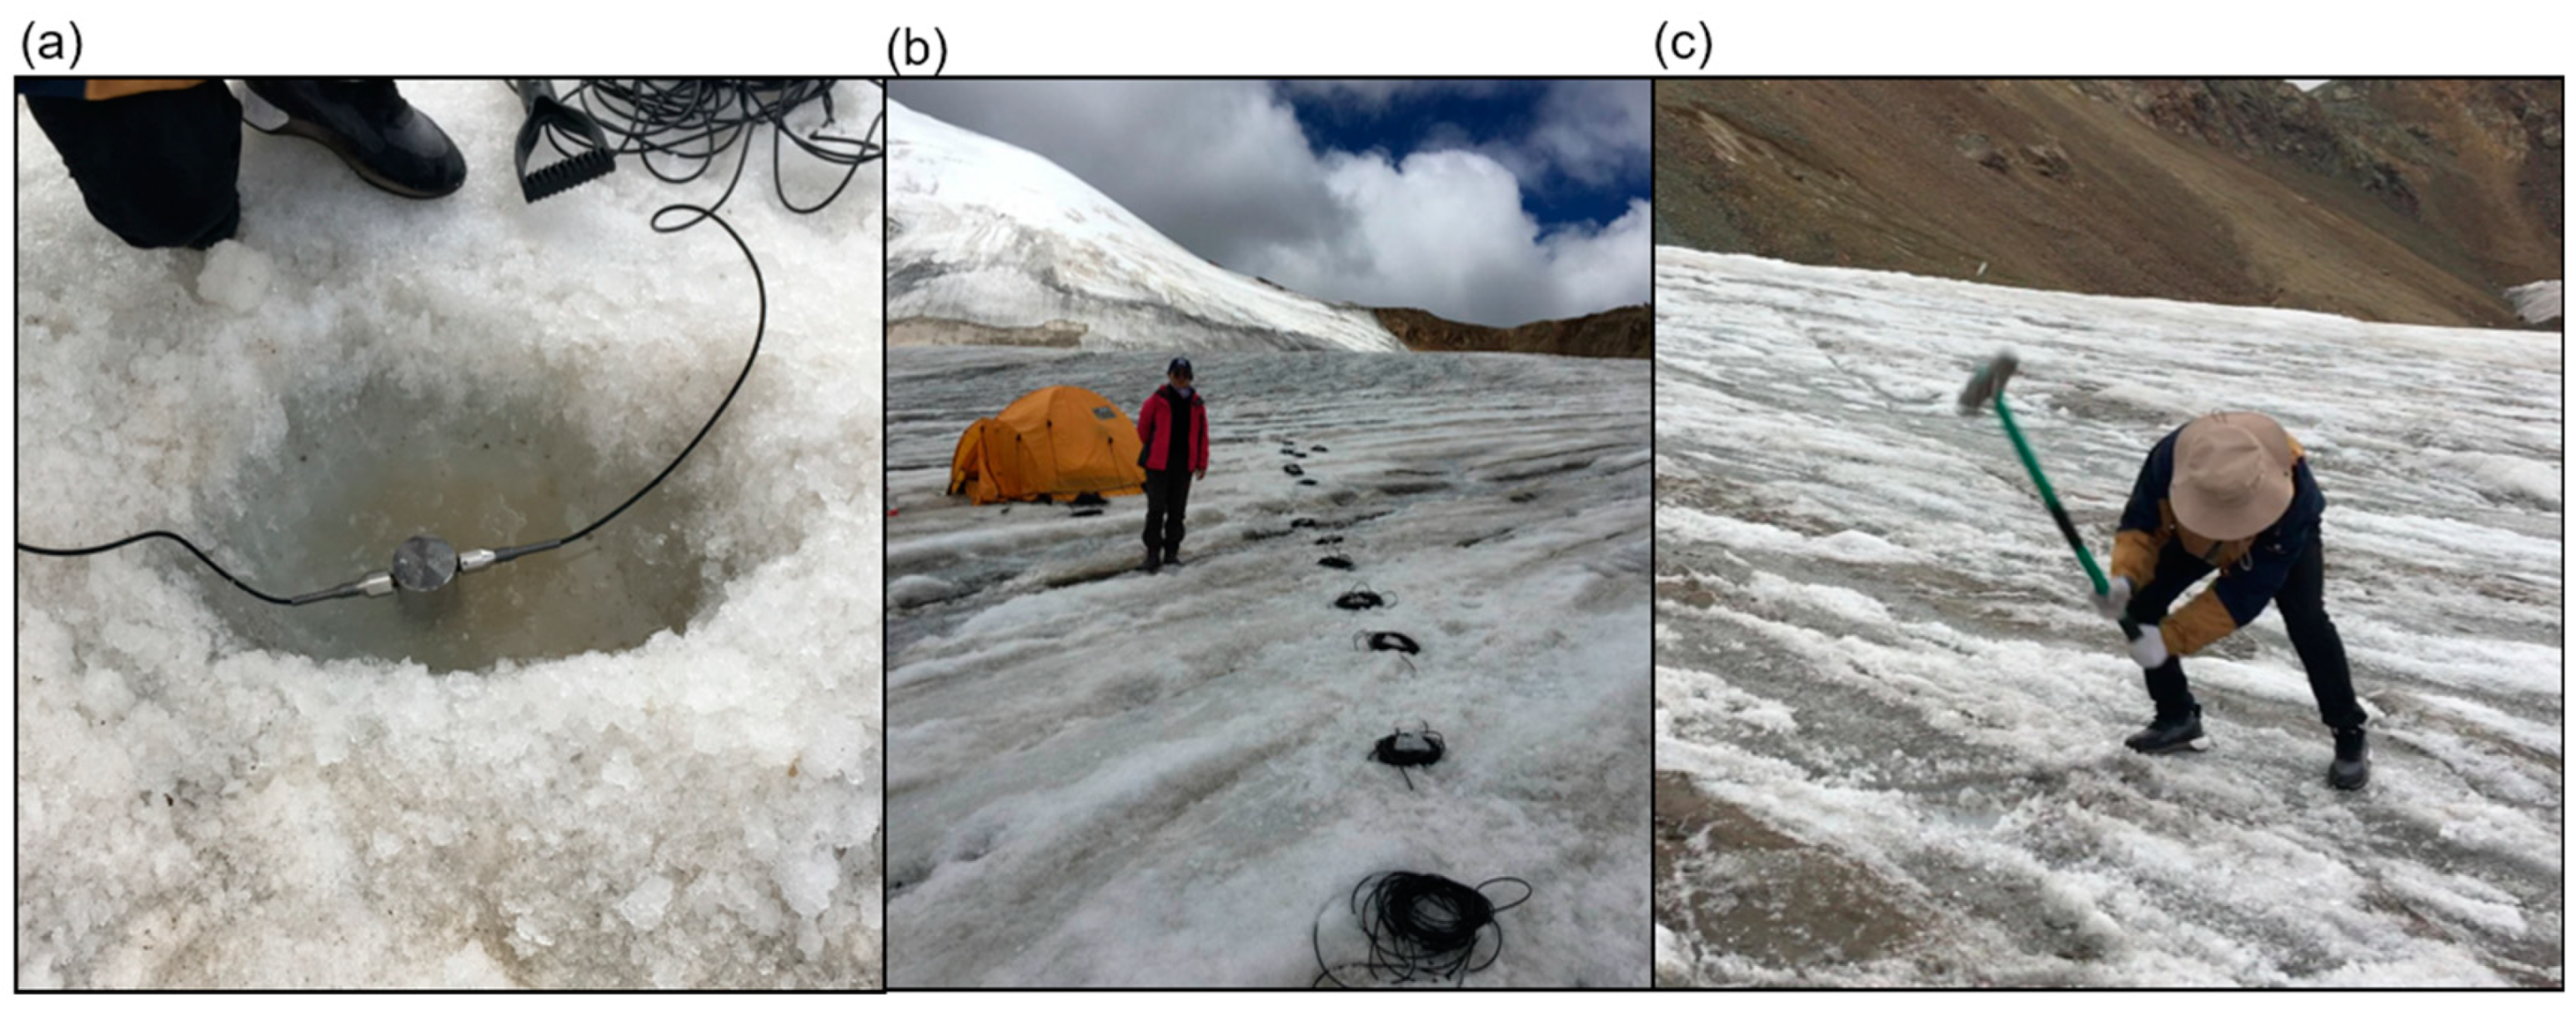
2.1. Fiber Optic Seismometer Array
2.2. Seismic Array Layout
2.3. Seismic Records
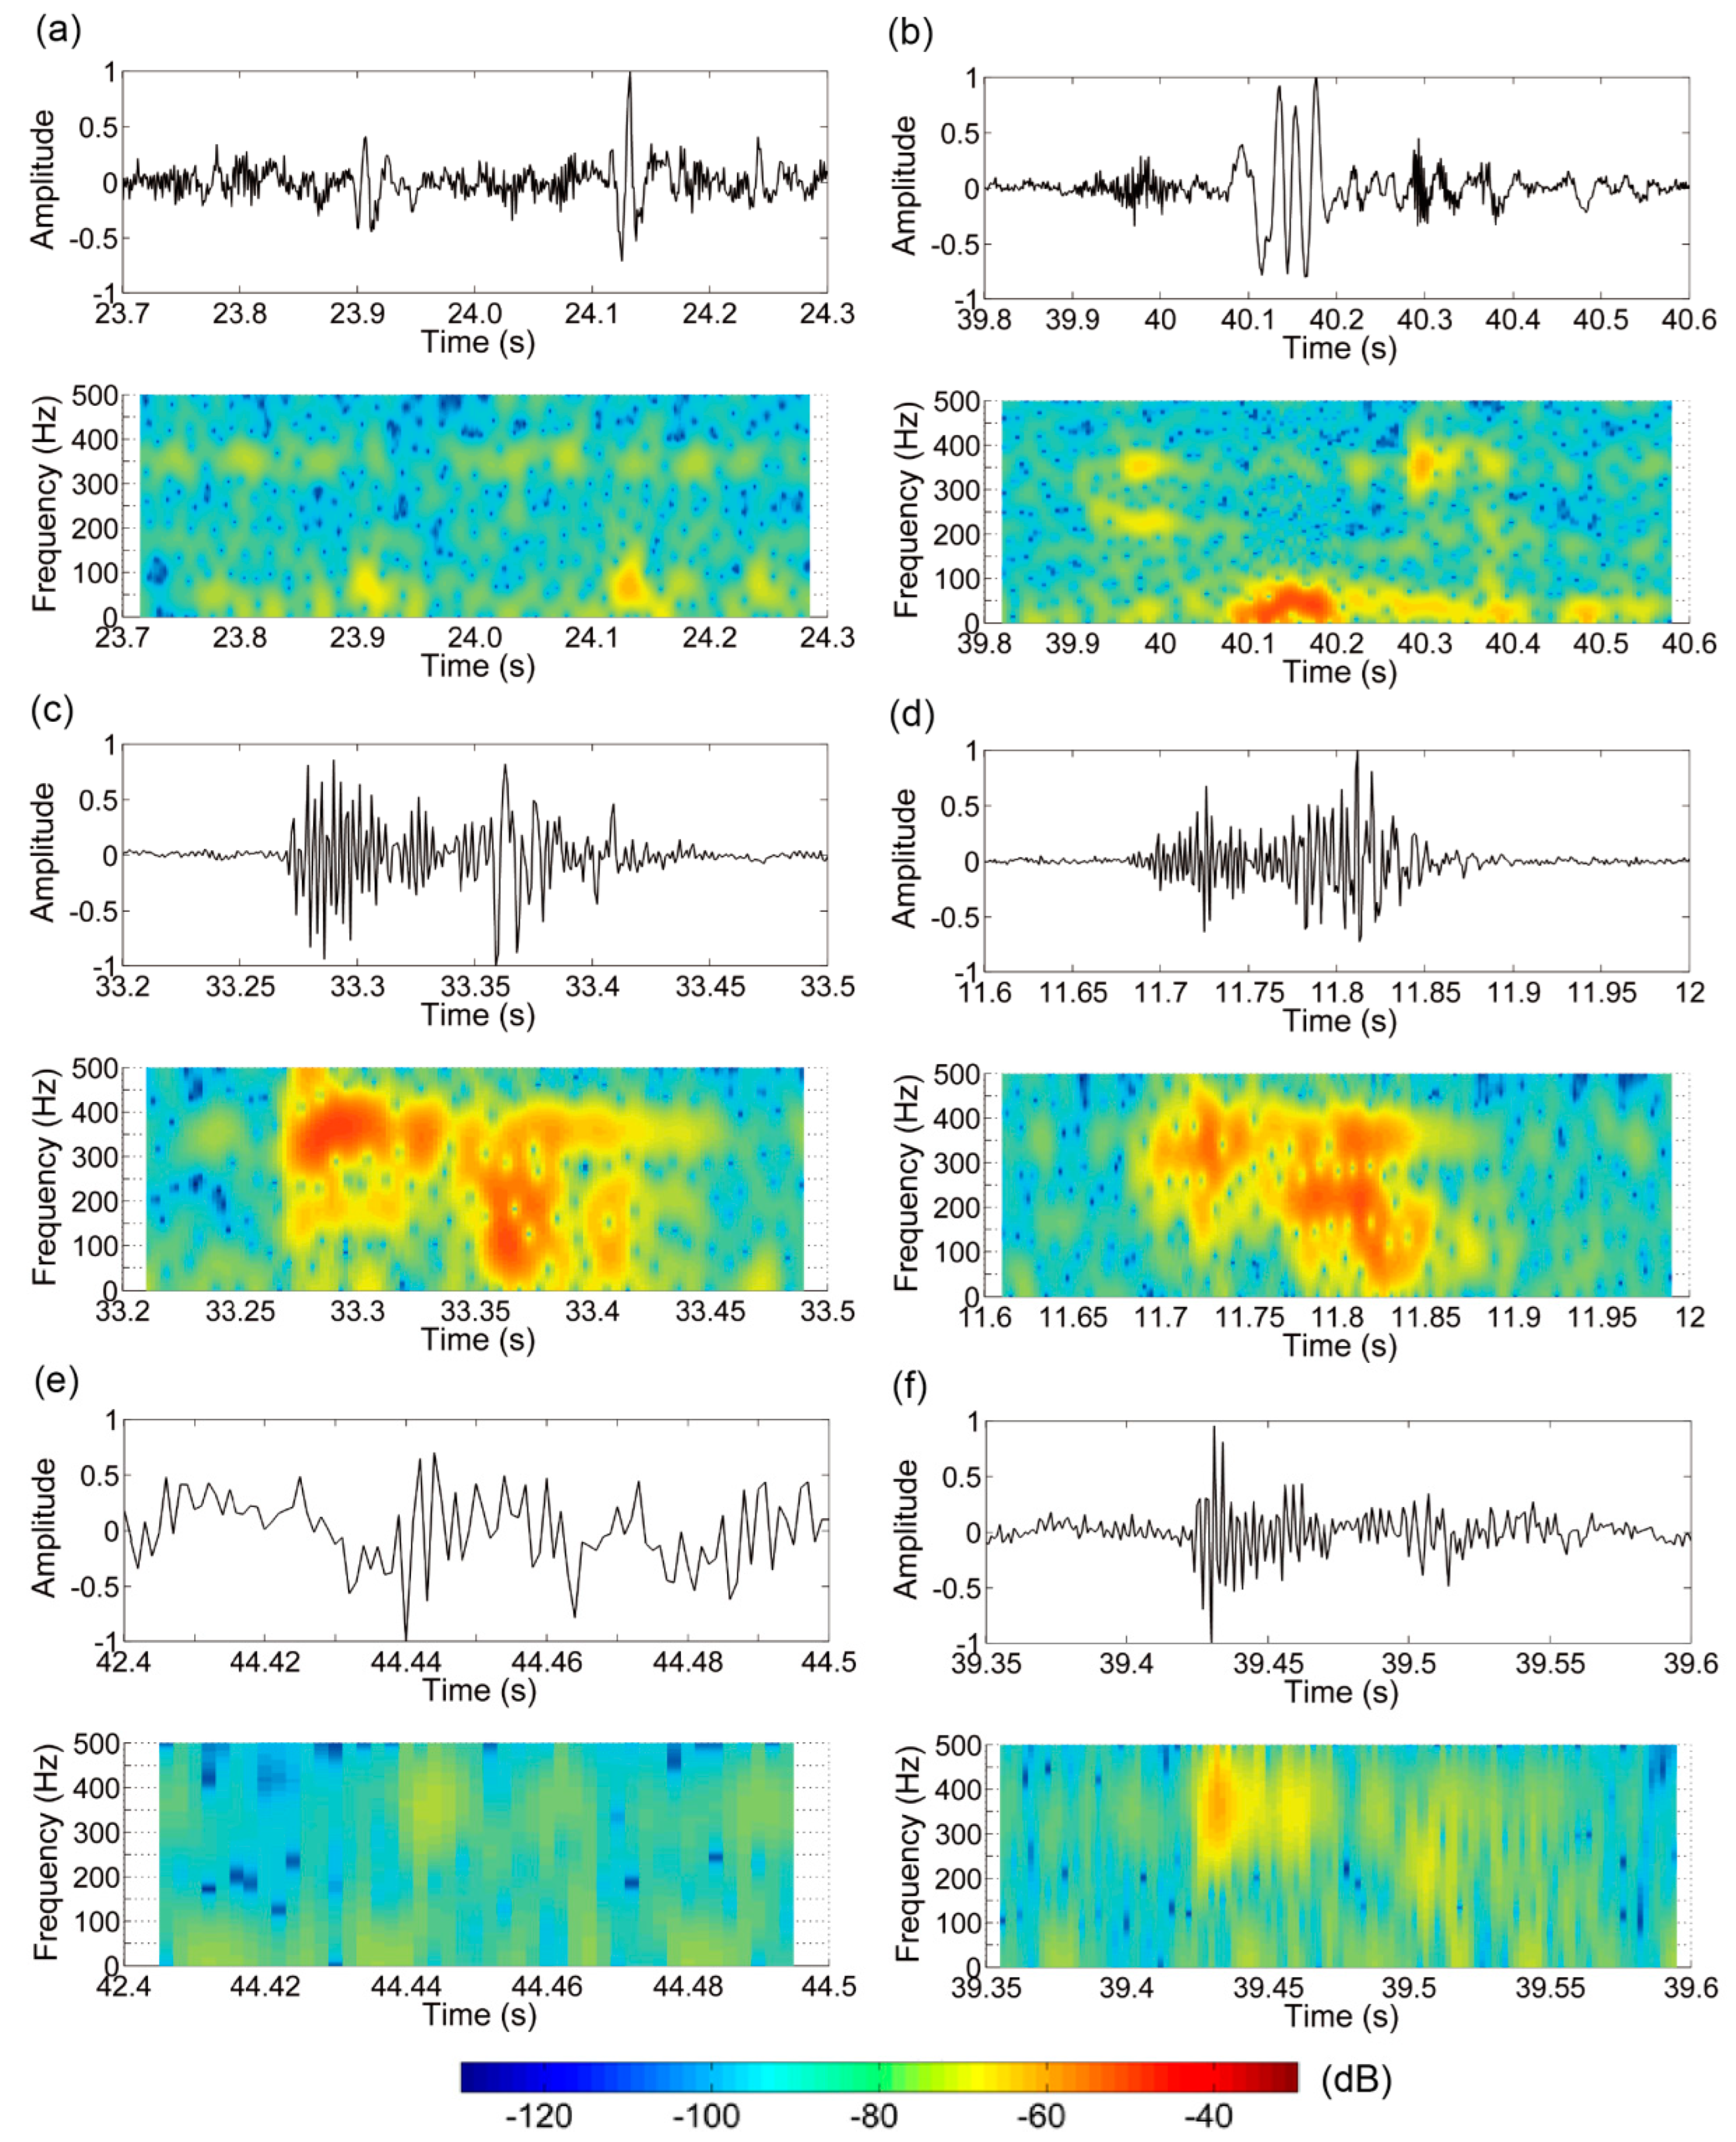
2.3.1. Passive Seismic Source
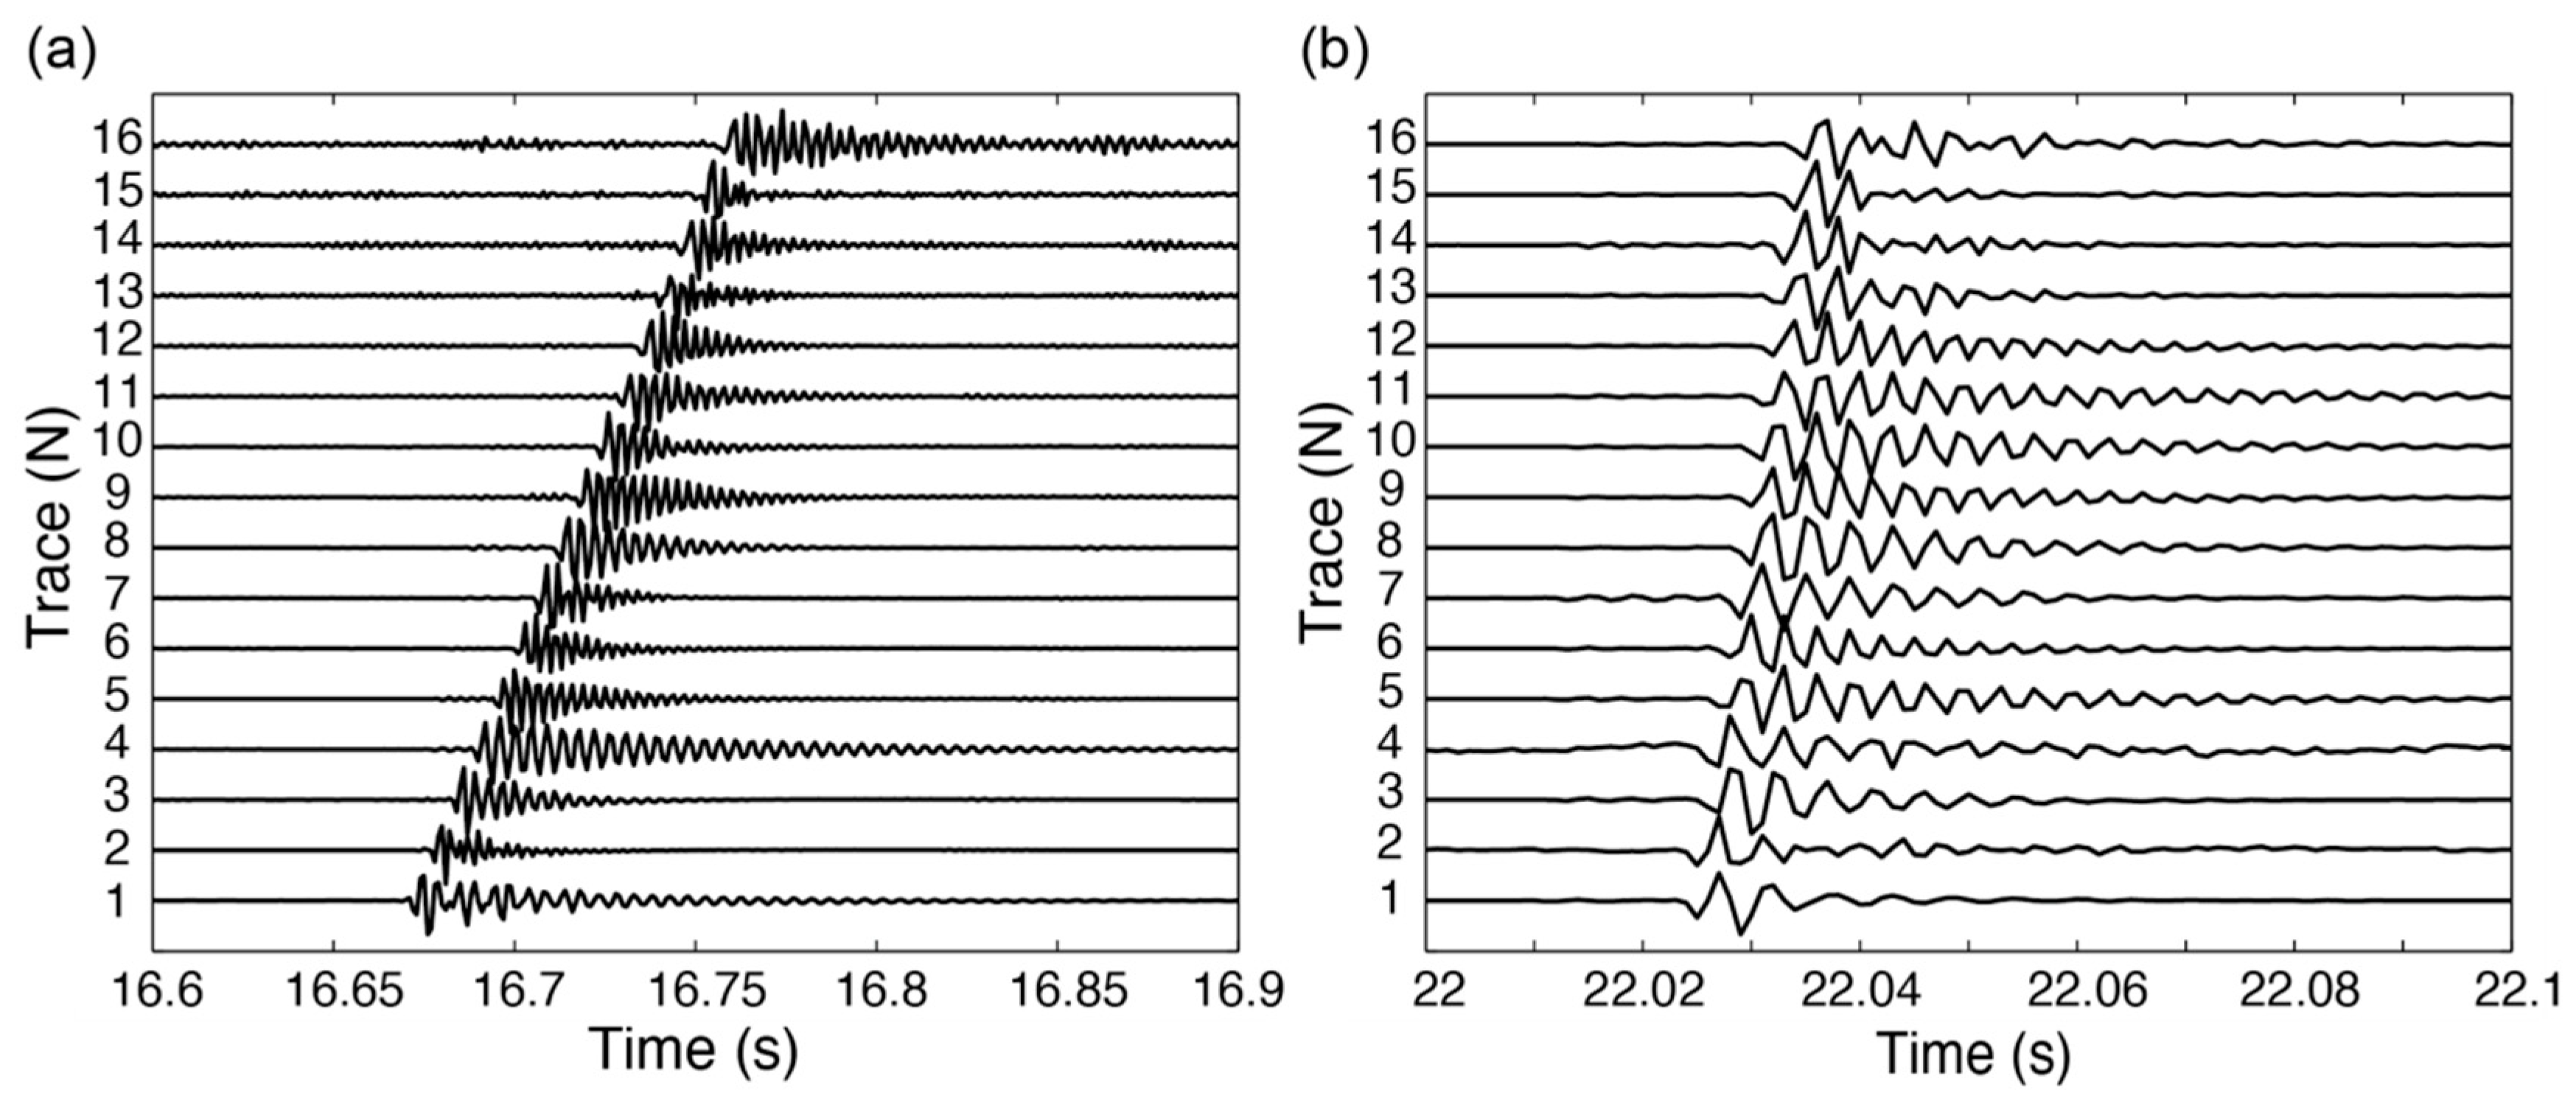
2.3.2. Active Seismic Source
3. Seismic Waveform Analyses
3.1. Spectral Analysis
3.2. Seismic Scattering Method
4. Discussion
5. Conclusions
Author Contributions
Funding
Data Availability Statement
Acknowledgments
Conflicts of Interest
References
- Yao, T.; Xue, Y.; Chen, D.; Chen, F.; Thompson, L.; Cui, P.; Koike, T.; Lau, W.K.-M.; Lettenmaier, D.; Mosbrugger, V.; et al. Recent Third Pole’s Rapid Warming Accompanies Cryospheric Melt and Water Cycle Intensification and Interactions between Monsoon and Environment: Multidisciplinary Approach with Observations, Modeling, and Analysis. Bull. Am. Meteor. Soc. 2019, 100, 423–444. [Google Scholar] [CrossRef]
- Bhattacharya, A.; Bolch, T.; Mukherjee, K.; King, O.; Menounos, B.; Kapitsa, V.; Neckel, N.; Yang, W.; Yao, T. High Mountain Asian Glacier Response to Climate Revealed by Multi-Temporal Satellite Observations since the 1960s. Nat. Commun. 2021, 12, 4133. [Google Scholar] [CrossRef] [PubMed]
- Miles, E.; McCarthy, M.; Dehecq, A.; Kneib, M.; Fugger, S.; Pellicciotti, F. Health and Sustainability of Glaciers in High Mountain Asia. Nat. Commun. 2021, 12, 2868. [Google Scholar] [CrossRef] [PubMed]
- Zhou, Y.; Li, Z.; Li, J.; Zhao, R.; Ding, X. Glacier Mass Balance in the Qinghai–Tibet Plateau and Its Surroundings from the Mid-1970s to 2000 Based on Hexagon KH-9 and SRTM DEMs. Remote Sens. Environ. 2018, 210, 96–112. [Google Scholar] [CrossRef]
- Guillet, G.; King, O.; Lv, M.; Ghuffar, S.; Benn, D.; Quincey, D.; Bolch, T. A Regionally Resolved Inventory of High Mountain Asia Surge-Type Glaciers, Derived from a Multi-Factor Remote Sensing Approach. Cryosphere 2022, 16, 603–623. [Google Scholar] [CrossRef]
- Vale, A.B.; Arnold, N.S.; Rees, W.G.; Lea, J.M. Remote Detection of Surge-Related Glacier Terminus Change across High Mountain Asia. Remote Sens. 2021, 13, 1309. [Google Scholar] [CrossRef]
- Shugar, D.H.; Jacquemart, M.; Shean, D.; Bhushan, S.; Upadhyay, K.; Sattar, A.; Schwanghart, W.; McBride, S.; de Vries, M.V.W.; Mergili, M.; et al. A Massive Rock and Ice Avalanche Caused the 2021 Disaster at Chamoli, Indian Himalaya. Science 2021, 373, 300–306. [Google Scholar] [CrossRef]
- Bolch, T. Asian Glaciers Are a Reliable Water Source. Nature 2017, 545, 161–162. [Google Scholar] [CrossRef] [Green Version]
- Immerzeel, W.W.; van Beek, L.P.H.; Bierkens, M.F.P. Climate Change Will Affect the Asian Water Towers. Science 2010, 328, 1382–1385. [Google Scholar] [CrossRef]
- Yao, T.; Bolch, T.; Chen, D.; Gao, J.; Immerzeel, W.; Piao, S.; Su, F.; Thompson, L.; Wada, Y.; Wang, L.; et al. The Imbalance of the Asian Water Tower. Nat. Rev. Earth Environ. 2022, 3, 618–632. [Google Scholar] [CrossRef]
- Nie, Y.; Pritchard, H.D.; Liu, Q.; Hennig, T.; Wang, W.; Wang, X.; Liu, S.; Nepal, S.; Samyn, D.; Hewitt, K.; et al. Glacial Change and Hydrological Implications in the Himalaya and Karakoram. Nat. Rev. Earth Environ. 2021, 2, 91–106. [Google Scholar] [CrossRef]
- O’Neel, S.; Marshall, H.P.; McNamara, D.E.; Pfeffer, W.T. Seismic Detection and Analysis of Icequakes at Columbia Glacier, Alaska. J. Geophys. Res. Earth Surf. 2007, 112, e2006JF000595. [Google Scholar] [CrossRef]
- Roux, P.-F.; Marsan, D.; Métaxian, J.-P.; O’Brien, G.; Moreau, L. Microseismic Activity within a Serac Zone in an Alpine Glacier (Glacier d’Argentiere, Mont Blanc, France). J. Glaciol. 2008, 54, 157–168. [Google Scholar] [CrossRef] [Green Version]
- Walter, F.; Deichmann, N.; Funk, M. Basal Icequakes during Changing Subglacial Water Pressures beneath Gornergletscher, Switzerland. J. Glaciol. 2008, 54, 511–521. [Google Scholar] [CrossRef] [Green Version]
- Walter, F.; Roux, P.; Roeoesli, C.; Lecointre, A.; Kilb, D.; Roux, P.-F. Using Glacier Seismicity for Phase Velocity Measurements and Green’s Function Retrieval. Geophys. J. Int. 2015, 201, 1722–1737. [Google Scholar] [CrossRef]
- Röösli, C.; Walter, F.; Husen, S.; Andrews, L.C.; Lüthi, M.P.; Catania, G.A.; Kissling, E. Sustained Seismic Tremors and Icequakes Detected in the Ablation Zone of the Greenland Ice Sheet. J. Glaciol. 2014, 60, 563–575. [Google Scholar] [CrossRef] [Green Version]
- Carmichael, J.D.; Joughin, I.; Behn, M.D.; Das, S.; King, M.A.; Stevens, L.; Lizarralde, D. Seismicity on the Western Greenland Ice Sheet: Surface Fracture in the Vicinity of Active Moulins. J. Geophys. Res. Earth Surf. 2015, 120, 1082–1106. [Google Scholar] [CrossRef] [Green Version]
- Helmstetter, A.; Moreau, L.; Nicolas, B.; Comon, P.; Gay, M. Intermediate-Depth Icequakes and Harmonic Tremor in an Alpine Glacier (Glacier d’Argentière, France): Evidence for Hydraulic Fracturing? J. Geophys. Res. Earth Surf. 2015, 120, 402–416. [Google Scholar] [CrossRef] [Green Version]
- Wittlinger, G.; Farra, V. Evidence of Unfrozen Liquids and Seismic Anisotropy at the Base of the Polar Ice Sheets. Polar Sci. 2015, 9, 66–79. [Google Scholar] [CrossRef]
- Podolskiy, E.A.; Walter, F. Cryoseismology. Rev. Geophys. 2016, 54, 708–758. [Google Scholar] [CrossRef] [Green Version]
- Roeoesli, C.; Walter, F.; Ampuero, J.-P.; Kissling, E. Seismic Moulin Tremor. J. Geophys. Res. Solid Earth 2016, 121, 5838–5858. [Google Scholar] [CrossRef] [Green Version]
- Podolskiy, E.A.; Fujita, K.; Sunako, S.; Tsushima, A.; Kayastha, R.B. Nocturnal Thermal Fracturing of a Himalayan Debris-Covered Glacier Revealed by Ambient Seismic Noise. Geophys. Res. Lett. 2018, 45, 9699–9709. [Google Scholar] [CrossRef]
- Chen, Y. Rule and affecting factors of seismic events in valley glacier with continental features: A case study on Laohugou Glacier No. 12. J. Mar. Sci. 2018, 36, 50–56. [Google Scholar]
- Zhang, T.; Chen, Y.; Ding, M.; Shen, Z.; Yang, Y.; Guan, Q. Air-Temperature Control on Diurnal Variations in Microseismicity at Laohugou Glacier No. 12, Qilian Mountains. Ann. Glaciol. 2019, 60, 125–136. [Google Scholar] [CrossRef] [Green Version]
- Zuo, H.; Pei, S.; He, J.; Sun, Q.; Xue, X.; Liu, Y.; Li, J.; Li, L. Research progress of the glacier seismology. DQYXXWLPL 2021, 52, 280–290. [Google Scholar] [CrossRef]
- Daley, T.M.; Miller, D.E.; Dodds, K.; Cook, P.; Freifeld, B.M. Field Testing of Modular Borehole Monitoring with Simultaneous Distributed Acoustic Sensing and Geophone Vertical Seismic Profiles at Citronelle, Alabama. Geophys. Prospect. 2015, 64, 1318–1334. [Google Scholar] [CrossRef] [Green Version]
- Liu, H.; Li, J.; Chi, B.X. Study of distributed acoustic sensing data waveform inversion based on strain rate. Chin. J. Geophys. 2022, 65, 3584–3598. [Google Scholar]
- Zhang, H.; Tao, Z.; Huang, W.; Pei, S.; Nilot, E.; Li, Y.; Junmeng, Z. A New Application of Fiber Seismometer in the Yigong Lake, Tibetan Plateau. Chin. J. Geophys.-Chin. Ed. 2022. [Google Scholar] [CrossRef]
- Parker, L.M.; Thurber, C.H.; Zeng, X.; Li, P.; Lord, N.E.; Fratta, D.; Wang, H.F.; Robertson, M.C.; Thomas, A.M.; Karplus, M.S. Active-Source Seismic Tomography at the Brady Geothermal Field, Nevada, with Dense Nodal and Fiber-Optic Seismic Arrays. Seismol. Res. Lett. 2018, 89, 1629–1640. [Google Scholar] [CrossRef]
- Yu, C.; Zhan, Z.; Lindsey, N.J.; Ajo-Franklin, J.B.; Robertson, M. The Potential of DAS in Teleseismic Studies: Insights from the Goldstone Experiment. Geophys. Res. Lett. 2019, 46, 1320–1328. [Google Scholar] [CrossRef]
- Zeng, X.; Lancelle, C.; Thurber, C.; Fratta, D.; Wang, H.; Lord, N.; Chalari, A.; Clarke, A. Properties of Noise Cross-Correlation Functions Obtained from a Distributed Acoustic Sensing Array at Garner Valley, California. Bull. Seismol. Soc. Am. 2017, 107, 603–610. [Google Scholar] [CrossRef]
- Lei, Y.; Yin, F.; Hong, H.; Li, Y.; Wang, B. Shallow Structure Imaging Using Higher-Mode Rayleigh Waves Based on FJ Transform in DAS Observation. Chin. J. Geophys. 2021, 64, 4280–4291. [Google Scholar]
- Nayak, A.; Ajo-Franklin, J. Distributed Acoustic Sensing Using Dark Fiber for Array Detection of Regional Earthquakes. Seismol. Res. Lett. 2021, 92, 2441–2452. [Google Scholar] [CrossRef]
- Booth, A.D.; Christoffersen, P.; Schoonman, C.; Clarke, A.; Hubbard, B.; Law, R.; Doyle, S.H.; Chudley, T.R.; Chalari, A. Distributed Acoustic Sensing of Seismic Properties in a Borehole Drilled on a Fast-Flowing Greenlandic Outlet Glacier. Geophys. Res. Lett. 2020, 47, e2020GL088148. [Google Scholar] [CrossRef]
- Paitz, P.; Edme, P.; Gräff, D.; Walter, F.; Doetsch, J.; Chalari, A.; Schmelzbach, C.; Fichtner, A. Empirical Investigations of the Instrument Response for Distributed Acoustic Sensing (DAS) across 17 Octaves. Bull. Seismol. Soc. Am. 2020, 111, 1–10. [Google Scholar] [CrossRef]
- Walter, F.; Gräff, D.; Lindner, F.; Paitz, P.; Köpfli, M.; Chmiel, M.; Fichtner, A. Distributed Acoustic Sensing of Microseismic Sources and Wave Propagation in Glaciated Terrain. Nat. Commun. 2020, 11, 2436. [Google Scholar] [CrossRef]
- Hudson, T.S.; Baird, A.F.; Kendall, J.M.; Kufner, S.K.; Brisbourne, A.M.; Smith, A.M.; Butcher, A.; Chalari, A.; Clarke, A. Distributed Acoustic Sensing (DAS) for Natural Microseismicity Studies: A Case Study From Antarctica. J. Geophys. Res. Solid Earth 2021, 126, e2020JB021493. [Google Scholar] [CrossRef]
- Zhou, W.; Butcher, A.; Brisbourne, A.M.; Kufner, S.-K.; Kendall, J.-M.; Stork, A.L. Seismic Noise Interferometry and Distributed Acoustic Sensing (DAS): Inverting for the Firn Layer S-Velocity Structure on Rutford Ice Stream, Antarctica. J. Geophys. Res. Earth Surf. 2022, 127, e2022JF006917. [Google Scholar] [CrossRef]
- Ding, J.; Jiang, H. Seismic scattering technology and its application in goaf exploration. Prog. Geophys. 2015, 30, 1459–1464. [Google Scholar]
- Jiang, H.; Liu, C.; Jia, C.; Hou, J. The application of seismic scattering technology to detection of grouting effect. Chin. J. Eng. Geophys. 2015, 12, 260–265. [Google Scholar]
- Jiang, D.; Zhang, W.; Li, F. All-Metal Optical Fiber Accelerometer With Low Transverse Sensitivity for Seismic Monitoring. Sens. J. IEEE 2013, 13, 4556–4560. [Google Scholar] [CrossRef]
- Huang, W.; Zhang, W.; Huang, J.; Li, F. Demonstration of Multi-Channel Fiber Optic Interrogator Based on Time-Division Locking Technique in Subway Intrusion Detection. Opt. Express 2020, 28, 11472–11481. [Google Scholar] [CrossRef] [PubMed]
- Millan, R.; Mouginot, J.; Rabatel, A.; Morlighem, M. Ice Velocity and Thickness of the World’s Glaciers. Nat. Geosci. 2022, 15, 124–129. [Google Scholar] [CrossRef]
- Mikesell, T.D.; van Wijk, K.; Haney, M.M.; Bradford, J.H.; Marshall, H.-P.; Harper, J.T. Monitoring Glacier Surface Seismicity in Time and Space Using Rayleigh Waves. J. Geophys. Res. Earth Surf. 2012, 117, F02020. [Google Scholar] [CrossRef] [Green Version]
- Neave, K.G.; Savage, J.C. Icequakes on the Athabasca Glacier. J. Geophys. Res. 1970, 75, 1351–1362. [Google Scholar] [CrossRef]
- Deichmann, N.; Ansorge, J.; Scherbaum, F.; Aschwanden, A.; Bernard, F.; Gudmundsson, G.H. Evidence for Deep Icequakes in an Alpine Glacier. Ann. Glaciol. 2000, 31, 85–90. [Google Scholar] [CrossRef] [Green Version]
- West, M.; Larsen, C.; Truffer, M.; O’Neel, S.; LeBlanc, L. Glacier Microseismicity. Geology 2010, 38, 319–322. [Google Scholar] [CrossRef] [Green Version]
- Walter, F.; Dalban Canassy, P.; Husen, S.; Clinton, J.F. Deep Icequakes: What Happens at the Base of Alpine Glaciers? J. Geophys. Res. Earth Surf. 2013, 118, 1720–1728. [Google Scholar] [CrossRef]
- Helmstetter, A.; Nicolas, B.; Comon, P.; Gay, M. Basal Icequakes Recorded beneath an Alpine Glacier (Glacier d’Argentière, Mont Blanc, France): Evidence for Stick-Slip Motion? J. Geophys. Res. Earth Surf. 2015, 120, 379–401. [Google Scholar] [CrossRef] [Green Version]
- Kohnen, H. The Temperature Dependence of Seismic Waves in Ice. J. Glaciol. 1974, 13, 144–147. [Google Scholar] [CrossRef]
- Llorens, M.-G.; Griera, A.; Bons, P.D.; Weikusat, I.; Prior, D.J.; Gomez-Rivas, E.; de Riese, T.; Jimenez-Munt, I.; García-Castellanos, D.; Lebensohn, R.A. Can changes in deformation regimes be inferred from crystallographic preferred orientations in polar ice? Cryosphere 2022, 16, 2009–2024. [Google Scholar] [CrossRef]
- Llorens, M.G.; Griera, A.; Bons, P.D.; Weikusat, I.; Prior, D.; Gomez-Rivas, E.; de Riese, T.; Jimenez-Munt, I.; García Castellanos, D.; Lebensohn, R.A. Can Changes in Ice-Sheet Flow Be Inferred from Crystallographic Preferred Orientations?; Ice sheets/Numerical Modelling: 2021. Cryosphere Discuss. 2021, 2021, 1–24. [Google Scholar]
- Zhang, T.; Ding, M.; Xiao, C.; Zhang, D.; Du, Z. Temperate Ice Layer Found in the Upper Area of Jima Yangzong Glacier, the Headstream of Yarlung Zangbo River. Sci. Bull. 2016, 61, 619–621. [Google Scholar] [CrossRef] [Green Version]
- Meyer, C.R.; Minchew, B.M. Temperate Ice in the Shear Margins of the Antarctic Ice Sheet: Controlling Processes and Preliminary Locations. Earth Planet. Sci. Lett. 2018, 498, 17–26. [Google Scholar] [CrossRef]
- Gilbert, A.; Sinisalo, A.; Gurung, T.R.; Fujita, K.; Maharjan, S.B.; Sherpa, T.C.; Fukuda, T. The Influence of Water Percolation through Crevasses on the Thermal Regime of a Himalayan Mountain Glacier. Cryosphere 2020, 14, 1273–1288. [Google Scholar] [CrossRef] [Green Version]
- Nanni, U.; Gimbert, F.; Roux, P.; Lecointre, A. Observing the Subglacial Hydrology Network and Its Dynamics with a Dense Seismic Array. Proc. Natl. Acad. Sci. USA 2021, 118, e2023757118. [Google Scholar] [CrossRef]
- Nanni, U.; Roux, P.; Gimbert, F.; Lecointre, A. Dynamic Imaging of Glacier Structures at High-Resolution Using Source Localization With a Dense Seismic Array. Geophys. Res. Lett. 2022, 49, e2021GL095996. [Google Scholar] [CrossRef]
- Van der Veen, C.J. Fracture Mechanics Approach to Penetration of Surface Crevasses on Glaciers. Cold Reg. Sci. Technol. 1998, 27, 31–47. [Google Scholar] [CrossRef]
- van der Veen, C.J. Fracture Propagation as Means of Rapidly Transferring Surface Meltwater to the Base of Glaciers. Geophys. Res. Lett. 2007, 34, L01501. [Google Scholar] [CrossRef] [Green Version]
- Carmichael, J.D.; Pettit, E.C.; Hoffman, M.; Fountain, A.; Hallet, B. Seismic Multiplet Response Triggered by Melt at Blood Falls, Taylor Glacier, Antarctica. J. Geophys. Res. Earth Surf. 2012, 117, F03004. [Google Scholar] [CrossRef]
- Colgan, W.; Rajaram, H.; Abdalati, W.; McCutchan, C.; Mottram, R.; Moussavi, M.S.; Grigsby, S. Glacier Crevasses: Observations, Models, and Mass Balance Implications. Rev. Geophys. 2016, 54, 119–161. [Google Scholar] [CrossRef]


Disclaimer/Publisher’s Note: The statements, opinions and data contained in all publications are solely those of the individual author(s) and contributor(s) and not of MDPI and/or the editor(s). MDPI and/or the editor(s) disclaim responsibility for any injury to people or property resulting from any ideas, methods, instructions or products referred to in the content. |
© 2023 by the authors. Licensee MDPI, Basel, Switzerland. This article is an open access article distributed under the terms and conditions of the Creative Commons Attribution (CC BY) license (https://creativecommons.org/licenses/by/4.0/).
Share and Cite
Li, Y.; Huang, W.; Li, G.; Yang, W.; Zhang, X.; Li, J.; Zhang, W.; Xu, B. Icequakes and Large Shear Wave Velocity Drop in the Kuoqionggangri Glacier of Tibetan Plateau Observed with Fiber Optic Seismometer Array. Remote Sens. 2023, 15, 1282. https://doi.org/10.3390/rs15051282
Li Y, Huang W, Li G, Yang W, Zhang X, Li J, Zhang W, Xu B. Icequakes and Large Shear Wave Velocity Drop in the Kuoqionggangri Glacier of Tibetan Plateau Observed with Fiber Optic Seismometer Array. Remote Sensing. 2023; 15(5):1282. https://doi.org/10.3390/rs15051282
Chicago/Turabian StyleLi, Yanan, Wenzhu Huang, Guohui Li, Wei Yang, Xiaolong Zhang, Jiule Li, Wentao Zhang, and Baiqing Xu. 2023. "Icequakes and Large Shear Wave Velocity Drop in the Kuoqionggangri Glacier of Tibetan Plateau Observed with Fiber Optic Seismometer Array" Remote Sensing 15, no. 5: 1282. https://doi.org/10.3390/rs15051282