Article

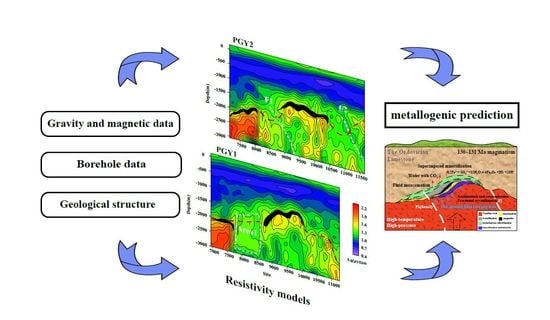
Metallogenic Prediction of Magnetite in the Pandian Area at the Northwest Margin of Luxi Uplift, China: Constraints of Wide-Field Electromagnetic Data

1
Key Laboratory of Metallogenic Prediction of Nonferrous Metals and Geological Environment Monitoring, Central South University, Ministry of Education, Changsha 410083, China
2
Key Laboratory of Non-Ferrous and Geological Hazard Detection, Changsha 410083, China
3
School of Geosciences and Info-Physics, Central South University, Changsha 410083, China
4
No.1 Institute of Geology and Mineral Resources of Shandong Province, Jinan 250100, China
5
Shandong Engineering Laboratory for High-Grade Iron Ore Exploration and Exploitation, Jinan 250100, China
*
Author to whom correspondence should be addressed.
Remote Sens. 2023, 15(5), 1217; https://doi.org/10.3390/rs15051217
Submission received: 11 January 2023 / Revised: 20 February 2023 / Accepted: 20 February 2023 / Published: 22 February 2023
(This article belongs to the Special Issue Multi-Scale Remote Sensed Imagery for Mineral Exploration)

Abstract

:
The Pandian deposit is a newly discovered contact metasomatic skarn magnetite deposit found in the Cainozoic super-thick overburden on the northwest margin of Luxi Uplift (LXU). Presently, the horizontal scale of the deposit delineated by the potential field (gravity and magnetic method) has shown giant potential for ore deposits, and mapping the ore-controlling structures in the vertical scale becomes a primary task for metallogenic prediction. In our study, the wide-field electromagnetic method (WFEM), with a strong anti-noise ability in recording electromagnetic signals on the surface at multiple frequencies, is applied to characterize the deep conductivity distribution of the Pandian area. Based on the inversion results from two parallel WFEM profiles, which consist of 105 sites and previous geological and geophysical results, the 2D geoelectric models are established. The low-resistivity regions (with a typical range of 25~32 Ω·m) in the electrical models are proven to be ore bodies of Pandian deposit, which are developed along the contact zone between Yanshanian intrusive rocks and Paleozoic Ordovician strata. The scattered bodies (typically >32 Ω·m) in Ordovician limestone strata are probably caused by intrusive diorite pluton closely related to magnetite mineralization. Due to contact metasomatism, bedded limestone near magnetite was metamorphosed into marble and accompanied by low-resistivity skarn alteration, with resistivity much different from its high-resistivity protolith. The inverted geoelectrical models visually reflect the spatial distribution features of intrusive rocks and lithologic alteration/fracture zones.

Graphical Abstract

1. Introduction

Luxi Uplift (LXU) located in the southeast of the North China Craton (NCC) is part of the Mesozoic Circum–Pacific metallogenetic belt [1,2]. It is adjacent to the Tan-Lu fault zone (TLFZ) and Lankao–Liaocheng fault (LLF) to the east and west, respectively. It also connects the Qihe–Guangrao fault (QGF) to the north, with the Feng–Pei fault (FPF) as its southern boundary (Figure 1) [3,4]. LXU developed a complex extensional fault system, controlled by the subduction of the Pacific plate, strike-slip movements of TLFZ and mantle–derived magmatic activities since the Late Jurassic [5]. These tectonic movements provided superior geological conditions for the mineralization of skarn iron deposits in eastern North China [6]. The Pandian deposit is located at the northwest edge of LXU, connected with the North China Depression [7,8], which is a newly discovered iron deposit with great metallogenic potential in the near east–west skarn-type rich-iron metallogenic belt of Shandong from the middle to the west [9,10]. This deposit mainly developed along the contact zones between Late Yanshanian diorite and Paleozoic Ordovician limestone [9,10]. It has the characteristics of large thickness, high grade and concentrated distribution, with vast development prospects for exploration [11,12,13].
In recent years, researchers have carried out a variety of geophysical exploration studies based on the physical characteristics of rock (ore) in the Pandian area, such as gravity–magnetic exploration, magnetotelluric sounding and drilling [13,15]. They have obtained an important understanding of the geological structural setting, ore-forming material source and deep prospecting prediction [16,17,18]. However, it is difficult to extract ore-induced anomalies using conventional geophysical methods, due to the thick overburden of Cenozoic sedimentary rocks weakening the signal from deeper structures [19]. Though the potential field, including gravity or magnetic methods, is applied to delineate the horizontal boundary of the target geological bodies, the poor vertical resolution makes it difficult to provide reliable physical evidences of precise structural information from deep strata, including concealed faults, lithologic fracture/alteration zones and stratigraphic boundaries [20,21]. It is well known that the combination of different exploration methods can provide multiple physical constraints during the inversion and interpretation of geophysical data, which helps to improve the accuracy of interpretation [22].
To realize more accurate positioning of ore bodies in the Pandian area, it is urgent to combine other effective geophysical exploration methods [18]. As an effective method of deep resource exploration, the electromagnetic method has been widely used in past deep prospecting [23]. However, the controlled source magnetotelluric methods are restricted by low transmitting power and far-field theory, and their detection depth is limited to meet the demands of deep resource exploration in the Pandian area [24,25]. The magnetotelluric (MT) sounding method and the audio magnetotelluric (AMT) method using natural signals are susceptible to electromagnetic interferences because of their weak natural field source signals and random polarization directions [26,27]. Beyond these, the wide-field electromagnetic (WFEM) method using a 300 kW generator as the transmitter to send multiple pseudo-random fields at one time can effectively reduce the influence of the non-plane wave effect and randomness of the natural field source signal [28,29]. Especially in recent years, with the characteristics of high observation accuracy, great detection depth and diversified observation modes, the WFEM method has been widely used in resource exploration, such as solid minerals, geothermal and energy [30,31].
Studies have verified that the WFEM method can quickly delineate oil-rich areas and identify the depth and thickness of shale gas reservoirs [32]. In particular, it can reveal the spatial distribution of the ore-controlling structures and the ore-bearing strata well, when prospecting mineral resources in strongly disturbed areas [27]. The WFEM method not only makes up for the shortcoming of the uncertainty of depth by potential field inversions, such as gravity and magnetism, but also provides credible electrical evidences for the presence of fine structures, including lithologic alteration/fracture zones and stratigraphic boundaries in deep layers [33,34]. According to the above, it is clear that the WFEM method can be applied to the study of electrical structures and the metallogenic prediction researches of the Pandian deposit. More specifically, the significant contrast of the resistivity among different geological bodies provides the premise for the application of the WFEM method in this survey area.

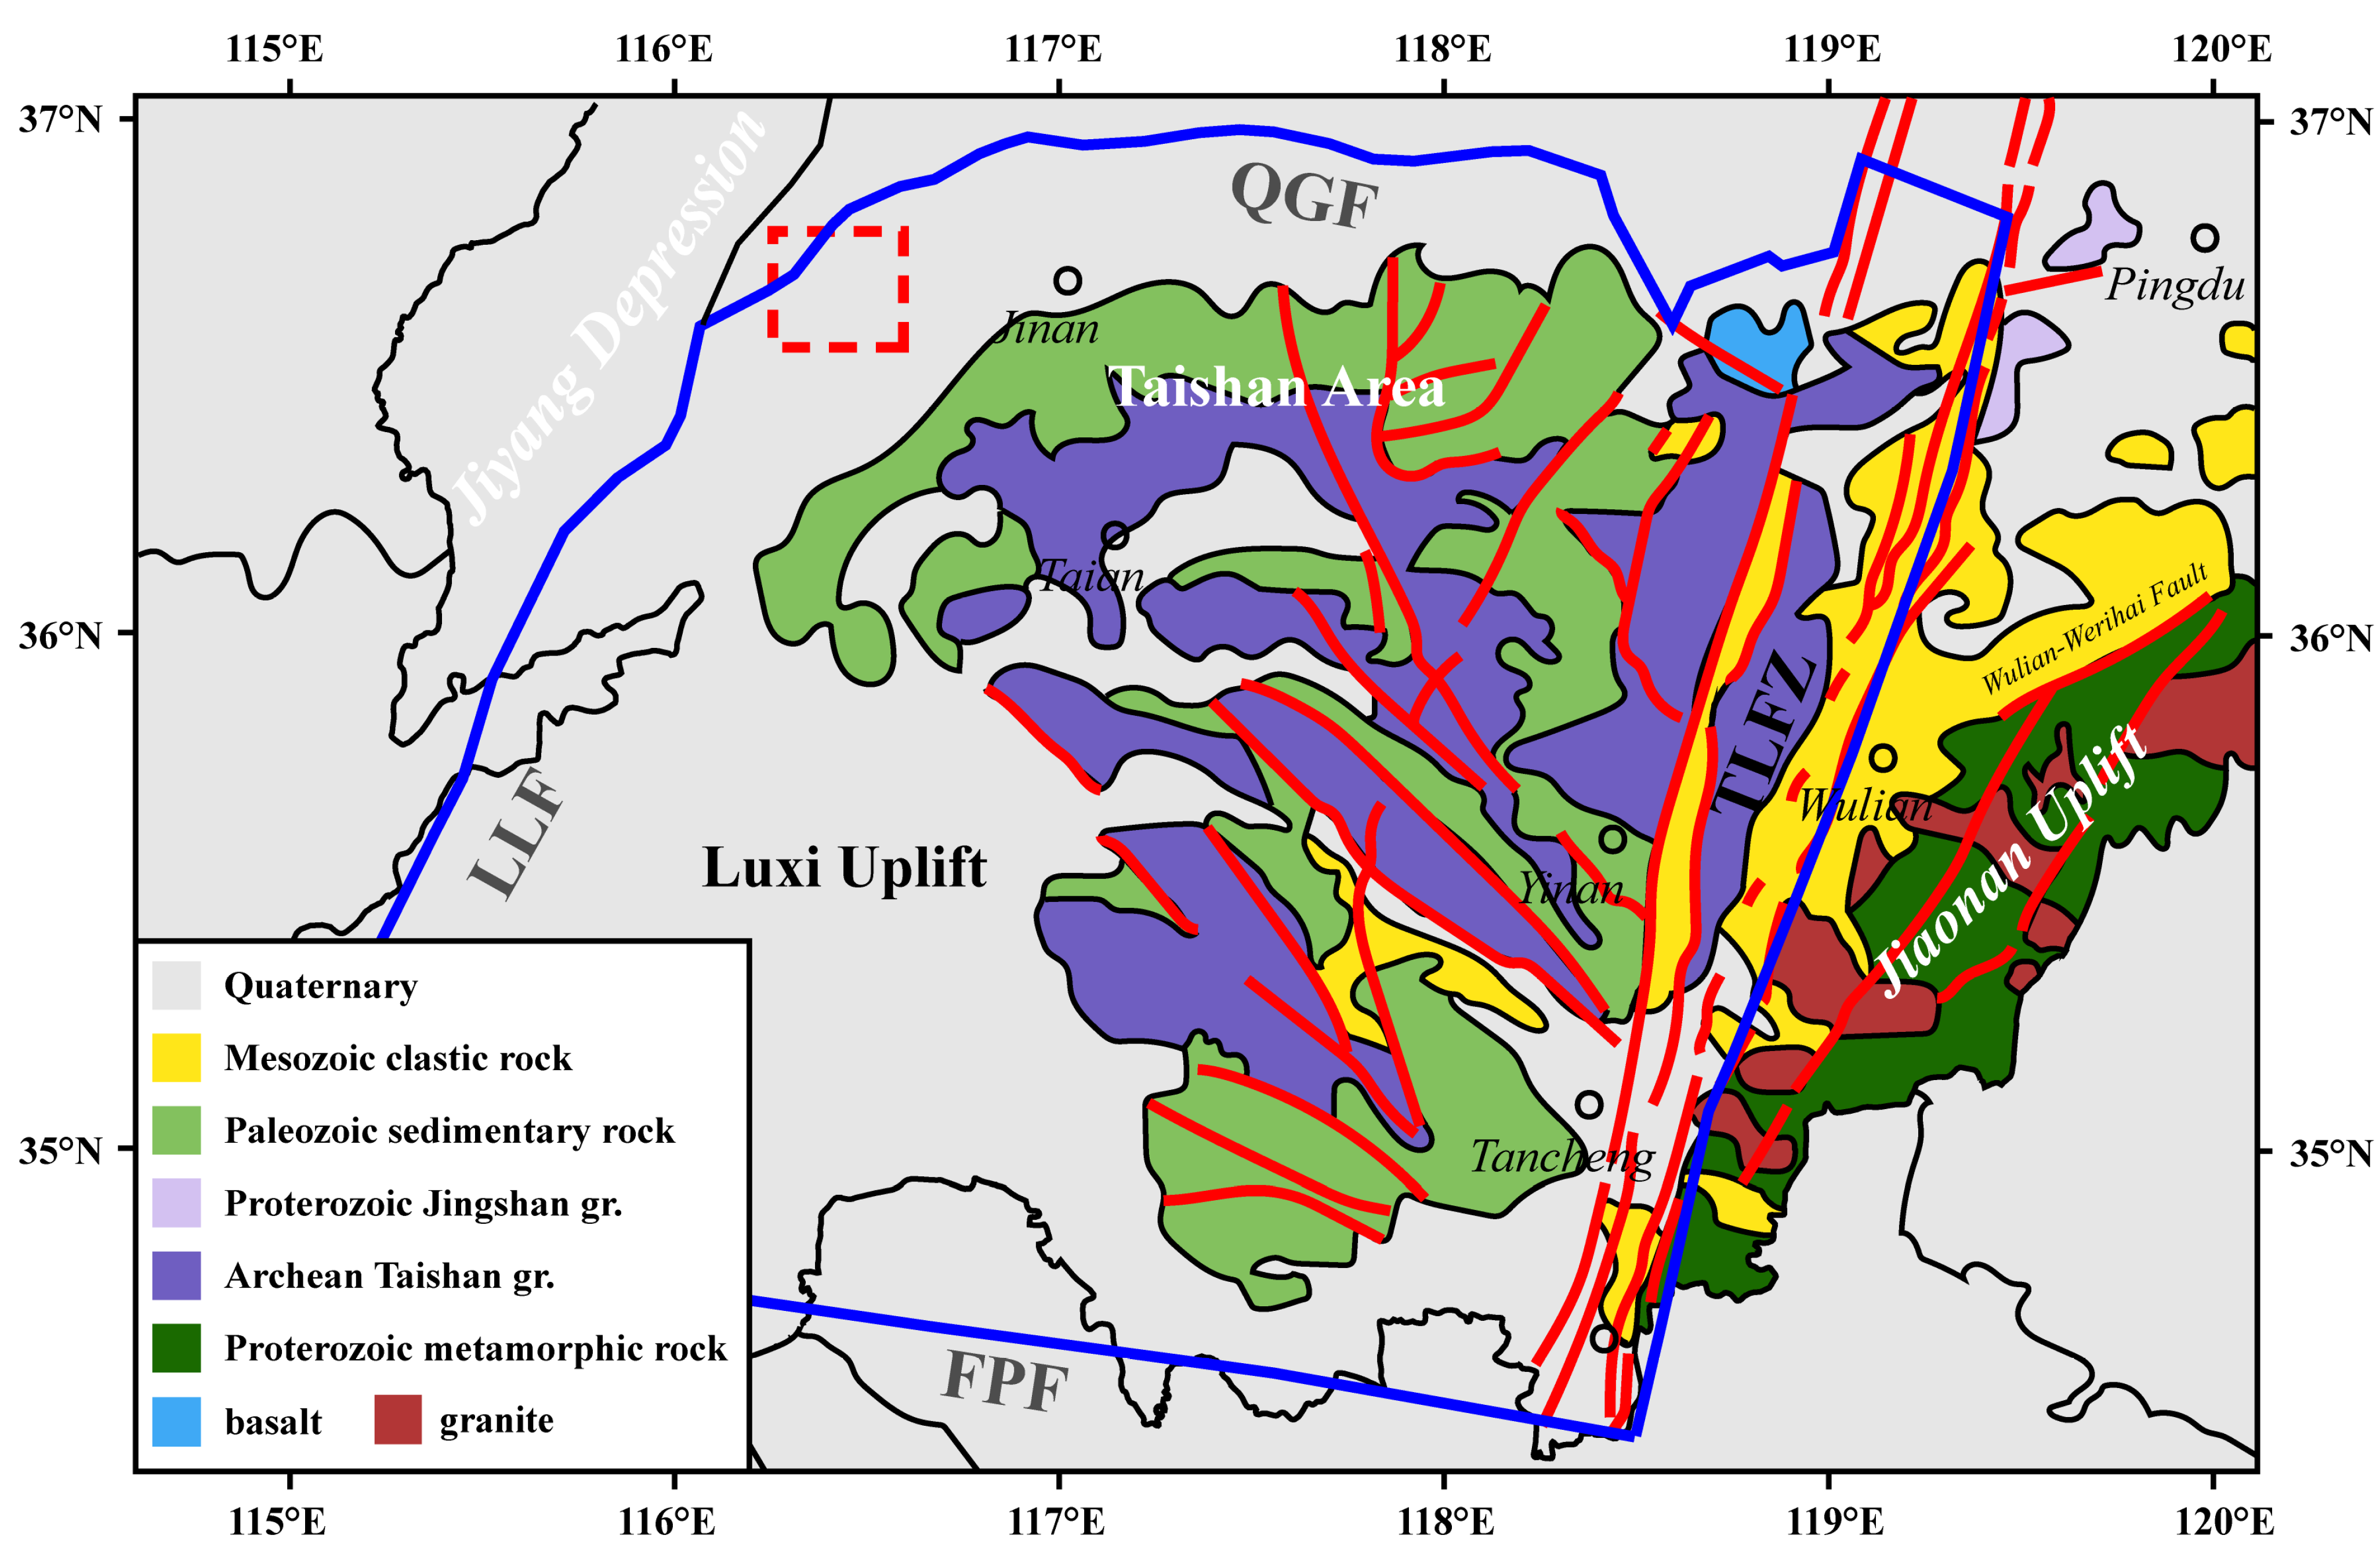
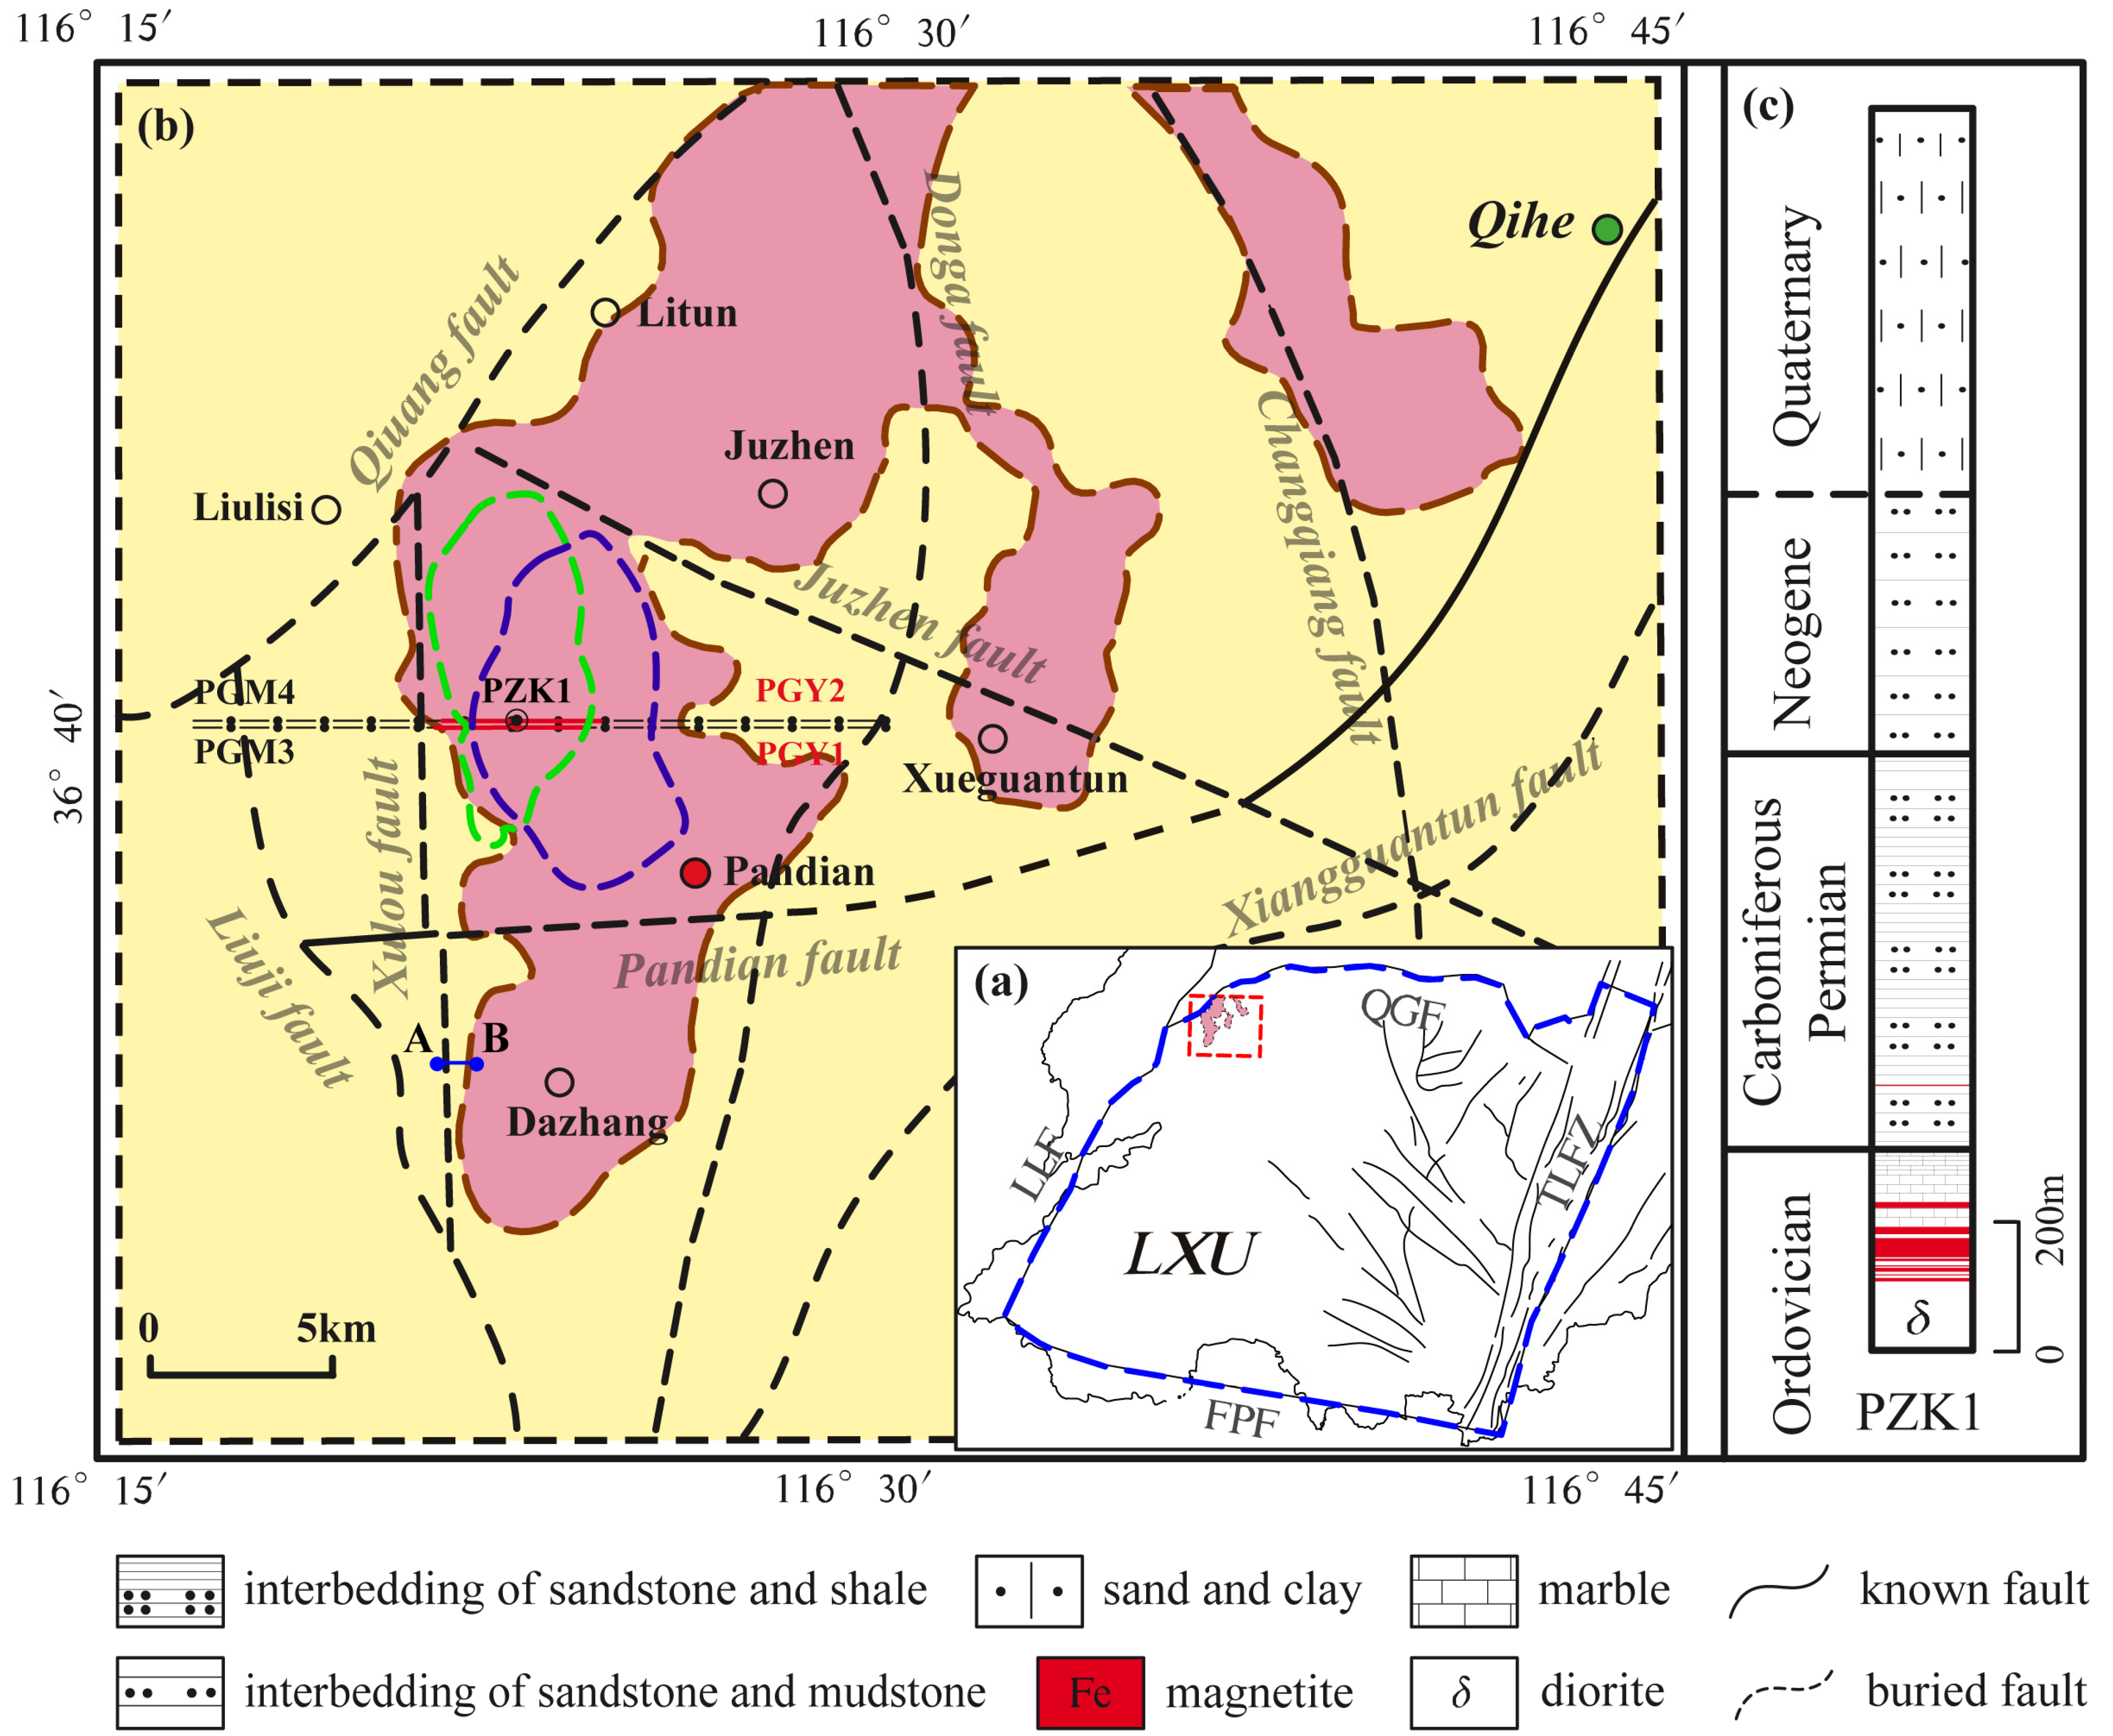
2. Geological Setting

LXU, as one of the important tectonic units of North China Block (NCB), has experienced a series of complex tectonic movements accompanied by multiple-stage magmatic activities since the Mesozoic [35]. Especially, since the Late Mesozoic (130~110 Ma), the fault structures in the region have been activated strongly, resulting in two large-scale extensional tectonic movements and forming a series of steeply NW-trending extensional faults and planar gently trending extensional detachment faults [4]. Under the control of large regional structures, including the Qihe–Guangrao fault, Lankao–Liaocheng fault and so on, the fault structure system was strongly developed in LXU (Figure 2) [11,12]. Previous studies have shown that the regional fault structures of the Pandian area, such as Juzhen fault, Pandian fault and Xulou fault, were mainly distributed in the deep strata in the form of buried faults, which were conducive to the mineralization of the contact metasomatic magnetite in this deposit [16,17,18].
The strata of the Pandian district belong to typical North China-type strata, which are inclined to the north [7]. From top to bottom, the strata of Quaternary (Q), Neogene (N), Permian (P), Carboniferous (C), Ordovician (O) and Cambrian (є) are distributed successively in the study area (Figure 2) [15,16,17]. Mainly consisting of Quaternary (Q) and Neogene (N) strata, the Cenozoic super-thick overburden is widely developed in the surveying area with an average thickness of ~1000 m [13]. Moreover, studies have confirmed that there was no bedrock outcrop on the surface of the area [11,12]. Carboniferous–Permian (C-P) strata mainly consist of mudstone, sandstone and siltstone, and the main minerals are quartz, feldspar and debris. The stem fossils of carbonized plants in this stratum are the favorable basis for finding coal-bearing layers [36]. Cambrian–Ordovician (є-O) strata developed steadily, of which the lithology is mainly marine limestone and dolomite [37]. Moreover, Ordovician Majiagou formation limestone is closely related to magnetite mineralization [11]. The minerals contained in this formation are dominated by calcite and dolomite.
The bedrock composition of the Pandian area in accordance with LXU, primarily consists of Archaean metamorphic rocks and Neoproterozoic unaltered sedimentary rocks [38].
Magmatic rocks developed in the manner of hidden bodies in LXU, which are principally intermediate-mafic intrusive complexes, during the Late Yanshanian period [39]. Regional thermal metamorphism resulted in marbleization of the majority of limestone around the intrusive rocks, and the main mineral is calcite. Correspondingly, skarn alteration occurred in the siltstone, and epidote is considered to be the dominant mineral [13]. Drilling revealed that ore bodies, distinguished by being large and thick, are located in the contact zones between the magmatic rocks and Ordovician stratum [11,12]. In addition, the magmatic rocks above the ore bodies occur in Carboniferous–Permian strata in the form of veins. The lithology is dominated by aplite, hornblende diorite and quartz diorite. In the interior of the rock mass, the main forms of pyritization are vein-like, star-dotted, disseminated and strongly developed on the surface of cracks, and the chalcopyrite is occasionally observed locally. Beneath the ore bodies, diorite is the main lithology, and the principal part is located at the bottom of Carboniferous stratum and Ordovician stratum. Near the top interface of the rock mass, the alterations of tremolite and epidote are developed, in which the major minerals are tremolite, epidote, garnet, olivine and plagioclase.
According to the strata from old to new, the density of rocks (ores) in the Pandian area generally displays a decreasing trend and the distribution as magnetite (4.53 × 10³ kg/m3), diorite pluton (2.74 × 10³ kg/m3) and a sedimentary layer (1.74 × 10³ kg/m3), sequentially [17]. Moreover, the distribution characteristics of magnetism are similar to those of density. Among them, magnetite has the highest magnetism (226835 × 10−6·4π SI), and the magnetic susceptibility of diorite is 1704 × 10−6·4π SI. In general, the other sedimentary strata are non-magnetic or micro-magnetic. Therefore, the gravity–magnetic anomalies formed by the diorite exhibited high homology [13]. The borehole PZK1 presented that diorite and limestone in Cambrian–Ordovician strata show distinct high resistivity, with the average resistivity values of 23,331 and 6031 Ω·m, respectively. Carboniferous–Permian strata showed relatively high resistivity (1909 Ω·m). The resistivity of Cenozoic strata is low at 10 Ω·m~200 Ω·m. Compared with the electrical features discussed above, magnetite of the Pandian deposit exhibits excellent conductivity with an average resistivity of only 2.72 Ω·m. In conclusion, the diorite has the characteristics of high density, middle–high magnetism and high conductivity.

3. Data Acquisition and Processing

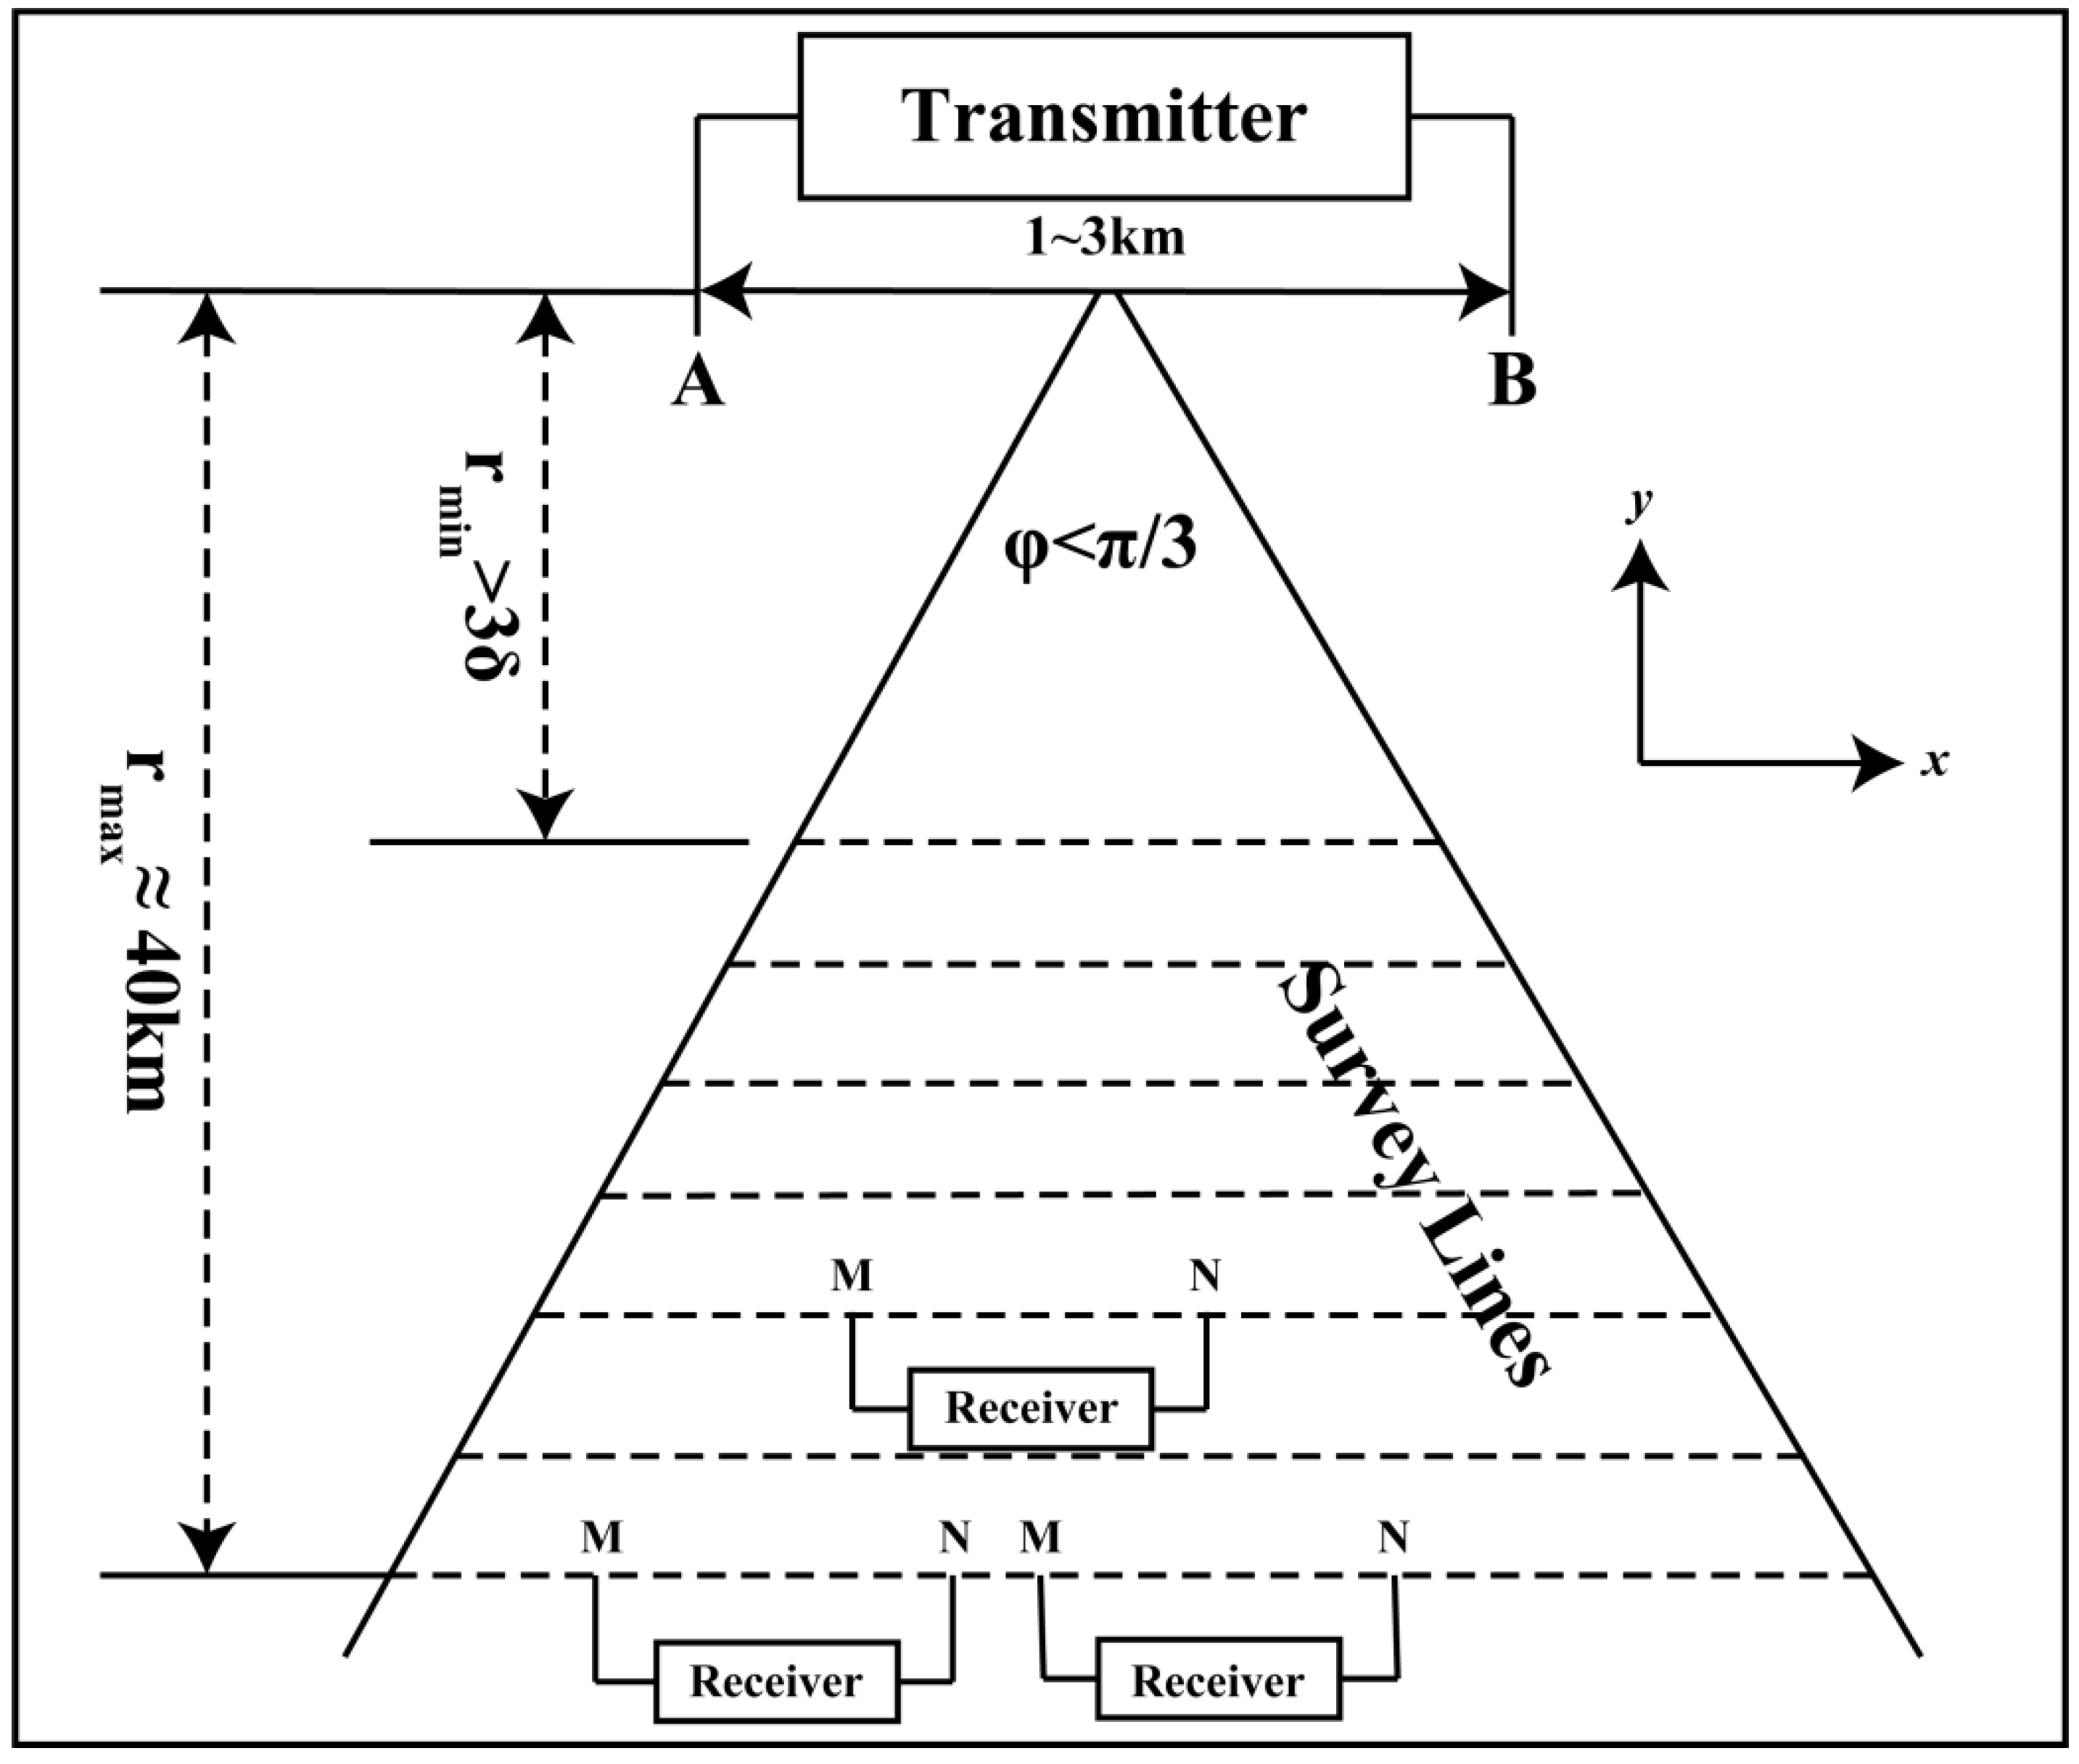
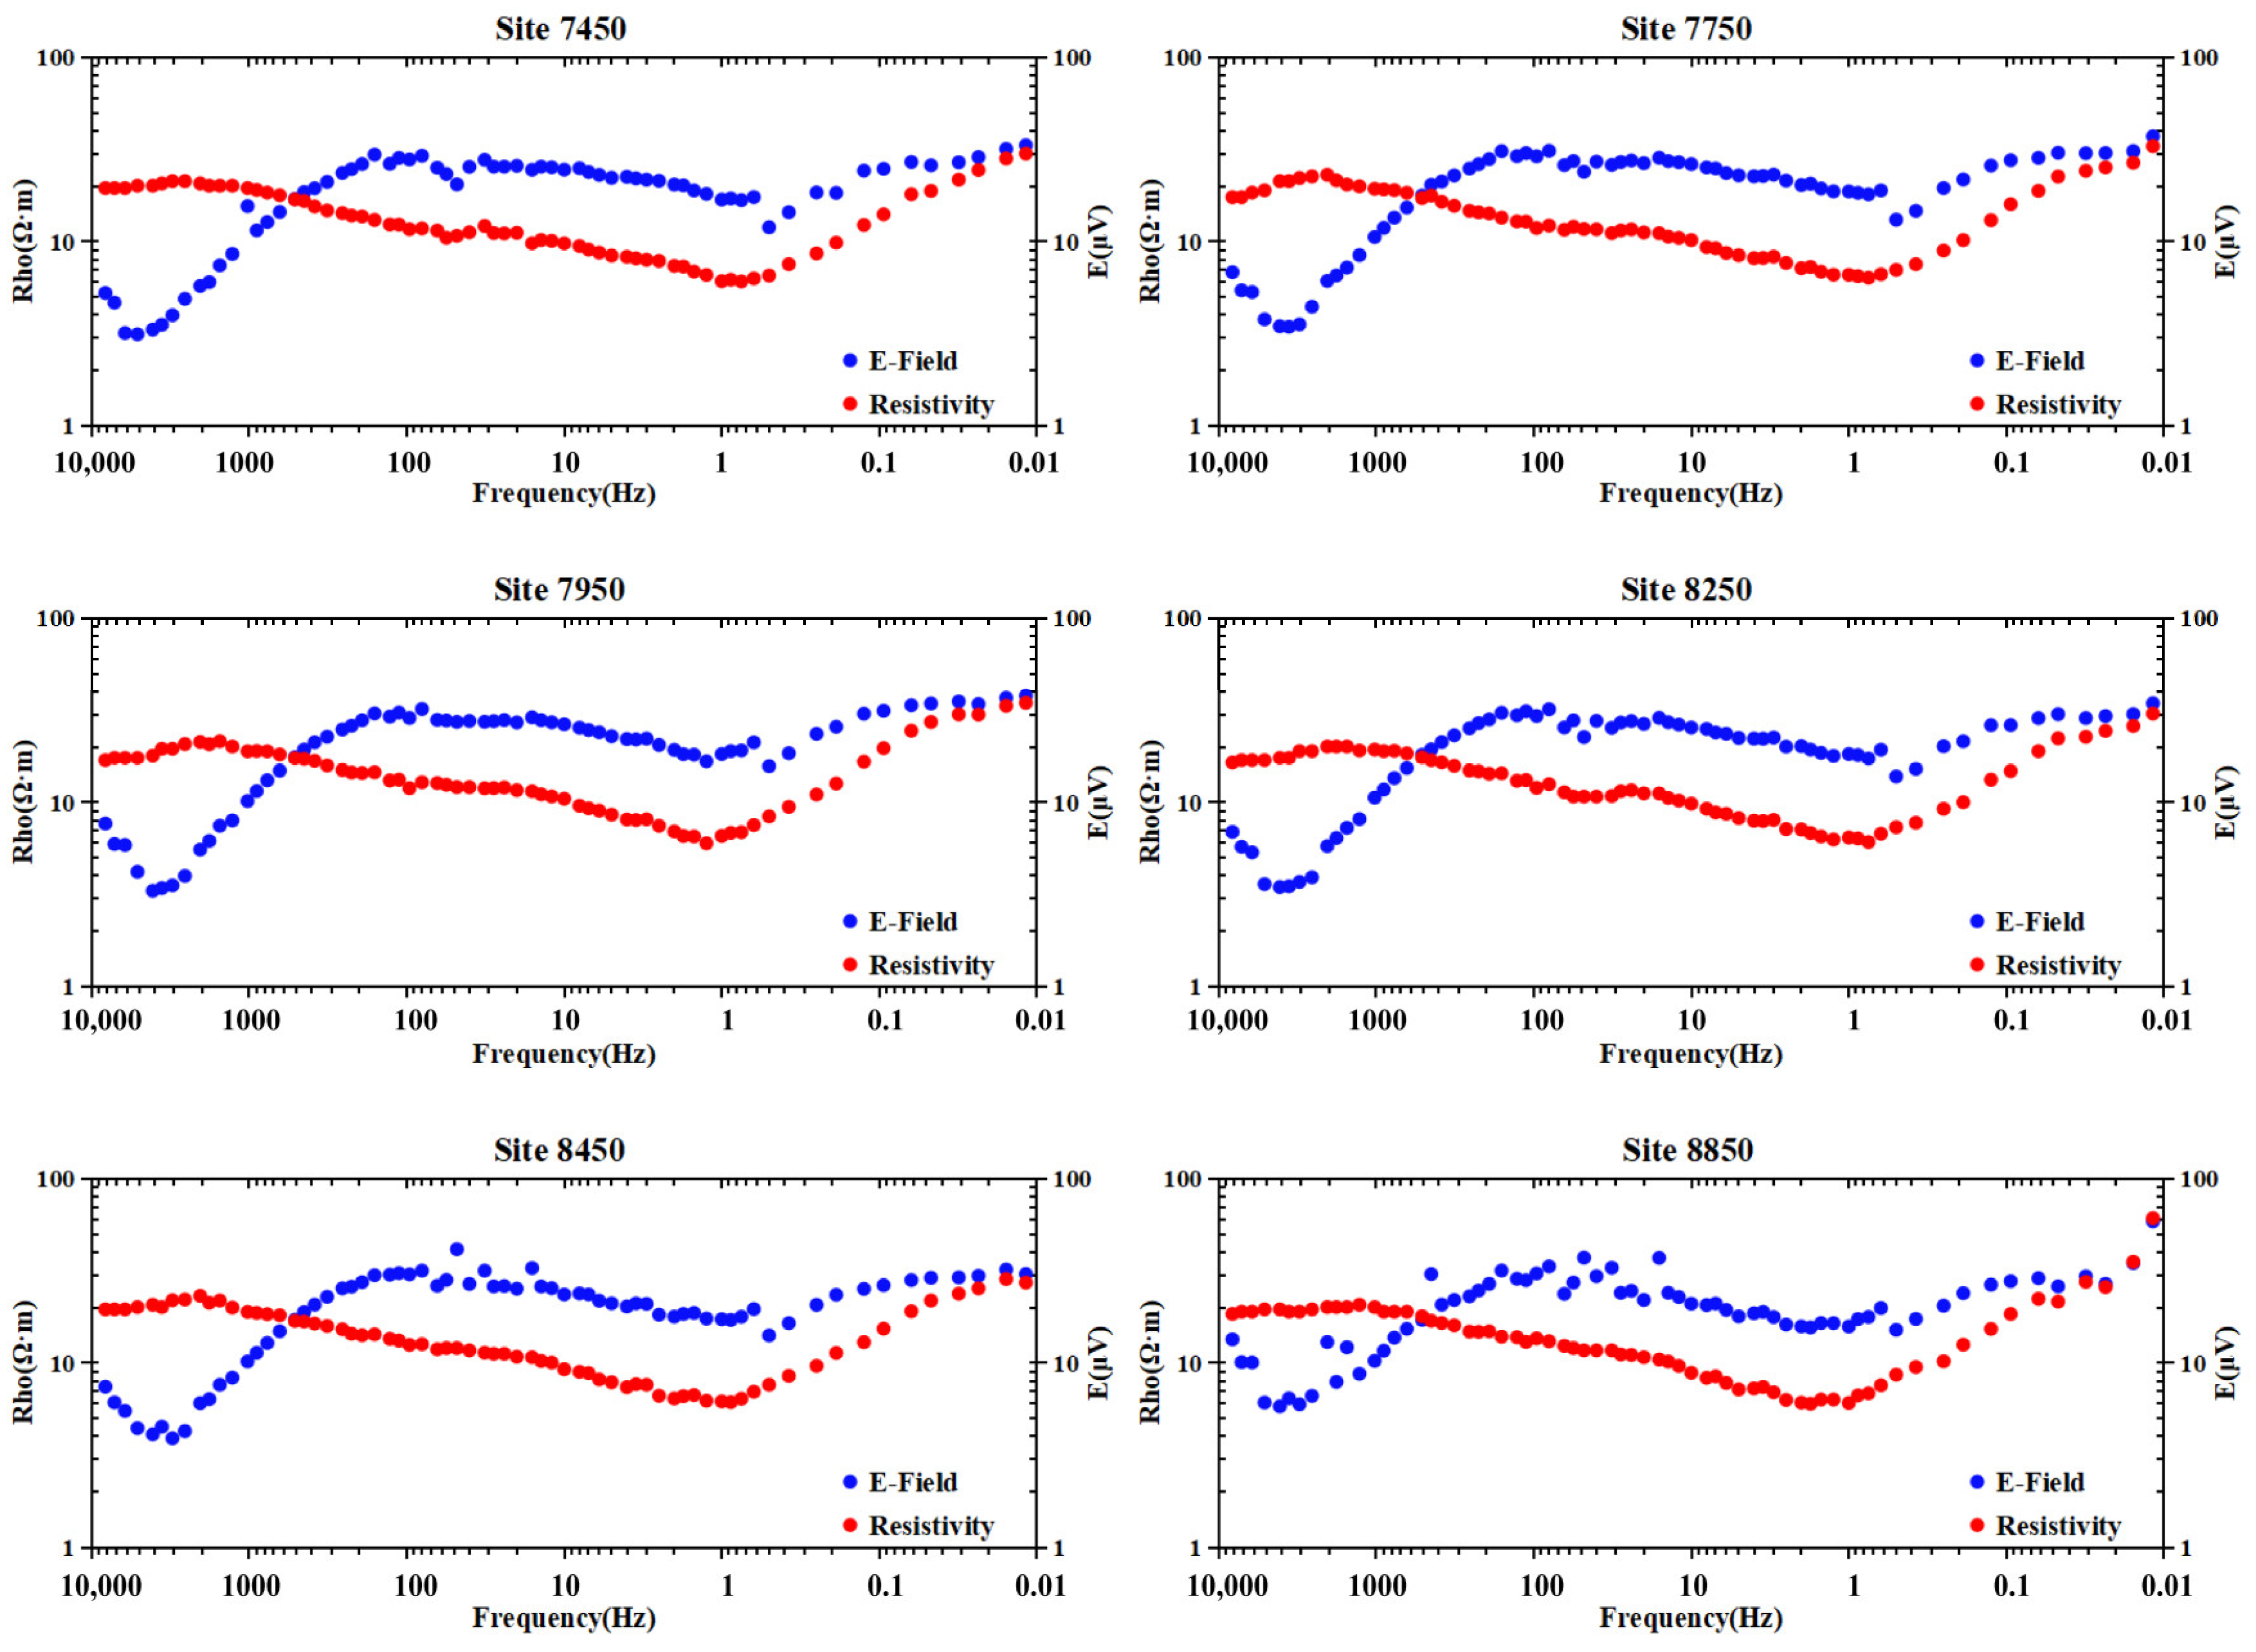
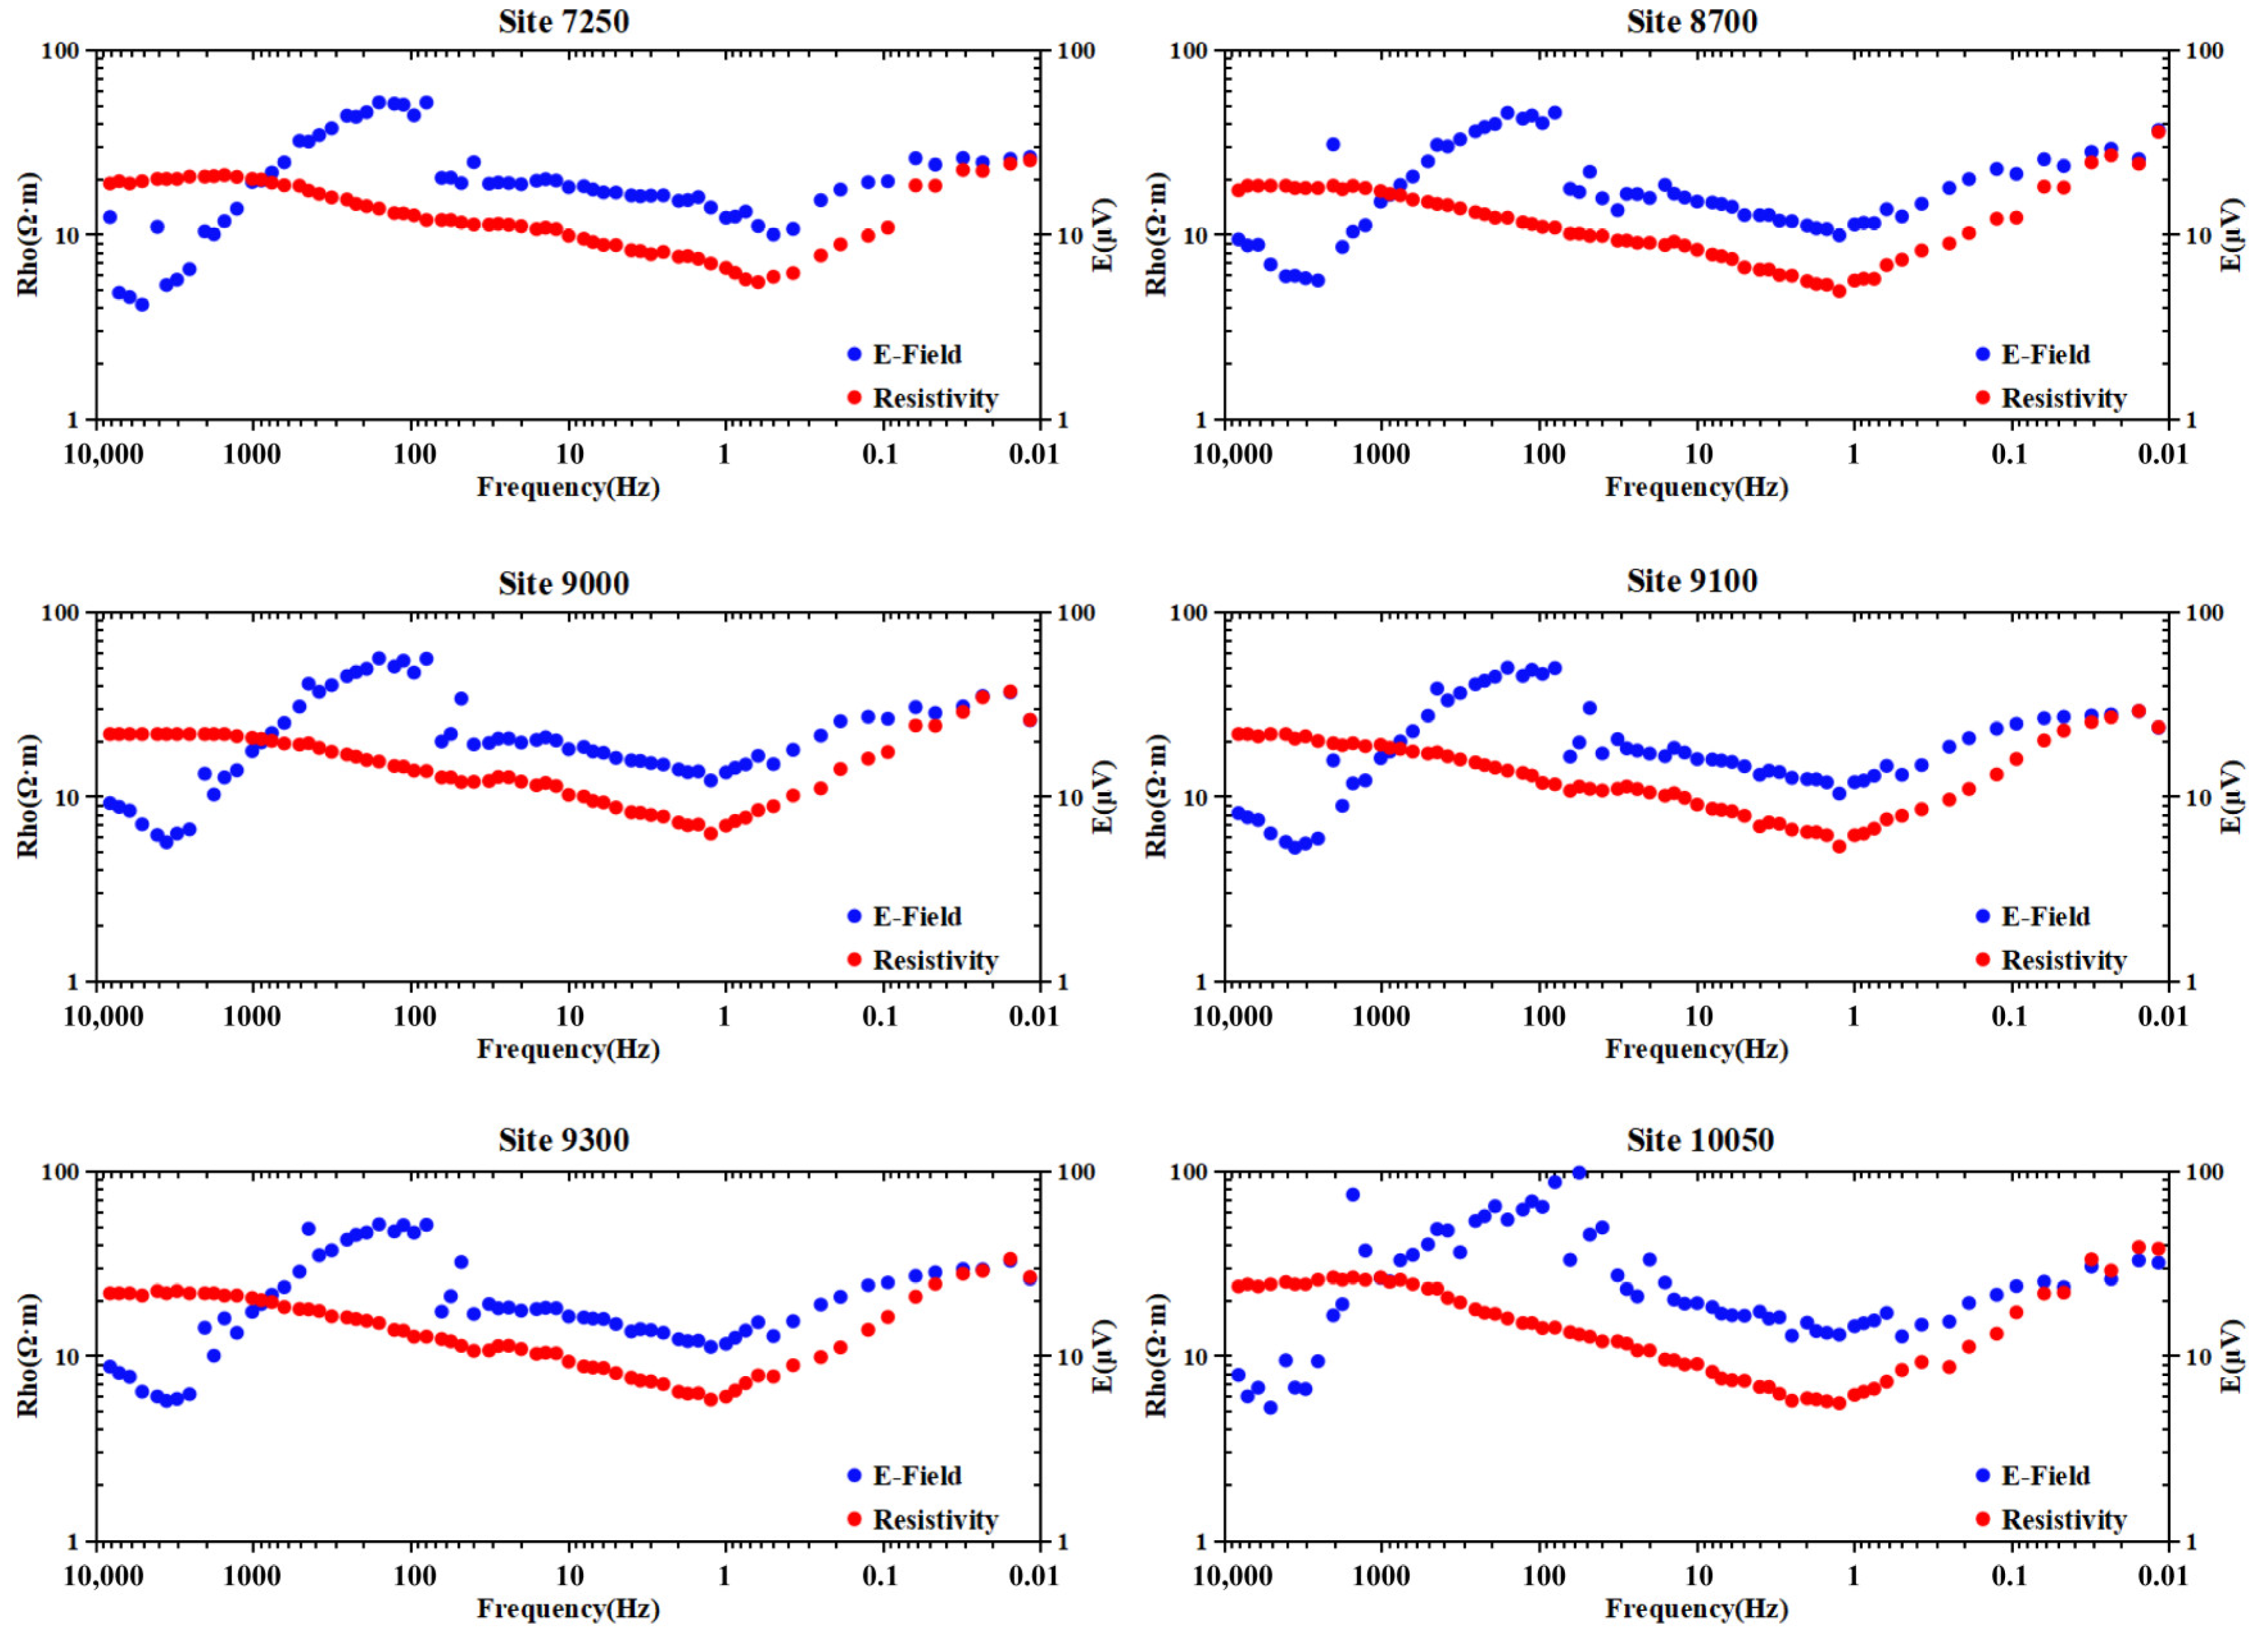
3.1. Data Acquisition

Two parallel WFEM profiles (PGY1 and PGY2) consisting of 105 sites were deployed in the key area delineated by gravity and magnetic methods, with lengths of 4.4 and 4.6 km, respectively, as shown in Figure 2b. The distance between two profiles is 200 m, and the azimuth of both is 90°. In this data acquisition, we used the E–Ex mode of the WFEM instrument, which has been widely used in field work [27]. The layout pattern is shown in Figure 3. Namely, the horizontal electric dipole sources formed by a pair of grounding electrodes are used as the field source to measure the horizontal component Ex of the electric field, which is expressed as follows [27,28]:
E x = I d L 2 π σ r 3 1 3 sin 2 φ + e i k r 1 + i k r
According to the above formula, the apparent resistivity formula for the EEx WFEM can be defined as follows:
ρ s = K E E x Δ V M N I 1 F E E x i k r
K E E x = 2 π r 3 d L M N ,   Δ V M N = E x M N
F E E x i k r = 1 3 sin 2 φ + e i k r 1 + i k r
where Ex represents the horizontal component of the electrical field; I represents the emission current; dL represents the length of the current dipole; σ represents the conductivity; r represents the transmit–receive distance; k represents the wave number; φ represents the azimuth angle; ρs represents the WFEM apparent resistivity; K E E x represents the geometrical coefficient only related to the geometry of the observing device ;  MN and Δ V M N represent the distance and the potential difference, respectively, between the electrodes M and N ;   F E E x i k r is known as the EEx electromagnetic response function of the WFEM.
Inconvenient traffic affects the progress of data collection, while unfavorable terrain conditions and frequent human activities would affect the quality of the WFEM data. The study area is located in the west plain of Shandong with an elevation of 22~29 m. In order to obtain reliable data, we set the transmit–receive distance of two survey lines as 9.21 (PGY1) and 9.41 km (PGY2), respectively, after comprehensive consideration of various factors. Meanwhile, the transmission cable was determined to be 1104.7 m, the maximum emission current was 138.7 A, and the maximum emission voltage was 900 V. Additionally, the electrode distance MN was 100 m, and the azimuth was 90.74°. According to the design requirements of target detection depth (3 km) and average geodetic resistivity (~100 Ω·m) of the study area, we adopted pseudo-random signals from 1 to 11 frequency groups as the transmitted signal. The frequency range used in our work was 0.01 Hz~8192 Hz, which contained 68 frequencies.

3.2. Data Processing
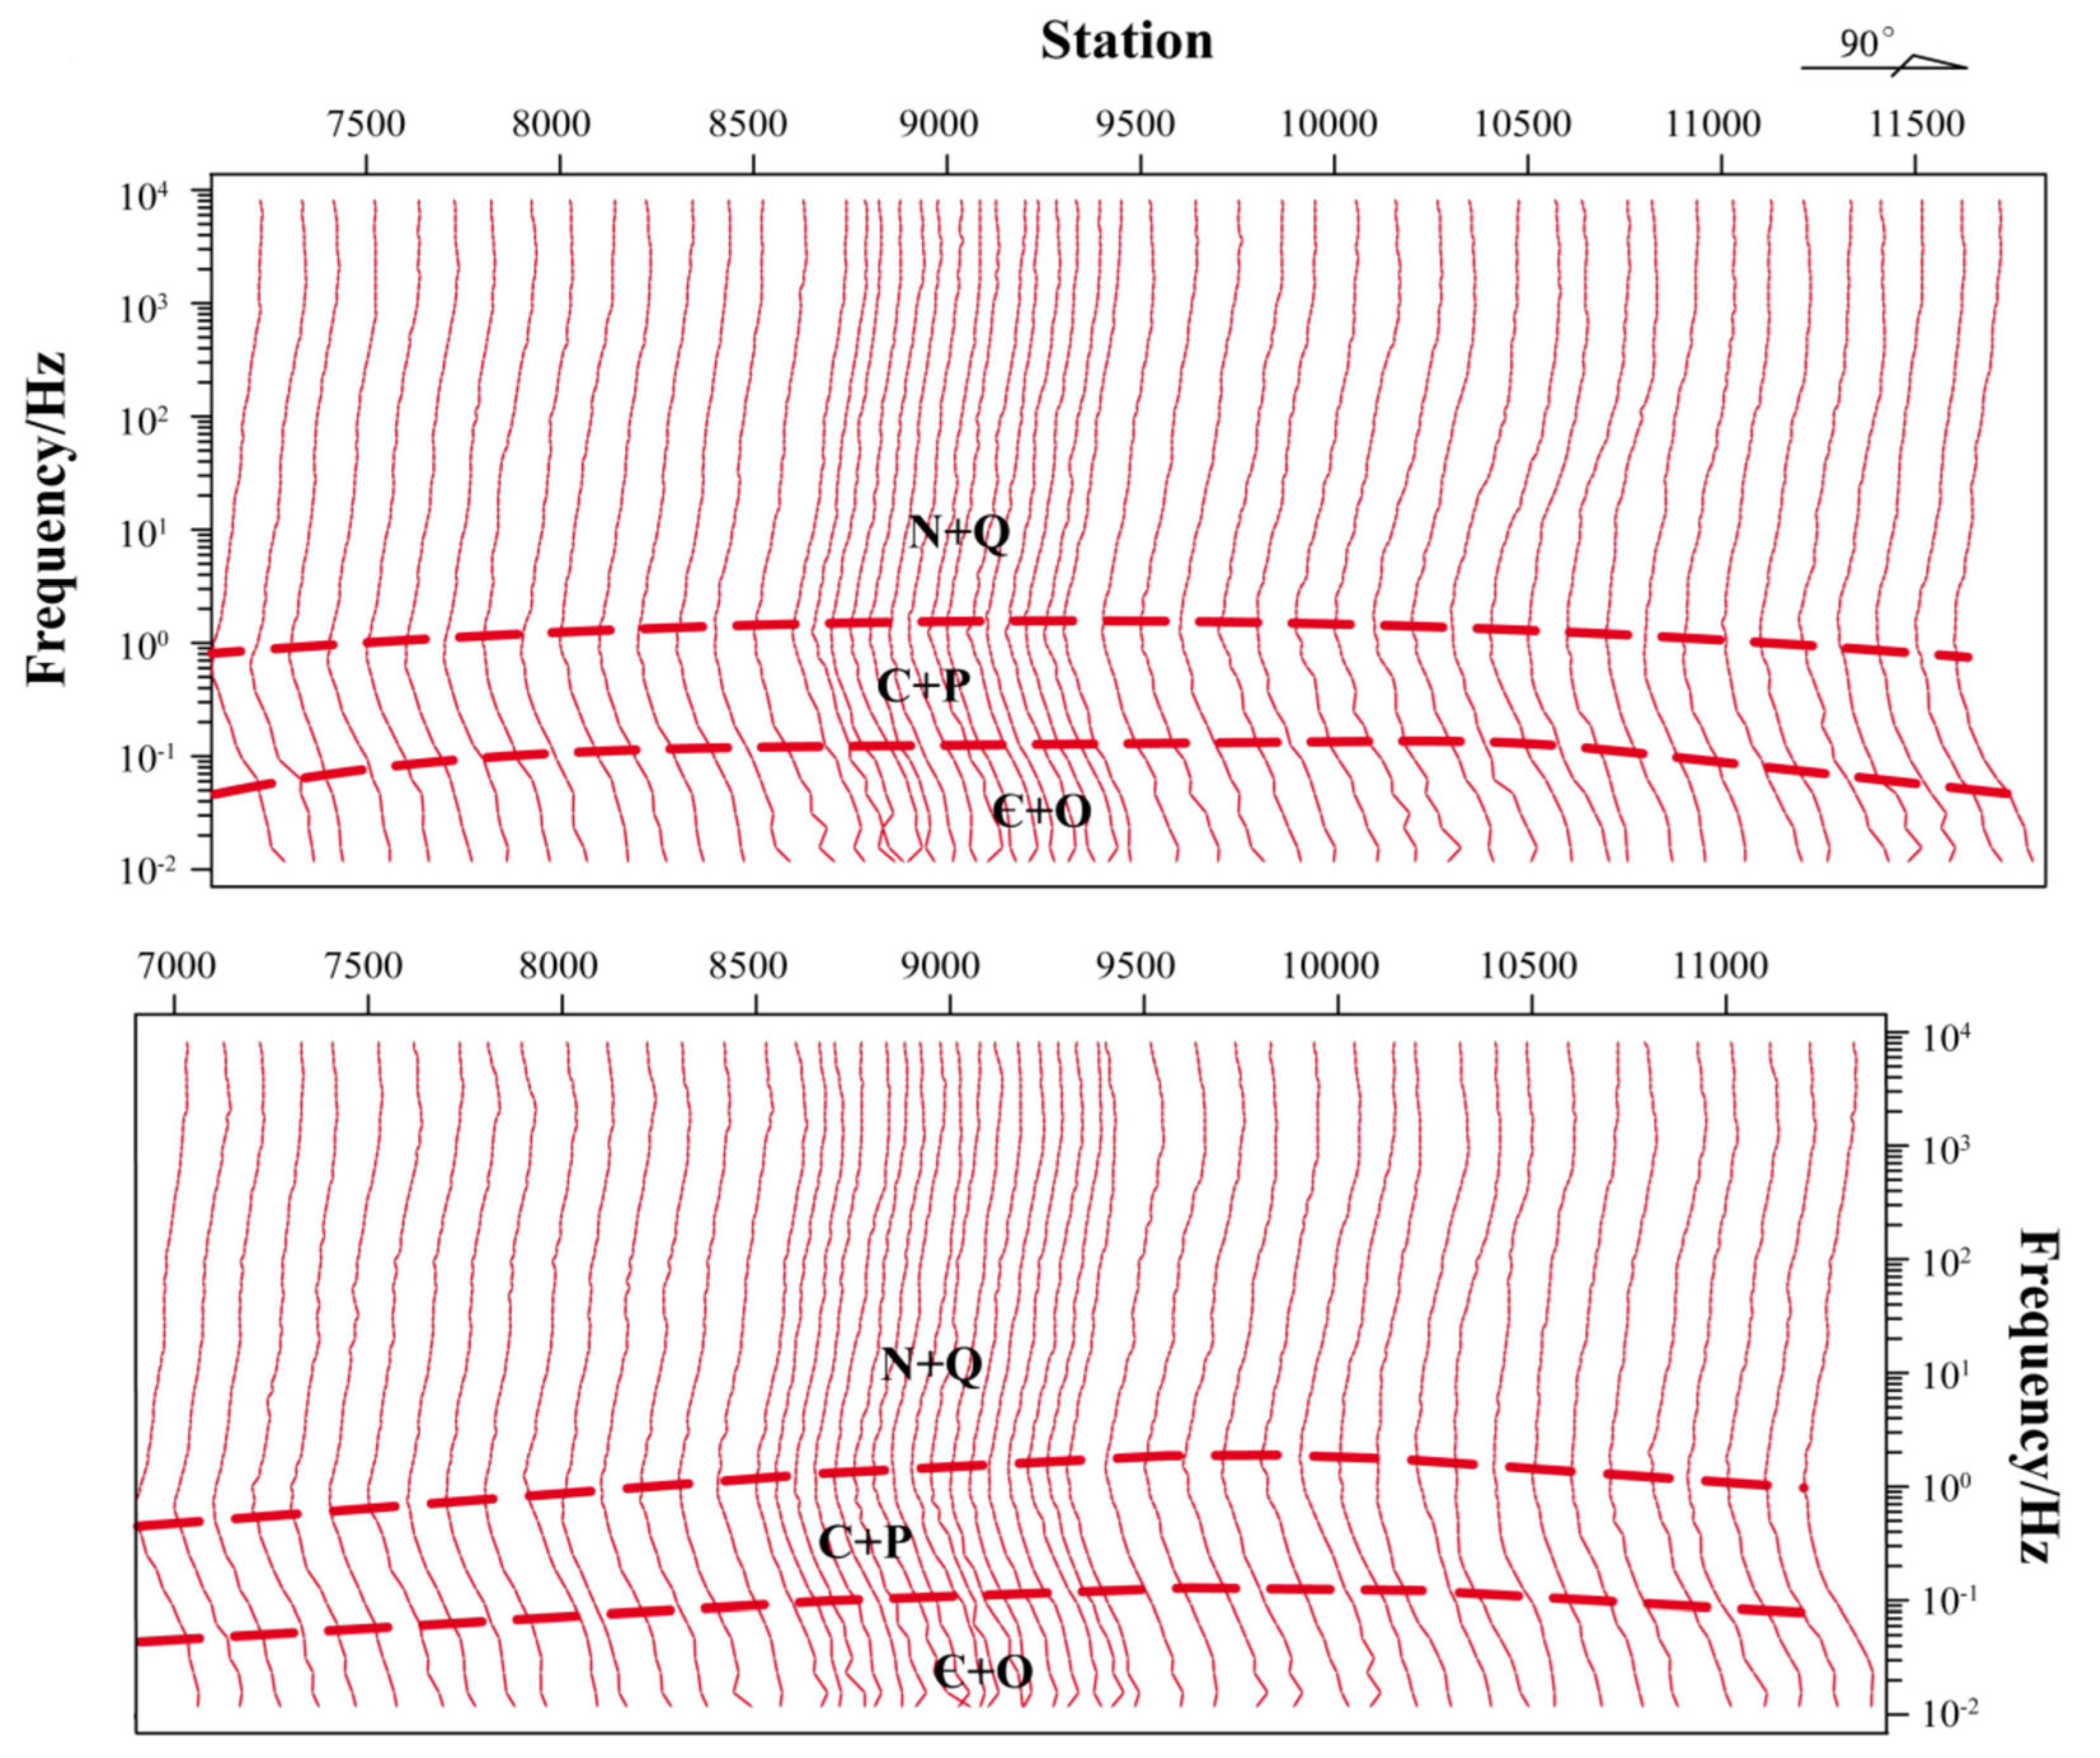
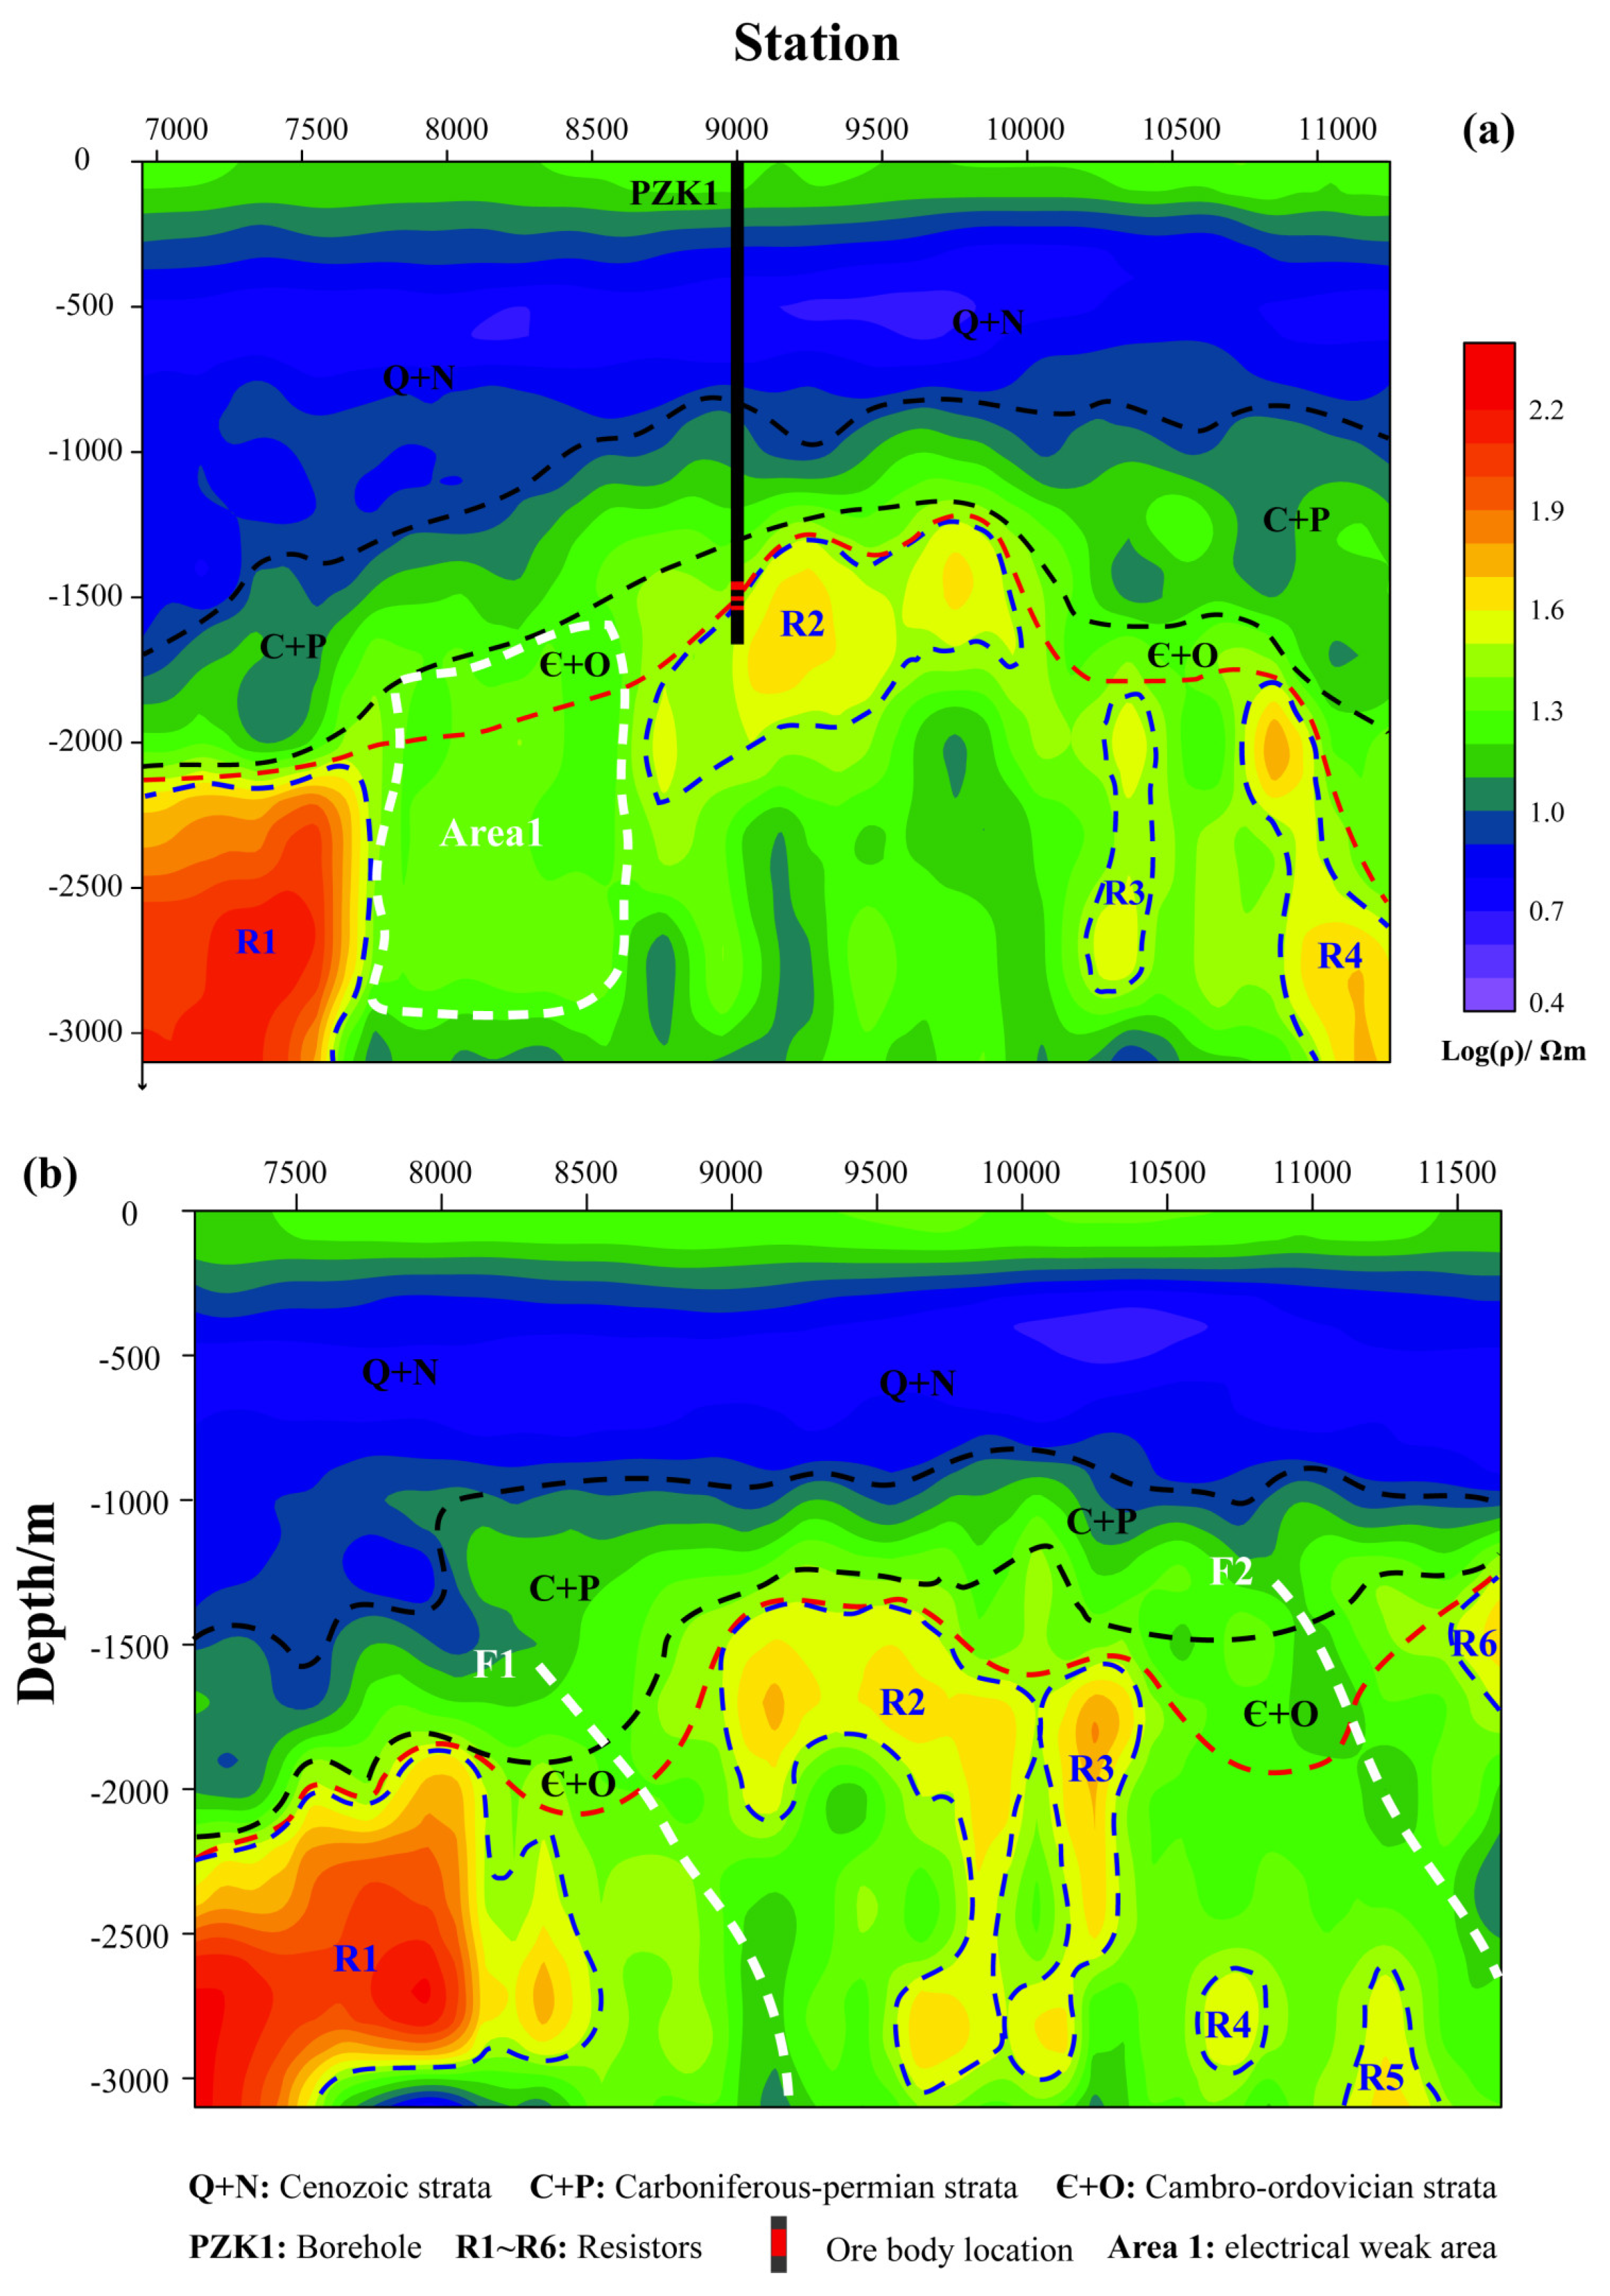
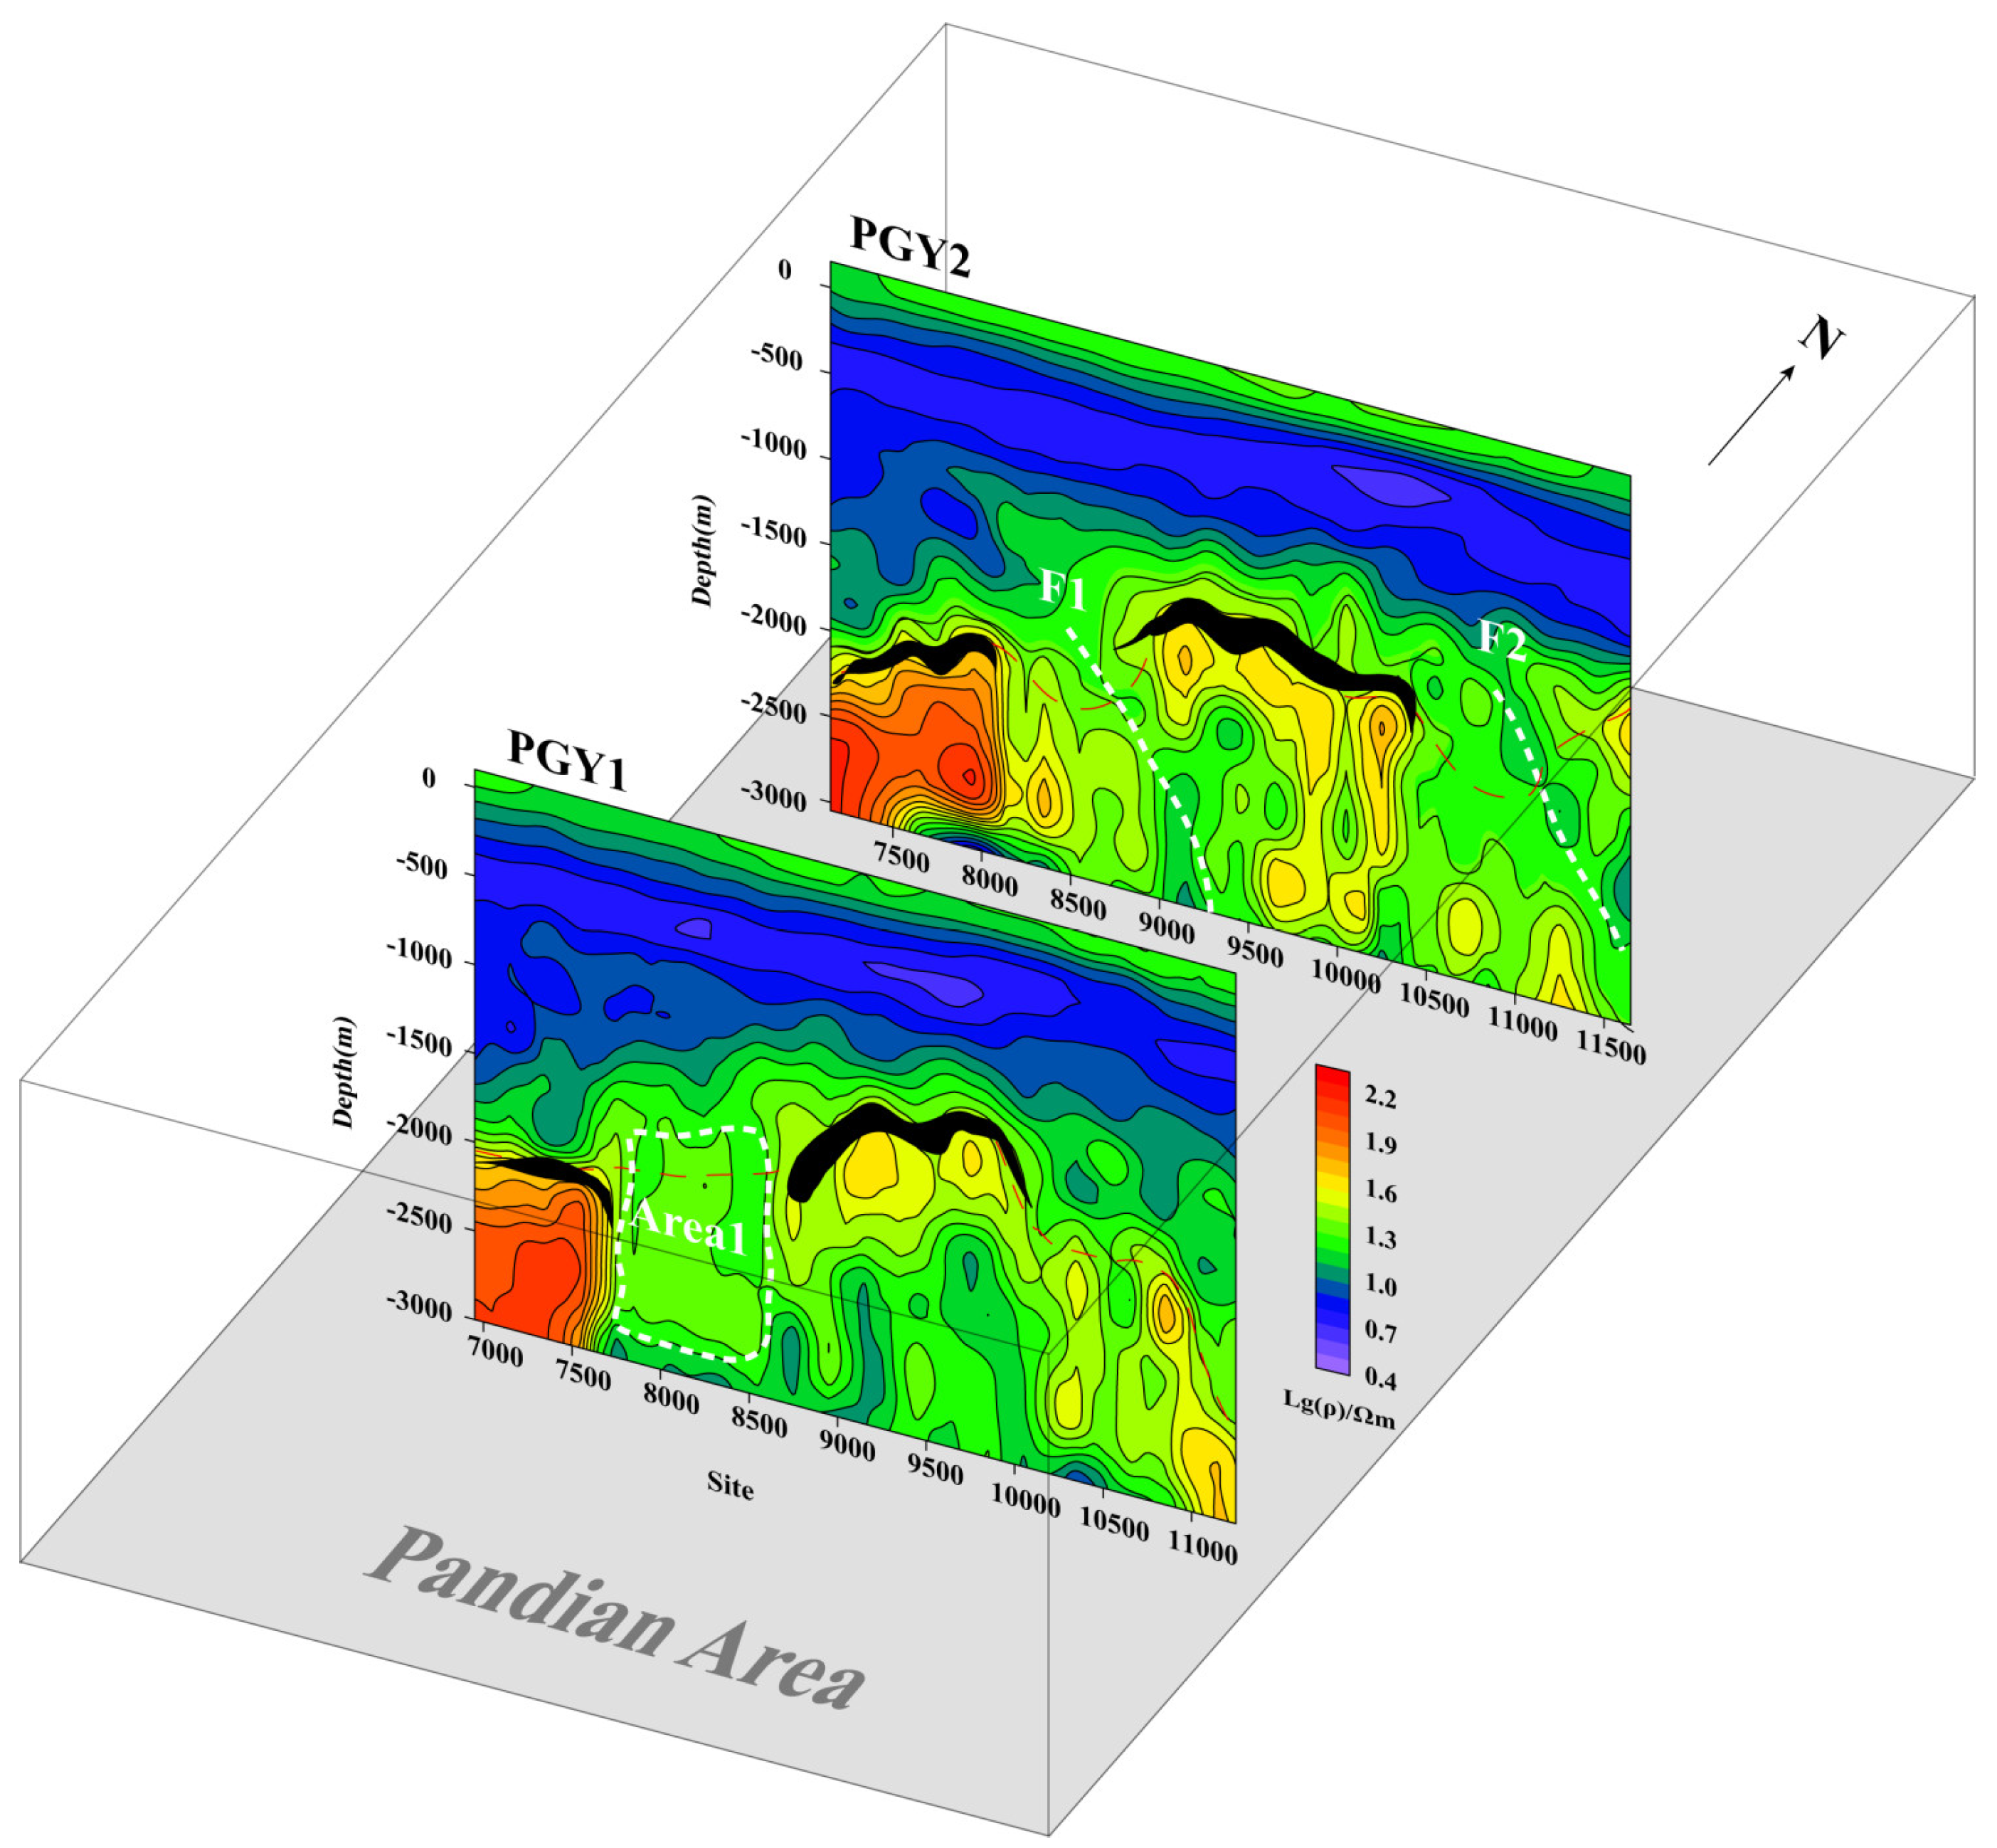
The data processing software of the JSGY-2 WFEM instrument receiver performed a series of processing on the WFEM data, including the synthesis of frequency group points, the processing of sites data, the composition of points and lines, and the apparent resistivity calculation. Then, denoising processing and static correction technology were adopted to obtain high-quality wide-field apparent resistivity data. The frequency–electrical field–apparent resistivity curves at representative sites of profile PGY1 (7450, 7750, 7950, 8250, 8450, 8850) and profile PGY2 (7250, 8700, 9000, 9100, 9300, 10050) were shown in Figure 4 and Figure 5, respectively. The quality of the data is validated by smooth and continuous curves, and there are no more than 3 consecutive distortion frequency points.
In addition, the overall apparent resistivity curves of both survey lines display that shape and trend of apparent resistivity curves at different stations are similar, with only local differences, as shown in Figure 6.
The curves can be divided into three parts, corresponding to different stratigraphic structures, respectively. The first one is relatively stable; the frequency ranged from 1 to 8192 Hz, associated with the super-thick overburden of the Cenozoic. The apparent resistivity curves show a slight decreasing trend with the increase in frequency. The curves of the second part have an obvious lifting from the low point upward, and the slope increases, which is consistent with the Paleozoic Carboniferous–Permian strata (frequency is between 0.1 and 1 Hz). The third part, as the high-resistance tail branch of the curves, belongs to the low-frequency band ranging from 0.01 to 0.1 Hz and carrying information from Cambrian–Ordovician strata.
In our research, the WFEM data are modeled by the 1D parallel constrained inversion of E-Ex WFEM based on analytical Jacobian matrix, and the staring model is the uniform half space [40]. After 15 iterations, the WFEM apparent resistivity models of the two arrays in the Pandian area are obtained with an RMS misfit of 3.78% (less than 5%), and the corresponding apparent resistivity response curves are shown in Figure 7. The calculated results fit well with the measured data according to the above results, especially the high-frequency data above 1 Hz. Thus, the inversion results are reliable.

4. Electrical Model

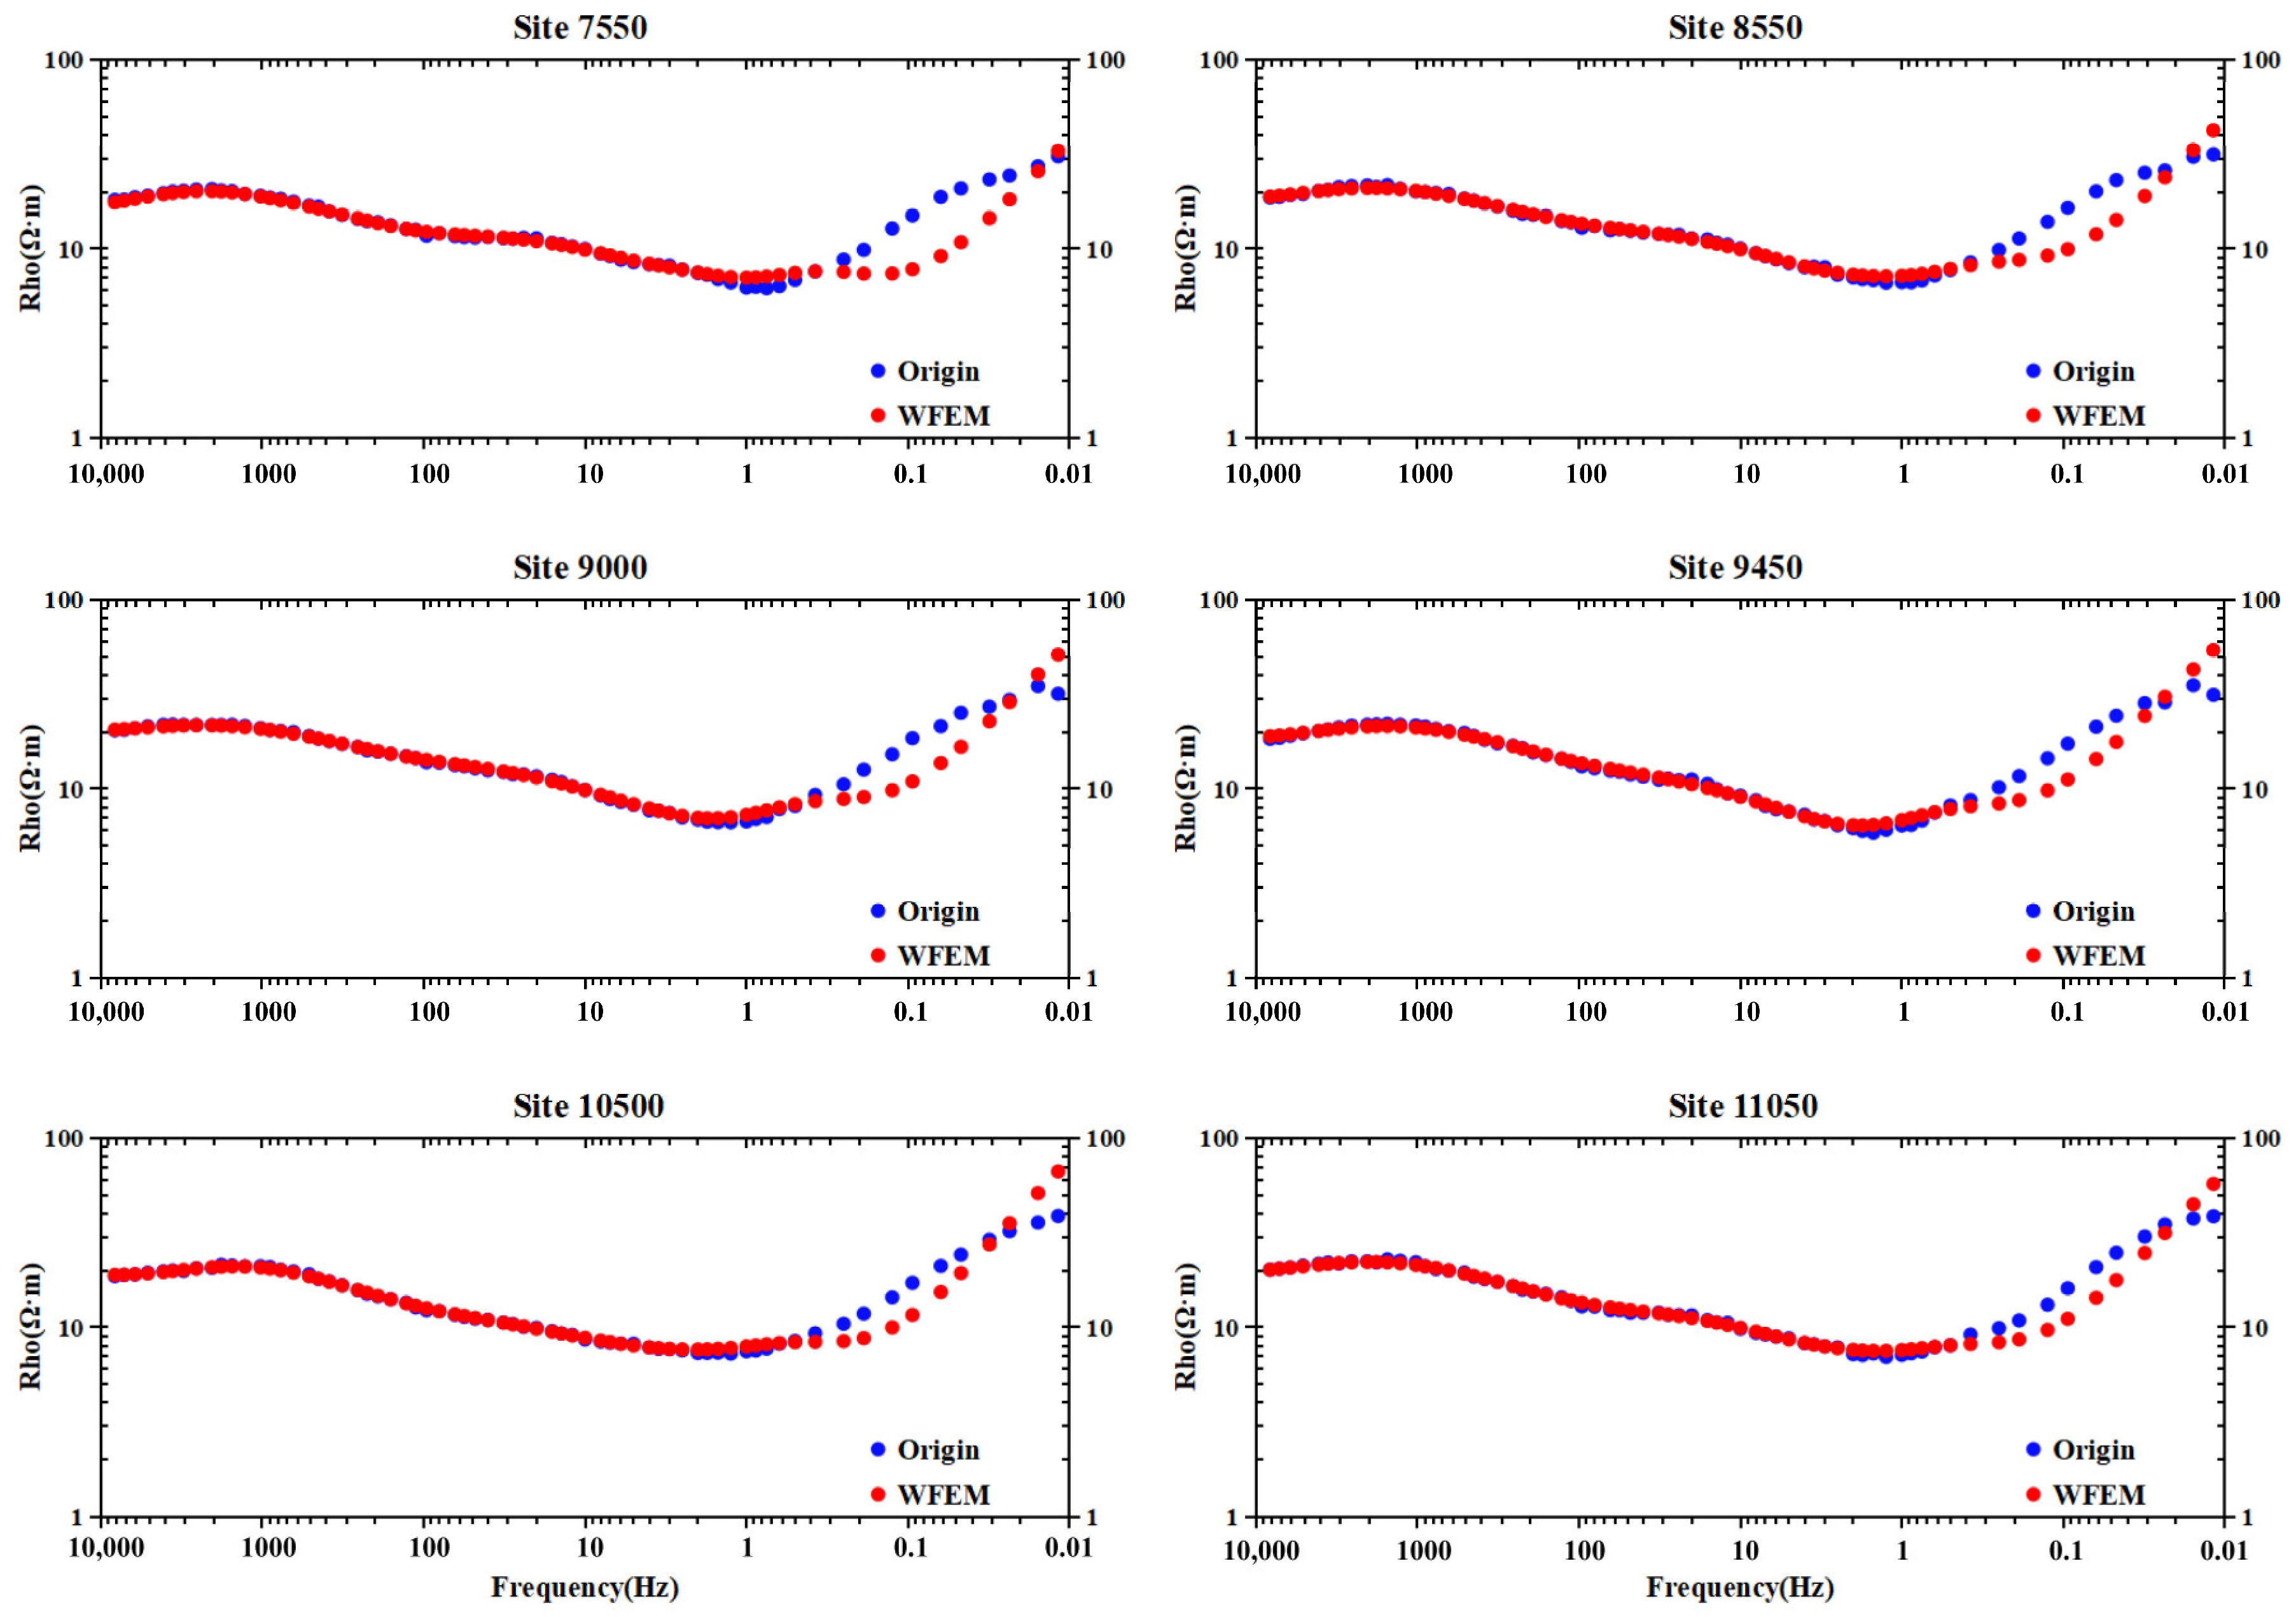
4.1. Feasibility Analysis

As previous studies have shown, the electrical characteristics revealed by the WFEM were close to the core test in Jiaodong, Zhuxi, Longkou and other areas where magmatic rocks were strongly developed near the surface [30,41]. However, the super-thick overburden near the surface meant that the overall resistivity gained by the inversion results was much lower than the true resistivity value. For example, the diorite exposed by PZK1 showed a resistivity of 6000 Ω·m~30,000 Ω·m, while the electrical models through inversion showed a resistivity of 40 Ω·m~85 Ω·m, as shown in Figure 8. Likewise, the inversion results based on the WFEM in the Litun area have a similar lower resistivity compared with the Pandian area [42]. What’s more, there was a similar phenomenon between the inversion results by MT data and the core test in the Pandian. Therefore, we speculate the Cenozoic ultra-thick overburden has a strong shielding effect on the high-resistivity information underground.
Based on these facts, the WFEM method is still promising to obtain the relative abnormal information of deep strata to further reveal fine structure information, such as stratigraphic boundaries, lithologic fracture/alteration zones and the top interface of Pandian rock. Moreover, the locations of the ore bodies discovered in PZK1 corresponds to the transition zones between the high-resistance areas and low-resistance areas in the inversion results, which is the same as the previous inference that the favorable place for mineralization is the contact areas between the deep diorite and Ordovician limestone [11,12]. The formation boundary information revealed by PZK1 also has a good relationship with the stratification of electrical models. Therefore, it is still reliable to infer the possible tectonic information of deep strata in the Pandian area based on the known electrical models.

4.2. Geological Interpretation

The 2D resistivity models of PGY1 and PGY2 are shown in Figure 8, revealing that the overall electrical structures of the Pandian area have obvious layered characteristics, especially in the shallow strata above −1500 m. Cenozoic strata are characterized by low resistivity (<8 Ω·m), mainly composed of low-resistivity clays, sandstones and mudstones. At the depth range of −811.08 to −1473.64 m, Carboniferous–Permian (C-P) strata show the characteristics of the electric field step belt where the resistivity ranges from 9 to 28 Ω·m. They are mainly composed of fine sandstone, siltstone, quartz sandstone, argillaceous siltstone and silty mudstone, which mostly developed low-resistance pyrite alteration. Cambrian–Ordovician (є-O) strata are the main occurrence strata of high-conductivity ore bodies, dominated by high-resistance limestone and the Late Mesozoic Yanshanian intrusive rock. Ordovician limestone around the magnetite ore bodies is thin-bedded. The contact metasomatism that occurred during the magmatic intrusion, associated with low-resistance skarn alteration, results in the high-resistance abnormal phenomenon of the limestone being hard to be reflected. PZK1 disclosed large thickness and high-grade skarn magnetite in −1444.44 m~−1542.19 m, which correspond to the edge area of local low-resistance bodies (~25 Ω·m) in the electrical model. The favorable areas of mineralization inferred are exhibited as an obvious local depression about the apparent resistivity isolines. According to PZK1, the distribution range of the diorite is below −1571.36 m, and the apparent resistivity value is generally greater than 40 Ω·m and up to 85 Ω·m.
The two profiles named PGY1 and PGY2 had a close layout location, start–end position and the same orientation. Moreover, similar geological and geophysical characteristics are also shown in the electrical models, such as the thickness of various stratum and the buried depth of the Pandian rock. Nevertheless, there are still local differences between them. In the resistivity model of profile PGY2, the surface projection positions corresponding to similar electrical anomaly characteristics are generally shifted eastward compared with that of PGY1. On the other hand, the high-resistance block marked R1 in PGY2 has a larger distribution range than that in PGY1. The eastern tail of high-resistance block R2 extends to −3000 m, and the longitudinal extension range of R3 (up to 100 Ω·m) also increases, which means that the anomaly range of PGY2 increases obviously compared with that of PGY1. However, the abnormal distribution range of high-resistance block R4 is greatly reduced, and the apparent resistivity value is also decreased. In addition, the high-resistance blocks R5 and R6 are revealed on the bottom and the eastern boundary of the electrical model of PGY2, respectively, but not in the PGY1 electrical model. Therefore, based on the locations and the variation trends of the distribution range around the abnormal bodies on the two profiles, we concluded that the buried depth of the top interface of the Pandian rock is about 1300 m, with the strike being roughly NNE7°.
Ordovician and Carboniferous–Permian strata influenced by the intrusion of magmatic rocks are uplifted locally in the region, overlying the Pandian rock. As illustrated in the resistivity models (Figure 8), strong inhomogeneity was found in Pandian rock beneath the shallow layers. Along the orientation of the profiles, there are multiple discontinuous high-resistivity blocks (R1, R2, R3, R4, etc.) distributed from west to east, which may reflect the unaltered diorite. The resistivity of the transition areas besieging the high-resistivity blocks are relatively low (10 Ω·m~32 Ω·m), which may mean that their formation is related to the development of sulfide-bearing rocks, such as hornblende diorite, hornblende-quartz diorite and diorite with tremolitization and epidotization. Specifically, a certain range of weak zone (Area 1) appears in the corresponding rock position below the stations marked 8000–8500 on the electrical model of PGY1. At the same time, the inversion result of PGY2 revealed two electrical weakness belts (F1 and F2) both with inclinations of ~ 60° in the interior of the Pandian rock under sites 8500 and 11,000, respectively. In combination with the known regional gravity–magnetic and geological data, we suggested that the formation of those weak zones may be concerned with lithologic alteration during the contact metasomatic process or rock fragmentation during regional extensional tectonics.
Following previous studies, the resistivity of pyrite, pyrrhotite and other metal sulfides is about 0.1~1 Ω·m, which denoted that a small amount of sulfide can significantly reduce the resistivity value of the whole rock [43]. As described, the widely distributed siltstone, quartz sandstone, argillaceous siltstone, silty mudstone, aplite and other rocks have a certain degree of pyritization and a small amount of pyrrhotite mineralization in our study area. Therefore, the high-resistivity characteristic of those rocks is seriously weakened. Moreover, the existing drilling information indicated that the rocks near the contact zones between the intrusive rocks and strata are relatively broken. Notably, the proven ore bodies are located in the electrical gradient zone to the east of F1. Given the spatial location relationship, the reflection of the lithologic alteration/structural fracture zones would be a feasible explanation for the middle-resistance transition areas.

5. Discussion

The resistivity characteristics of typical magnetite systems varies depending on alteration degrees and different types of deposits. For example, the alteration zones are formed under specific temperature and salinity conditions, so the space and depth of each alteration zone differs significantly for different deposits [44]. Accordingly, we made a metallogenic prediction for the Pandian deposit and discussed the metallogenic mechanism of this area.

5.1. Alteration Characteristics

The results of the physical property test based on borehole data verified that the lithologic alteration in the contact areas between the high-resistance diorite and Ordovician limestone have distinct zoning characteristics, with formation closely related to the modes and intensity of the contact metasomatism during mineralization [11,12]. In addition, several studies have reported there are certain exclusive relationships between alteration and mineralization. For example, skarnization is bound up with iron ore, while chloritization has an intense correlation with the formation of metal sulfide. The lithologic alteration can reflect the approximate location of ore bodies to a certain extent [45]. Therefore, studying the alteration zonation of the ore-forming bodies and wall rocks are of great guiding significance to metallogenic prediction in this Pandian area.
In the metallogenic core region, magnetite alternates with marble, which were metamorphic from carbonate rocks, with fine-grained disseminated pyritization and scattered epidotization that can be seen, locally. There are studies which testify that a small amount of sulfide can tremendously lower the resistivity of this rock mass [44]. The relatively low-resistance areas around the proved ore bodies are ~15–30 Ω·m, which are inferred to contain sulfide with a relatively high content or good connectivity. Combined with the actual geological conditions and the known borehole information, it is speculated that they may represent the alteration areas of skarnization and chloritization, containing pyrite and a little pyrrhotite. Moreover, one of the factors causing the electrical heterogeneity in the rock mass may also be closely related to the high-conductivity pyritization and pyrrhotite mineralization. In reality, the proven magnetite of the Pandian district is mostly located at the junction zones of high-resistivity intrusive rocks and the relatively high-resistivity skarn zones, which could be profitable positions for mineralization.
Extending from the positions of ore bodies to the surface, the rocks with silty–argillaceous structures develop relatively strong horniness, which made the rock texture denser and harder. The obvious porcelain formations in the cross section of those rocks made the resistivity of the shallow strata greatly reduce. Tremolite and chloritization alteration generally occurred in hornblende minerals, in which the pyrite was generally disseminated, lumpy and banded distribution in siltstone, with slight brass mineralization that can be seen locally, further making its high-conductivity characteristics more obvious. From ore bodies to deeper strata, alterations included skarnization, tremolitization and epidotization developed in sequence. The recrystallization of minerals near the ore bodies was apparent, and the high-resistance characteristics of the protolith were severely weakened. As a whole, the alteration zoning features in the Pandian region are rendered as tremolostone-chloritization, hornification, magnetite, skarnization and tremolitization–epidotization, sequentially.

5.2. Metallogenic Prediction

Previous achievements indicated that the interlaminar peeling, interlayer fracture zones and structural fissures between different lithologies and strata were of vital importance for controlling skarn mineralization [15]. Around the magnetite in the Pandian deposit, there were extensive surrounding rocks alterations, such as skarnization, chloritization, brecciation, pyritization and so on. As shown in Figure 8, these alteration zones show mid-high resistivity characteristics, which are the same as that of the ore bodies. Moreover, the hydrothermal alterations included skarnization and chloritization developing in the rocks and strata, which are direct evidences indicating their metallogenic potential [9]. According to the known information on lithologic structures and physical properties, the metallogenic locations can be predicted in the areas where ore bodies are not found in the borehole but lithologic alteration has developed.
As determined in this work, we have obtained reliable electrical data from the strata in the Pandian area above 3000 m via the WFEM method. Considering the electrical difference and metallogenic geological conditions of the district, magnetite is mainly distributed in the contact zones between the intrusive rocks and Ordovician limestone [8]. The ore bodies are distinguished by medium-high resistivity (~25 Ω·m) and generate the local depression area near the resistivity gradient belts, as shown in Figure 8. Furthermore, Wang et al. (2021) suggested that the contact zones between the western part of the Pandian rock mass and the thin Ordovician remnant layers, corresponded to the gravity–magnetic anomaly bulge zones, which were the target areas of prospecting [13]. All things considered, it is speculated that when magnetite has a certain scale, the ore occurrence locations show the physical characteristics of “high-density, high-magnetic and medium-high resistance”. Therefore, based on the existing lithology, geological structures and physical property information, we can delineate the general scope and spatial distribution of favorable prospecting target areas and provide qualitative constraints for metallogenic prediction (Figure 9).

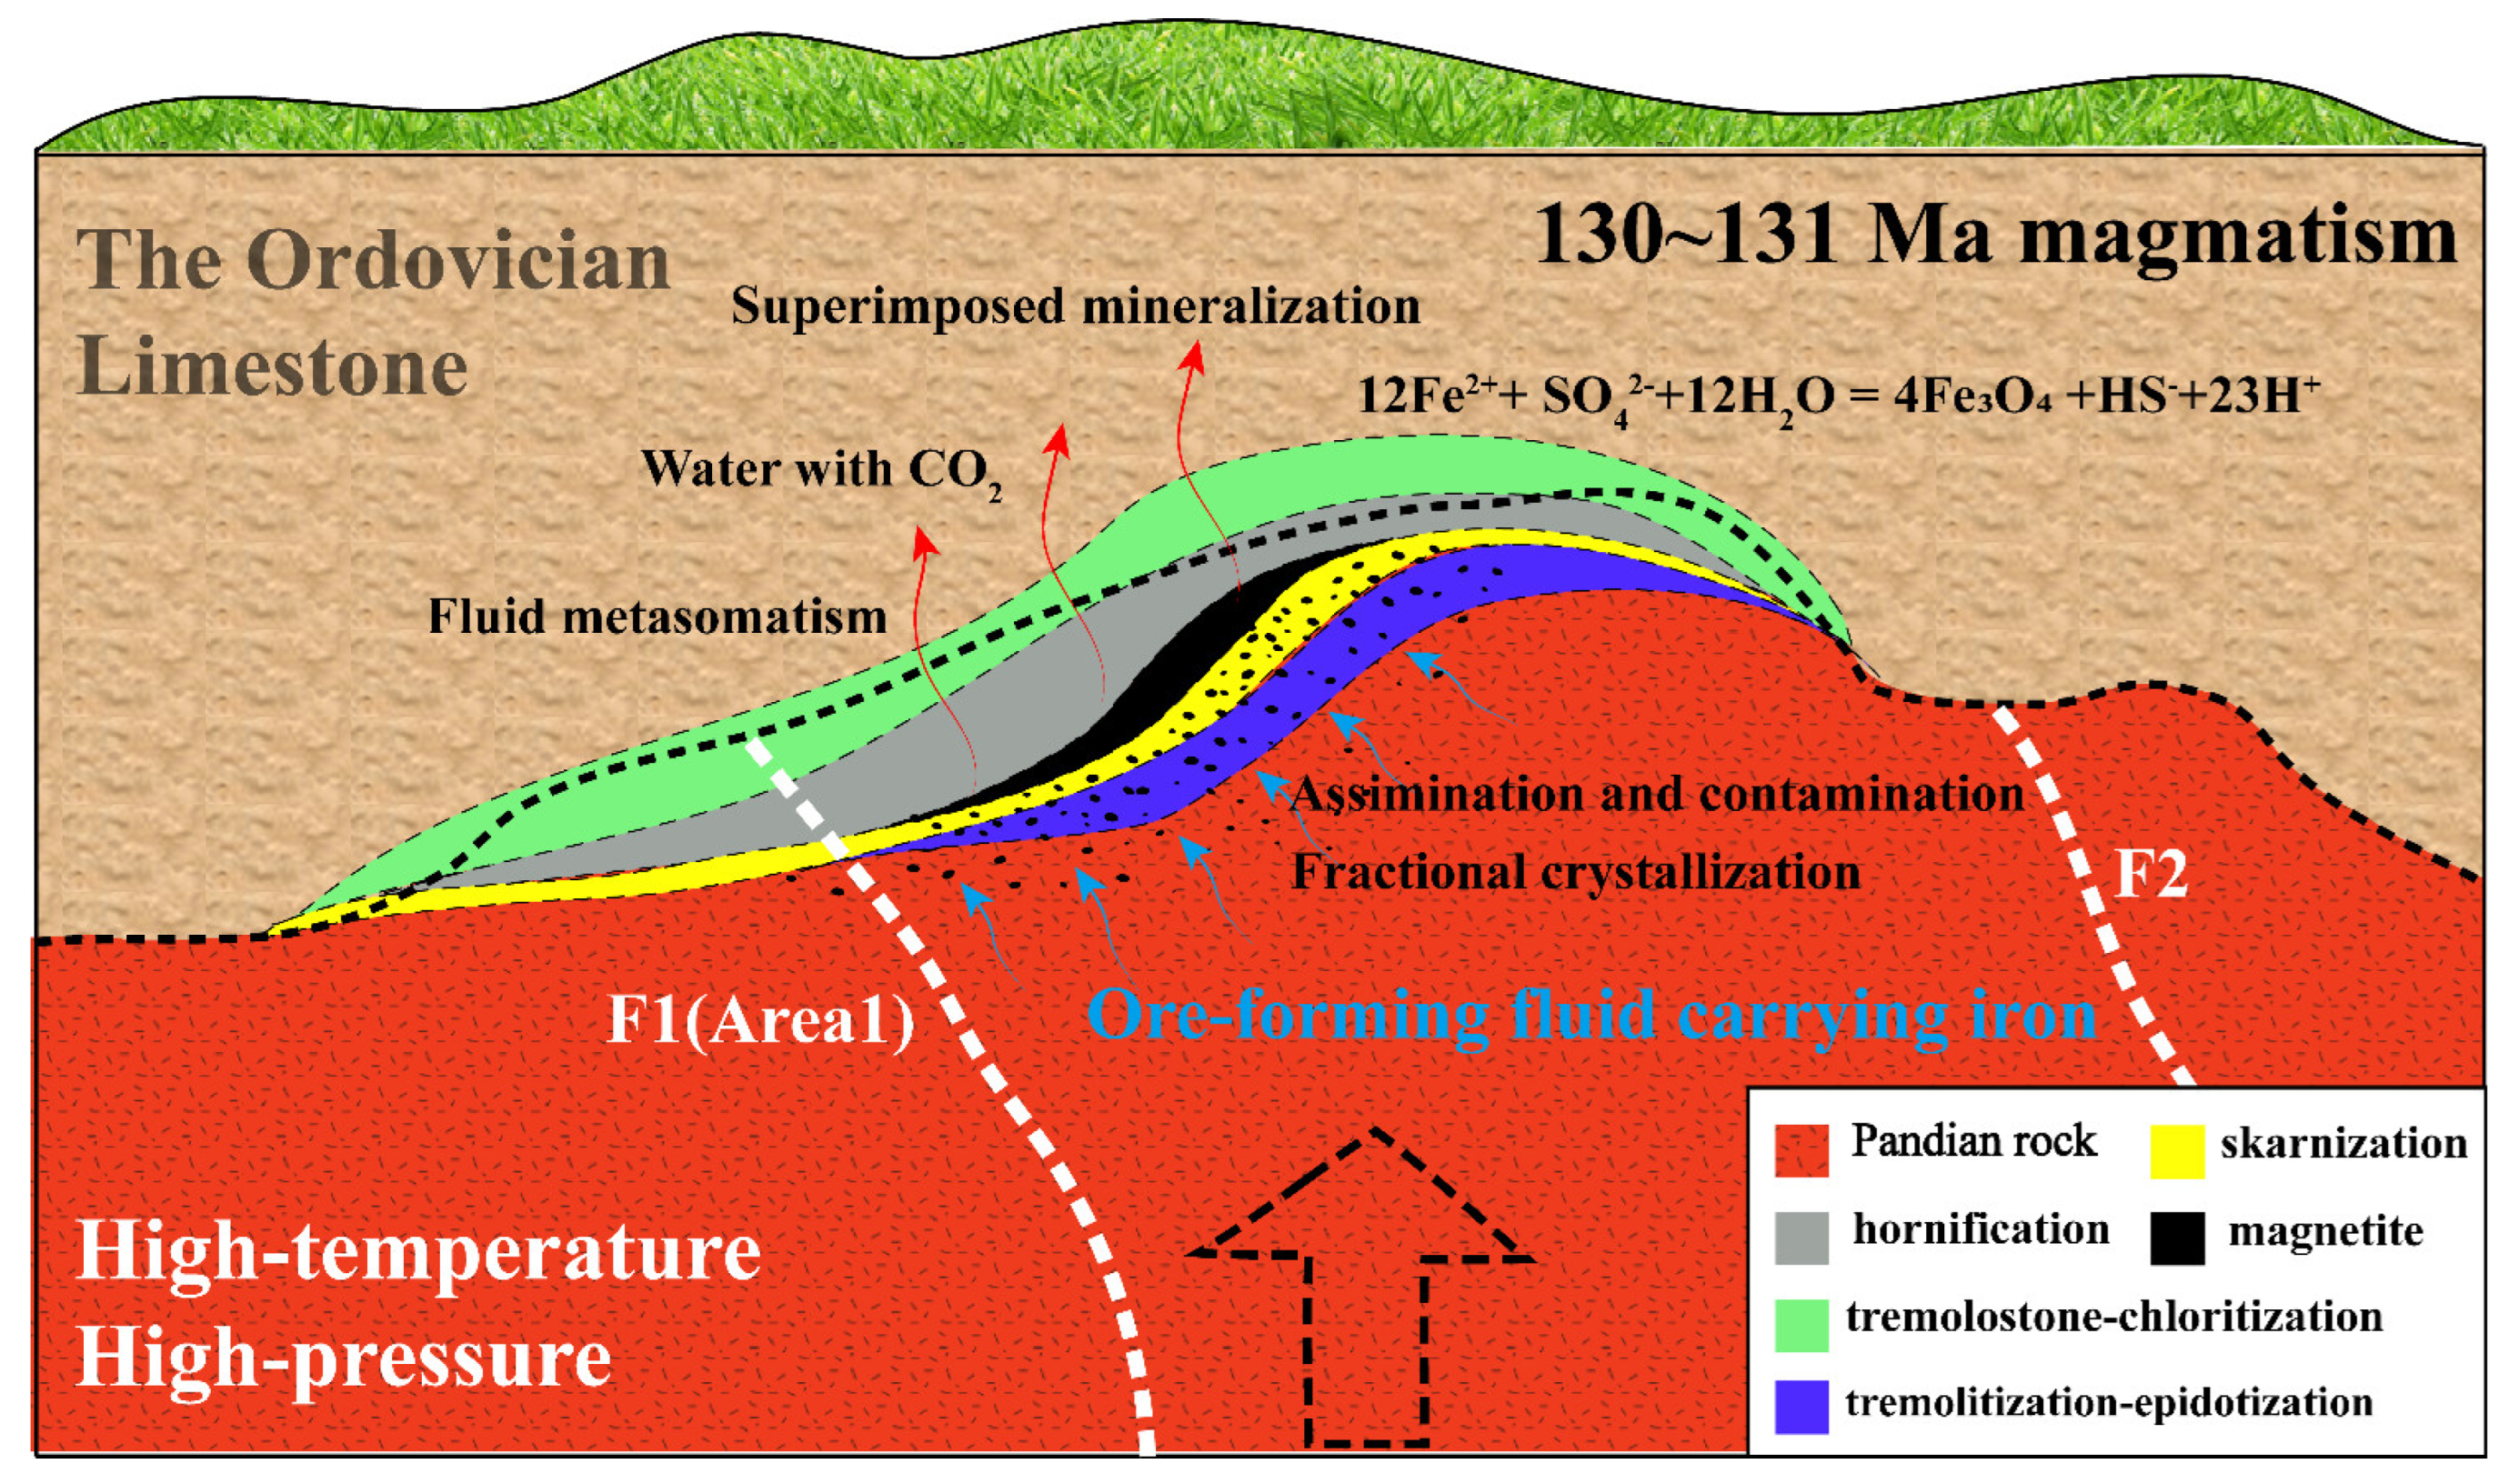
5.3. Metallogenic Mechanism

The ore-forming age of the skarn iron bodies was in tune with the emplacement time of the intrusive diorite pluton. A large number of high-precision isotopic chronology data showed that the skarn iron deposits in eastern China were mostly formed at ~130 Ma, characterized by concentrated explosion mineralization [46,47,48]. The zircon U-Pb geochronology had shown that the metallogenic geological bodies in the Pandian area belonged to the middle-basic intrusive rocks formed in the Late Mesozoic (130~131 Ma), which was consistent with that in the Litun area and the Dazhang area [13,18].
According to previous research achievements, strata, magmatic rocks and structures jointly controled the formation and distribution of magnetite in the Pandian region [12]. More specifically, Carboniferous-Permian strata, as the upper overburden, provided a good sealing condition for regional mineralization and controled the top interface of the intrusive rock, featured by local uplift in electrical models. Ordovician Majiagou Formation limestone was the leading component of the surrounding rock of skarn magnetite in this district [13]. Meanwhile, diorite was the main ore-forming bodies provided the main ore-forming materials and thermal dynamic conditions for the formation of the ore bodies [49]. To control the formation and distribution of the deposit, the Qiguang fault, as the only first-order fault structure in our study area, was a deep fault that cut the upper mantle or lower crust and became the ascending channel of deep magma and mineral fluid [50]. Meanwhile, some localized structures, including Xulou fault, Pandian fault, Juzhen fault and other small faults provided advantageous conditions for the migration, enrichment and mineralization of the ore-forming materials and controled the shape and the attitude of the ore bodies to a certain extent [15].
In the Late Yanshanian period, LXU experienced a series of complex tectonic movements, accompanied by intense magmatic activities [46,48]. The meso-mafic magmatic hydrothermal fluids derived from the upper mantle and lower crust invaded upward along the weak zone of the basement, driven by the magmatic heat sources and tectonic stress [50,51]. During the process, magmatic fluid underwent different degrees of fractional crystallization, mixing, mingling and crustal contamination [45] (Figure 10). Subsequently, the magma intruded into carbonate strata and formed a meso-basic intrusive complex, which provided iron, mineralizer and thermal dynamic conditions for mineralization [51]. Under high temperatures and high pressure, extensive contact metasomatism occurred between the intrusive rocks and Ordovician limestone near the contact zones, forming a series of skarn minerals containing diopside, magnesium olivine, grossular and others, which increased the concentration of iron in the ore-forming fluid [45]. With the continuous development of metasomatism, the formation of andradite, hedenbergite and other new minerals made abundant CO2 precipitate, and some of the Fe2+ ions were oxidized to the Fe3+ ions (the chemical equation is as follows, 12Fe2+ + SO42− + 12H2O = 4Fe3O4 + HS + 23H+) [52]. Under the background of the regional extensional structures, the iron-rich ore-forming hydrothermal fluid was enriched and precipitated in the favorable position of mineralization. Then, the high-grade skarn magnetite, mostly stratified, lenticular and veined, was formed [11,12].

6. Conclusions

Wide-field electromagnetic data collected from two WFEM profiles crossing the key region of the Pandian deposit were inverted to provide 2D resistivity models for a depth of less than 3000 m. The major conclusions with significant electrical structures in terms of metallogenic prediction implications from our study are as follows: Diorite is the ore-forming geological body in the Pandian district, characterized by high resistivity (>16 Ω·m), accompanied by low-resistance skarnization, tremolitization and epidotization. The high-resistivity blocks (R1~R6 in Figure 8) were inferred to be unaltered diorite intrusive rocks; the electrical weakness zones (F1 and F2, Area 1 in Figure 8) may indicate the lithologic fracture/alteration zones formed in the process of geotectonic movements. The confirmed magnetite ore bodies based on borehole PZK1 are mainly featured by the local concaves of the apparent resistivity isolines near the electrical gradient zones, with a resistivity of 25~40 Ω·m in the resistivity models. In addition, the top interface of the Pandian rock is roughly 1300 m, with a trend of NNE 7°.

Author Contributions

Conceptualization: J.L and K.Z.; methodology: K.Z. and J.L.; software: Z.Z. and K.Z.; validation: J.L. and R.G.; formal analysis: K.Z. and H.L.; writing—original draft preparation: K.Z. and J.L.; writing—review and editing: R.G., Z.Z. and R.L.; visualization: K.Z. and Y.Z.; supervision: H.L. and R.L.; investigation: K.Z. and Z.Z.; funding acquisition: R.L. and H.L. All authors have read and agreed to the published version of the manuscript.

Funding

This work was supported by the Shangdong Province Financial Geological Exploration Project (ID:2022-21) and the Science and Technology Research Project of Shandong Provincial Bureau of Geology and Mineral Resources (KY202201). The development of some methods used in this research was also supported by the National Natural Science Foundation of China (grant Nos. 42130810, 72088101, 42074165 and 42174171).

Data Availability Statement

Data from this research will be available upon request to the authors.

Acknowledgments

We thank Jian Li of Central South University and Chenggong Liu of China University of Geoscience University (Beijing) for careful guidance in our research work. Meanwhile, we also thank the anonymous reviewers for their constructive and valuable comments.

Conflicts of Interest

The authors declare no conflict of interest.

References

  1. Xu, J.Q.; Li, Z.; Shi, Y.H. Jurassic detrital zircon U-Pb and Hf isotopic geochronology of Luxi Uplift, eastern North China, and its provenance implications for tectonic-paleogeographic reconstruction. J. Asian Earth Sci. 2013, 78, 184–197. [Google Scholar] [CrossRef]
  2. Yin, Y.T.; Jin, S.; Wei, W.B.; Santosh, M.; Dong, H.; Xie, C.L. Construction and destruction of the North China Craton with implications for metallogeny: Magnetotelluric evidence from the Hengshan-Wutai-Fuping region within Trans-North China Orogen. Gondwana Res. 2016, 40, 21–42. [Google Scholar] [CrossRef]
  3. Ye, G.F.; Liu, C.; Luo, X.; Jin, S.; Wei, W.B.; Dong, H.; Yin, Y.T. Dynamical significance of the Tanlu Fault Zone in the destruction of the North China Craton: The evidence provided by the three-dimensional Magnetotelluric array study. Tectonophysics 2021, 813, 228910. [Google Scholar] [CrossRef]
  4. Hu, Q.Y.; Li, L.; Tang, Z.B.; Shi, X.P. Characteristics and mechanisms of Late Mesozoic extensional faults in west Shandong Uplift. Geol. China 2009, 36, 1233–1244. [Google Scholar]
  5. Hao, X.Z. Study on Metallogenic Regularities and Prognosis of Iron Deposits in Western Shandong Province. Ph.D. Dissertation, China University of Geosciences, Beijing, China, 2014. [Google Scholar]
  6. Yu, L.; Zhang, J.; Gao, L.J.; Dong, M. Gravity-magnetic anomalies and tectonic activities in Luxi uplift. Acta Seismol. Sin. 2017, 39, 694–707. [Google Scholar]
  7. Wu, C.P.; Yu, C.C.; Wang, W.P.; Ma, X.B.; Fan, Z.G.; Zhu, H.W. Physical characteristics of rocks and ores and their application in Qihe area, Western Shandong. Adv. Earth Sci. 2019, 34, 1099–1107. [Google Scholar]
  8. Hou, Z.; Chen, X.; Yu, C.C.; Wang, T.Y.; Zhou, M.L.; Li, Y.H. Characteristics of the geological deep structure in QiHe-Yucheng area of Shandong: Evidence from magnetotelluric method. Prog. Geophys. 2021, 36, 1070–1081. [Google Scholar]
  9. Li, Q.; Tian, S.Q. Geochemical characteristics of magnetite elements and its indication of mineralization of skarn type iron deposit in Qihe-Yucheng area in Shandong Province. Shandong Land Resour. 2021, 37, 1–9. [Google Scholar]
  10. Shen, L.J.; Zhu, Y.Z.; Gao, Z.J. Paimary study on geological characteristics of Litun rock mass in Qihe-Yucheng rich iron ore area in Shandong province. Shandong Land Resour. 2020, 36, 23–29. [Google Scholar]
  11. Hao, X.Z.; Yang, Y.H.; Liu, W. Geological characteristics and prospecting significance of skarn type iron deposit in Pandian area, Shandong province. Sci. Technol. Eng. 2018, 18, 51–58. [Google Scholar]
  12. Hao, X.Z.; Liu, W.; Zang, K.; Zhang, X.S. Primary study on metallogenic regularity of skarn type iron deposit in Pandian area in western Shandong province. Shandong Land Resour. 2018, 34, 27–33. [Google Scholar]
  13. Wang, R.S.; Hao, X.Z.; Chen, H.J.; Liu, H.; Chen, F.B.; Yu, L.; Liu, W.; Fang, L.; Kang, Y.M. Discovery of skarn iron-rich deposit based on heavy and magnet data in the Qihe-Yucheng, Shandong province and its enlightenment to prospecting of the super-deep coverage area. Geol. China 2021, 1–18. Available online: https://kns.cnki.net/kcms/detail/11.1167.P.20211109.1654.006.html (accessed on 22 November 2022).
  14. Shen, J.C.; Li, S.C.; Zhang, B. Analysis on the coupling relationship between Luxi Uplift and Jiyang depression in western Shandong Province. Geol. Resour. 2018, 27, 411–416. [Google Scholar]
  15. Wang, W.P.; Wu, C.P.; Ma, X.B. Aeromagnetic field feature and iron ore target prospecting in deep coverage area of Qihe in Shandong Province. Geol. Surv. China 2020, 7, 23–29. [Google Scholar]
  16. Zhu, Y.Z.; Zhou, M.L.; Gao, Z.J.; Zhang, X.B. The discovery of the Qihe-Yucheng skarn type rich iron deposit in Shandong and its exploration significance. Geol. Bull. China 2018, 37, 938–944. [Google Scholar]
  17. Zhou, M.L.; Ru, L.; Zhu, Y.Z.; Yu, C.C.; Wu, C.P.; Gao, Z.J.; Zhang, W.Y.; Shao, Y.B. Magnetic field characteristics and ore prediction in Qihe-Yucheng area of Shandong Province. Geophys. Geochem. Explor. 2021, 45, 301–307. [Google Scholar]
  18. Hao, X.Z.; Wang, R.S.; Wang, Q.Y.; Zhang, H.P.; Zhu, X.Q.; Liu, W.; Zhi, Y.B.; Wang, L.G.; Zhang, G.L. Exploration enlightenment of skarn type iron ore in geophysical anomaly of Pandian, northwest Shandong Province. Miner. Explor. 2022, 13, 453–459. [Google Scholar]
  19. Meng, G.X.; Lv, Q.T.; Yan, J.Y.; Deng, Z.; Qi, G.; Xue, R.H. The research and application of explorational technology of “Penetrating” to geology and mineral investigation in overburden area. Acta Geosci. Sin. 2019, 40, 637–650. [Google Scholar]
  20. Yadav, P.K.; Adhikari, P.K.; Srivastava, S.; Maurya, V.P.; Tripathi, A.; Singh, S.; Singh, R.K.; Bage, A.K. Lithologic boundaries from gravity and magnetic anomalies over Proterozoic Dalma volcanics. J. Earth Syst. Sci. 2018, 127, 17. [Google Scholar] [CrossRef] [Green Version]
  21. Mondal, S.; Guha, A.; Pal, S.K.; Porwal, A.; Chatterjee, S.; Rani, K.; Pour, A.B.; Kumar, K.V. Conjugate utilization of Landsat-8 OLI, ground gravity and magnetic data for targeting mafic cumulates within anorthositic-layered complex of Sittampundi, India. Geocarto Int. 2021, 36, 1855–1872. [Google Scholar] [CrossRef]
  22. Ding, W.X.; Yuan, F.; Li, X.H.; Sun, W.A.; Liu, G.X.; Yang, D. Deep geological structure analysis and metallogenic prediction of Zhonggu ore field in the south section of Ningwu basin based on gravity and magnetic joint inversion. Acta Geol. Sin. 2018, 92, 2301–2317. [Google Scholar]
  23. Streich, R.; Becken, M. Sensitivity of controlled-source electromagnetic fields in planarly layered media. Geophys. J. Int. 2011, 187, 705–728. [Google Scholar] [CrossRef] [Green Version]
  24. Xue, G.Q.; Gelius, L.J.; Sakyi, P.A.; Zhou, N.N.; Chen, W.Y.; Su, B.C.; Li, H.; Zhong, H.S.; Su, Y.P. Discovery of a hidden BIF deposit in Anhui province, China by integrated geological and geophysical investigations. Ore Geol. Rev. 2014, 63, 470–477. [Google Scholar] [CrossRef]
  25. Goldstein, M.A.; Strangway, D.W. Audio-frequency magnetotellurics with a grounded electric dipole source. Geophysics 1975, 40, 669–683. [Google Scholar] [CrossRef]
  26. Jiang, Q.Y. Study on the Key Technology of Wide Field Electromagnetic Sounding Instrument. Ph.D. Thesis, Central South University, Changsha, China, 2010. [Google Scholar]
  27. He, J.S. Wide field electromagnetic sounding methods. J. Cent. South Univ. Sci. Technol. 2010, 41, 1065–1072. [Google Scholar]
  28. Hu, Y.F.; Li, D.Q.; Yuan, B.; Suo, G.Y.; Liu, Z.J. Application of pseudo-random frequency domain electromagnetic method in mining areas with strong interferences. Trans. Nonferrous Met. Soc. China 2020, 30, 774–788. [Google Scholar] [CrossRef]
  29. Gu, Z.W.; Tian, H.J.; Wang, A.P.; Li, S.L. The application of wide-area electromagnetic method to the hot spring exploration in south Sichuan. Acta Geol. Sichuan 2021, 41, 662–666. [Google Scholar]
  30. Tian, H.J.; Feng, B.; Qin, L.Y.; Jiang, Y.F.; Yu, C.H.; Ye, H. Searching for deep hidden ore bodies based on wide field electromagnetic methods: Take the Longkou-Tudui gold mining area as example. J. Jilin Univ. (Earth Sci. Ed.) 2022, 1–15. Available online: https://kns.cnki.net/kcms/detail/22.1343.P.20220105.2044.002.html (accessed on 22 November 2022).
  31. Wei, Z.F.; Chen, H.Y.; Wu, X.Q. The application of wide field electromagnetic method to geothermal exploration in Yichun. Geophys. Geochem. Explor. 2020, 44, 1009–1018. [Google Scholar]
  32. Wang, H.Y.; Li, D.Q.; Liu, J.X.; Xue, G.Q.; Guo, W.B. Application of wide-field electromagnetic method in the detection of oil-rich enrichment areas in the southwestern margin of the Ordos basin. Prog. Geophys. 2020, 35, 1038–1047. (In Chinese) [Google Scholar]
  33. Yuan, B.; Li, D.Q.; Bayless, R.C. Wide Field Electromagnetic Method for Shale Gas Exploration in Southern China: A Case Study. J. Environ. Eng. Geophys. 2017, 22, 279–289. [Google Scholar] [CrossRef]
  34. Yu, Z.H.; Yan, L.Q.; Cai, Z.J.; Wang, J.H.; Xu, Y.F.; Lin, J.F.; Ma, L. Application of wide-field electromagnetic method in shale gas survey in Eastern Kunlun, Qinghai province, China. J. Cent. South Univ. 2020, 27, 3388–3397. [Google Scholar] [CrossRef]
  35. Wang, X.M.; Zhong, D.L.; Li, L.; Ding, Z.Y.; Li, S.; Zhang, R.Q. Relationship between NW faults of West Shandong and Yi-Shu fault zone in Late Mesozoic and their geotectonic setting operations. Earth Sci. Front. 2010, 17, 166–190. [Google Scholar]
  36. Zhao, Y.Q. Study on distribution law of mines in magmatic rocks erosion area in huanghebei coalfield-taking Pandian coalfied as an example. Shandong Land Resour. 2017, 33, 50–54. [Google Scholar]
  37. Wang, G.Z.; Liu, S.G.; Zou, C. Thermochronologic constraints on uplifting events since the early cretaceous in the north margin of the luxi rise, eastern china. J. Earth Sci. 2013, 24, 579–588. [Google Scholar] [CrossRef]
  38. Wang, S.J.; Wan, Y.S.; Zhang, C.J.; Yang, E.X.; Song, Z.Y.; Wang, L.F.; Zhang, F.Z. Major advanced development gained in studying early Cambrian geology in Luxi area. Shandong Land Resour. 2008, 24, 10–20. [Google Scholar]
  39. Xu, G.; Lin, X. Geology and geochemistry of the Changlongshan skarn iron deposit, Anhui Province, China. Ore Geol. Rev. 2000, 16, 91–106. [Google Scholar] [CrossRef]
  40. Suo, G.Y.; Li, D.C.; Hu, Y.F. One-dimension parallel constrained inversion of E-Ex wide field electromagnetic method based on analytical Jacobian matrix. Comput. Tech. Geophys. Geochem. Explor. 2019, 41, 55–61. [Google Scholar]
  41. Chen, H.Y.; Li, D.Q.; Ling, F.; Wu, X.Q.; Wei, Z.F.; Zhang, B.; Tian, H.J.; You, W.B.; Zou, Q.F.; Liu, X.M. Deep exploration of wide field electromagnetic method in Zhuxi W-Cu deposit. Chin. J. Nonferrous Met. 2022, 32, 17. [Google Scholar]
  42. Yang, Y.; He, J.S.; Ling, F.; Zhu, Y.Z. Distributed wide field electromagnetic method based on high-order 2n sequence pseudo random signal. Trans. Nonferrous Met. Soc. China 2022, 32, 1609–1622. [Google Scholar] [CrossRef]
  43. Nelson, P.H. Estimation of sulfifide content from induced polarization data. Geophysics 1983, 48, 62. [Google Scholar] [CrossRef]
  44. Qi, P.; Yin, Y.T.; Jin, S.; Wei, W.B.; Xu, L.Y.; Dong, H.; Huang, J.H. Three-Dimensional audio-magnetotelluric imaging including surface topography of the cimabanshuo porphyry copper deposit, Tibet. Minerals 2021, 11, 1424. [Google Scholar] [CrossRef]
  45. Yu, M.; Feng, C.Y.; Bao, G.Y.; Liu, H.C.; Zhao, Y.M.; Li, D.X.; Xiao, Y.; Liu, J.N. Characteristics and zonation of skarn minerals in Galinge iron deposit, Qinghai Province. Miner. Depos. 2013, 32, 55–76. [Google Scholar]
  46. Chen, B.; Tian, W.; Jahn, B.M.; Chen, Z.C. Zircon SHRIMP U-Pb ages and in-situ Hf isotopic analysis for the Mesozoic intrusions in South Taihang, North China craton: Evidence for hybridization between mantle-derived magmas and crustal components. Lithos 2008, 102, 118–137. [Google Scholar] [CrossRef]
  47. Deng, X.D.; Li, J.W.; Wen, G. Dating iron skarn mineralization using hydrothermal allanite-(La) U-Th-Pb isotopes by laser ablation ICP-MS. Chem. Geol. 2014, 382, 95–110. [Google Scholar] [CrossRef]
  48. Xie, G.Q.; Mao, J.W.; Zhu, Q.Q.; Yao, L.; Li, Y.H.; Li, W.; Zhao, H.J. Geochemical constraints on Cu-Fe and Fe skarn deposits in the Edong district, Middle-Lower Yangtze River metallogenic belt, China. Ore Geol. Rev. 2015, 64, 425–444. [Google Scholar] [CrossRef]
  49. Liu, C.G.; Jing, J.E.; Jin, S.; Wei, W.B. A study of deep metallogenic prediction and metallogenic mechanism of the Dachang deposit in Guangxi. Geophys. Geochem. Explor. 2021, 45, 337–345. [Google Scholar]
  50. Liu, S.F.; Hou, J.H.; Liu, X.R.; Sun, S.H. A case study on mineralization mechanism of contact metasomtic skarn-type iron deposit in Jinan, western Shandong area. J. Geol. 2021, 45, 122–137. [Google Scholar]
  51. Zhang, J.J.; Zhang, S.L.; Zhu, Y.K. Metallogenic geological conditions and metallogenic model of the Hekou Pb-Au deposit in the Wuhe area, Anhui Province. J. Geol. 2019, 43, 57–66. [Google Scholar]
  52. Duan, Z. The Mineralization and Mechanism of the Iron Skarn Deposits in Laiwu District, Shandong Province. Ph.D. Thesis, China University of Geosciences, Beijing, China, 2019. [Google Scholar]
Figure 1. Regional geological structural map of Luxi Uplift, modified from [14]. Red dashed rectangle is the research area; red solid lines show known major faults; blue solid lines are boundary of Luxi Uplift. QGF: Qihe–Guangrao fault, LLF: Lankao–Liaocheng fault, FPF: Feng–Pei fault, TLFZ: Tan–Lu fault zone.
Remotesensing 15 01217 g001
Figure 2. (a) Simplified structure map of Luxi Uplift, modified from Figure 1. (b) Geological map of the study area, modified from [15], in which the sampling locations of gravitative–magnetic and wide-field electromagnetic are marked. (c) Stratigraphic profile exposed by borehole named PZK1. Black solid lines show the exposed fault. Black dashed lines delineate the buried fault. Dashed blue sector is area of Luxi Uplift, and dashed red rectangles are the research area in Figure 2a. The blue straight line in Figure 2b represents the emission source with blue circles showing the A pole and B pole of that. Brown dashed lines indicate the delineated gravity and magnetic anomaly area, in which the green plotted line indicates the gravity anomaly area and the purple dashed line shows the magnetic anomaly area, modified from [13].
Remotesensing 15 01217 g002
Figure 3. Schematic diagram of the WFEM arrangement, modified from [29].
Remotesensing 15 01217 g003
Figure 4. Frequency–electrical field–apparent resistivity curves of typical sites on profile PGY1.
Remotesensing 15 01217 g004
Figure 5. Frequency–electrical field–apparent resistivity curves of typical sites on profile PGY2.
Remotesensing 15 01217 g005
Figure 6. The overall apparent resistivity curves of the Pandian area.
Remotesensing 15 01217 g006
Figure 7. Apparent resistivity response curves of the WFEM inversion model.
Remotesensing 15 01217 g007
Figure 8. Resistivity models produced by WFEM inversion. (a) Profile PGY1; (b) profile PGY2. The red dashed lines represent the top interface of Pandian rock inferred. The black dashed lines indicate the inferred stratigraphic boundaries. R1~R6: high-resistivity zones; Area 1: electrical weak areas from PGY1; F1, F2: lithologic alteration/fracture zones we deduced.
Remotesensing 15 01217 g008
Figure 9. Schematic diagram of metallogenic prediction of Pandian deposit. The zones depicted in black are the ore bodies we predicated.
Remotesensing 15 01217 g009
Figure 10. Schematic diagram of magnetite mineralization in Pandian. Black dashed arrow shape indicates upwelling of magma heat sources. Black dashed line represents the boundary of the Pandian rock we inferred. The red arrows show water with CO2, and the blue arrows indicate the direction of ore-forming fluid carrying iron. F1 (Area 1) and F2 represent the lithologic alteration/fracture belts (zones) we deduced.
Remotesensing 15 01217 g010
Disclaimer/Publisher’s Note: The statements, opinions and data contained in all publications are solely those of the individual author(s) and contributor(s) and not of MDPI and/or the editor(s). MDPI and/or the editor(s) disclaim responsibility for any injury to people or property resulting from any ideas, methods, instructions or products referred to in the content.

