
A Comprehensive Database of Indonesian Dams and Its Spatial Distribution
 ,
,  , ,
, ,
Abstract
:1. Introduction
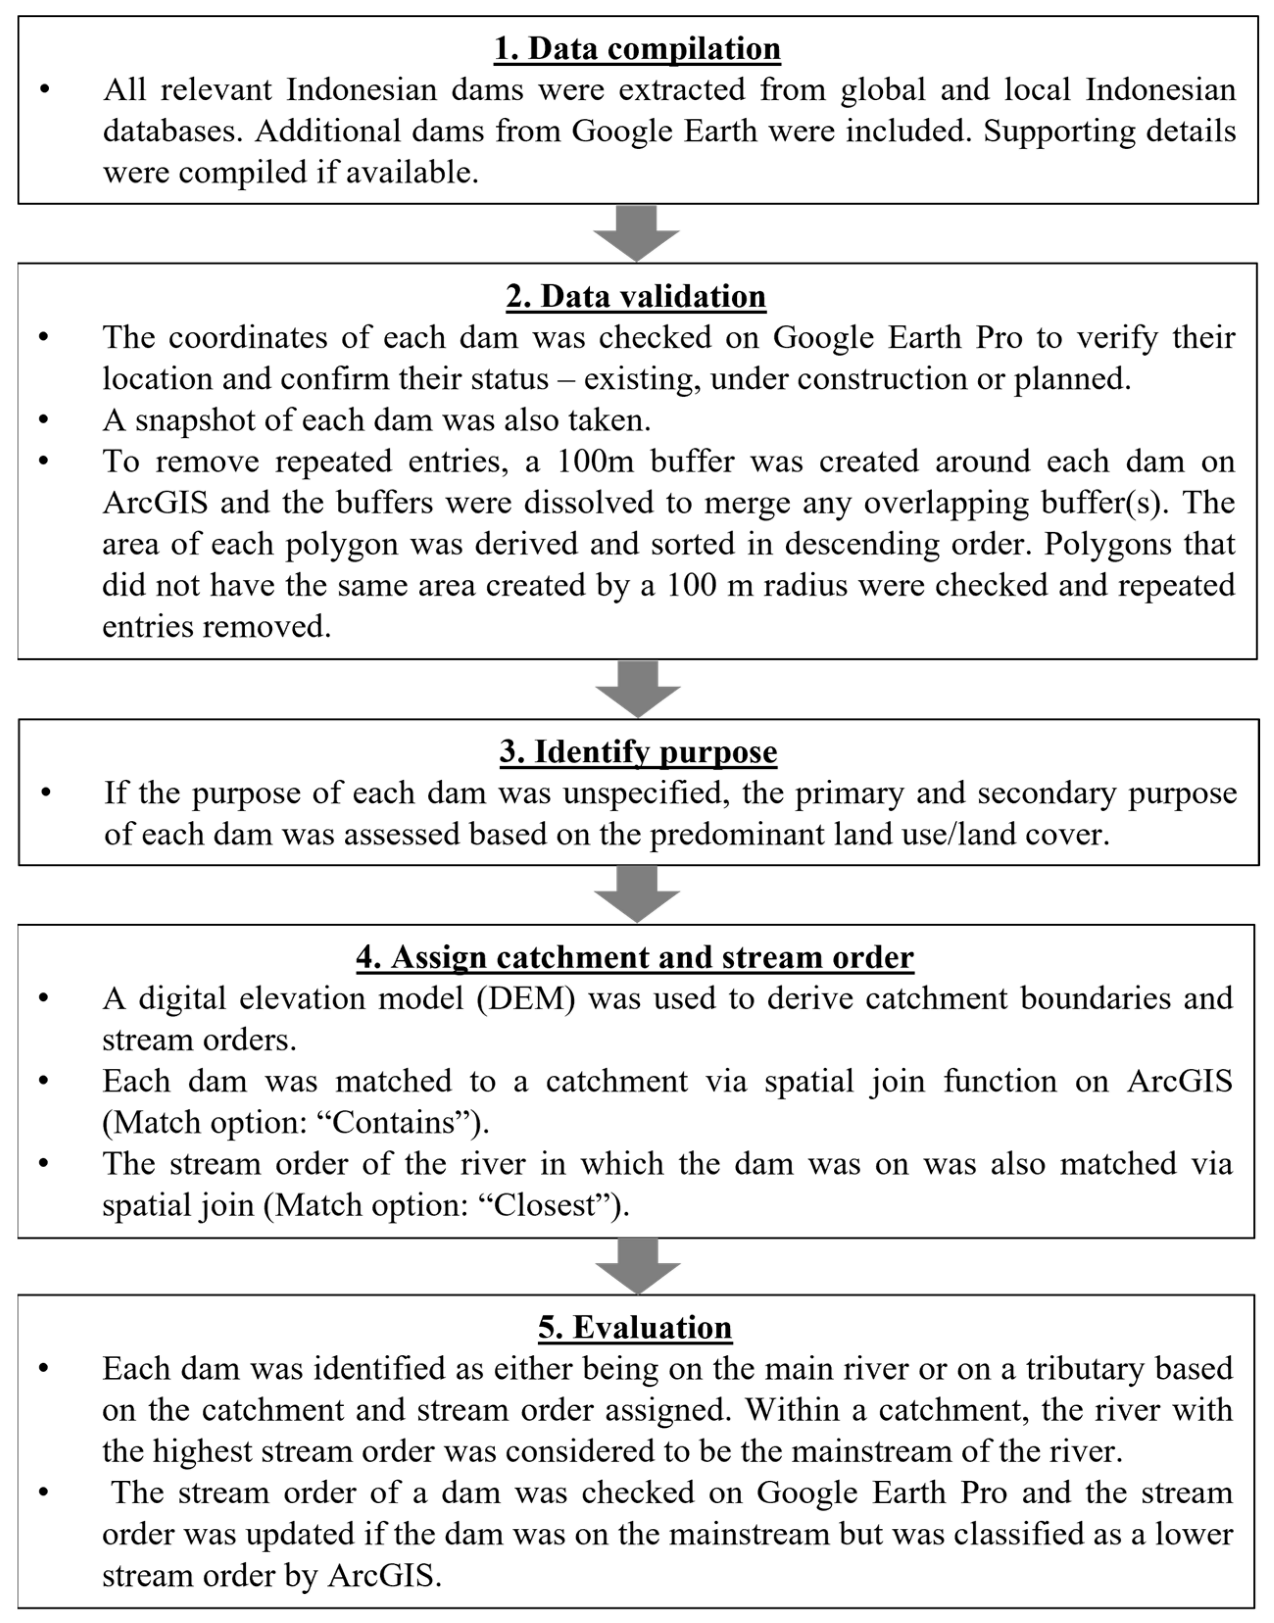
2. Materials and Methods
2.1. Data Sources
2.2. Data Compilation, Classification, and Verification
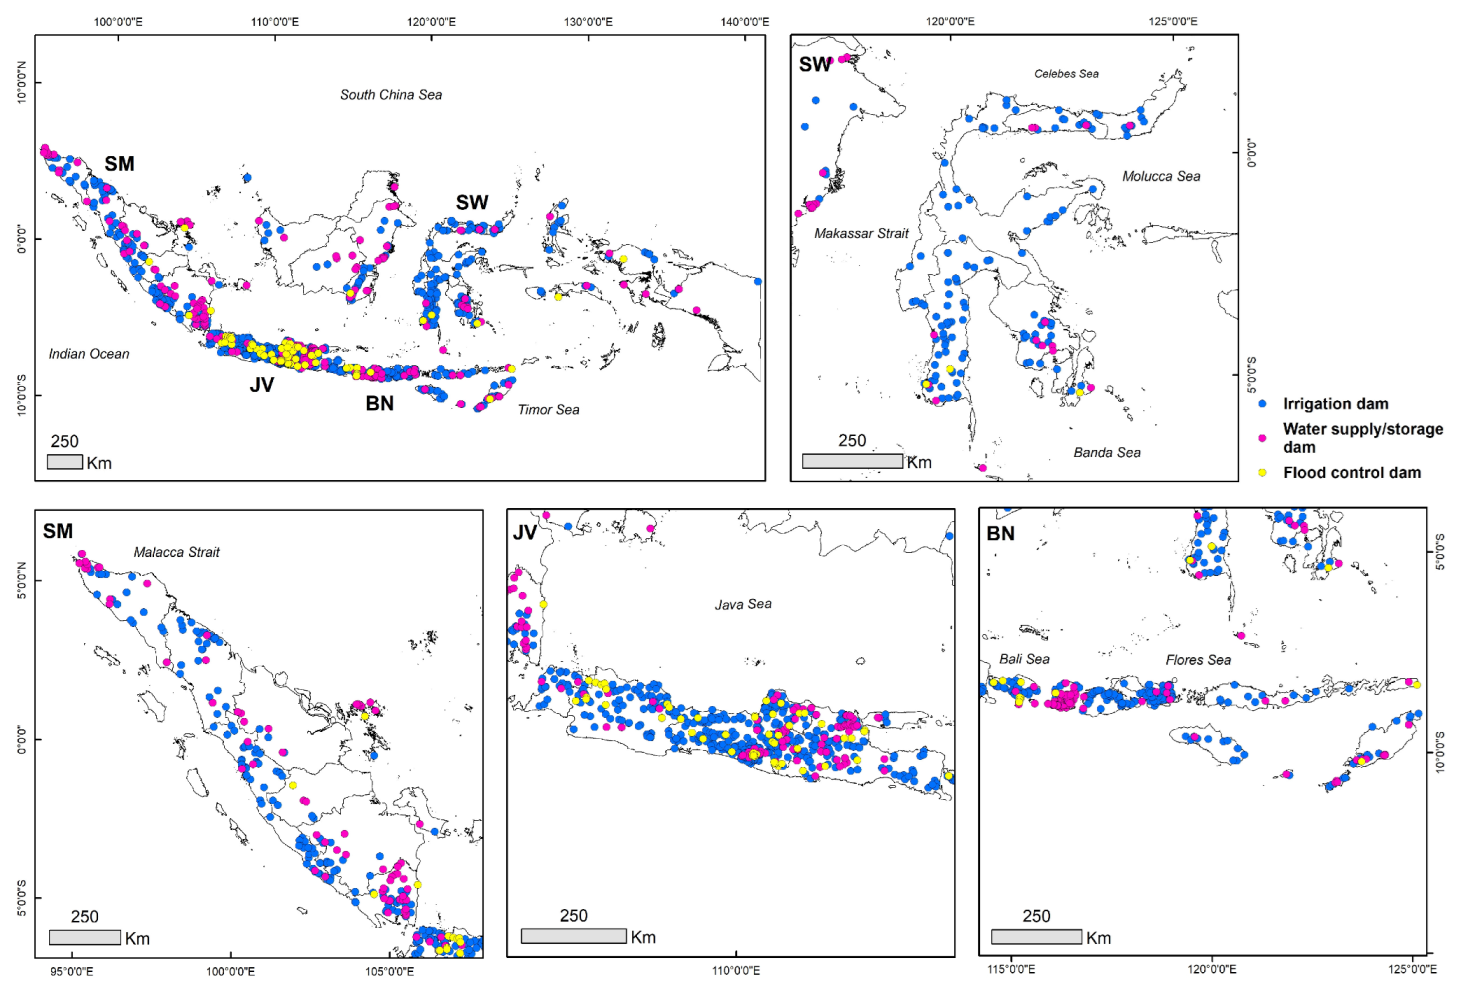
3. Results
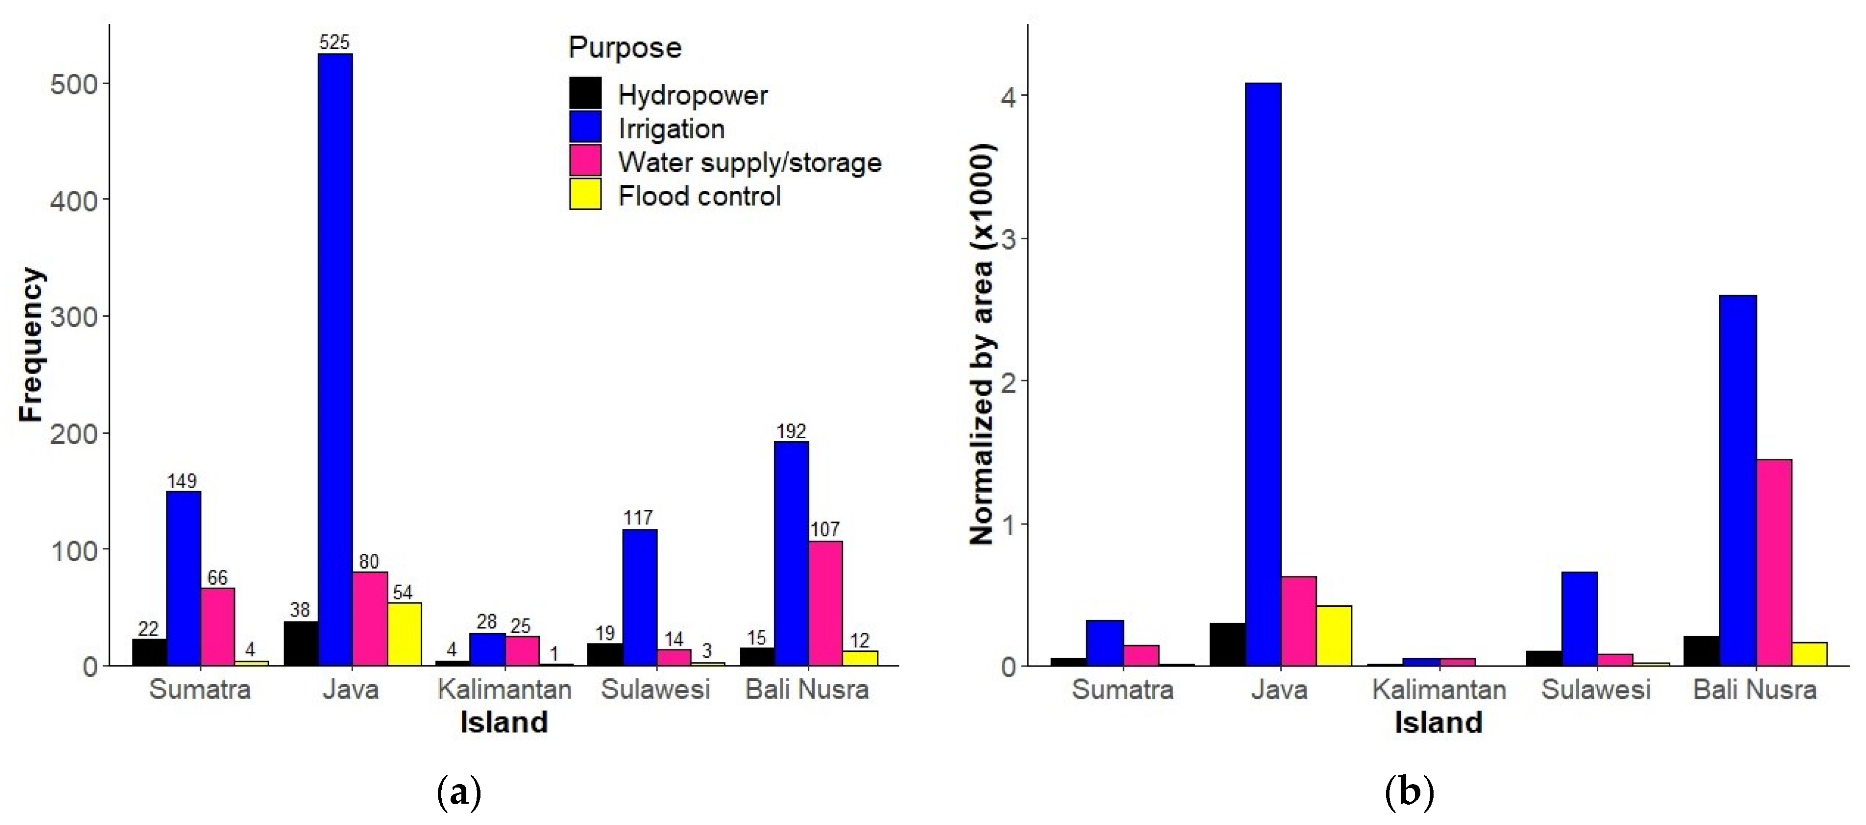
3.1. General
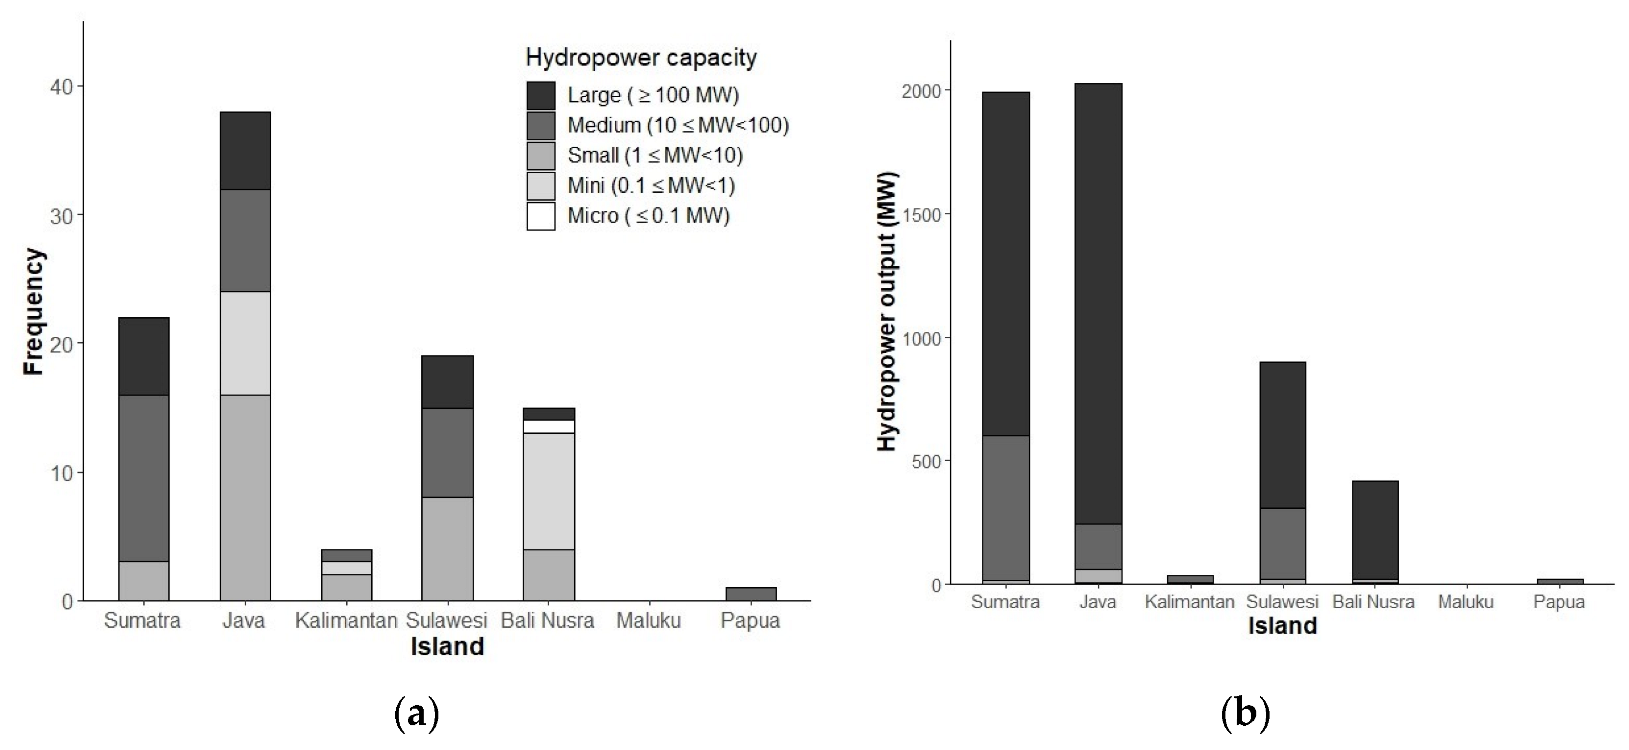
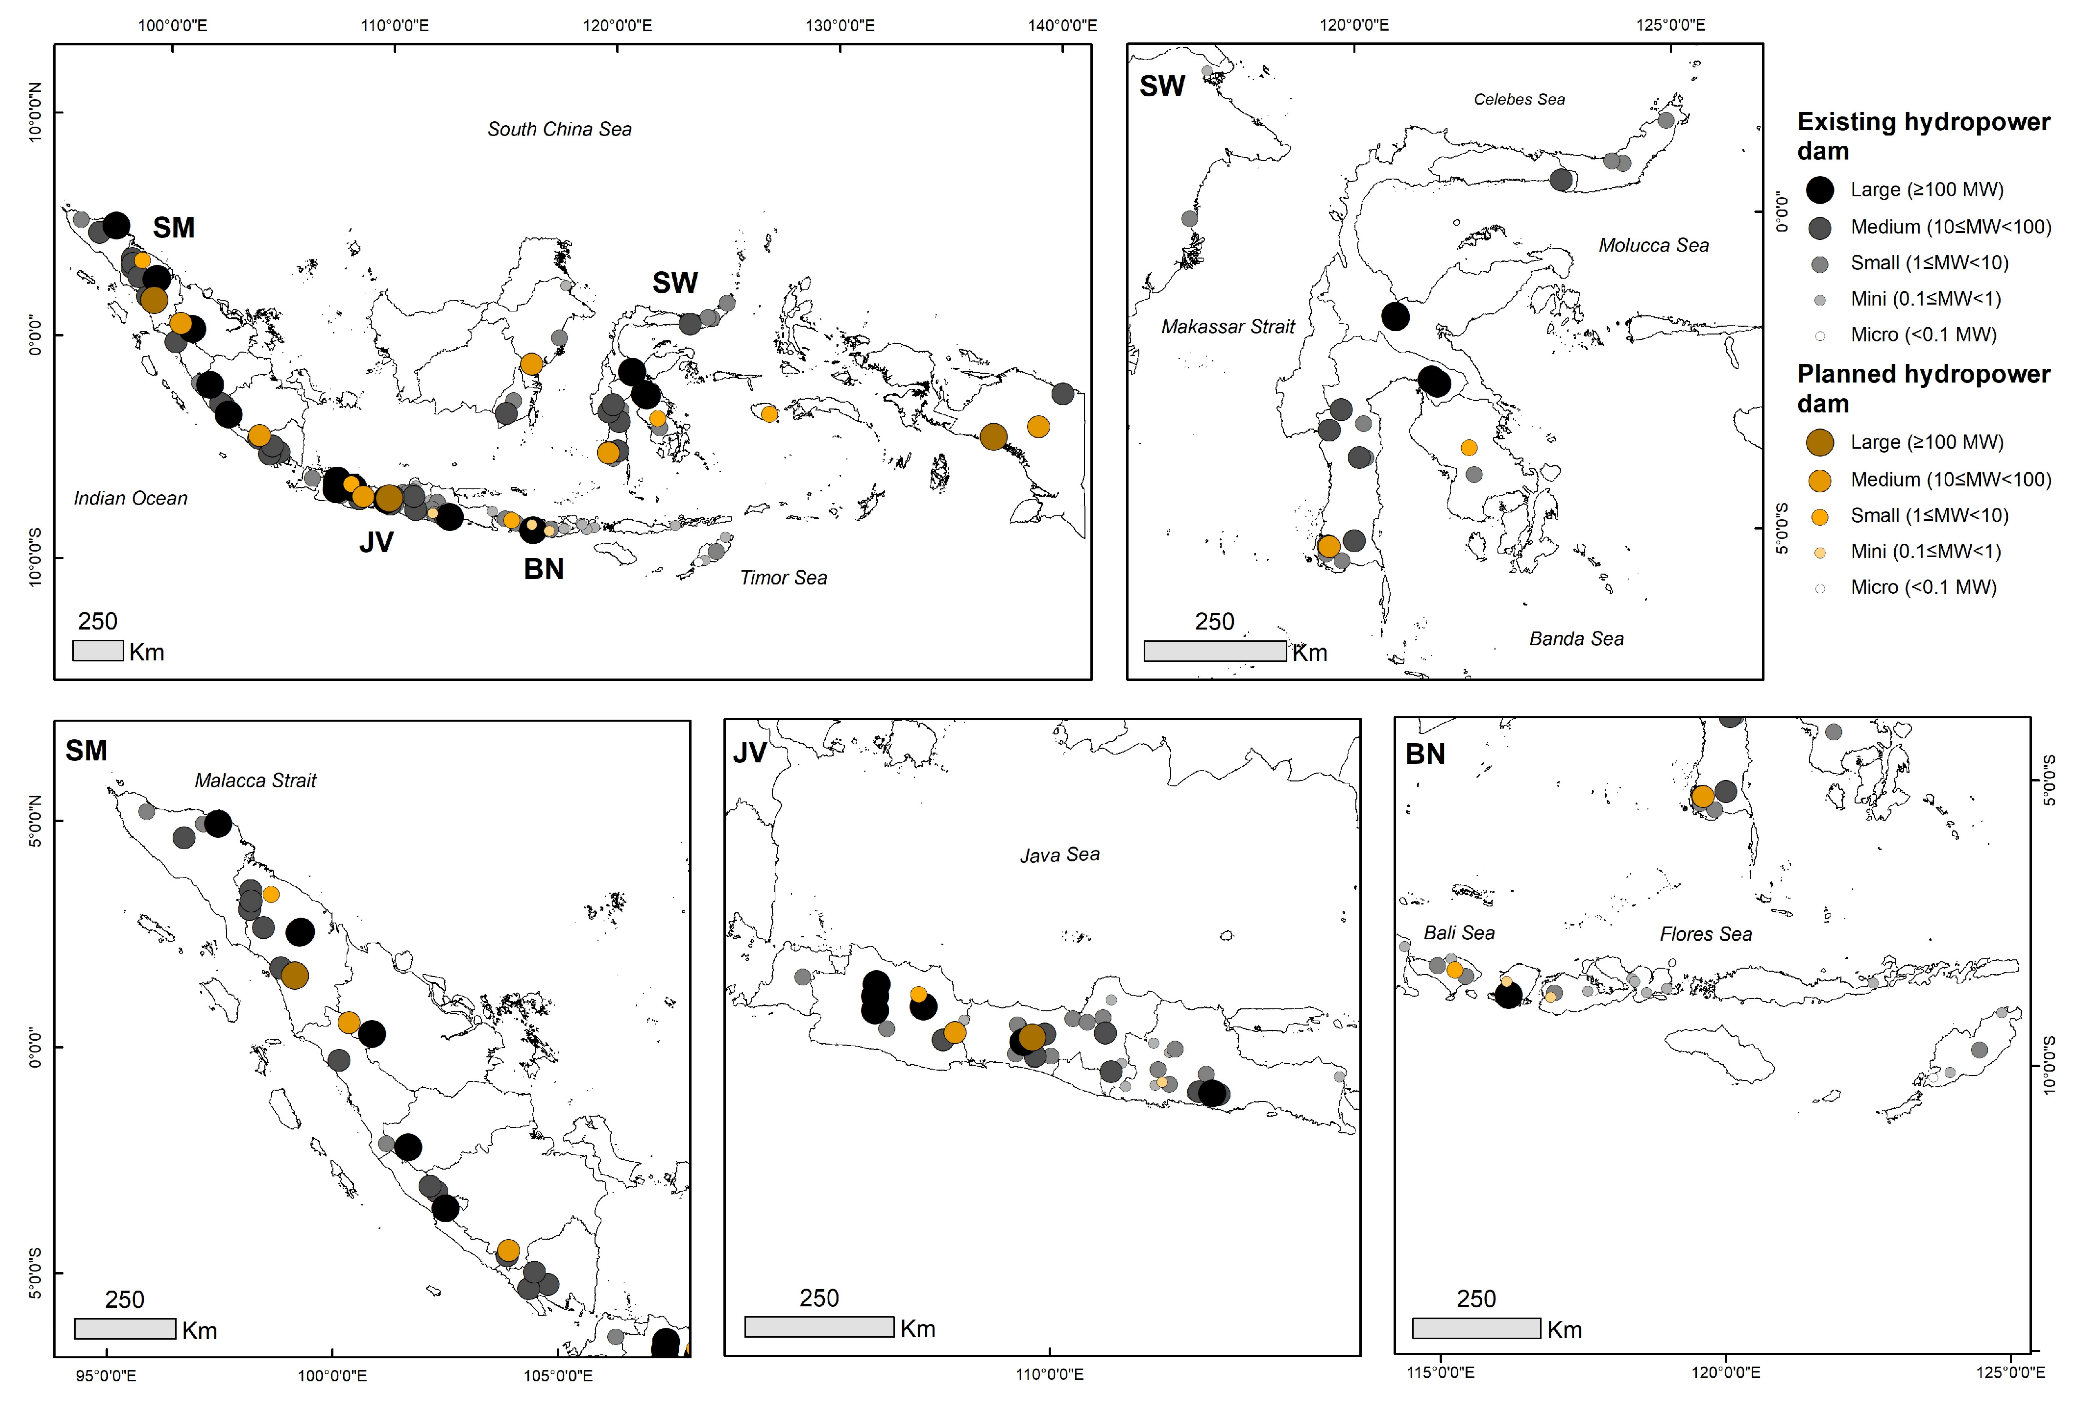
3.2. Hydropower Dams
3.3. Irrigation Dams
3.4. Water Supply and Storage Dams
3.5. Flood Control Dams
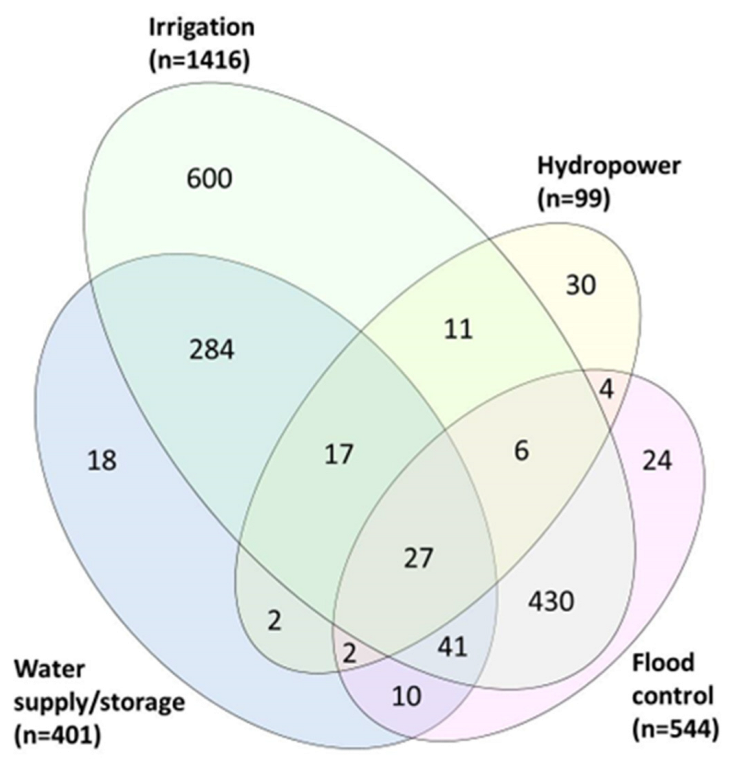
3.6. Dams Are Multipurpose
4. Evaluation of Dam Locations
5. Conclusions
Supplementary Materials
Author Contributions
Funding
Data Availability Statement
Conflicts of Interest
References
- DiFrancesco, K.; Woodruff, K. Global perspectives on large dams: Evaluating the state of large dam construction and decomissioning across the world. In Yale School of the Environment Publications Series; Yale: New Haven, CT, USA, 2007; Volume 33. [Google Scholar]
- Graf, W.L. Dam Removal: Science and Decision Making; Later Printing edition; Heinz III Center for Science, Economics & The Environment: Washington, DC, USA, 2002. [Google Scholar]
- Latrubesse, E.M.; Arima, E.Y.; Dunne, T.; Park, E.; Baker, V.R.; d’Horta, F.M.; Wight, C.; Wittmann, F.; Zuanon, J.; Baker, P.A.; et al. Damming the rivers of the Amazon basin. Nature 2017, 546, 363–369. [Google Scholar] [CrossRef] [PubMed]
- Latrubesse, E.M.; Sinha, R. Human impacts on sediment and morphodynamics of large tropical rivers. In Treatise on Geomorphology, 2nd ed.; Shroder, J.F., Ed.; Academic Press: Oxford, UK, 2022; pp. 187–213. [Google Scholar]
- Hirsch, P. Dams, resources and the politics of environment in mainland Southeast Asia. In The Politics of Environment in Southeast Asia; Routledge: Abingdon, UK, 2002; pp. 69–84. [Google Scholar]
- Bakker, K. The politics of hydropower: Developing the Mekong. Political Geogr. 1999, 18, 209–232. [Google Scholar] [CrossRef]
- Hirsch, P. The shifting regional geopolitics of Mekong dams. Political Geogr. 2016, 51, 63–74. [Google Scholar] [CrossRef]
- Suhardiman, D.; Wichelns, D.; Lebel, L.; Sellamuttu, S.S. Benefit sharing in Mekong Region hydropower: Whose benefits count? Water Resour. Rural Dev. 2014, 4, 3–11. [Google Scholar] [CrossRef]
- McDonald, K.; Bosshard, P.; Brewer, N. Exporting dams: China’s hydropower industry goes global. J. Environ. Manag. 2009, 90, S294–S302. [Google Scholar] [CrossRef]
- Ansar, A.; Flyvbjerg, B.; Budzier, A.; Lunn, D. Should we build more large dams? The actual costs of hydropower megaproject development. Energy Policy 2014, 69, 43–56. [Google Scholar] [CrossRef]
- Scudder, T.T. The Future of Large Dams: Dealing with Social, Environmental, Institutional and Political Costs; Routledge: Abingdon, UK, 2012. [Google Scholar]
- Sovacool, B.K.; Gilbert, A.; Nugent, D. Risk, innovation, electricity infrastructure and construction cost overruns: Testing six hypotheses. Energy 2014, 74, 906–917. [Google Scholar] [CrossRef]
- World Commission on Dams. Dams and Development: A New Framework for Decision-Making: The Report of the World Commission on Dams; Earthscan: Oxford, UK, 2000. [Google Scholar]
- Baran, E.; Jantunen, T.; Chong, C.K. Values of Inland Fisheries in the Mekong River Basin; WorldFish: Penang, Malaysia, 2007. [Google Scholar]
- Dugan, P.J.; Barlow, C.; Agostinho, A.A.; Baran, E.; Cada, G.F.; Chen, D.; Cowx, I.G.; Ferguson, J.W.; Jutagate, T.; Mallen-Cooper, M.; et al. Fish migration, dams, and loss of ecosystem services in the Mekong Basin. AMBIO 2010, 39, 344–348. [Google Scholar] [CrossRef]
- Latrubesse, E.M.; Park, E.; Sieh, K.; Dang, T.; Lin, Y.N.; Yun, S.-H. Dam failure and a catastrophic flood in the Mekong basin (Bolaven Plateau), southern Laos, 2018. Geomorphology 2020, 362, 107221. [Google Scholar] [CrossRef]
- Renaud, F.G.; Chardot, L.; Hamel, P.; Cremin, E.; Ng, D.K.S.; Balke, T.; Lallemant, D.; Friend, R.; Shi, X.; Lee, J.S.H.; et al. Adaptation and Resilience in ASEAN: Managing Disaster Risks from Natural Hazards (p30). UK Government, UK-Singapore COP26 ASEAN Climate Policy Report Series. 2021. Available online: https://www.gov.uk/government/publications/uk-singapore-cop26-universities-network-policy-reports/adaptation-and-resilience-in-asean-managing-disaster-risks-from-natural-hazards (accessed on 8 November 2022).
- Fujikura, R.; Nakayama, M. The long-term impacts of resettlement programmes resulting from dam construction projects in Indonesia, Japan, Laos, Sri Lanka and Turkey: A comparison of land-for-land and cash compensation schemes. Int. J. Water Resour. Dev. 2013, 29, 4–13. [Google Scholar] [CrossRef]
- Karimi, S.; Nakayama, M.; Fujikura, R.; Katsurai, T.; Iwata, M.; Mori, T.; Mizutani, K. Post-project review on a resettlement programme of the Kotapanjang dam project in Indonesia. Int. J. Water Resour. Dev. 2005, 21, 371–384. [Google Scholar] [CrossRef]
- Manatunge, J.; Takesada, N.; Miyata, S.; Herath, L. Livelihood rebuilding of dam-affected communities: Case studies from Sri Lanka and Indonesia. Int. J. Water Resour. Dev. 2009, 25, 479–489. [Google Scholar] [CrossRef]
- Rajendran, S.; Nasir, S.; Jabri, K.A. Mapping and accuracy assessment of siltation of recharge dams using remote sensing technique. Sci. Rep. 2020, 10, 10364. [Google Scholar] [CrossRef] [PubMed]
- Stark, T.D.; Oommen, T.; Ning, Z. Geotechnical Special Publication No. 322. Remote Sensing for Monitoring Embankments, Dams, and Slopes. Recent Advances; American Society of Civil Engineers: Reston, VA, USA, 2021. [Google Scholar]
- Xiao, R.; Jiang, M.; Li, Z.; He, X. New insights into the 2020 Sardoba dam failure in Uzbekistan from Earth observation. Int. J. Appl. Earth Obs. Geoinf. 2022, 107, 102705. [Google Scholar] [CrossRef]
- Speckhann, G.A.; Kreibich, H.; Merz, B. Inventory of dams in Germany. Earth Syst. Sci. Data 2021, 13, 731–740. [Google Scholar] [CrossRef]
- KPPIP (Komite Percepatan Penyediaan Infrastruktur Prioritas). Bendungan Kolhua. Available online: https://kppip.go.id/proyek-strategis-nasional/p-proyek-bendungan-dan-jaringan-irigasi/bendungan-kolhua/ (accessed on 27 August 2021).
- Kirchherr, J.; Pohlner, H.; Charles, K.J. Cleaning up the big muddy: A meta-synthesis of the research on the social impact of dams. Environ. Impact Assess. Rev. 2016, 60, 115–125. [Google Scholar] [CrossRef]
- Badan Pusat Statistik Provinsi DKI Jakarta. Population by Province in Indonesia (Thousand), 2016–2020. Available online: https://jakarta.bps.go.id/statictable/2021/09/22/309/jumlah-penduduk-menurut-provinsi-di-indonesia-ribu-2016-2020.html (accessed on 19 January 2023).
- Idris, A.M.S.; Permadi, A.S.C.; Sianturi, U.M.; Hazet, F.A. Strategic issues in dam operation and maintenance in Indonesia. J. Perenc. Pembang. Indones. J. Dev. Plan. 2019, 3, 225–238. [Google Scholar] [CrossRef]
- Peraturan Pemerintah Republik Indonesia. Nomor 37 Tahun 2010 Tentang Bendungan (Government Regulation no. 37/2010 about Dams). Available online: https://peraturan.bpk.go.id/Home/Details/5049 (accessed on 29 January 2023).
- Arias, M.E.; Piman, T.; Lauri, H.; Cochrane, T.A.; Kummu, M. Dams on Mekong tributaries as significant contributors of hydrological alterations to the Tonle Sap Floodplain in Cambodia. Hydrol. Earth Syst. Sci. 2014, 18, 5303–5315. [Google Scholar] [CrossRef]
- Vinh, V.D.; Ouillon, S.; Thanh, T.D.; Chu, L.V. Impact of the Hoa Binh dam (Vietnam) on water and sediment budgets in the Red River basin and delta. Hydrol. Earth Syst. Sci. 2014, 18, 3987–4005. [Google Scholar] [CrossRef]
- Walling, D.E. Human impact on land–ocean sediment transfer by the world’s rivers. Geomorphology 2006, 79, 192–216. [Google Scholar] [CrossRef]
- Walling, D.E. Human impact on the sediment loads of Asian rivers. In Sediment Problems and Sediment Management in Asian River Basins, 349; Walling, D.E., Ed.; IAHS Press: Wallingford, UK, 2011; Volume 350, pp. 37–51. [Google Scholar]
- Maavara, T.; Chen, Q.; Van Meter, K.; Brown, L.E.; Zhang, J.; Ni, J.; Zarfl, C. River dam impacts on biogeochemical cycling. Nat. Rev. Earth Environ. 2020, 1, 103–116. [Google Scholar] [CrossRef]
- Williams, A.; Porter, S. Comparison of hydropower options for developing countries with regard to the environmental, social and economic aspects. In Proceedings of the International Conference on Renewable Energy for Developing Countries, Zouk Mosbeh, Lebanon, 13–15 July 2016; Available online: https://files.udc.edu/docs/cere/Williams_Porter.pdf (accessed on 1 November 2022).
- Schultz, B. Role of dams in irrigation, drainage and flood control. Int. J. Water Resour. Dev. 2002, 18, 147–162. [Google Scholar] [CrossRef]
- Hasan, M.H.; Mahlia, T.M.I.; Nur, H. A review on energy scenario and sustainable energy in Indonesia. Renew. Sustain. Energy Rev. 2012, 16, 2316–2328. [Google Scholar] [CrossRef]
- USGS. EarthExplorer. Available online: https://earthexplorer.usgs.gov/ (accessed on 29 July 2022).
- Universitas Gadjah Mada. Konservasi DAS. Available online: https://konservasidas.fkt.ugm.ac.id/category/ensiklopedi-das/ (accessed on 27 August 2021).
- Kasiro, I.I.; Pangluar, D.; Nugroho, C.; Muchtar, A.; Martadi, H.; Suryadilaga, R.S. Bendungan Besar Di Indonesia. Available online: https://luk.staff.ugm.ac.id/BendunganBesarDiIndonesia.pdf (accessed on 27 August 2021).
- Wang, F.; Maberly, S.C.; Wang, B.; Liang, X. Effects of dams on riverine biogeochemical cycling and ecology. Inland Waters 2018, 8, 130–140. [Google Scholar] [CrossRef]
- Lees, A.C.; Peres, C.A.; Fearnside, P.M.; Schneider, M.; Zuanon, J.A.S. Hydropower and the future of Amazonian biodiversity. Biodivers. Conserv. 2016, 25, 451–466. [Google Scholar] [CrossRef]
- Yoshida, Y.; Lee, H.S.; Trung, B.H.; Tran, H.-D.; Lall, M.K.; Kakar, K.; Xuan, T.D. Impacts of mainstream hydropower dams on fisheries and agriculture in Lower Mekong Basin. Sustainability 2020, 12, 2408. [Google Scholar] [CrossRef]
- Barlow, C.; Baran, E.; Halls, A.S.; Kshatriya, M. How much of the Mekong fish catch is at risk from mainstream dam development. Catch Cult. 2008, 14, 16–21. [Google Scholar]
- Ziv, G.; Baran, E.; Nam, S.; Rodríguez-Iturbe, I.; Levin, S.A. Trading-off fish biodiversity, food security, and hydropower in the Mekong River Basin. Proc. Natl. Acad. Sci. USA 2012, 109, 5609. [Google Scholar] [CrossRef]
- Laurance, W.F.; Wich, S.A.; Onrizal, O.; Fredriksson, G.; Usher, G.; Santika, T.; Byler, D.; Mittermeier, R.; Kormos, R.; Williamson, E.A.; et al. Tapanuli orangutan endangered by Sumatran hydropower scheme. Nat. Ecol. Evol. 2020, 4, 1438–1439. [Google Scholar] [CrossRef]
- Wich, S.A.; Fredriksson, G.; Usher, G.; Kühl, H.S.; Nowak, M.G. The Tapanuli orangutan: Status, threats, and steps for improved conservation. Conserv. Sci. Pract. 2019, 1, e33. [Google Scholar] [CrossRef]
- Wettstein, I.B.H. Damming Evidence: How the Batang Toru Megadam Threatens a New Orangutan Species with Extinction. Available online: https://www.orangutans-sos.org/content/uploads/2018/05/Damming-Evidence.pdf (accessed on 10 January 2023).
- Chen, A.; Wu, M.; McClain, M.E. Classifying dams for environmental flow implementation in China. Sustainability 2020, 12, 107. [Google Scholar] [CrossRef] [Green Version]


| Name of Database | Description of Dataset | Source(s) of Data | Inclusion Criteria | No. of Indonesian Dams | Reference |
|---|---|---|---|---|---|
| Global Database (n = 6) | |||||
| FAO AQUASTAT | Detailed information on the location, height, reservoir capacity, surface area, and main purpose of dams in each country. Database has >14,000 dams. | International Commission on Large Dams (ICOLD); National reports; AQUASTAT national surveys; the Internet. | Mainly large dams with a height of ≥15 m. Dams 5–15 m tall with a reservoir volume of ≥3 million m3 were also included. Smaller dams were included as well, if available. | 242 | Food and Agriculture Organization of the United Nations [25] |
| Future Hydropower Reservoirs and Dams (FHRED) | Global inventory of at least 3700 future hydropower dams. Project name, geographical coordinates, river basin, hydroelectric capacity, and construction timeline included. | Scientific references, governmental and non-governmental sources, public databases, reports, and newspaper articles. | Hydropower dams >1 MW that are currently under construction or planned. | 1 | Zarfl et al. [26] |
| Global Dam Tracker (GDAT) | A global geospatial database of dams with detailed temporal information on when the dams were proposed, built or completed. 36,222 dams identified. | Primary data compiled from administrative sources and secondary data obtained from existing databases such as AQUATAT, GranD, and World Resources Institute (WRI). | Institutional backgrounds were examined to validate records on the design features of dams, locations were geo-referenced. | 248 | Zhang et al. [27] |
| Global Georeferenced Database of Dams (GOODD) | Largest open-source global geo-referenced database of dams to date containing >38,000 georeferenced dams with derived data on their associated catchments. Database contains reservoir dams with only a few run-of-river dams. | Dams identified by examining global water bodies datasets systematically, 1-degree tile by tile across the world and identifying reservoirs in Google Earth imagery. | Dams with concrete walls, observable in global satellite imagery from LANDSAT (15 m), IKONOS (<1 m), and SPOT (2.5 m). | 15 | Mulligan et al. [28] |
| Global Reservoir and Dam Database (GRanD v 1.3) | Georeferenced locations of 7320 dams with a total reservoir storage capacity of 6864 km2. | National repositories, the UNFCCC’s Clean Development Mechanism project registry, privately maintained databases like Roller Compacted Concrete Dams and for validation purposes information from the International Commission on Large Dams (ICOLD). | All reservoirs with a storage capacity >0.1 km2. Smaller reservoirs were included, if available. | 20 | Lehner et al. [29] |
| Open Street Map Dams (OSMDAM) | Global dam data based on OSM tags | Open Data Commons Open Database License; Open Street Map contributors. | NA | 99 | Data downloaded from: https://www.globaldamwatch.org/ (accessed on 1 November 2022) |
| Local Indonesian Database (n = 5) | |||||
| Water Resources Information System (Sistem Informasi Sumber Daya Air or SISDA) | Online database of existing and planned dams and weirs in Indonesia. | Directorate General of Water Resources, Indonesian Ministry of Public Works, and Housing. | NA | 556 (482 existing, 74 planned) | Direktorat Jenderal Sumer Daya Air Kementerian Pekerjaan Umum dan Perumahan Rakyat [30] |
| Committee for Acceleration of Priority Infrastructure Delivery (Komite Percepatan Penyediaan Infrastruktur Prioritas or KPPIP) | Online database of dam and irrigation network projects. | Coordinating Indonesian Minister of Economic Affairs, the Minister of the National Development Planning, the Minister of Finance, and the Minister of Agrarian and Spatial Planning. | NA | 61 | KPPIP [31] |
| Dam Construction Database (Database Pembangunan Bendungan) | Online database and of dams currently under construction or under planning in Indonesia. | Indonesian Ministry of Public Works and Housing. | Dams under construction or planned dams in Indonesia. | 87 (65 existing, 22 planned) | Kementerian Pekerjaan Umum dan Perumahan Rakyat [32] |
| Report on big dams in Indonesia (Bendungan Besar di Indonesia) | Inventory of dams published by the Indonesian Ministry of Public Works and Housing in 1995. | Data collected as part of the Technical Assistance Project for the Development and Security of Reservoirs by the Directorate General of Water Resources in collaboration with the Irrigation Research and Development Center, Balitbang PU. | Dam height ≥15 m, height range from 10–15 m. Meets one of the following criteria: (1) Crest length of at least 500 m, (2) capacity of reservoir <1 million m3, overflow capacity <2000 m3/s | 82 | Kasiro et al. [33] |
| Bali Bureau of Statistics (Badan Pusat Statistik Provinsi Bali) | Dikes/dams in Bali with details such as the irrigation area, name of river, year of completion, and dam capacity (m3/s). | Bali Bureau of Statistics. | NA | 128 | Indonesian Bureau of Statistics [34] |
| Main Island | Province or Groups of Islands |
|---|---|
| Sumatra | Aceh, North Sumatra, West Sumatra, Riau, Riau Islands, Bengkulu, Jambi, South Sumatra, Bangka-Belitung, and Lampung |
| Java | Banten, Jakarta, West Java, Central Java, Yogyakarta, and East Java. |
| Kalimantan | North Kalimantan, East Kalimantan, South Kalimantan, Central Kalimantan, and West Kalimantan. |
| Sulawesi | North Sulawesi, Gorontalo, Central Sulawesi, West Sulawesi, South Sulawesi, and Southeast Sulawesi. |
| Maluku | North Maluku and Maluku Dams in North Maluku and Maluku were grouped under the name “Maluku” due to the small number of dams |
| Papua | West Papua and Papua Dams in West Papua and Papua were grouped together under the name “Papua” for analysis. |
| Bali Nusra | Bali, West Nusa Tenggara, and East Nusa Tenggara Dams in these islands were grouped under Bali Nusra |
| Variable | Unit | Description |
|---|---|---|
| Latitude | Latitude | |
| Longitude | Longitude | |
| Dam_Name | Name of dam | |
| Alt_Name | Alternative name | |
| Construction type | Construction material used for the dam | |
| Reservoir | Name of reservoir if present | |
| River | Name of river if present | |
| Watershed | Name of watershed catchment | |
| Admin1 | Name of province | |
| Admin2 | Name of district | |
| Admin3 | Name of subdistrict | |
| Admin4 | Name of village | |
| Year_Fin | Year construction finished (YYYY) | |
| Year_Const | Year construction started (YYYY) | |
| Height_from_riverbed | m | Height of dam from riverbed (m) |
| Height_from_digging_level | m | Height of dam from digging level (m) |
| Dam_length | m | Length of dam (m) |
| Width | m | Width of dam (m) |
| Dam_volume | m3 | Volume of dam (m3) |
| Reservoir_Volume_Normal | million m3 | Normal reservoir volume (million m3) |
| Reservoir_Volume_Max | million m3 | Max reservoir volume (million m3) |
| Reservoir_Volume_Min | million m3 | Min reservoir volume (million m3) |
| Area_Rep | ha | Normal reservoir area (ha) |
| Area_Max | ha | Max reservoir area (ha) |
| Area_Min | ha | Min reservoir area (ha) |
| FLOOD_ELEVATION | m | Reservoir inundation elevation during flood (m) |
| NORMAL_ELEVATION | m | Normal reservoir inundation elevation (m) |
| MINIMUM_ELEVATION | m | Min reservoir inundation elevation (m) |
| HYDROPOWER | MWH | Dam output per year (MWH) |
| IRRIGATION | ha | Area irrigated (ha) |
| Discharge (Q) | m3/s | River discharge (m3/s) |
| Area_watershed | km2 | Area of watershed (km2) |
| Annual_Rainfall | mm | Annual rainfall in catchment (mm) |
| P_Irrig | Purpose of dam: Irrigation | |
| P_Hydro | Purpose of dam: Hydroelectricity | |
| P_Wsupp/Wstor | Purpose of dam: Water supply/storage | |
| P_FCont | Purpose of dam: Flood control | |
| P_Navig | Purpose of dam: Navigation | |
| P_Fishr | Purpose of dam: Fishing | |
| P_Livst | Purpose of dam: Livestock water supply | |
| P_Recrn | Purpose of dam: Recreation | |
| P_PCont | Purpose of dam: Pollution control | |
| P_Other | Purpose of dam: Other purpose | |
| Note | “unsp” used if the dam purpose was derived by our criteria | |
| Main_P | Main purpose | |
| Sec_P | Secondary purpose | |
| HYDROPOWER (MW) | MW | Dam capacity (MW) |
| Status | Existing—E; Under construction—U; Planned—P | |
| Catchment | Name of catchment from DEM | |
| Stream order | Stream order of the river where the dam is | |
| Type | Mainstream or tributary dam | |
| REFERENCE_n | Reference of dam information, n refers to the number of different references |
| Construction Type | Frequency | |||||
|---|---|---|---|---|---|---|
| Total | Sumatra | Java | Kalimantan | Sulawesi | Bali Nusra | |
| Arch dam | 1 | 1 | ||||
| Composite masonry and earth dam | 1 | 1 | ||||
| Composite of gravity masonry and earth dam | 1 | 1 | ||||
| Concrete composite and earth core rockfill dam | 1 | 1 | ||||
| Concrete composite and earth dam | 2 | 1 | 1 | |||
| Concrete composite and rockfill dam | 1 | 1 | ||||
| Concrete gravity dam | 7 | 3 | 3 | 1 | ||
| Concrete membrane faced rockfill dam | 2 | 1 | 1 | |||
| Earth core rockfill dam | 22 | 3 | 12 | 2 | 5 | |
| Earth fill dam/earth dam/embankment dam | 1 | 1 | ||||
| Homogeneous earth dam | 35 | 5 | 21 | 3 | 6 | |
| Mixed concrete membrane faced rockfill dam | 1 | 1 | ||||
| Non-homogeneous earth dam | 3 | 3 | ||||
| Pair gravity dam | 1 | 1 | ||||
| Rockfill dam | 1 | 1 | ||||
| Sloping earth core rockfill dam or rockfill dam with sloping earth core | 1 | 1 | ||||
| Steel membrane faced rockfill dam | 1 | 1 | ||||
| Island (No. Dams) | Mainstream Dams | Tributary Dams | Ratio of Mainstream Dams to Total Dams | Ratio of Tributary Dams to Total Dams |
|---|---|---|---|---|
| Sumatra (241) | 40 | 201 | 0.17 | 0.83 |
| Java (697) | 67 | 630 | 0.10 | 0.90 |
| Kalimantan (58) | 6 | 52 | 0.10 | 0.90 |
| Sulawesi (153) | 46 | 107 | 0.30 | 0.70 |
| Bali Nusra (326) | 97 | 229 | 0.30 | 0.70 |
| Maluku (16) | 5 | 11 | 0.31 | 0.69 |
| Papua (15) | 4 | 11 | 0.27 | 0.73 |
| Total (1506) | 265 | 1241 |
Disclaimer/Publisher’s Note: The statements, opinions and data contained in all publications are solely those of the individual author(s) and contributor(s) and not of MDPI and/or the editor(s). MDPI and/or the editor(s) disclaim responsibility for any injury to people or property resulting from any ideas, methods, instructions or products referred to in the content. |
© 2023 by the authors. Licensee MDPI, Basel, Switzerland. This article is an open access article distributed under the terms and conditions of the Creative Commons Attribution (CC BY) license (https://creativecommons.org/licenses/by/4.0/).
Share and Cite
Yuen, K.W.; Park, E.; Hazrina, M.; Taufik, M.; Santikayasa, P.; Latrubesse, E.; Lee, J.S.H. A Comprehensive Database of Indonesian Dams and Its Spatial Distribution. Remote Sens. 2023, 15, 925. https://doi.org/10.3390/rs15040925
Yuen KW, Park E, Hazrina M, Taufik M, Santikayasa P, Latrubesse E, Lee JSH. A Comprehensive Database of Indonesian Dams and Its Spatial Distribution. Remote Sensing. 2023; 15(4):925. https://doi.org/10.3390/rs15040925
Chicago/Turabian StyleYuen, Kai Wan, Edward Park, Melda Hazrina, Muh Taufik, Putu Santikayasa, Edgardo Latrubesse, and Janice Ser Huay Lee. 2023. "A Comprehensive Database of Indonesian Dams and Its Spatial Distribution" Remote Sensing 15, no. 4: 925. https://doi.org/10.3390/rs15040925