Article

Continuous Intra-Annual Changes of Lake Water Level and Water Storage from 2000 to 2018 on the Tibetan Plateau

1
National Supercomputing Center in Zhengzhou, Zhengzhou University, Zhengzhou 450001, China
2
School of Geoscience and Technology, Zhengzhou University, Zhengzhou 450001, China
3
School of Remote Sensing and Information Engineering, Wuhan University, Wuhan 430079, China
*
Author to whom correspondence should be addressed.
Remote Sens. 2023, 15(4), 893; https://doi.org/10.3390/rs15040893
Submission received: 29 December 2022 / Revised: 28 January 2023 / Accepted: 2 February 2023 / Published: 6 February 2023
(This article belongs to the Special Issue Remote Sensing of Land Water Bodies)

Abstract

:
There is a large amount of lakes on the Tibetan Plateau (TP), which are very sensitive to climate change. Understanding the characteristics and driving mechanisms of lake change are crucial for understanding climate change and the effective use of water resources. Previous studies have mainly focused on inter-annual lake variation, but the continuous and long-term intra-annual variation of lakes on the TP remains unclear. To address this gap, we used the global surface water (GSW) dataset and the Shuttle Radar Topography Mission (SRTM) DEM to estimate the water level and storage changes on the TP. The results indicated that the average annual minimum lake water level (LWLmin) and the average annual maximum lake water level (LWLmax) increased by 3.09 ± 0.18 m (0.16 ± 0.01 m/yr) and 3.69 ± 0.12 m (0.19 ± 0.01 m/yr) from 2000 to 2018, respectively, and the largest change of LWLmin and LWLmax occurred in 2002–2003 (0.45 m) and 2001–2002 (0.39 m), respectively. Meanwhile, the annual minimum lake water storage change (LWSCmin) and annual maximum lake water storage change (LWSCmax) were 125.34 ± 6.79 Gt (6.60 ± 0.36 Gt/yr) and 158.07 ± 4.52 Gt (8.32 ± 0.24 Gt/yr) from 2000 to 2018, and the largest changes of LWSCmin and LWSCmax occurred in the periods of 2002–2003 (17.67 Gt) and 2015–2016 (17.51 Gt), respectively. The average intra-year changes of lake water level (LWLCintra-year) and the average intra-year changes of lake water storage (LWSCintra-year) were 0.98 ± 0.23 m and 40.19 ± 10.67 Gt, respectively, and the largest change in both LWLCintra-year (1.44 m) and LWSCintra-year (62.46 Gt) occurred in 2018. The overall trend of lakes on the TP was that of expansion, where the LWLC and LWSC in the central and northern parts of the TP was much faster than that in other regions, while the lakes in the southern part of the TP were shrinking, with decreasing LWLC and LWSC. Increased precipitation was found to be the primary meteorological factor affecting lake expansion, and while increasing glacial meltwater also had an important influence on the LWSC, the variation of evaporation only had a little influence on lake change.

1. Introduction

The Tibetan Plateau (TP) is located in central Asia, with an average elevation more than 4000 m, and is called the third pole in the world along with other surrounding areas [1]. The climate change is obvious on the TP; the increasing rate of temperature was 0.039 °C/yr (p < 0.001) from 1960 to 2014 based on 71 stations [2], which was approximately twice the global average temperature rise rate (0.018 °C/yr) in the same period. The cause of warming was perhaps due to snow albedo feedback [3], and pronounced stratospheric ozone depletion [4]. Warming had affected the change of water resource on the TP, quick melt from glaciers and permafrost, and precipitation on the TP showed an upward trend [5,6]. At the same time, the evaporation in the western part of the TP had been decreasing and the trend of evaporation in the eastern part of the TP significantly increased [7]. Lakes are a sensitive indicator of climate change and an important part of the terrestrial hydrosphere; its space–time changes can well reflect climate and environmental changes [8]. The TP is home to the world’s highest and largest number of highland lakes, known as the Asian Water Tower [9,10]. According to the survey statistics, the TP currently has a total area of more than 4.65 × 10⁵ km² of 1171 lakes with an area more than 1 km² [11]. Lakes are little affected by human activities due to the high altitude and poor accessibility in the TP. Against the background of warming, humid climate and glacier retreat on the TP, the state of its lakes has undergone dramatic changes, and the changes have had an important impact on climate, ecology, and the lives of local residents [12,13,14]. Therefore, the changes of the lakes on the TP is an important index to study the changes of regional climate and ecological environment [15].
Continuous lake level monitoring is of great significance in climate change research. Traditional lake water level monitoring allows for real-time observation through hydrological sites. However, the TP is characterized by a large number of lakes with wide distribution range, high altitude, and remote location, and the actual hydrological monitoring environment is relatively harsh. At present, there are only several hydrological observation stations built on the TP (e.g., Qinghai Lake, YamzhoYumco, and Nam Co), which are very limited compared to the more than 1200 lakes in the region. As such, the measured lake water level data cannot fully reflect the change in lake level throughout the whole of the TP [16]. With the continuous progress of altimetry satellite technology, altimetry satellites have become an important tool for monitoring the changes in LWL and LWS [17,18,19]. For example, Hydroweb, DAHITI, and G-REALM data have been used to estimate the seasonal water volume change (of 1390.91 ± 79.91 km³) in 463 lakes and reservoirs with an area more than 10 km², aiming to advance the existing understanding of the role of the seasonal change of lakes and storage change in regulating global and regional water cycles and the contribution of surface water storage to sea level rise [20]. The Cryosat-2 SARIn mode data have a spatial resolution of 250 m and a 30-day sub-cycle along the orbital direction, and can be used to monitor lake water level changes [21]. CryoSat-2 has been used to monitored three stages of water level changes in more than 200 lakes on the TP from 2010 to 2019, showing that lake levels have risen by an average of 2.19 m in the past ten years, 56% of which occurred in the last three years [22]. The accuracy of ICESat/ICESat-2 data is higher than that of other altimetry satellites and, so, they have been widely used in LWL and LWSC monitoring [23,24,25,26]. ICESat data have been used to monitor the water levels of 111 lakes on the TP, indicating that 84% of lakes and 89% of salt lakes on the TP showed lake level rises, which was consistent with the observed accelerated melting of glaciers [24]. Using ICESat and ICESat-2, the water level and water storage changes of 242 lakes with an area more than 1 km² on the TP have been determined; the rate of change in water level was 0.20 ± 0.04 m/yr, and the total water storage of all lakes on the TP was 11.51 ± 2.26 Gt/yr (Gt = km3 with an assumption that the density of lake water is 1000 kg/m3) in the period 2003–2019 [10,27]. The changes in water level and water storage of 62 lakes on the TP from 2003 to 2018 have been observed using ICESat/ICESat-2, and the 62 lakes examined showed a mean rate of water level change of 0.28 ± 0.03 m/yr from 2003−2018, with 58 lakes increasing (mean rate 0.30 ± 0.03 m/yr) and 4 lakes decreasing (mean rate −0.12 ± 0.06 m/yr), and a total change of lake water storage of ~14 Gt/yr was estimated [28]. Lake water level change is an important index in the study of lake water storage change (LWSC); however, ICESat and Cryosat-2 can only monitor a part of the lakes on the TP [21,28].
The Shuttle Radar Topography Mission (SRTM) DEM (Digital Elevation Model) provides reliable terrain data for the TP. We can estimate the LWSC, according to the relationship between lake area and lake elevation. Yang et al. (2017) have used the SRTM DEM and Landsat imagery to estimate the LWSC (larger than 50 km²) on the TP, and showed that the LWSC had increased by 102.64 km³ (2.77 km³/yr) from 1976 to 2013, and compared the accuracy with the bathymetric results for five lakes, indicating that the average relative error was only 4.98% [29]. Yao et al. (2018) have suggested that the LWSC increased by 7.34 ± 0.62 Gt/yr during 2002–2015 in the inner TP by using a similar method as Yang et al. (2017), and the accuracy was considered to be approximately 7.2%, by comparing 18 lakes with Hydroweb hypsometry [30]. Qiao et al. (2019a) have also suggested that the average error between this method and ICESat data was approximately 7.2% [31]. Qiao et al. (2019b) have analysed the LWSC of 315 lakes (larger than 10 km²) on the TP, and showed that the LWSC had decreased by 23.69 Gt from 1976 to 1990 and increased by 140.8 Gt from 1990 to 2013 [32]. Zhang et al. (2021) combined with SRTM DEM, have suggested that the LWSC of 1132 lakes (larger than 1 km²) increased by 169.7 ± 15.1 Gt from 1976 to 2019, and by 157 ± 11.6 Gt in the entire inner TP, where the contribution of glacial meltwater to the increase of LWSC was less than 30% [33].
However, most previous studies have focused on the inter-annual LWSC, while there has been little research on the intra-annual and continuous analysis of the LWLC, LWSC, LWLCintra-year, and LWSCintra-year on the TP. Therefore, we analysed the changes and causes of the intra-annual LWL and LWSC on the TP from 2000 to 2018. The purpose of this study is to (1) extract the lake area of maximum and minimum water bodies from 2000 to 2018 based on the GSW data set; (2) estimate the LWLC and LWSC by utilizing the SRTM DEM, as well as analysing its change characteristics and spatial differences; and (3) analyse the driving mechanism of lake change on the TP considering the change trends of meteorological factors and glacier distribution.

2. Materials

We used the GSW data set from the European Joint Research Centre (JRC). The construction of the GSW data set involved the use of more than 4 million remote sensing images from Landsat 5, Landsat 7, and Landsat 8 from 1984 to 2018 to extract global surface water bodies in an expert system, which provides flexibility and visual analytics combining human cognitive and perceptual abilities, and the precision of boundary extraction was controlled in a pixel (30 m) [34].
Precipitation data are an important part of the water cycle when analysing terrestrial water storage; therefore, we obtained the Tropical Precipitation Measuring Mission (TRMM) data from the National Aerospace and Space Administration Goddard Space Flight centre (https://trmm.gsfc.nasa.gov/). Yang et al. (2018) used measured precipitation data from the China Meteorological Administration to test the uncertainty of the TRMM, and suggested that the accuracy of this data is high in the Taihang Mountains (R2 = 0.97, RMSE = 10 mm, p < 0.01), Hengduan Mountains (R2 = 0.98, RMSE = 8 mm, p < 0.01) and Karst area (R2 = 0.98, RMSE = 12 mm, p < 0.01) in some typical mountainous regions in China [35], and suggested that the relationship was 0.87 at the annual precipitation and 0.91 at monthly scales by comparing with gauge stations [36].
The National Centre for Environmental Prediction (NCEP) Climate Forecast System (CFS) is a fully coupled model representing the interaction between the Earth’s atmosphere, oceans, land, and sea ice [37]. The RMSE of this dataset was near 1 °C below 200 hPa, and 1.5 °C at 100 hPa in the eastern TP, and 1.8 °C in the western part of TP [38]. We used the meteorological factors of surface temperature from the NCEP data set to describe the annual average temperature change on the TP.
For endorheic lakes, lake surface water evaporation may be the only way for lake water to escape. Therefore, lake evaporation is also an important factor influencing lake water balance. However, as no complete and mature data set for lake evaporation exists at present, we used the actual evaporation data set for the Tibet Plateau, obtained from the National Qinghai-Tibet Plateau Scientific Data Center (http://data.tpdc.ac.cn, accessed on 1 February 2023). This data set contains the actual monthly average surface evaporation of the TP from 2001 to 2018, with a spatial resolution of 0.1 degrees. The data set mainly takes satellite remote sensing data (MODIS) and re-analysis meteorological data (CMFD) as input, and is calculated using the surface energy balance system model (SEBS). In the process of calculating turbulent flux, a sub-grid terrain drag parameterization scheme is introduced, in order to improve the simulation of surface sensible heat flux and latent heat flux. In addition, the evaporation output from the model was verified using the observation data of six turbulent flux stations on the TP, showing high accuracy with small RMSE (9.3–14.5 mm/month). This data set can be used to study the land–atmosphere interaction and water cycle characteristics of the TP [7].
The data set of China’s Second Glacier Inventory was obtained from the National Qinghai-Tibet Plateau Scientific Data Center (http://data.tpdc.ac.cn), comprising vector data. This data set is based on Landsat series remote sensing satellite data, combined with a global digital elevation model to obtain glacier boundaries and glacier attributes within China. The accuracy of this dataset was evaluated with two positioning accuracies, suggesting that this dataset had a high accuracy with ±3.2% [39,40].

3. Methods

3.1. Lake Area Extraction from the GSW

The GSW data set has a raster data format with a spatial resolution of 30 m, and is divided into two categories: map products and water history. We mainly used the maximum water extent from the map products and the yearly water classification history from water history, and all data were downloaded using JavaScript. The maximum water extent included all water bodies that can be monitored using remote sensing imagery from 1984 to 2018. We extracted lakes with a maximum extent (LME) of more than 10 km² on the TP from 1984 to 2018 using Google Earth Engine. Seasonal water bodies can reflect seasonal changes in water bodies during the year, while changes in permanent water bodies can truly reflect annual changes in water bodies. The details of the processing are given below.
(1) We obtained the LME and yearly water classification history (included permanent water and seasonal water) data from the Google Earth Engine. (2) According to the yearly water classification history data, we combined LME areas of more than 10 km² on the TP to select seasonal and permanent water bodies to calculate the annual maximum areas of lakes (LAmax), and used the permanent water to calculate the annual minimum areas of lakes (LAmin) using the Google Earth Engine. (3) As the GSW data set was obtained from the original images (e.g., Landsat 5, Landsat 7, and Landsat 8), some lake boundaries may have been strip-damaged or subjected to natural factors (e.g., clouds, rivers, glaciers, wetland), resulting in partial water bodies not being fully extracted. Thus, we deleted low-quality data and visually interpreted and manually modified the boundaries of the lakes in conjunction with Google Earth. (4) For missing annual lake water body data, we fit the area using the years near the missing data. (5) All data were defined uniformly using the Albers conical equal area projection coordinate system. The distribution of water bodies in 2000 and 2018 are shown in Figure 1, where Figure 1a (2000) and Figure 1b (2018) show the seasonal water bodies, Figure 1c (2000) and Figure 1d (2018) show the minimum lake extent, and Figure 1e (2000) and Figure 1f (2018) show the maximum lake extent.

3.2. LWL and LWSC Estimation Based on the GSW and SRTM

The SRTM was jointly surveyed by NASA and the National Bureau of Surveying and Mapping (NIMA) of the U.S. Department of Defense on 11 February 2000 [41]. The mission obtained radar image data between 60 degrees north latitude and 56 degrees south latitude, covering more than 80 percent of the Earth’s land surface, and processed it to create a digital elevation model. Here, we used the one arc-second SRTM-1 DEM with a mean error (ME) of 0.11 m and a mean absolute error (MAE) of 3.50 m, which has been previously validated for High Mountain Asia [42]. The holes in this data set have been filled using open-source data such as ASTER GDEM 2, GMTED 2010, and NED. Since 2000, the water level of most lakes in the TP has increased and, so, the SRTM DEM offers the possibility of establishing the relationship between lake area and lake level, thus allowing for estimation of the LWSC [29,32]. We used a 100 m buffer outward of the LME, recorded the corresponding area from the lowest elevation based on the SRTM DEM and, for every 1 m increase in elevation, we summed the recorded area until the recorded area was equal to the 100 m buffer area outward of the LME. At this point, we stopped the area recording and accumulation. Based on the SRTM DEM, we established a relationship between lake area and elevation. The LWSC can be obtained according to changes in lake area and water level [43]. This equation had been used to estimate the LWSC in previous studies [29,31,32,33].
Δ V = 1 3 × S 1 + S 1 × S 2 + S 2 × Δ h
△V represents the LWSC during the two periods, S1, S2 represent the lake surface areas of the two periods, and △h represents the change of the LWL during the two periods.
At the same time, we calculated the LWLCintra-year and LWSCintra-year based on the LAmin and LAmax obtained in each year. Δ h j represents the average LWLCintra-year of lake j from 2000 to 2018. h jmin and h jmax represent the LWLmin and LWLmax of the lake j in each year, respectively. According to the acquired lake area and the change in LWL, the LWSC was then calculated. Δ V j represents the LWSCintra-year of lake j from 2000 to 2018, while A jmin and A jmax represent the average LAmin and average LAmax from 2000 to 2018, respectively.
Δ h j = 1 n i n h jmax h jmin
Δ V j = Δ h j ×   A jmax +   A jmin +   A jmax ×   A jmin 3

4. Results

4.1. Accuracy Verification of Lake Water Level Changes

To verify the feasibility of retrieving the LWL and LWSC between the lake areas obtained from GSW and the SRTM DEM, we compared the LAmin and LAmax of 410 lakes in 2000 with the area of lakes obtained from the SRTM DEM in 2000, and found that they were highly correlated (Figure 2). Comparing the LAmin (Figure 2a) and LAmax (Figure 2b) with the SRTM DEM lake area in 2000, the correlation coefficient (R2) was greater than 0.99 and the standard error (RMSE) was 15.277 km² and 17.931 km², respectively. Qinghai Lake has continuous lake water level observation data from 1976 to 2018. Zhang et al. (2019) have compared the ICESat/ICESat-2 altimetry satellite observation data from 2000 to 2018 with the measured water level of Qinghai Lake, where R2 = 0.95 and RMSE = 0.1 m, and the research results demonstrated that altimetry satellite data could be well-applied to lake water level monitoring. We utilized the water levels of 61 lakes from Zhang et al. (2019), which could be monitored on the TP observed by ICESat/ICESat-2 from 2003 to 2018, for comparison with the water levels of the 61 lakes monitored in our study, and found that the overall correlation between the two was relatively high. Figure 2 shows that the change of LWLmin (Figure 2c) and LWLmax (Figure 2d), compared with the ICESat/ICESat-2 satellite altimetry water level, where the R2 values were both greater than 0.75, and the average error was 0.77 m.

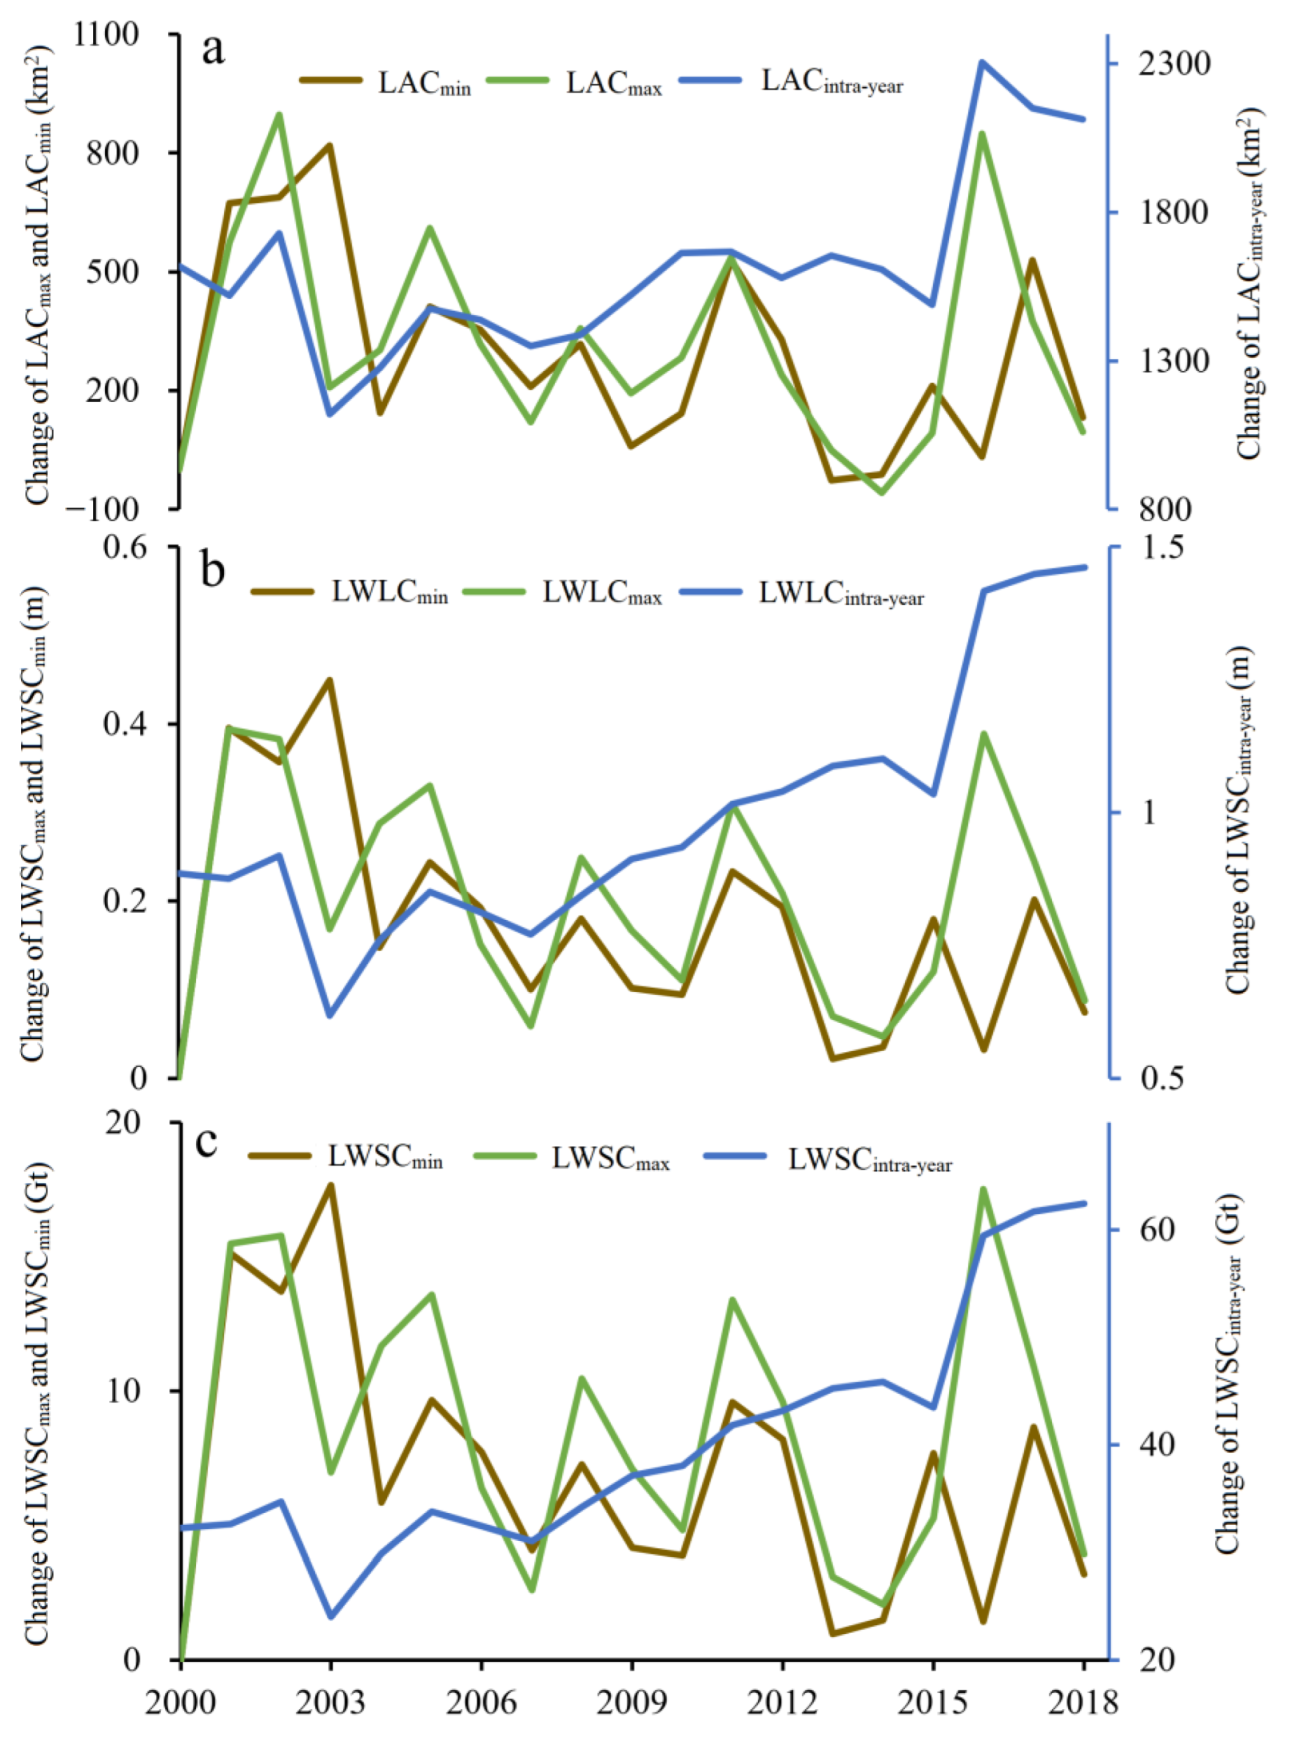
4.2. The Change of LWL and LWSC on the TP

The lakes were found to be generally expanding from 2000 to 2018 on the TP (Figure 3 and Figure 4). The LAmin increased by 5161.32 ± 340.81 km² (271.65 ± 17.94 km²/yr; Figure 3a), with 58 lakes shrinking and 352 lakes expanding from 2000 to 2018 (Figure 4a). The LAmin increased the most in 2003 (818.52 km²) and decreased the most in 2013 (27.24 km²). The LAmax increased by 5808.81 ± 255.88 km² (305.73 ± 13.47 km²/yr), with 19 lakes shrinking and 391 lakes expanding from 2000 to 2018. The LAmax increased the most in 2012 (896.18 km²) and decreased the most in 2014 (58.51 km²; Figure 3a and Figure 4b).
We integrated the LA and the LWLC to calculate the average LWLC in multiple lakes and found that the LWL and LWSC showed an overall increased trend from 2000 to 2018 (Figure 3b,c). Compared with 2000, the average LWLmin increased by 3.09 ± 0.18 m (0.16 ± 0.01 m/yr) in 2018, increased the most in 2003 (0.45 m), and changed the least in 2013 (0.02m) (Figure 3b and Figure 4d). The average LWLmax increased by 3.69 ± 0.12 m (0.19 ± 0.01 m/yr) from 2000 to 2018, increased the most in 2001 (0.39 m), and changed the least in 2014 (0.05 m) (Figure 3b and Figure 4e).
The total LWSCmin increased by 125.34 ± 6.79 Gt (6.60 ± 0.36 Gt/yr), where the LWSCmin decreased by 3.06 ± 0.35 Gt (0.16 ± 0.02 Gt/yr) in shrinking lakes, and increased by 128.40 ± 6.77 Gt (6.76 ± 0.36 Gt/yr) in expanding lakes from 2000 to 2018. The LWSCmin changed the most in 2003 (17.67 Gt) and the least in 2013 (0.97 Gt; Figure 3c and Figure 4g). The total LWSCmax increased by 158.07 ± 4.52 Gt (8.32 ± 0.24 Gt/yr), where the LWSCmax decreased by 6.42 ± 0.49 Gt (0.34 ± 0.03 Gt/yr) in shrinking lakes and increased by 164.50 ± 4.30 Gt (8.66 ± 0.23 Gt/yr) in expanding lakes from 2000 to 2018. The LWSCmax changed the most in 2016 (17.51 Gt) and the least in 2014 (2.08 Gt).
Next, we analysed the intra-annual changes in lakes. The average annual change in lake area was 1614.53 ± 289.87 km² from 2000 to 2018 on the TP, with the least change in 2003 (1119.83 km²) and the most in 2016 (2304.61 km²; Figure 3a and Figure 4c). The average annual change in LWL was 0.98 ± 0.23 m, with the least change in 2003 (0.61 m) and the most in 2018 (1.44 m; Figure 3b and Figure 4f). The average LWSCintra-year was 40.19 ± 10.67 Gt from 2000 to 2018, which changed the most in 2018 (62.46 Gt) and the least in 2003 (24.05 Gt).

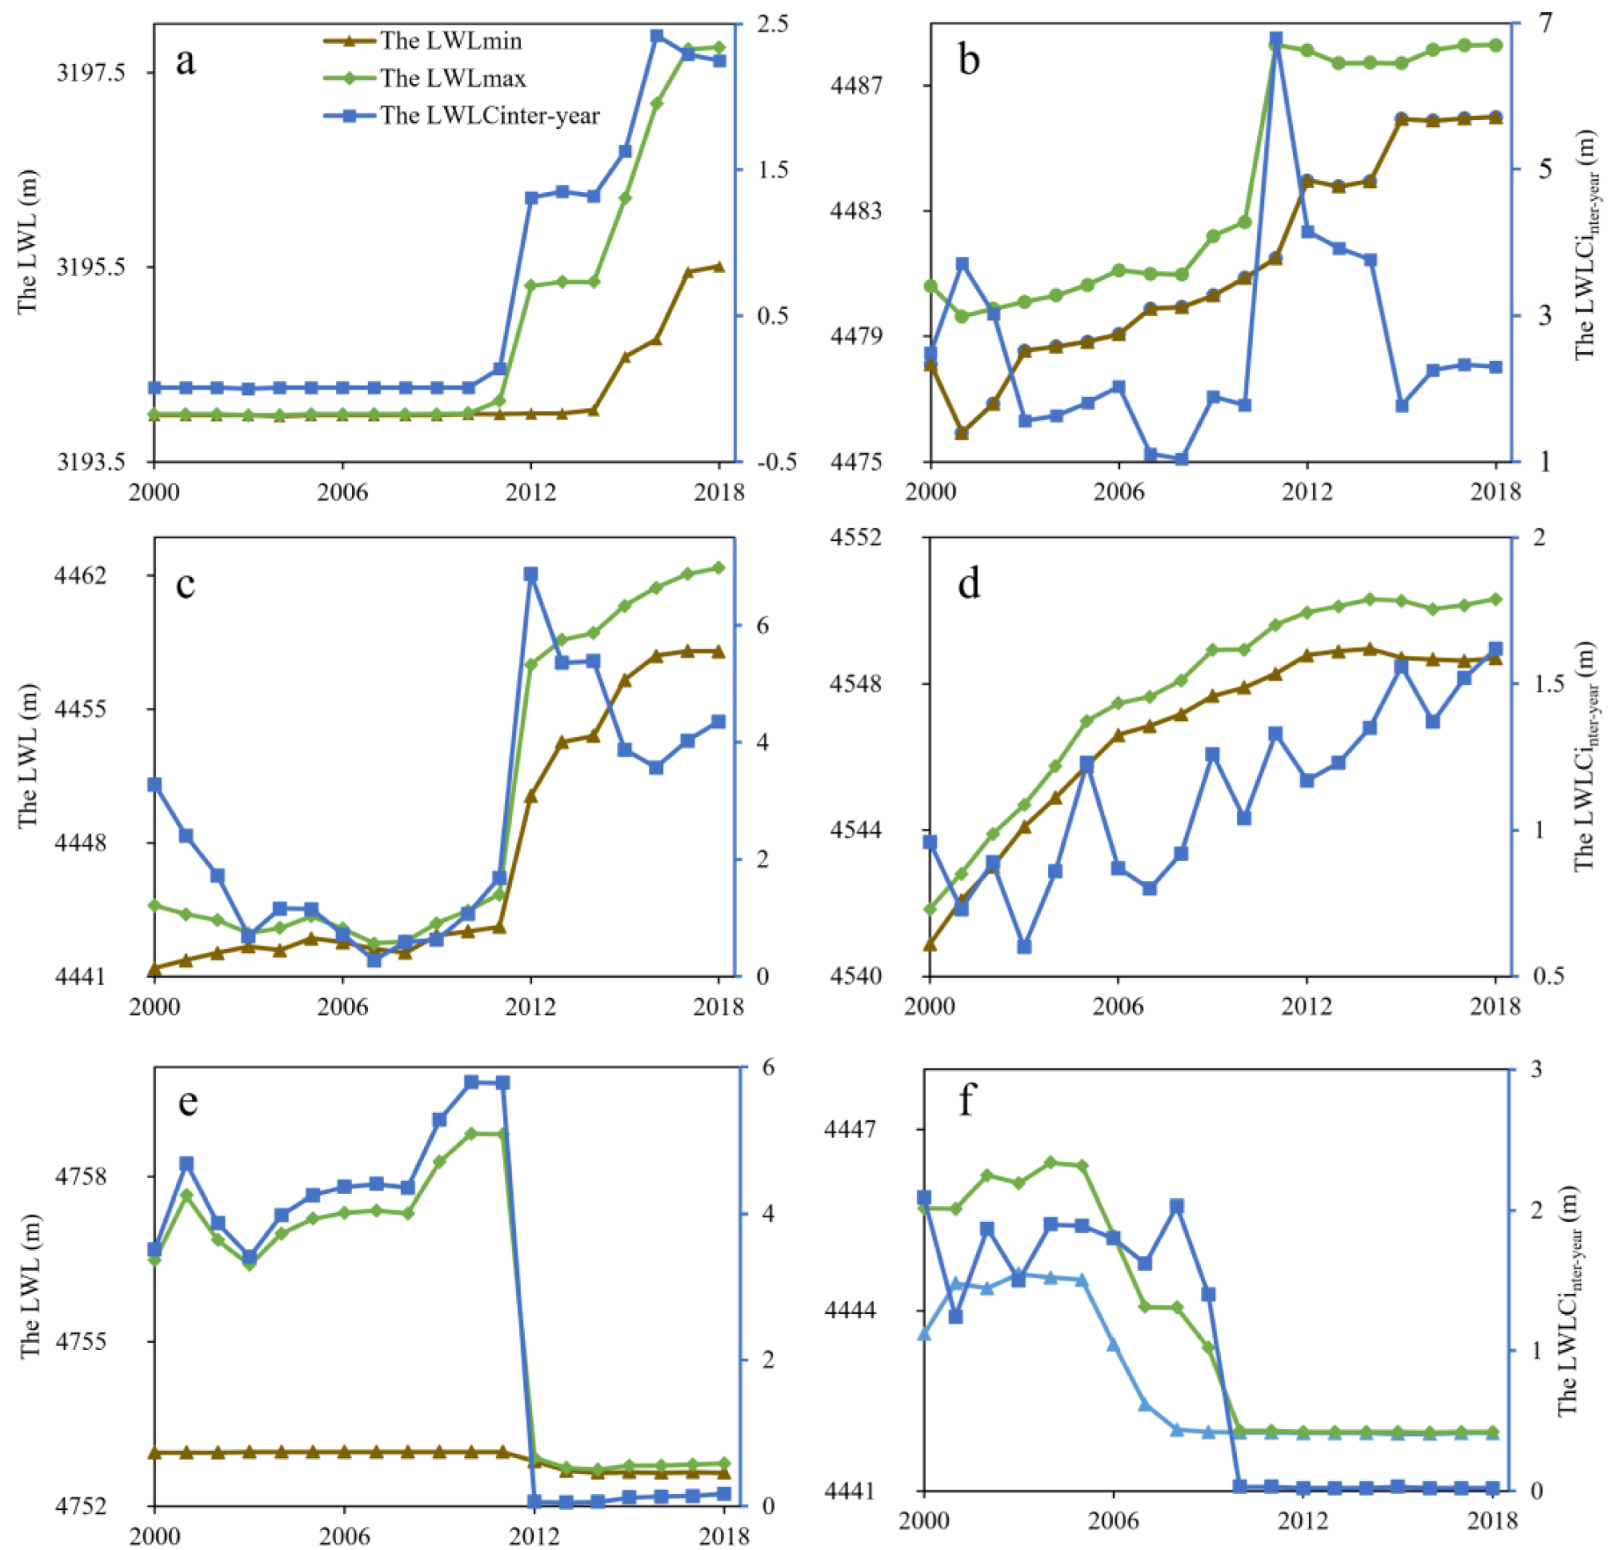
4.3. The LWLC of Typical Lakes on the TP

As shown in Figure 5, we selected the continuous LWLC of six typical lakes (four expanding and two shrinking lakes) in the study area for further analysis. The LWL of Qinghai Lake increased significantly faster. Over the past 19 years, the LWLmin in Qinghai Lake rose by 1.17 ± 0.29 m, the LWLmax rose by 3.87 ± 0.60 m, and the LWLCintra-year was 0.67 ± 0.90 m during this period (Figure 5a). Affected by the overflow of Zhuonai Lake in the upper reaches of Kusai Lake and Salt Lake, the water level of Kusai Lake rose rapidly in 2011. Since 2011, the LWL of Kusai Lake and Salt Lake has risen sharply, and then stabilized. The LWLmin of Kusai Lake increased by 10.79 ± 0.67 m, the LWLmax of Kusai Lake increased by 11.48 ± 1.24 m, and the LWLCintra-year was 2.60 ± 1.34 m (Figure 5b). Meanwhile, the LWLmin of Salt Lake rose by 19.85 ± 2.44 m and the LWLmax of Salt Lake increased by 23.66 ± 3.45 m. The LWLCintra-year was 1.12 ± 0.29 m during this period, which changed the most in 2011, with a value of 6.9 m (Figure 5c). The LWL of Selin Co has continued to rise, with the LWLCintra-year showing an upward trend. The LWLmin of Selin Co increased by 7.77 ± 0.85 m, its LWLmax increased by 8.64 ± 0.81 m, and the LWLCintra-year was 1.12 ± 0.69 m from 2000 to 2018 (Figure 5d). Zhuonai Lake broke out in 2011 and, consequently, the water level began to drop. The LWLmin of Zhuonai Lake decreased by 0.49 ± 0.03 m, its LWLmax decreased by 5.74 ± 1.40 m, and the LWLCintra-year was 2.86 ± 2.19 m during this period (Figure 5e). The LWL of the Yamdrok Lake presented an overall downward trend, its LWLmin decreased by 3.21 ± 0.51 m, its LWLmax decreased by 5.79 ± 0.65 m, and the LWLCintra-year was 0.92 ± 0.88 m during this period (Figure 5f).

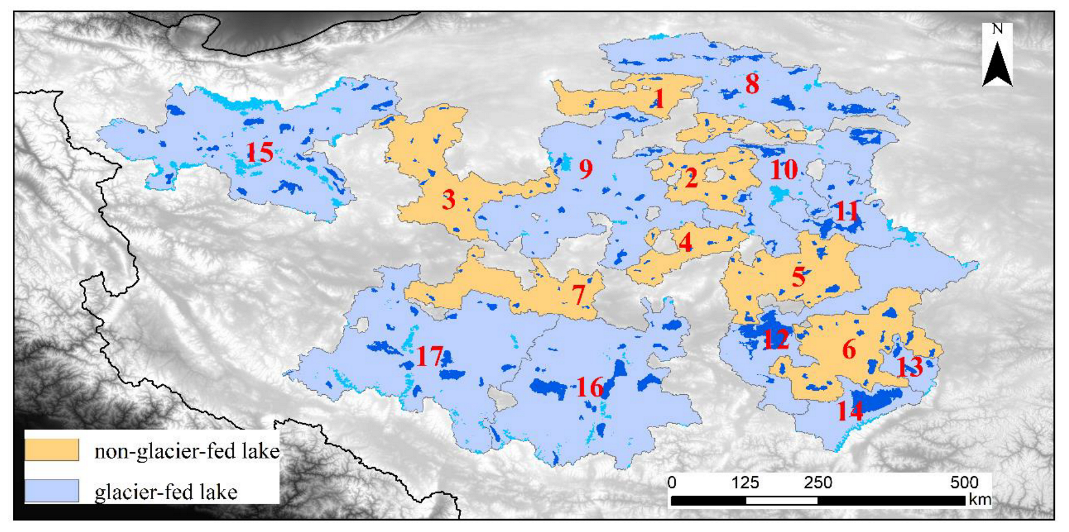
4.4. Spatial Difference Analysis of Lake Changes on the TP

To analyse the spatial changes of the lakes, the TP has previously been divided into multiple sub-regions, according to the size of lakes, trend of lake changes, and basin boundaries [32]. We referred to this watershed division method and divided the study area into six parts to analyse the spatial distribution of lakes on the TP. We divided those large lakes with large changes into sub-area A, including Nam Co., Selin Co., Zharinanmu Co., and Tangra Yumco, and the area in the northern part of the TP (where the LWSC was slightly smaller than that of area A) was divided into sub-area B. The lake area having LWSC with the smallest increase was designated as area C, located in the middle of the study area. The part where glaciers are widely distributed, the average annual temperature is low, the annual precipitation is less, and the lake area and water storage changes are greater than sub-area C was divided into sub-region D. The southern part of the study area, where lake changes showed a downward trend, was divided into area E. Finally, the eastern part of the TP was divided into area F. The six parts of the study area comprised four sub-regions (A, B, C, and D) in the inner TP, and two further sub-regions (E in the north-eastern part of the TP and F in the southern part of the TP); see Figure 6.
As shown in Table 1, there were 116 lakes in area A, 75 lakes in area B, 93 lakes in area C, 33 lakes in area D, 30 lakes in area E, and 33 lakes in area F. We found that the expansion rates of LAmin and LAmax were 262.01 ± 17.42 km²/yr and 294.15 ± 13.29 km²/yr from 2000 to 2018, with 380 lakes, and the average LACinter-year was 1491.83 ± 272.24 km². The area of lakes in the north-eastern area B and the south-eastern area A of the inner TP presented a faster rate of change; the LAmin and LAmax in area B increased by 105.33 ± 5.74 km²/yr and 121.24 ± 4.90 km²/yr, respectively, and the LAmin and LAmax in area A increased by 88.12 ± 9.84 km² and 92.29 ± 9.27 km²/yr, respectively. The lakes in area E (in the southern TP) shrank, and the LAmin and LAmax in area E decreased by 7.59 ± 1.05 km²/yr and 5.80 ± 1.15 km²/yr, respectively. The LACinter-year in area B (624.02 ± 131.04 km²) changed drastically, where the LACinter-year in area A was 410.08 ± 54.43 km² and the LACinter-year in area D changed slightly (i.e., 56.15 ± 20.47 km²) from 2000 to 2018.
The LWLmin and LWLmax increased by 0.17 ± 0.01 m/yr and 0.20 ± 0.01 m/yr, respectively, and the LWLCinter-year increased by 0.97 ± 0.23 m from 2000 to 2018. The LWL rose faster in area B and area D, where the LWLmin and LWLmax increased by 0.28 ± 0.01 m/yr and 0.31 ± 0.01 m/yr in area B, respectively, and the LWLmin and LWLmax increased by 0.24 ± 0.01 m/yr and 0.27 ± 0.01 m/yr in area D, respectively. The LWL in area E showed a downward trend, and the decrease rates of LWLmin and LWLmax in area E were 0.04 ± 0.01 m/yr and 0.06 ± 0.01 m/yr, respectively. The LWLCinter-year in area A (0.88 ± 0.14 m), area E (0.89 ± 0.21 m), and area F (0.77 ± 0.70 m) did not differ much, and the LWLCinter-year in area C (0.60 ± 0.27 m) and area D (0.59 ± 0.19 m) of the TP presented relatively small changes.
The increases in LWSCmin and LWSCmax were 6.32 ± 0.34 Gt/yr and 7.94 ± 0.23 Gt/yr, respectively, and the LWSCinter-year was 37.48 ± 12.11 Gt from 2000 to 2018. The increases in LWSC in area A and area B were faster from 2000 to 2018. The LWSCmin and LWSCmax in area A were 2.95 ± 031 Gt/yr and 3.34 ± 0.29 Gt/yr, respectively, while those in area B were 1.95 ± 0.08 Gt/yr and 2.40 ± 0.08 Gt/yr, respectively. Although the area of lakes in area B increased the fastest, compared with area A, the LWSC in area A increased at a faster rate than that in area B. The LWSC in area E decreased, where the LWSCmin and LWSCmax in area E were 0.11 ± 0.02 Gt/yr and 0.19 ± 0.03 Gt/yr, respectively. The LWSCinter-year in the middle of the TP, the southwestern area A of the inner TP, and the north-eastern area B of the inner TP presented relatively large changes. The LWSCinter-year was high in area A (14.70 ± 2.63 Gt) and area B (12.14 ± 3.20 Gt), while that in area D (1.64 ± 0.59 Gt) was the smallest.

4.5. Climate Change on the TP

We analysed the trends of the main meteorological factors for the TP, including the annual average evaporation, annual average surface temperature, and the annual average precipitation of the TP. The average annual evaporation of the TP decreased from 2001 (525.22 mm) to 2018 (511.05 mm), the overall average annual evaporation in the study area decreased by 17.62 ± 9.40 mm (0.52 ± 0.98 mm/yr), and the annual average evaporation was the highest in 2005 (561.22 mm) and the lowest in 2014 (490.40 mm; Figure 7a). The annual evaporation increased in area D and area F, with increase rates of annual evaporation of 1.70 ± 2.10 mm/yr and 3.10 ± 0.96 mm/yr, respectively. The annual evaporation in area A, area B, area C, and area E decreased continuously, with change rates of annual evaporation of −6.93 ± 3.03 mm/yr, −5.81 ± 3.02 mm/yr, −1.86 ± 3.53 mm/yr, and −2.06 ± 1.18 mm/yr, respectively (Figure 8a). From 2000 to 2018, the annual average surface temperature of the TP showed an overall upward trend, with an overall increase of 0.23 ± 0.57 °C (0.01 ± 0.03 °C/yr) in the study area. During 2000–2006 and 2009–2016, the average surface temperature of the TP increased continuously, and from 2006 to 2019, the average annual surface temperature of the TP changed dramatically. The average annual surface temperature of the TP was the highest in 2006 (−1.69 °C) and the lowest in 2009 (−4.13 °C; Figure 7b). From 2000 to 2018, the average annual surface temperature of the TP mostly showed an upward trend, and the temperature change trend for each sub-region was similar. The average surface temperature of area D rose at the fastest rate (0.05 ± 0.05 °C/yr). The annual average surface temperature of area F rose slowly (with 0.01 ± 0.03 °C/yr), while the average annual surface temperature increase rates of area C, area A, area B, and area E were 0.03 ± 0.06 °C/yr, 0.02 ± 0.06 °C/yr, 0.02 ± 0.04 °C/yr, and 0.01 ± 0.02 °C/yr, respectively (Figure 8b).
From 2000 to 2018, the average annual precipitation of the TP showed an upward trend. The average annual precipitation increased from 2000 (153.70 mm) to 2018 (167.44 mm) and, overall, the average annual precipitation increased by 10.32 ± 6.19 mm (0.54 ± 0.33 mm/yr). The average annual precipitation was the lowest in 2016 (132.50 mm) and the largest in 2018 (167.44 mm) on the TP (Figure 7c). There are obvious spatial differences in the annual precipitation change of the TP from 2000 to 2018. From 2000 to 2018, the annual average precipitation of area A, area C, area D, and area F showed an overall growth trend, with the increase rates of precipitation of 1.57 ± 0.72 mm/yr, 1.23 ± 0.35 mm/yr, 0.62 ± 0.33 mm/yr, and 1.25 ± 0.48 mm/yr, respectively. The annual average precipitation of region B and region E showed a downward trend, with annual precipitation decrease rates of 0.09 ± 0.37 mm/yr and 0.70 ± 0.76 mm/yr, respectively.

5. Discussion

5.1. Effects of Meteorological Factors on LWLC

From 2000 to 2018, most of the lakes on the TP experienced an expanding state, with increasing seasonal variation. The annual precipitation and average annual surface temperature increased, while the average annual evaporation decreased from 2001 to 2018. From 2000 to 2018, the average LWLmin increased by 0.16 ± 0.01 m/yr, the average LWLmax increased by 0.19 ± 0.01 m/yr, and the evaporation of the TP decreased by 0.52 ± 0.98 mm/yr. The contribution of decreased evaporation to the increase in LWLmin was 0.33%, and the contribution to the increase in LWLmax was 0.27%; therefore, it only had a small influence on the expansion of lakes. Previous studies had suggested that increasing precipitation was the primary cause of lake expansion on the TP, followed by increasing glacial meltwater and permafrost meltwater, and the variation of evaporation had little influence [29,30,31,32,33].
We analysed the relationship between the changes in lakes and meteorological factors in different regions, and found that the annual precipitation change rate in area A was the fastest (1.57 ± 0.72 mm). At the same time, the average annual average surface temperature increased by 0.03 ± 0.06 °C/yr. The increasing rate of LWLmin and LWLmax was 0.18 ± 0.02 m/yr and 0.20 ± 0.02 m/yr, respectively, while the evaporation decreased by 6.92 ± 3.03 mm/yr. From the above, it can be calculated that the contribution of the decreased evaporation in area A to the increase in LWLmin was 3.84%, and 3.46% to LWLmax.
The lakes in area B expanded the fastest among those areas, but the precipitation and annual average surface temperature decreased, and the annual evaporation also decreased with decreasing rate of 5.81 ± 3.02 mm/yr. The LWLmin and LWLmax in area B increased by 0.28 ± 0.01 m/yr and 0.31 ± 0.01 m/yr, respectively. The contribution of decreased evaporation to the increase in LWLmin was 2.1%, and its contribution to the increase in LWLmax was 1.9%. Therefore, the primary cause of lake expansion was perhaps the high precipitation, which could offset the loss of evaporation.
The lake expansion rate in area C was slower, the precipitation increased quickly, and the average surface temperature and evaporation decreased. The increasing rate of LWLmin and LWLmax was 0.15 ± 0.01 m/yr and 0.17 ± 0.01 m/yr, respectively, while the evaporation decreased by 1.86 ± 3.53 mm/yr. The contribution of decreased evaporation to the increase in LWLmin was 1.2%, and 1.1% to LWLmax. Therefore, the lake expansion could perhaps be mainly attributed to increasing precipitation.
The number of lakes in area D was small, and the average annual precipitation, average annual surface temperature, and annual evaporation were low. The lakes were also in an expanding state, as a whole. The precipitation and average surface temperature increased, but the evaporation also increased, which would hamper the lake expansion.
The annual precipitation, average annual surface temperature, and annual evaporation in the southern region of the TP (area E) were relatively high, and the lake changes showed an overall shrinking trend. The surface temperature increased, while the evaporation decreased. However, area E was the region with the largest decrease in precipitation, out of all of the sub-regions. The average annual decrease in evaporation was 2.06 ± 1.18 mm/yr, and the decreasing rate of LWLmin and LWLmax was 0.04 ± 0.01 m/yr and 0.06 ± 0.01 mm/yr, respectively, indicating that the decreased evaporation slowed down the shrinkage of the lakes to a certain extent. As such, it can be concluded that the shrinkage of lakes was perhaps mainly caused by the decreased precipitation in area E.
Most of the lakes in area F presented an expanding trend, and the precipitation and evaporation increased, while the average annual temperature decreased. The increasing rate of evaporation was 3.10 ± 0.96 mm/yr, and the increasing rate of LWLmin and LWLmax was 0.08 ± 0.01 m and 0.18 ± 0.02 m, respectively, indicating that the increased evaporation slowed down the expansion of lakes, to a certain extent. It can be concluded that precipitation was the main influencing factor leading to lake expansion in area F.

5.2. Effects of Glacieal Water Supply on LWSC

According to the distribution of glaciers, we analysed the difference between glacier-fed and non-glacier-fed lakes’ LWSC in the inner TP. The watershed of the inner TP was divided into glacier-fed and non-glacier-fed lakes areas based on the results of Qiao et al. (2019) [30]. There were 123 glacier-fed lakes and 81 non-glacier-fed lakes in the inner TP. The distribution of different types of lakes is shown in Figure 9.
As shown in Figure 10, glacier-fed lakes had a greater increase on the LWSC than that of non-glacier-fed lakes. The LWSCmin of glacier-fed lakes increased by 75.94 ± 3.02 Gt from 2000 to 2018, while the LWSCmin of non-glacier-fed lakes only increased by 12.84 ± 0.86 Gt; furthermore, the LWSCmax of glacier-fed lakes increased by 85.89 ± 2.77 Gt, while the LWSCmax of non-glacier-fed lakes only increased by 14.25 ± 0.86 Gt. The increasing LWSC of glacier-fed lakes was approximately six times that of non-glacier-fed lakes.
As shown in Table 2, the LWSC in the No. 12 watershed presented the largest change among those watersheds from 2000 to 2018, the increase of LWSCmin and LWSCmax were 16.85 ± 0.87 Gt and 18.92 ± 0.96 Gt, respectively. There are 28 lakes in the No. 15 basin, and the glacier area in this basin was the largest, with a glacier area of 2682.4 km²; as such, the LWSCmin and LWSCmax had increased by 11.81 ± 0.46 Gt and 12.46 ± 0.45 Gt from 2000 to 2018, respectively. In the No. 14 watershed, the LWSCmin and LWSCmax were 4.51 ± 0.52 Gt and 5.58 ± 0.57 Gt, respectively. However, the LWSC was small overall for non-glacier-fed lakes. Among them, in the No. 2 watershed with 13 lakes, the LWSCmin and LWSCmax were 0.79 ± 0.09 Gt and 0.99 ± 0.10 Gt from 2000 to 2018, respectively. The LWSCmin and LWSCmax were 0.97 ± 0.05 Gt and 0.92 ± 0.05 Gt, respectively, in the No. 7 watershed from 2000 to 2018. There were 16 lakes in No. 6 watershed, the largest watershed area, which had the largest change in LWSC of the areas, where the LWSCmin and LWSCmax were 4.76 ± 0.5 Gt and 5.28 ± 0.57 Gt, respectively. These results suggested that glacier-fed lakes had a much larger increase than that of non-glacier-fed lakes.
As shown in Figure 11, we calculated the LWSC per unit area for each basin from 2000 to 2018. The results showed that the LWSC per unit area of glacier-fed lakes was greater (~four times) than that of non-glacier-fed lakes. As shown in Figure 11, for glacier-fed lakes, the LWSC per unit area in basins No. 12, No. 11, and No. 14 was relatively large. The LWSCmin and LWSCmax per unit area for the No. 12 watershed were 34.26 ± 1.74 mm/yr and 30.52 ± 1.58 mm/yr, respectively. For the No. 11 watershed, the LWSCmin and LWSCmax per unit area were 27.74 ± 1.51 mm/yr and 21.00 ± 0.91 mm/yr, respectively. The LWSCmin and LWSCmax per unit area in the No. 14 watershed were 27.39 ± 2.78 mm/yr and 22.13 ± 2.54 mm/yr, respectively. However, for non-glacier-fed lakes, the LWSC per unit area in basins No. 3 and No. 7 were small, with the LWSCmin and LWSCmax per unit area in basin No. 3 being 4.12 ± 0.35 mm/yr and 3.63 ± 0.29 mm/yr, respectively, while the LWSCmin and LWSCmax per unit area in the No. 7 watershed were 3.04 ± 0.17 mm/yr and 3.23 ± 0.16 mm/yr, respectively. These results indicated that the LWSC with glacier supply was greater than that of non-glacier-fed areas.
Even though the increasing LWSC of glacier-fed lakes was approximately six times that of non-glacier-fed lakes, and the LWSC per unit area of glacier-fed lakes was approximately four times that of non-glacier-fed lakes, the glacier-fed lake basins had much larger lake sizes and many more lakes than those of non-glacier-fed lake basins, which perhaps were much more sensitive to climate change than non-glacier-fed lakes. Chen et al. (2022) suggested that glacial meltwater contributed 9% ± 1% to lake expansion of TP’s endorheic basin during 1995–2020 by quantifying the glacier mass balance [44], and Zhang et al. (2017) suggested that glacial meltwater contributed 13% to lake expansion of TP’s endorheic basin during 2003–2009 [45]. Generally, the average precipitation of those glacier-fed lake basins was much higher than that of non-glacier-fed lake basins [31]. Therefore, we also think that increasing precipitation was considered as the primary cause of lake expansion, and glacial supply was also an important factor affecting LWSC, and the variation of evaporation only had a little influence on lake expansion.

6. Conclusions

Lakes have an important impact on climate change and water cycle in the Tibetan Plateau region. Previous studies have focused on the inter-annual change of lake water level and water storage, but there is a lack of analysis regarding the intra-annual change of these factors over a long-term scale and considering a large number of lakes. Therefore, in this research, we analysed the temporal and spatial variation of 410 lakes (larger than 10 km2), regarding their intra-annual change, on the TP from 2000 to 2018. This further allowed us to analyse the driving mechanism of lake changes on the TP.
Most of the lakes were distributed in the central and northern regions of the TP, and we observed an overall expansion trend from 2000 to 2018. Notably, the average LWLmin increased by 3.09 ± 0.18 m (0.16 ± 0.01 m/yr), the average of LWLmax increased by 3.69 ± 0.12 m (0.19 ± 0.01 m/yr), and the average annual change in LWL was 0.98 ± 0.23 m from 2000 to 2018. The total LWSCmin increased by 125.34 ± 6.79 Gt (6.60 ± 0.36 Gt/yr), the total LWSCmax increased by 158.07 ± 4.52 Gt (8.32 ± 0.24 Gt/yr), and the average of LWSCintra-year was 40.19 ± 10.67 Gt. The lakes expended the fastest in the southern and northern parts of the TP, while lake water storage in the central part of the TP increased a little. The lakes in the southern part of the TP showed a shrinking trend, with decreasing LWSC.
We analysed the changes in precipitation, temperature, and evaporation for each sub-region of the TP, and we found that the increases in precipitation and surface temperature, along with the decrease in evaporation, have a positive impact on the expansion of lakes on the TP, where precipitation perhaps was the dominant factor affecting lake expansion. We also analysed the LWSC of glacier-fed and non-glacier-fed lakes in the inner TP and found that glacier-fed lakes present more significant changes in LWSC than non-glacier-fed lakes, indicating that glacier meltwater had an important impact on lake change. The variation of evaporation only had a little influence on lake change.

Author Contributions

Conceptualization, B.N. and H.G.; methodology, B.N., B.Q. and Y.Y.; software, B.N., H.Y. and W.D.; validation, B.Q., W.D. and X.W.; writing—original draft preparation, H.G. and B.N.; writing—review and editing, B.Q. and B.N.; funding acquisition, H.G. and X.W. All authors have read and agreed to the published version of the manuscript.

Funding

This work is supported by the Second Tibetan Plateau Scientific Expedition and Research (STEP) (2019QZKK0202), 2020 Science and technology project of innovation ecosystem construction, National Supercomputing Zhengzhou Center Research on Key Technologies of intelligent fine prediction based on big data analysis (201400210100), NSFC project (41901078), key scientific and technological project of Henan Province (212102210137).

Data Availability Statement

The data presented in this study are available on request from the corresponding author.

Conflicts of Interest

The authors declare no conflict of interest.

References

  1. Yao, T.; Thompson, L.; Yang, W.; Yu, W.; Gao, Y.; Guo, X.; Yang, X.; Duan, K.; Zhao, H.; Xu, B. Different glacier status with atmospheric circulations in Tibetan Plateau and surroundings. Nat. Clim. Chang. 2012, 2, 663–667. [Google Scholar] [CrossRef]
  2. Deng, H.; Pepin, N.; Chen, Y. Changes of snowfall under warming in the Tibetan Plateau. J. Geophys. Res. Atmos. 2017, 122, 7323–7341. [Google Scholar] [CrossRef]
  3. Pepin, N.; Lundquist, J. Temperature trends at high elevations: Patterns across the globe. Geophys. Res. Lett. 2008, 35, L14701. [Google Scholar] [CrossRef]
  4. Guo, D.; Wang, H. The significant climate warming in the northern Tibetan Plateau and its possible causes. Int. J. Climatol. 2011, 32, 1775–1781. [Google Scholar] [CrossRef]
  5. Zhang, G.; Yao, T.; Xie, H.; Wang, W.; Yang, W. An inventory of glacial lakes in the Third Pole region and their changes in response to global warming. Glob. Planet. Chang. 2015, 131, 148–157. [Google Scholar] [CrossRef]
  6. Yang, K.; Wu, H.; Qin, J.; Lin, C.; Tang, W.; Chen, Y. Recent climate changes over the Tibetan Plateau and their impacts on energy and water cycle: A review. Glob. Planet. Chang. 2014, 112, 79–91. [Google Scholar] [CrossRef]
  7. Han, C.; Ma, Y.; Wang, B.; Zhong, L.; Ma, W.; Chen, X.; Su, Z. Long-term variations in actual evaporation over the Tibetan Plateau. Earth Syst. Sci. Data 2021, 13, 3513–3524. [Google Scholar] [CrossRef]
  8. Williamson, C.E.; Saros, J.E.; Vincent, W.F.; Smol, J.P. Lakes and reservoirs as sentinels, integrators, and regulators of climate change. Limnol. Oceanogr. 2009, 54, 2273–2282. [Google Scholar] [CrossRef]
  9. Liu, J.; Wang, S.; Yu, S.; Yang, D.; Zhang, L. Climate warming and growth of high-elevation inland lakes on the Tibetan Plateau. Glob. Planet. Chang. 2009, 67, 209–217. [Google Scholar] [CrossRef]
  10. Luo, S.; Song, C.; Zhan, P.; Liu, K.; Chen, T.; Li, W.; Ke, L. Refined estimation of lake water level and storage changes on the Tibetan Plateau from ICESat/ICESat-2. Catena 2021, 200, 105177. [Google Scholar] [CrossRef]
  11. Wan, W.; Long, D.; Hong, Y.; Ma, Y.; Yuan, Y.; Xiao, P.; Duan, H.; Han, Z.; Gu, X. A lake data set for the Tibetan Plateau from the 1960s, 2005, and 2014. Sci. Data 2016, 3, 160039. [Google Scholar] [CrossRef]
  12. Marzeion, B.; Cogley, J.G.; Richter, K.; Parkes, D. Attribution of global glacier mass loss to anthropogenic and natural causes. Science 2014, 345, 919–921. [Google Scholar] [CrossRef]
  13. Niu, Z.; Zhang, H.; Gong, P. More protection for China’s wetlands. Nature 2011, 471, 305. [Google Scholar] [CrossRef]
  14. Yamazaki, D.; Trigg, M.A.; Ikeshima, D. Development of a global~ 90 m water body map using multi-temporal Landsat images. Remote Sens. Environ. 2015, 171, 337–351. [Google Scholar] [CrossRef]
  15. Qiu, J. China: The third pole. Nat. News 2008, 454, 393–396. [Google Scholar] [CrossRef]
  16. Zhang, G.; Yao, T.; Xie, H.; Zhang, K.; Zhu, F. Lakes’ state and abundance across the Tibetan Plateau. Chin. Sci. Bull. 2014, 59, 3010–3021. [Google Scholar] [CrossRef]
  17. Birkett, C. The contribution of TOPEX/POSEIDON to the global monitoring of climatically sensitive lakes. J. Geophys. Res. Ocean. 1995, 100, 25179–25204. [Google Scholar] [CrossRef]
  18. Morris, C.S.; Gill, S.K. Evaluation of the TOPEX/POSEIDON altimeter system over the Great Lakes. J. Geophys. Res. Ocean. 1994, 99, 24527–24539. [Google Scholar] [CrossRef]
  19. Crétaux, J.-F.; Jelinski, W.; Calmant, S.; Kouraev, A.; Vuglinski, V.; Bergé-Nguyen, M.; Gennero, M.-C.; Nino, F.; Del Rio, R.A.; Cazenave, A. SOLS: A lake database to monitor in the Near Real Time water level and storage variations from remote sensing data. Adv. Space Res. 2011, 47, 1497–1507. [Google Scholar] [CrossRef]
  20. Chen, T.; Song, C.; Ke, L.; Wang, J.; Liu, K.; Wu, Q. Estimating seasonal water budgets in global lakes by using multi-source remote sensing measurements. J. Hydrol. 2021, 593, 125781. [Google Scholar] [CrossRef]
  21. Jiang, L.; Nielsen, K.; Andersen, O.B.; Bauer-Gottwein, P. Monitoring recent lake level variations on the Tibetan Plateau using CryoSat-2 SARIn mode data. J. Hydrol. 2017, 544, 109–124. [Google Scholar] [CrossRef]
  22. Jiang, L.; Nielsen, K.; Andersen, O.B.; Bauer-Gottwein, P. A Bigger Picture of how the Tibetan Lakes Have Changed Over the Past Decade Revealed by CryoSat-2 Altimetry. J. Geophys. Res. Atmos. 2020, 125, e2020JD033161. [Google Scholar] [CrossRef]
  23. Song, C.; Huang, B.; Ke, L. Modeling and analysis of lake water storage changes on the Tibetan Plateau using multi-mission satellite data. Remote Sens. Environ. 2013, 135, 25–35. [Google Scholar] [CrossRef]
  24. Zhang, G.; Xie, H.; Kang, S.; Yi, D.; Ackley, S.F. Monitoring lake level changes on the Tibetan Plateau using ICESat altimetry data (2003–2009). Remote Sens. Environ. 2011, 115, 1733–1742. [Google Scholar] [CrossRef]
  25. Yuan, C.; Gong, P.; Bai, Y. Performance assessment of ICESat-2 laser altimeter data for water-level measurement over lakes and reservoirs in China. Remote Sens. 2020, 12, 770. [Google Scholar] [CrossRef]
  26. Xu, N.; Zheng, H.; Ma, Y.; Yang, J.; Liu, X.; Wang, X. Global Estimation and Assessment of Monthly Lake/Reservoir Water Level Changes Using ICESat-2 ATL13 Products. Remote Sens. 2021, 13, 2744. [Google Scholar] [CrossRef]
  27. Jacob, T.; Wahr, J.; Pfeffer, W.T.; Swenson, S. Recent contributions of glaciers and ice caps to sea level rise. Nature 2012, 482, 514–518. [Google Scholar] [CrossRef]
  28. Zhang, G.; Chen, W.; Xie, H. Tibetan Plateau’s lake level and volume changes from NASA’s ICESat/ICESat-2 and Landsat Missions. Geophys. Res. Lett. 2019, 46, 13107–13118. [Google Scholar] [CrossRef]
  29. Yang, R.; Zhu, L.; Wang, J.; Ju, J.; Ma, Q.; Turner, F.; Guo, Y. Spatiotemporal variations in volume of closed lakes on the Tibetan Plateau and their climatic responses from 1976 to 2013. Clim. Chang. 2017, 140, 621–633. [Google Scholar] [CrossRef]
  30. Yao, F.F.; Wang, J.D.; Yang, K.; Wang, C.; Walter, B.; Crétaux, J. Lake storage variation on the endorheic Tibetan Plateau and its attribution to climate change since the new millennium. Environ. Res. Lett. 2018, 13, 064011. [Google Scholar] [CrossRef]
  31. Qiao, B.; Zhu, L. Difference and cause analysis of water storage changes for glacier-fed and non-glacier-fed lakes on the Tibetan Plateau. Sci. Total Environ. 2019, 693, 133399. [Google Scholar] [CrossRef]
  32. Qiao, B.; Zhu, L.; Yang, R. Temporal-spatial differences in lake water storage changes and their links to climate change throughout the Tibetan Plateau. Remote Sens. Environ. 2019, 222, 232–243. [Google Scholar] [CrossRef]
  33. Zhang, G.Q.; Bolch, T.; Chen, W.F.; Crétaux, J.-F. Comprehensive estimation of lake volume changes on the Tibetan Plateau during 1976−2019 and basin-wide glacier contribution. Sci. Total Environ. 2021, 773, 145463. [Google Scholar] [CrossRef]
  34. Pekel, J.-F.; Cottam, A.; Gorelick, N.; Belward, A.S. High-resolution mapping of global surface water and its long-term changes. Nature 2016, 540, 418–422. [Google Scholar] [CrossRef]
  35. Yang, P.; Zhan, C.; Xia, J.; Han, J.; Hu, S. Analysis of the spatiotemporal changes in terrestrial water storage anomaly and impacting factors over the typical mountains in China. Int. J. Remote Sens. 2018, 39, 505–524. [Google Scholar] [CrossRef]
  36. Yu, S.; Lu, F.; Zhou, Y.; Wang, X.; Wang, L.; Song, X.; Zhang, M. Evaluation of Three High-Resolution Remote Sensing Precipitation Products on the Tibetan Plateau. Water 2022, 14, 2169. [Google Scholar] [CrossRef]
  37. The NCEP Climate Forecast System Version 2. J. Clim. 2012, 27, 2185–2208.
  38. Che, J.; Zhao, P. The NCEP and ERA-Interim reanalysis temperature and humidity errors and their relationships with atmospheric boundary layer in the Tibetan Plateau. Front. Earth Sci. 2023, 10, 1083006. [Google Scholar] [CrossRef]
  39. Junfeng, W.; Shiyin, L.; Wanqin, G.; Xiaojun, Y.; Junli, X.; Weijia, B.; Zongli, J. Surface-area changes of glaciers in the Tibetan Plateau interior area since the 1970s using recent Landsat images and historical maps. Ann. Glaciol. 2014, 55, 213–222. [Google Scholar] [CrossRef]
  40. Guo, W.; Liu, S.; Xu, J.; Wu, L.; Shangguan, D.; Yao, X.; Wei, J.; Bao, W.; Yu, P.; Liu, Q. The second Chinese glacier inventory: Data, methods and results. J. Glaciol. 2015, 61, 357–372. [Google Scholar] [CrossRef]
  41. Farr, T. The shuttle radar topography mission: Reviews of Geophys. Rev. Geophys. 2007, 45, 1–13. [Google Scholar] [CrossRef] [Green Version]
  42. Liu, K.; Song, C.; Ke, L.; Jiang, L.; Pan, Y.; Ma, R. Global open-access DEM performances in Earth’s most rugged region High Mountain Asia: A multi-level assessment. Geomorphology 2019, 338, 16–26. [Google Scholar] [CrossRef]
  43. Taube, C. Three Methods for Computing the Volume of a Lake. In Manual of Fisheries Survey Methods II: With Periodic Updates; Schneider, J.C., Ed.; Michigan Department of Natural Resources, Fisheries Division: Lansing, MI, USA, 2000. [Google Scholar]
  44. Chen, W.F.; Liu, Y.; Zhang, G.Q.; Yang, K.; Zhou, T.; Wang, J.D.; Shum, C.K. What Controls Lake Contraction and Then Expansion in Tibetan Plateau’s Endorheic Basin Over the Past Half Century? Geophys. Res. Lett. 2022, 49, e2022GL101200. [Google Scholar] [CrossRef]
  45. Zhang, G.Q.; Yao, T.D.; Shum, C.K.; Yi, S.; Yang, K.; Xie, H.J.; Feng, W.; Bolch, T.; Wang, L.; Behrangi, A.; et al. Lake volume and groundwater storage variations in tibetan plateau’s endorheic basin. Geophys. Res. Lett. 2017, 44, 5550–5560. [Google Scholar] [CrossRef]
Figure 1. The distribution of water bodies on the TP. (a) is the seasonal water in 2000; (b) is the seasonal water in 2018; (c) is the minimum lake extent in 2000; (d) is the minimum lake extent in 2018; (e) is the maximum lake extent in 2000; (f) is the maximum lake extent in 2018.
Remotesensing 15 00893 g001
Figure 2. Accuracy verification of lake water level changes on the TP: (a) the LAmin in 2000 from GSW compared with LA from SRTM DEM; (b) the LAmax in 2000 from GSW compared with LA from SRTM DEM; (c) the LWLmin compared with LWL from the ICESat/ICESat-2; (d) the LWLmax compared with LWL from the ICESat/ICESat-2.
Remotesensing 15 00893 g002
Figure 3. Lake changes on the TP from 2000 to 2018: (a) lake area changes; (b) the average of LWLC; (c) the LWSC.
Remotesensing 15 00893 g003
Figure 4. Variation and distribution of lakes on the TP from 2000 to 2018, A–F represent different sub-regions of this study. (a) the change of LAmin; (b) the change of LAmax; (c) the average annual change in lake area; (d) the average of LWLCmin; (e) the average of LWLCmax; (f) the average annual change in LWL; (g) the LWSCmin; (h) the LWSCmax; (i) average of LWSCintra-year.
Remotesensing 15 00893 g004
Figure 5. (a) the LWLC of Qinghai Lake; (b) the LWLC of Kusai Lake; (c) the LWLC of Salt Lake; (d) the LWLC of Selinco; (e) the LWLC of Zhuonai Lake; (f) the LWLC of Yamdrok Lake.
Remotesensing 15 00893 g005
Figure 6. Watershed division and spatial distribution of lakes on the TP, and regions of A–F represent different sub-regions of this study based on changing characteristic of lakes.
Remotesensing 15 00893 g006
Figure 7. Climate change trends of various elements on the TP. (a) Evaporation; (b) Temperature; (c) Precipitation.
Remotesensing 15 00893 g007
Figure 8. Climate change trends of various elements in different areas of the TP. (a) Evaporation; (b) Temperature; (c) Precipitation.
Remotesensing 15 00893 g008
Figure 9. Distribution of lakes and regions on the TP. Regions of 1–7 represent non-glacier-fed lakes basins, regions of 8–17 represent glacier-fed lakes basins.
Remotesensing 15 00893 g009
Figure 10. The LWSC of non-glacier-fed lakes and glacier-fed lakes during 2000–2018. (a) The changing trend of LWSCmin; (b) The changing trend of LWSCmax.
Remotesensing 15 00893 g010
Figure 11. The LWSC per unit area in different regions from 2000 to 2018, regions of 1–7 represent non-glacier-fed lakes basins, regions of 8–17 represent glacier-fed lakes basins. (a) The LWSC per unit area of LWSCmin; (b) The LWSC per unit area of LWSCmax.
Remotesensing 15 00893 g011
Table 1. Changes in LA, LWLC, and LWSC in different Areas of the TP from 2000 to 2018.
Area AArea BArea CArea DArea EArea FTotal
Number of lakes1167593333033380
LACmin (km2/yr)88.12 ± 9.84105.33 ± 5.7430.08 ± 3.0825.78 ± 0.96−7.59 ± 1.0520.28 ± 1.18262.01 ± 17.42
LACmax (km2/yr)92.29 ± 9.27121.24 ± 4.9035.48 ± 2.8427.71 ± 0.63−5.80 ± 1.1523.23 ± 1.41294.15 ± 13.29
Average of LACinter-year (km2)410.08 ± 54.43624.02 ± 131.54149.91 ± 67.6056.16 ± 20.47104.15 ± 22.97147.52 ± 35.291491.83 ± 272.24
LWLCmin (m/yr)0.18 ± 0.020.28 ± 0.010.15 ± 0.010.24 ± 0.01−0.04 ± 0.010.08 ± 0.010.17 ± 0.01
LWLCmax (m/yr)0.20 ± 0.020.31 ± 0.010.17 ± 0.010.27 ± 0.01−0.06 ± 0.010.18 ± 0.020.20 ± 0.01
Average of LWLCinter-year (m)0.88 ± 0.141.68 ± 0.350.60 ± 0.270.59 ± 0.190.89 ± 0.210.77 ± 0.700.97 ± 0.23
LWSCmin (Gt/yr)2.95 ± 0.311.95 ± 0.080.43 ± 0.030.67 ± 0.02−0.11 ± 0.020.44 ± 0.066.32 ± 0.34
LWSCmax (Gt/yr)3.34 ± 0.292.40 ± 0.080.53 ± 0.030.75 ± 0.02−0.19 ± 0.031.11 ± 0.147.94 ± 0.23
Average of LWSCinter-year (Gt)14.70 ± 2.6312.14 ± 3.201.74 ± 0.881.64 ± 0.592.74 ± 0.674.52 ± 4.1637.48 ± 12.11
Table 2. The LWSC of glacier-fed lakes and non-glacier-fed lakes in the inner TP from 2000 to 2018.
No.TypeBasin Area (km²)Lake NumberGlacier Area (km²)The LWSCmin (Gt)The LWSCmax (Gt)
1Non-glacier-fed12,839.79/1.02 ± 0.081.30 ± 0.18
2Non-glacier-fed10569.713/0.79 ± 0.090.99 ± 0.10
3Non-glacier-fed21,964.715/1.51 ± 0.121.72 ± 0.15
4Non-glacier-fed8046.47/0.63 ± 0.030.69 ± 0.03
5Non-glacier-fed17,773.815/3.16 ± 0.203.39 ± 0.28
6Non-glacier-fed23,980.316/4.76 ± 0.515.28 ± 0.57
7Non-glacier-fed15,837.89/0.97 ± 0.050.92 ± 0.05
8Glacier-fed32,329.214330.710.22 ± 0.5510.58 ± 0.57
9Glacier-fed43,197.119366.23.90 ± 0.194.94 ± 0.33
10Glacier-fed23,898.38379.77.32 ± 0.368.01 ± 0.30
11Glacier-fed13,5157336.95.39 ± 0.237.12 ± 0.39
12Glacier-fed29,057516916.85 ± 0.8718.92 ± 0.96
13Glacier-fed4482.6422.61.26 ± 0.351.32 ± 0.14
14Glacier-fed10,730.511804.51 ± 0.525.58 ± 0.57
15Glacier-fed52,534.5282682.411.81 ± 0.4612.46 ± 0.45
16Glacier-fed54,781.917259.311.62 ± 0.7412.86 ± 0.76
17Glacier-fed56,152.517639.23.06 ± 0.364.04 ± 0.50
Disclaimer/Publisher’s Note: The statements, opinions and data contained in all publications are solely those of the individual author(s) and contributor(s) and not of MDPI and/or the editor(s). MDPI and/or the editor(s) disclaim responsibility for any injury to people or property resulting from any ideas, methods, instructions or products referred to in the content.

