
Evolution of Small and Micro Wetlands and Their Driving Factors in the Yangtze River Delta—A Case Study of Wuxi Area

Abstract
:1. Introduction
2. Materials and Methods
2.1. Study Area
2.2. Data Sources
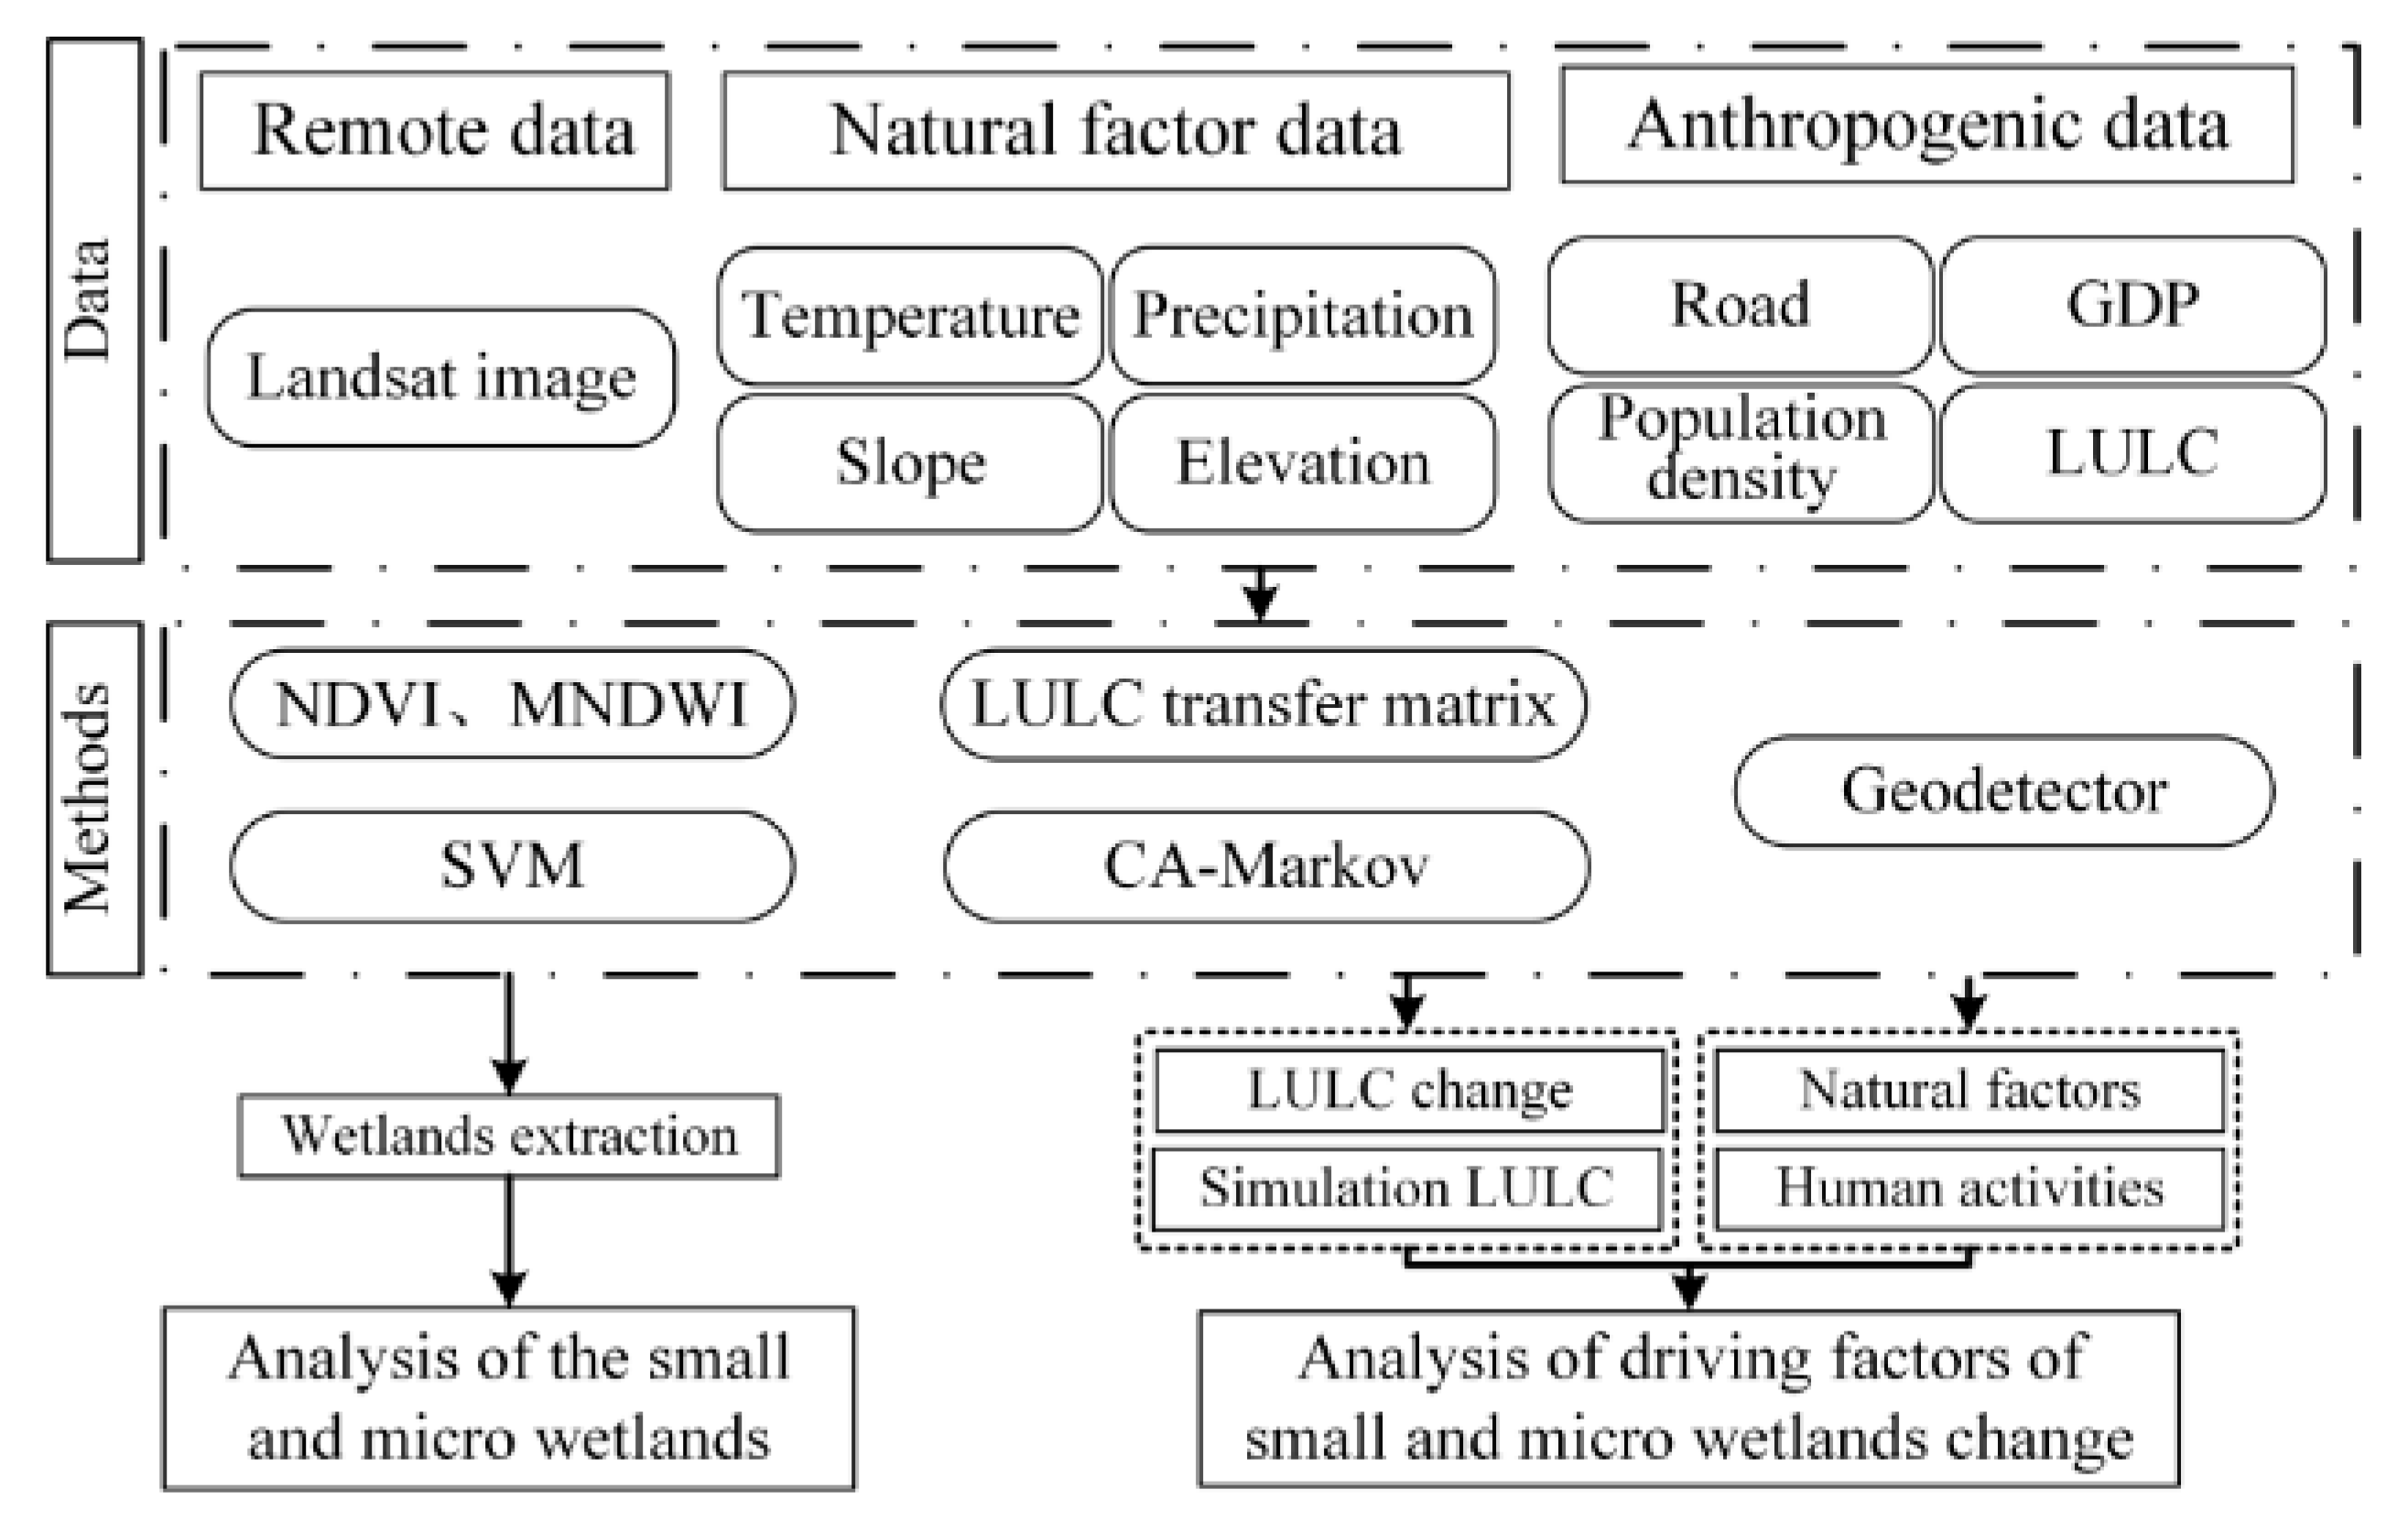
2.3. Methodology
2.3.1. Wetland Dynamic Analysis
2.3.2. Analysis of Driving Factors behind Wetland Changes
- Factors selection
- 2.
- Geodetector Model
- (1)
- Factor detector
- (2)
- Interaction detector
3. Results
3.1. Dynamic Changes in Natural Wetlands and Small-Micro Wetlands of Wuxi Area
3.2. Relationship between Wetlands and Land Use in Wuxi Area
3.3. Analysis of Driving Factors behind Natural Small and Micro Wetland Changes
4. Discussion
5. Conclusions
- (1)
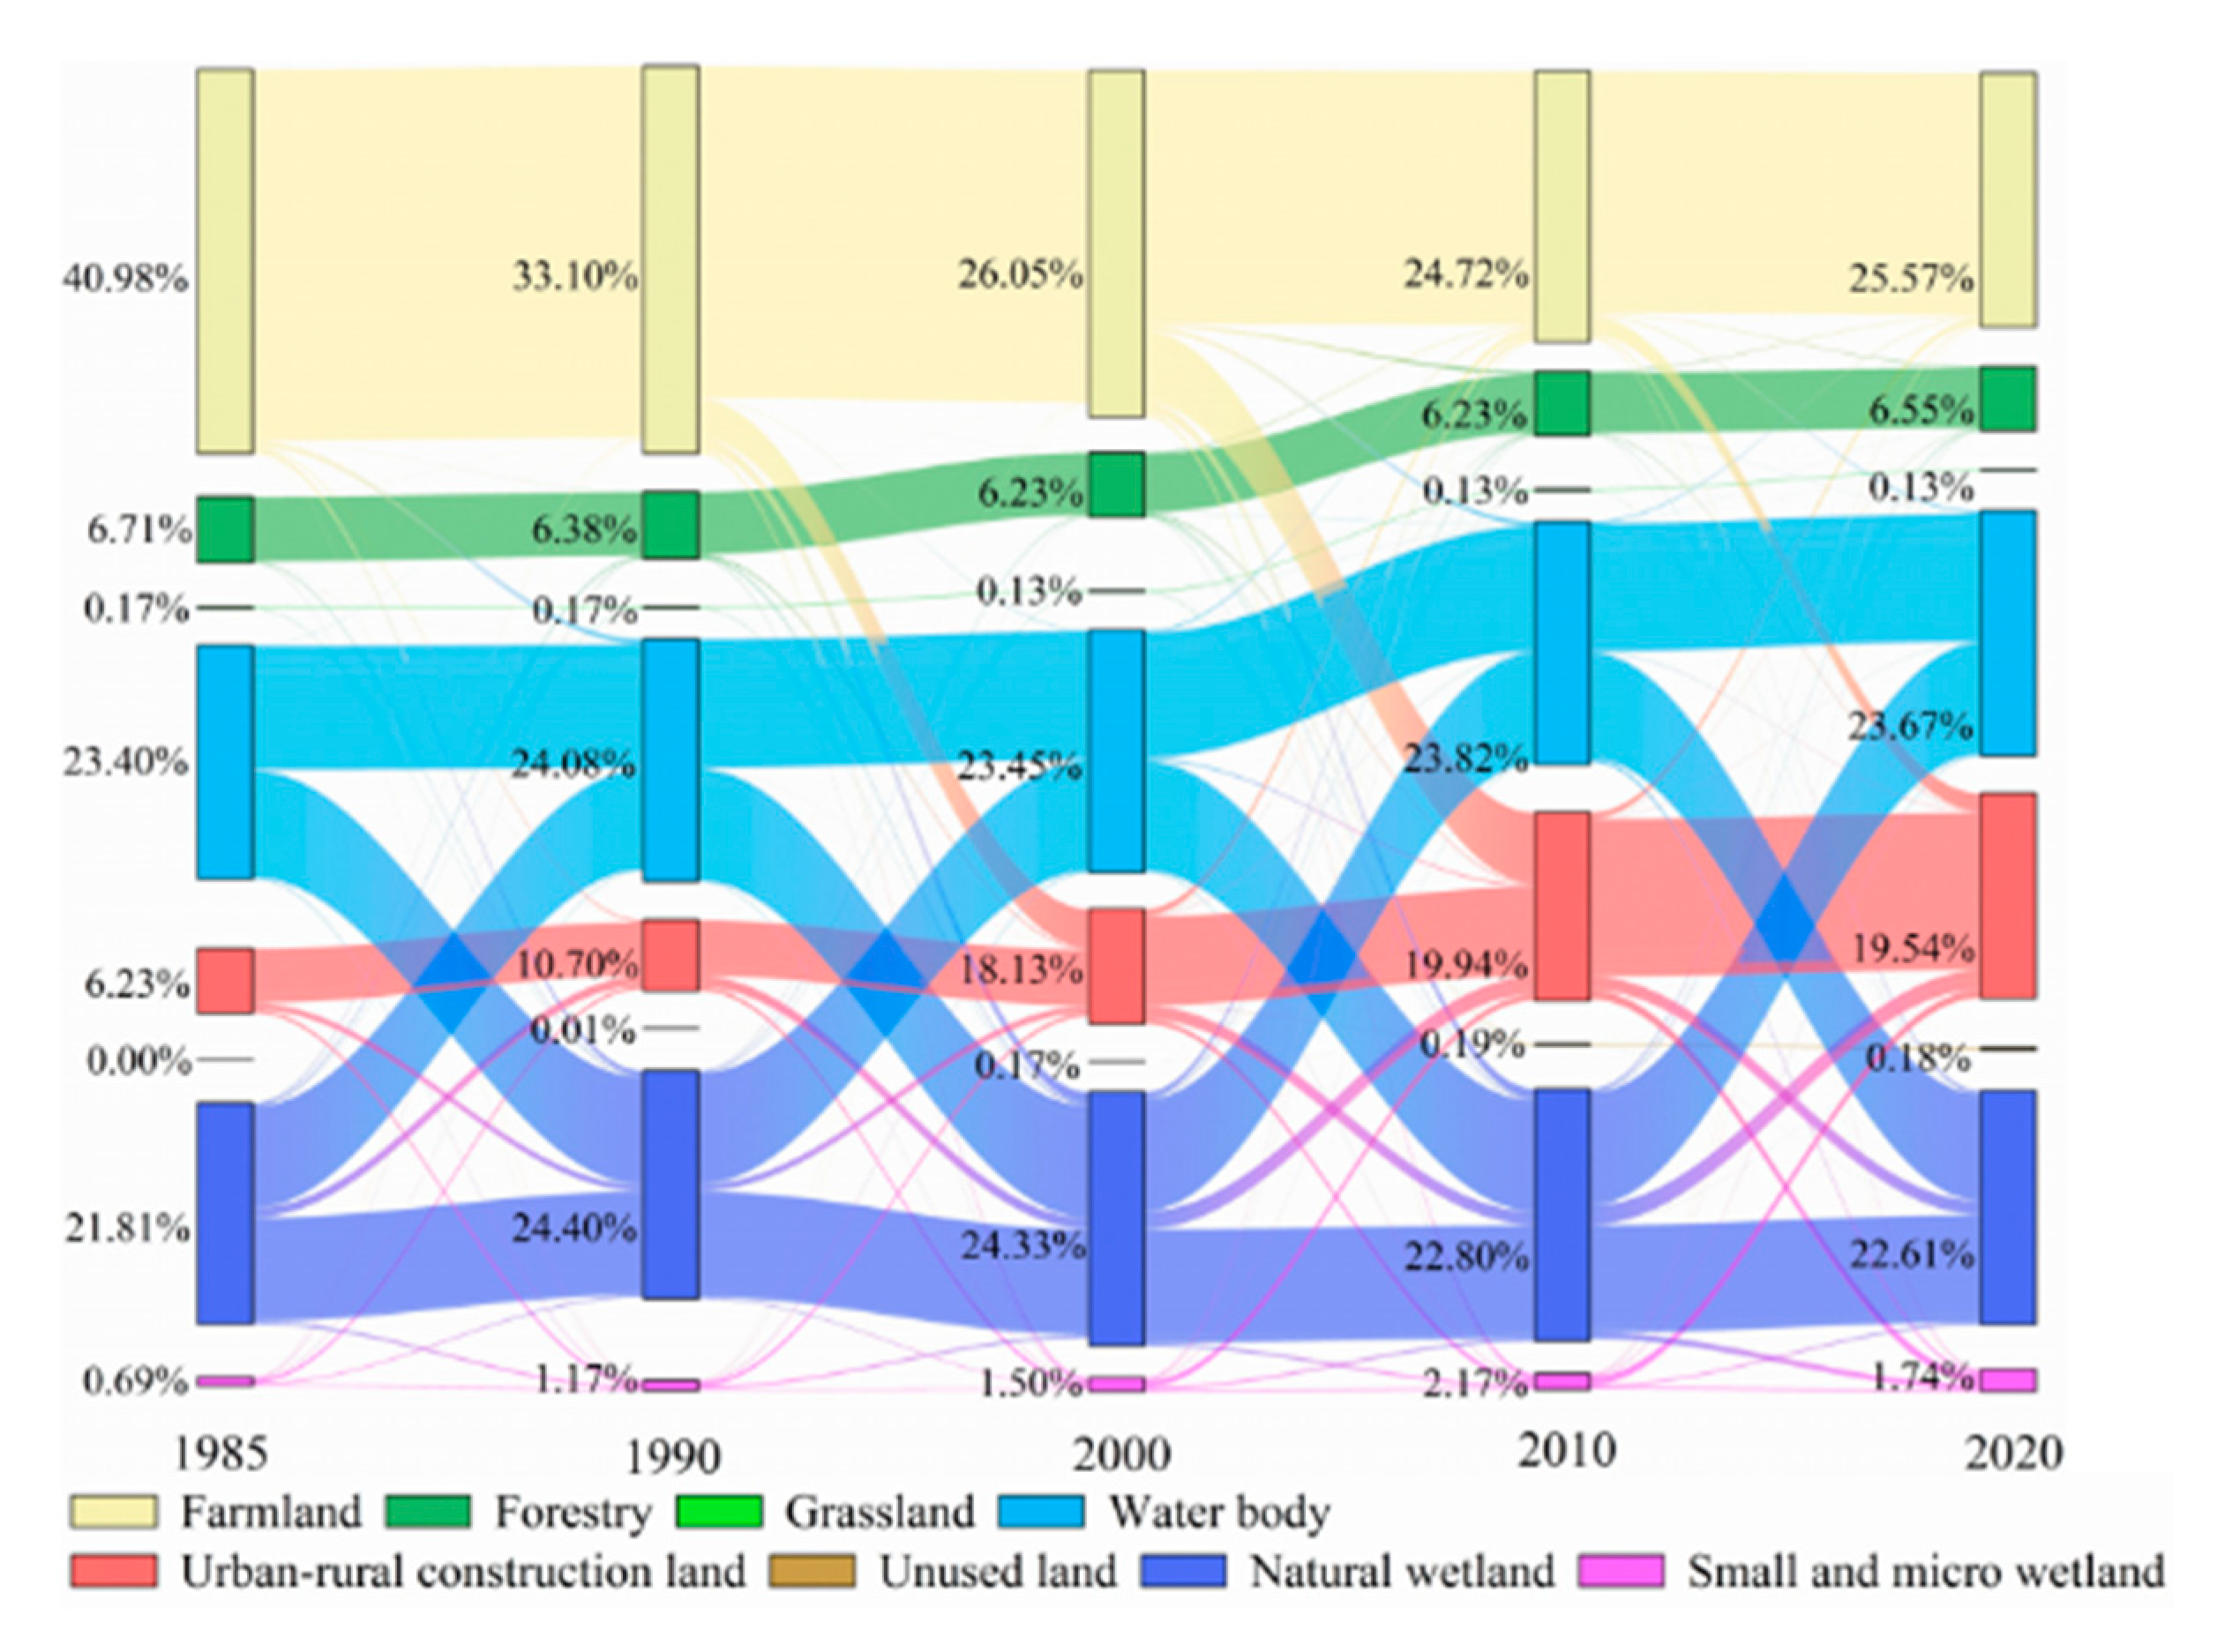
- From 1985 to 2010, the area of natural wetlands in Wuxi increased by 19% (1.26 × 10⁴ hm2) but decreased by 10% (0.94 × 10⁴ hm2) after 2010. Furthermore, the proportion of small and micro wetlands in the total area of natural wetlands increased from 5% in 1985 to 12% in 2020.
- (2)
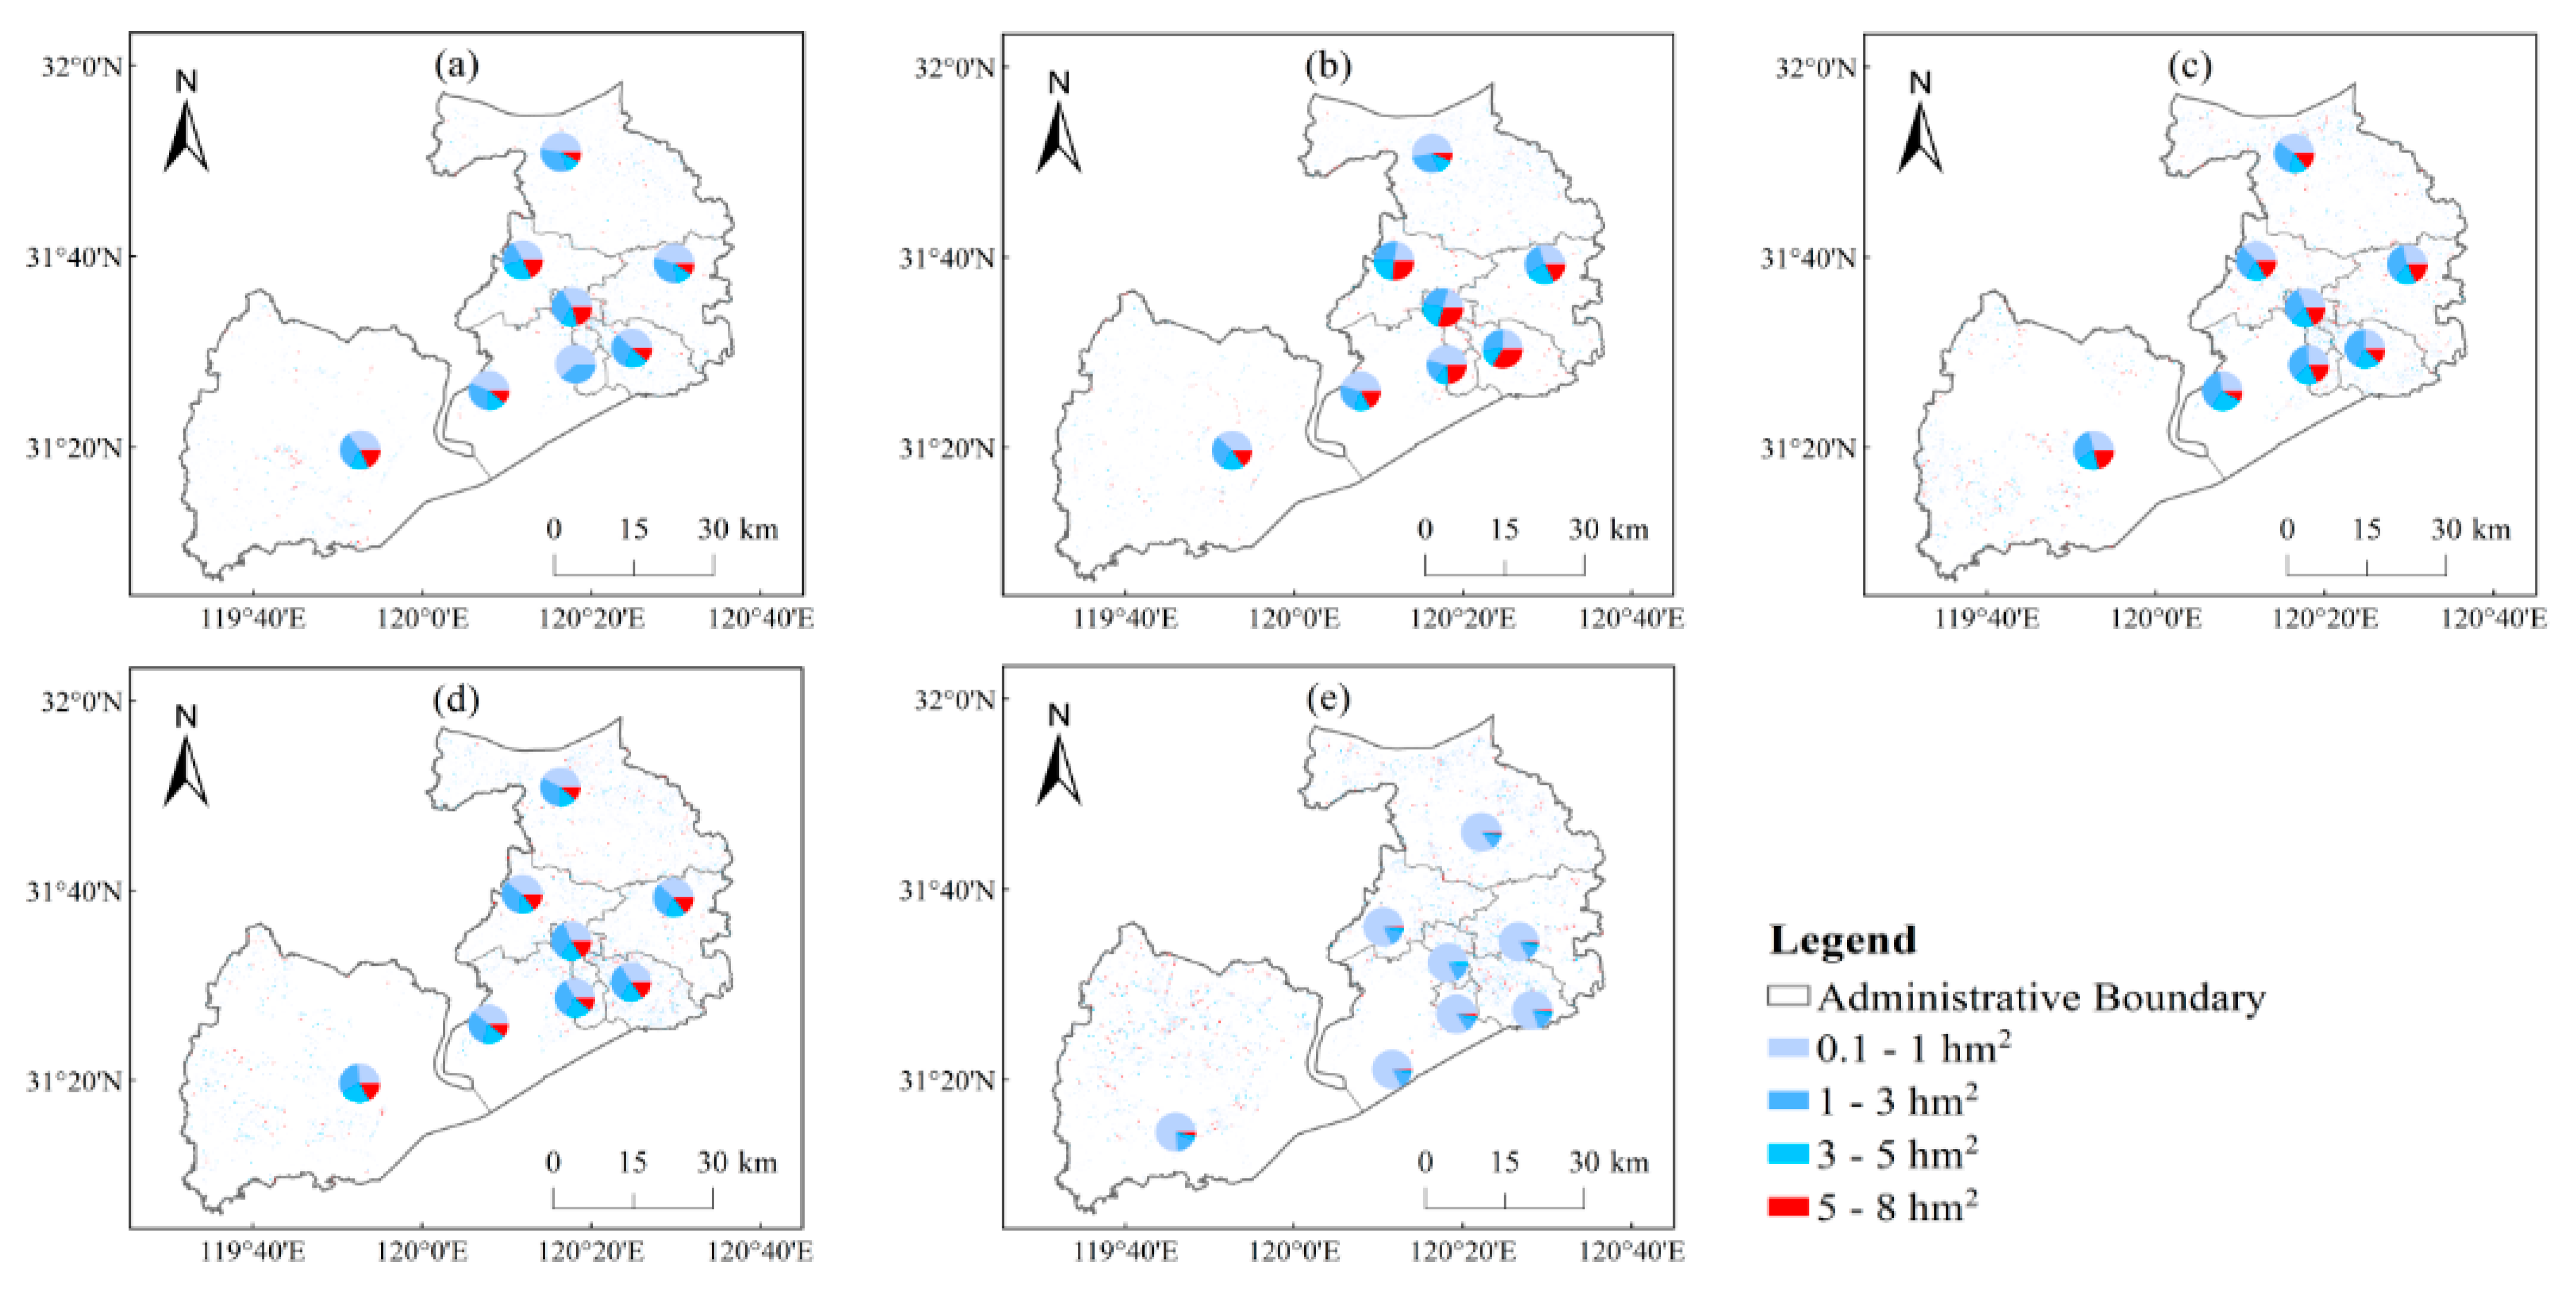
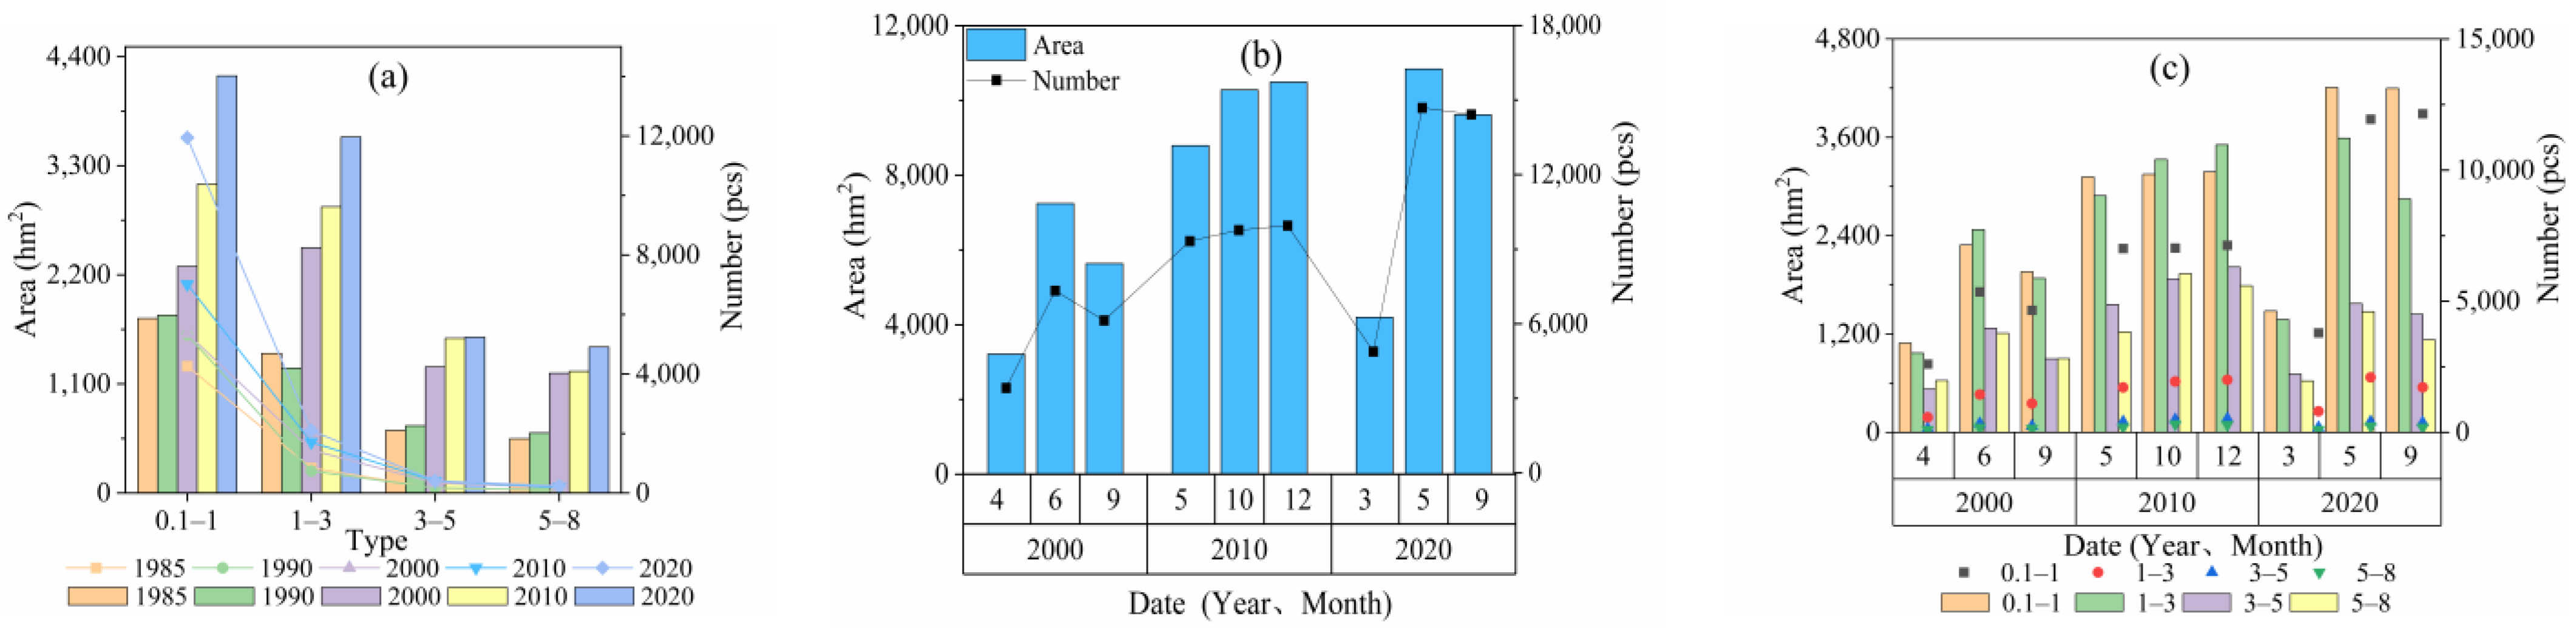
- The natural small and micro wetlands in Wuxi area showed a trend of scale expansion from 1985 to 2020, which was manifested by the increase in the area and quantity (1.5 times and 1.7 times, respectively), with obvious seasonal characteristics. The majority of small and micro wetlands were 0.1–1 hm2 and 1–3 hm2, while the number of small and micro wetland patches of large-area categories decreased.
- (3)
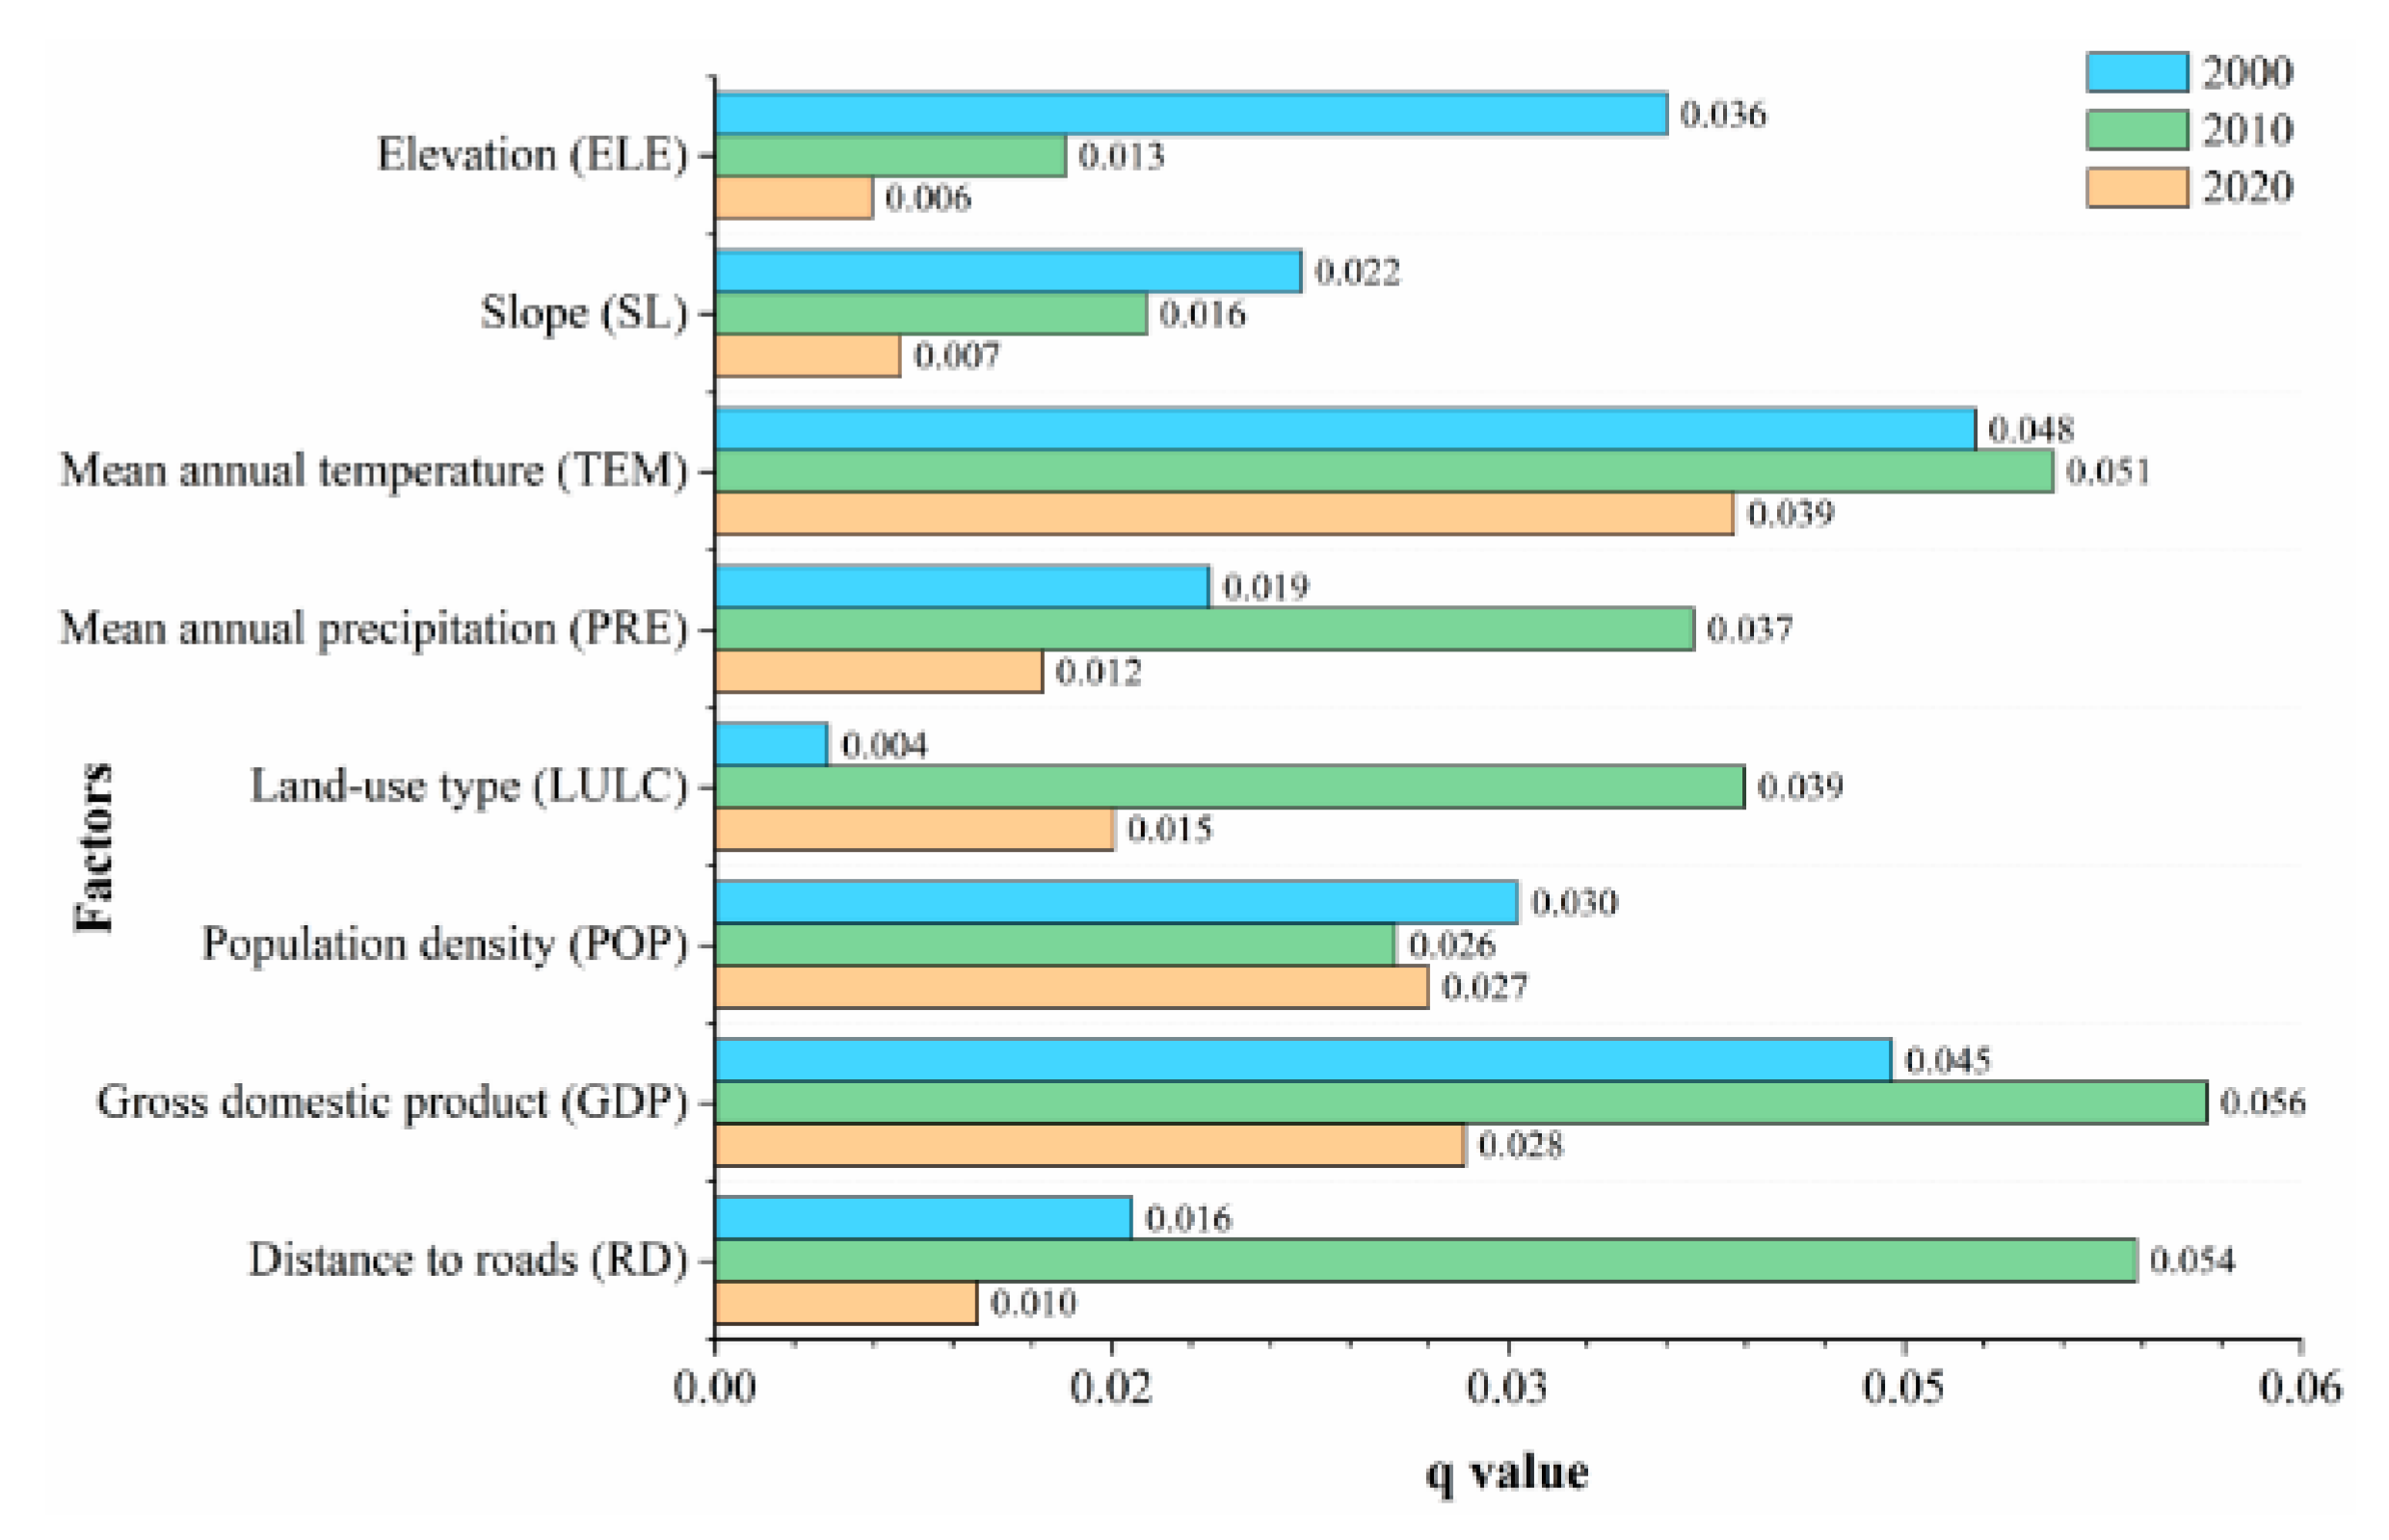
- Small and micro wetlands were affected by natural factors and human activities. Before 2010, natural factors were the main factors, whereas the contributions of human factors increased after 2010. The average annual temperature was the main natural factor that affected the changes in wetlands, while the GDP and population density were the most significant human factors that impacted the distribution of wetlands. Small and micro wetlands were influenced by the interactive enhancement between the two factors.
Author Contributions
Funding
Data Availability Statement
Acknowledgments
Conflicts of Interest
References
- Rahimi, L.; Malekmohammadi, B.; Yavari, A.R. Assessing and Modeling the Impacts of Wetland Land Cover Changes on Water Provision and Habitat Quality Ecosystem Services. Nat. Resour. Res. 2020, 29, 3701–3718. [Google Scholar] [CrossRef]
- Sun, J.; Yuan, X.; Liu, G.; Tian, K. Emergy and eco-exergy evaluation of wetland restoration based on the construction of a wetland landscape in the northwest Yunnan Plateau, China. J. Environ. Manag. 2019, 252, 109499. [Google Scholar] [CrossRef] [PubMed]
- Tornwall, B.; Pitt, A.; Brown, B.; Hawley-Howard, J.; Baldwin, R. Diversity Patterns Associated with Varying Dispersal Capabilities as a Function of Spatial and Local Environmental Variables in Small Wetlands in Forested Ecosystems. Forests 2020, 11, 1146. [Google Scholar] [CrossRef]
- Richardson, S.J.; Clayton, R.; Rance, B.D.; Broadbent, H.; McGlone, M.S.; Wilmshurst, J.M. Small wetlands are critical for safeguarding rare and threatened plant species. Appl. Veg. Sci. 2015, 18, 203–241. [Google Scholar] [CrossRef]
- Kim, B.; Lee, J.; Park, J. Role of small wetlands on the regime shift of ecological network in a wetlandscape. Environ. Res. Commun. 2022, 4, 041006. [Google Scholar] [CrossRef]
- Cheng, F.Y.; Basu, N.B. Biogeochemical hotspots: Role of small water bodies in landscape nutrient processing. Water Resour. Res. 2017, 53, 5038–5056. [Google Scholar] [CrossRef] [Green Version]
- Rabbani, G.; Rahman, S.H.; Faulkner, L. Impacts of Climatic Hazards on the Small Wetland Ecosystems (ponds): Evidence from Some Selected Areas of Coastal Bangladesh. Sustainability 2013, 5, 1510–1521. [Google Scholar] [CrossRef] [Green Version]
- Jeffries, M.J. Flood, drought and the inter-annual variation to the number and size of ponds and small wetlands in an English lowland landscape over three years of weather extremes. Hydrobiologia 2016, 768, 255–272. [Google Scholar] [CrossRef] [Green Version]
- Cui, L.; Gao, C.; Zhao, X.; Ma, Q.; Zhang, M.; Li, W.; Song, H.; Wang, Y.; Li, S.; Zhang, Y. Dynamics of the lakes in the middle and lower reaches of the Yangtze River basin, China, since late nineteenth century. Environ. Monit. Assess 2013, 185, 4005–4018. [Google Scholar] [CrossRef]
- Zhu, L.; Ke, Y.; Hong, J.; Zhang, Y.; Pan, Y. Assessing degradation of lake wetlands in Bashang Plateau, China based on long-term time series Landsat images using wetland degradation index. Ecol. Indic. 2022, 139, 108903. [Google Scholar] [CrossRef]
- Gxokwe, S.; Dube, T.; Mazvimavi, D.; Grenfell, M. Using cloud computing techniques to monitor long-term variations in ecohydrological dynamics of small seasonally-flooded wetlands in semi-arid South Africa. J. Hydrol. 2022, 612, 128080. [Google Scholar] [CrossRef]
- Janisch, J.E.; Foster, A.D.; Ehinger, W.J. Characteristics of small headwater wetlands in second-growth forests of Washington, USA. Forest Ecol. Manag. 2011, 261, 1265–1274. [Google Scholar] [CrossRef]
- Mwita, E.; Menz, G.; Misana, S.; Becker, M.; Kisanga, D.; Boehme, B. Mapping small wetlands of Kenya and Tanzania using remote sensing techniques. Int. J. Appl. Earth Obs. 2013, 21, 173–183. [Google Scholar] [CrossRef]
- Dale, J.; Burnside, N.G.; Strong, C.J.; Burgess, H.M. The use of small-Unmanned Aerial Systems for high resolution analysis for intertidal wetland restoration schemes. Ecol. Eng. 2020, 143, 105695. [Google Scholar] [CrossRef]
- Mahdianpari, M.; Salehi, B.; Mohammadimanesh, F.; Motagh, M. Random forest wetland classification using ALOS-2 L-band, RADARSAT-2 C-band, and TerraSAR-X imagery. ISPRS J. Photogramm. Remote Sens. 2017, 130, 13–31. [Google Scholar] [CrossRef]
- Wang, X.; Xiao, X.; Zou, Z.; Hou, L.; Qin, Y.; Dong, J.; Doughty, R.B.; Chen, B.; Zhang, X.; Chen, Y.; et al. Mapping coastal wetlands of China using time series Landsat images in 2018 and Google Earth Engine. ISPRS J. Photogramm. Remote Sens. 2020, 163, 312–326. [Google Scholar] [CrossRef]
- Jie, W.-H.; Xiao, C.-L.; Zhang, C.; Zhang, E.; Li, J.-Y.; Wang, B.; Niu, H.-W.; Dong, S.-F. Remote sensing-based dynamic monitoring and environmental change of wetlands in southern Mongolian Plateau in 2000–2018. China Geol. 2021, 4, 353–363. [Google Scholar] [CrossRef]
- Chu, L.; Sun, T.; Wang, T.; Li, Z.; Cai, C. Evolution and Prediction of Landscape Pattern and Habitat Quality Based on CA-Markov and InVEST Model in Hubei Section of Three Gorges Reservoir Area (TGRA). Sustainability 2018, 10, 3854. [Google Scholar] [CrossRef] [Green Version]
- Guo, M.; Li, J.; Sheng, C.; Xu, J.; Wu, L. A Review of Wetland Remote Sensing. Sensors 2017, 17, 777. [Google Scholar] [CrossRef] [Green Version]
- Zhang, X.; Wang, G.; Xue, B.; Zhang, M.; Tan, Z. Dynamic landscapes and the driving forces in the Yellow River Delta wetland region in the past four decades. Sci. Total Environ. 2021, 787, 147644. [Google Scholar] [CrossRef]
- Li, Y. The Water Information Extraction and Land Cover Classification of Nansihu Lake Based on SPOT5 Remote Sensing Image. Master’s Thesis, Shandong University, Jinan, China, 2008. [Google Scholar]
- Song, C.; Ke, L.; Pan, H.; Zhan, S.; Liu, K.; Ma, R. Long-term surface water changes and driving cause in Xiong’an, China: From dense Landsat time series images and synthetic analysis. Sci. Bull. 2018, 63, 708–716. [Google Scholar] [CrossRef] [PubMed] [Green Version]
- Ogilvie, A.; Poussin, J.-C.; Bader, J.-C.; Bayo, F.; Bodian, A.; Dacosta, H.; Dia, D.; Diop, L.; Martin, D.; Sambou, S. Combining Multi-Sensor Satellite Imagery to Improve Long-Term Monitoring of Temporary Surface Water Bodies in the Senegal River Floodplain. Remote Sens. 2020, 12, 3157. [Google Scholar] [CrossRef]
- Cavallo, C.; Papa, M.N.; Gargiulo, M.; Palau-Salvador, G.; Vezza, P.; Ruello, G. Continuous Monitoring of the Flooding Dynamics in the Albufera Wetland (Spain) by Landsat-8 and Sentinel-2 Datasets. Remote Sens. 2021, 13, 3525. [Google Scholar] [CrossRef]
- Fan, T.; Wang, S.; Wang, X.; Chen, X. Optimization effect of ecological restoration based on high-resolution remote sensing images in the ecological construction of soil and water conservation. J. Amb. Intel. Hum. Comp. 2022, 13, 87. [Google Scholar] [CrossRef]
- Alibakhshi, S.; Groen, T.A.; Rautiainen, M.; Naimi, B. Remotely-Sensed Early Warning Signals of a Critical Transition in a Wetland Ecosystem. Remote Sens. 2017, 9, 352. [Google Scholar] [CrossRef] [Green Version]
- Zhao, Y.; Wang, S.; Zhang, F.; Shen, Q.; Li, J.; Yang, F. Remote Sensing-Based Analysis of Spatial and Temporal Water Colour Variations in Baiyangdian Lake after the Establishment of the Xiong’an New Area. Remote Sens. 2021, 13, 1729. [Google Scholar] [CrossRef]
- Doyle, C.; Beach, T.; Luzzadder-Beach, S. Tropical Forest and Wetland Losses and the Role of Protected Areas in Northwestern Belize, Revealed from Landsat and Machine Learning. Remote Sens. 2021, 13, 379. [Google Scholar] [CrossRef]
- Piaser, E.; Villa, P. Evaluating capabilities of machine learning algorithms for aquatic vegetation classification in temperate wetlands using multi-temporal Sentinel-2 data. Int. J. Appl. Earth Obs. 2023, 117, 103202. [Google Scholar] [CrossRef]
- Gao, Y.; Cui, L.; Liu, J.; Li, W.; Lei, Y. China’s coastal-wetland change analysis based on high-resolution remote sensing. Mar. Freshw. Res. 2020, 71, 1161. [Google Scholar] [CrossRef]
- Banks, S.; White, L.; Behnamian, A.; Chen, Z.; Montpetit, B.; Brisco, B.; Pasher, J.; Duffe, J. Wetland Classification with Multi-Angle/Temporal SAR Using Random Forests. Remote Sens. 2019, 11, 670. [Google Scholar] [CrossRef] [Green Version]
- Wei, C.; Guo, B.; Fan, Y.; Zang, W.; Ji, J. The Change Pattern and Its Dominant Driving Factors of Wetlands in the Yellow River Delta Based on Sentinel-2 Images. Remote Sens. 2022, 14, 4388. [Google Scholar] [CrossRef]
- Balogun, A.-L.; Yekeen, S.T.; Pradhan, B.; Althuwaynee, O.F. Spatio-Temporal Analysis of Oil Spill Impact and Recovery Pattern of Coastal Vegetation and Wetland Using Multispectral Satellite Landsat 8-OLI Imagery and Machine Learning Models. Remote Sens. 2020, 12, 1225. [Google Scholar] [CrossRef] [Green Version]
- Ghosh, S.; Das, A. Wetland conversion risk assessment of East Kolkata Wetland: A Ramsar site using random forest and support vector machine model. J. Clean. Prod. 2020, 275, 123475. [Google Scholar] [CrossRef]
- Zhang, Z.; Hu, B.; Jiang, W.; Qiu, H. Identification and scenario prediction of degree of wetland damage in Guangxi based on the CA-Markov model. Ecol. Indic. 2021, 127, 107764. [Google Scholar] [CrossRef]
- Mao, D.; Wang, Z.; Wu, J.; Wu, B.; Zeng, Y.; Song, K.; Yi, K.; Luo, L. China’s wetlands loss to urban expansion. Land Degrad. Dev. 2018, 29, 2644–2657. [Google Scholar] [CrossRef]
- Chen, M.; Xu, X.; Wu, X.; Mi, C. Centennial-scale study on the spatial-temporal evolution of riparian wetlands in the Yangtze River of China. Int. J. Appl. Earth Obs. 2022, 113, 102874. [Google Scholar] [CrossRef]
- Fairchild, G.W.; Robinson, C.; Brainard, A.S.; Coutu, G.W. Historical Changes in the Distribution and Abundance of Constructed Ponds in Response to Changing Population Density and Land Use. Landsc. Res. 2013, 38, 593–606. [Google Scholar] [CrossRef]
- Johnston, C.A.; McIntyre, N.E. Effects of cropland encroachment on prairie pothole wetlands: Numbers, density, size, shape, and structural connectivity. Landsc. Ecol. 2019, 34, 827–841. [Google Scholar] [CrossRef]
- Terasmaa, J.; Bartout, P.; Marzecova, A.; Touchart, L.; Vandel, E.; Koff, T.; Choffel, Q.; Kapanen, G.; Maleval, V.; Vainu, M.; et al. A quantitative assessment of the contribution of small standing water bodies to the European waterscapes—Case of Estonia and France. Heliyon 2019, 5, e2482. [Google Scholar] [CrossRef] [Green Version]
- Liang, D.; Lu, J.; Chen, X.; Liu, C.; Lin, J. An investigation of the hydrological influence on the distribution and transition of wetland cover in a complex lake–floodplain system using time-series remote sensing and hydrodynamic simulation. J. Hydrol. 2020, 587, 125038. [Google Scholar] [CrossRef]
- Wijewardene, L.; Wu, N.; Qu, Y.; Guo, K.; Messyasz, B.; Lorenz, S.; Riis, T.; Ulrich, U.; Fohrer, N. Influences of pesticides, nutrients, and local environmental variables on phytoplankton communities in lentic small water bodies in a German lowland agricultural area. Sci. Total Environ. 2021, 780, 146481. [Google Scholar] [CrossRef] [PubMed]
- Hu, W.; Li, G.; Li, Z. Spatial and temporal evolution characteristics of the water conservation function and its driving factors in regional lake wetlands—Two types of homogeneous lakes as examples. Ecol. Indic. 2021, 130, 108069. [Google Scholar] [CrossRef]
- Wang, J.; Zhang, T.; Fu, B. A measure of spatial stratified heterogeneity. Ecol. Indic. 2016, 67, 250–256. [Google Scholar] [CrossRef]
- Huang, S.; Xiao, L.; Zhang, Y.; Wang, L.; Tang, L. Interactive effects of natural and anthropogenic factors on heterogenetic accumulations of heavy metals in surface soils through geodetector analysis. Sci. Total Environ. 2021, 789, 147937. [Google Scholar] [CrossRef] [PubMed]
- Liu, J.; Xu, Q.; Yi, J.; Huang, X. Analysis of the heterogeneity of urban expansion landscape patterns and driving factors based on a combined Multi-Order Adjacency Index and Geodetector model. Ecol. Indic. 2022, 136, 108655. [Google Scholar] [CrossRef]
- Wang, S.; Zhang, L.; Zhang, H.; Han, X.; Zhang, L. Spatial—Temporal Wetland Landcover Changes of Poyang Lake Derived from Landsat and HJ-1A/B Data in the Dry Season from 1973–2019. Remote Sens. 2020, 12, 1595. [Google Scholar] [CrossRef]
- Wang, Y.; Zhang, Z.; Chen, X. Quantifying Influences of Natural and Anthropogenic Factors on Vegetation Changes Based on Geodetector: A Case Study in the Poyang Lake Basin, China. Remote Sens. 2021, 13, 5081. [Google Scholar] [CrossRef]
- Wang, Y.; Wen, H.; Sun, D.; Li, Y. Quantitative Assessment of Landslide Risk Based on Susceptibility Mapping Using Random Forest and GeoDetector. Remote Sens. 2021, 13, 2625. [Google Scholar] [CrossRef]
- Long, X.; Lin, H.; An, X.; Chen, S.; Qi, S.; Zhang, M. Evaluation and analysis of ecosystem service value based on land use/cover change in Dongting Lake wetland. Ecol. Indic. 2022, 136, 108619. [Google Scholar] [CrossRef]
- Liu, Y.; Yang, P.; Zhang, S.; Wang, W. Dynamic identification and health assessment of wetlands in the middle reaches of the Yangtze River basin under changing environment. J. Clean. Prod. 2022, 345, 131105. [Google Scholar] [CrossRef]
- Xing, L.; Niu, Z.; Jiao, C.; Zhang, J.; Han, S.; Cheng, G.; Wu, J. A Novel Workflow for Seasonal Wetland Identification Using Bi-Weekly Multiple Remote Sensing Data. Remote Sens. 2022, 14, 1037. [Google Scholar] [CrossRef]
- Xiaoli, H.; Xin, L.; Ling, L. Modeling the Land Use Change in an Arid Oasis Constrained by Water Resources and Environmental Policy Change Using Cellular Automata Models. Sustainability 2018, 10, 2878. [Google Scholar] [CrossRef] [Green Version]
- Koko, A.; Yue, W.; Abubakar, G.; Hamed, R.; Noman, A.A. Monitoring and Predicting Spatio-Temporal Land Use/Land Cover Changes in Zaria City, Nigeria, through an Integrated Cellular Automata and Markov Chain Model (CA-Markov). Sustainability 2020, 12, 10452. [Google Scholar] [CrossRef]
- Siddique, M.A.; Wang, Y.; Xu, N.; Ullah, N.; Zeng, P. The Spatiotemporal Implications of Urbanization for Urban Heat Islands in Beijing: A Predictive Approach Based on CA—Markov Modeling (2004–2050). Remote Sens. 2021, 13, 4697. [Google Scholar] [CrossRef]
- Ju, H.; Zhang, Z.; Zuo, L.; Wang, J.; Zhang, S.; Wang, X.; Zhao, X. Driving forces and their interactions of built-up land expansion based on the geographical detector—A case study of Beijing, China. Int. J. Geogr. Inf. Sci. IJGIS 2016, 30, 2188–2207. [Google Scholar] [CrossRef]
- Huan, W.; Jiangbo, G.; Wenjuan, H. Quantitative attribution analysis of soil erosion in different geomorphological types in karst areas: Based on the geodetector method. J. Geogr. Sci. 2019, 29, 271–286. [Google Scholar] [CrossRef] [Green Version]
- Song, Y.; Wang, J.; Ge, Y.; Xu, C. An optimal parameters-based geographical detector model enhances geographic characteristics of explanatory variables for spatial heterogeneity analysis: Cases with different types of spatial data. Gisci. Remote Sens. 2020, 57, 593–610. [Google Scholar] [CrossRef]
- Ren, D.; Cao, A. Analysis of the heterogeneity of landscape risk evolution and driving factors based on a combined GeoDa and Geodetector model. Ecol. Indic. 2022, 144, 109568. [Google Scholar] [CrossRef]
- Ji, B.; Qin, Y.; Zhang, T.; Zhou, X.; Yi, G.; Zhang, M.; Li, M. Analyzing Driving Factors of Drought in Growing Season in the Inner Mongolia Based on Geodetector and GWR Models. Remote Sens. 2022, 14, 6007. [Google Scholar] [CrossRef]
- Zhu, L.; Meng, J.; Zhu, L. Applying Geodetector to disentangle the contributions of natural and anthropogenic factors to NDVI variations in the middle reaches of the Heihe River Basin. Ecol. Indic. 2020, 117, 106545. [Google Scholar] [CrossRef]
- Wang, K.; Cao, C.; Xie, B.; Xu, M.; Yang, X.; Guo, H.; Duerler, R.S. Analysis of the Spatial and Temporal Evolution Patterns of Grassland Health and Its Driving Factors in Xilingol. Remote Sens. 2022, 14, 5179. [Google Scholar] [CrossRef]
- Wang, D.; Dong, Z.; Ling, Z.; Jiang, F.; Zhu, S.; Chen, J. Spatiotemporal variability of extreme precipitation at different time scales and quantitative analysis of associated driving teleconnection factors: Insights from Taihu Basin, China. Ecol. Indic. 2022, 142, 109287. [Google Scholar] [CrossRef]
- Gxokwe, S.; Dube, T.; Mazvimavi, D. Multispectral Remote Sensing of Wetlands in Semi-Arid and Arid Areas: A Review on Applications, Challenges and Possible Future Research Directions. Remote Sens. 2020, 12, 4190. [Google Scholar] [CrossRef]
- Chen, K.; Cong, P.; Qu, L.; Liang, S.; Sun, Z. Annual variation of the landscape pattern in the Liao River Delta wetland from 1976 to 2020. Ocean. Coast. Manag. 2022, 224, 106175. [Google Scholar] [CrossRef]
- Mahdianpari, M.; Jafarzadeh, H.; Granger, J.E.; Mohammadimanesh, F.; Brisco, B.; Salehi, B.; Homayouni, S.; Weng, Q. A large-scale change monitoring of wetlands using time series Landsat imagery on Google Earth Engine: A case study in Newfoundland. Gisci. Remote Sens. 2020, 57, 1102–1124. [Google Scholar] [CrossRef]
- Han, X.; Feng, L.; Hu, C.; Chen, X. Wetland changes of China’s largest freshwater lake and their linkage with the Three Gorges Dam. Remote Sens. Environ. 2018, 204, 799–811. [Google Scholar] [CrossRef]
- Ahmed, K.R.; Akter, S.; Marandi, A.; Schüth, C. A simple and robust wetland classification approach by using optical indices, unsupervised and supervised machine learning algorithms. Remote Sens. Appl. Soc. Environ. 2021, 23, 100569. [Google Scholar] [CrossRef]
- Darrah, S.E.; Shennan-Farpón, Y.; Loh, J.; Davidson, N.C.; Finlayson, C.M.; Gardner, R.C.; Walpole, M.J. Improvements to the Wetland Extent Trends (WET) index as a tool for monitoring natural and human-made wetlands. Ecol. Indic. 2019, 99, 294–298. [Google Scholar] [CrossRef]
- Wen, L.; Hughes, M.G. Coastal Wetland Responses to Sea Level Rise: The Losers and Winners Based on Hydro-Geomorphological Settings. Remote Sens. 2022, 14, 1888. [Google Scholar] [CrossRef]
- An, X.; Jin, W.; Zhang, H.; Liu, Y.; Zhang, M. Analysis of long-term wetland variations in China using land use/land cover dataset derived from Landsat images. Ecol. Indic. 2022, 145, 109689. [Google Scholar] [CrossRef]
- Duan, Y.; Tian, B.; Li, X.; Liu, D.; Sengupta, D.; Wang, Y.; Peng, Y. Tracking changes in aquaculture ponds on the China coast using 30 years of Landsat images. Int. J. Appl. Earth Obs. 2021, 102, 102383. [Google Scholar] [CrossRef]
- Wu, W.; Zhi, C.; Gao, Y.; Chen, C.; Chen, Z.; Su, H.; Lu, W.; Tian, B. Increasing fragmentation and squeezing of coastal wetlands: Status, drivers, and sustainable protection from the perspective of remote sensing. Sci. Total Environ. 2022, 811, 152339. [Google Scholar] [CrossRef] [PubMed]
- Zhang, L.; Wu, B.; Yin, K.; Li, X.; Kia, K.; Zhu, L. Impacts of human activities on the evolution of estuarine wetland in the Yangtze Delta from 2000 to 2010. Environ. Earth Sci. 2015, 73, 435–447. [Google Scholar] [CrossRef]
- Yang, H.; Wang, H.; Lu, J.; Zhou, Z.; Feng, Q.; Wu, Y. Full Lifecycle Monitoring on Drought-Converted Catastrophic Flood Using Sentinel-1 SAR: A Case Study of Poyang Lake Region during Summer 2020. Remote Sens. 2021, 13, 3485. [Google Scholar] [CrossRef]
- Chen, H.; Zhang, W.; Gao, H.; Nie, N. Climate Change and Anthropogenic Impacts on Wetland and Agriculture in the Songnen and Sanjiang Plain, Northeast China. Remote Sens. 2018, 10, 356. [Google Scholar] [CrossRef] [Green Version]
- Junk, W.J.; An, S.; Finlayson, C.M.; Gopal, B.; Květ, J.; Mitchell, S.A.; Mitsch, W.J.; Robarts, R.D. Current state of knowledge regarding the world’s wetlands and their future under global climate change: A synthesis. Aquat. Sci. 2013, 75, 151–167. [Google Scholar] [CrossRef] [Green Version]
- You, H.; Fan, H.; Xu, L.; Wu, Y.; Liu, L.; Yao, Z. Poyang Lake Wetland Ecosystem Health Assessment of Using the Wetland Landscape Classification Characteristics. Water 2019, 11, 825. [Google Scholar] [CrossRef] [Green Version]
- Mu, S.; Li, B.; Yao, J.; Yang, G.; Wan, R.; Xu, X. Monitoring the spatio-temporal dynamics of the wetland vegetation in Poyang Lake by Landsat and MODIS observations. Sci. Total Environ. 2020, 725, 138096. [Google Scholar] [CrossRef]
- Edvardsson, J.; Šimanauskienė, R.; Taminskas, J.; Baužienė, I.; Stoffel, M. Increased tree establishment in Lithuanian peat bogs—Insights from field and remotely sensed approaches. Sci. Total Environ. 2015, 505, 113–120. [Google Scholar] [CrossRef]
- Wang, C.; Ma, L.; Zhang, Y.; Chen, N.; Wang, W. Spatiotemporal dynamics of wetlands and their driving factors based on PLS-SEM: A case study in Wuhan. Sci. Total Environ. 2021, 806, 151310. [Google Scholar] [CrossRef]
- William, J.M.; Maria, E.H. Landscape and climate change threats to wetlands of North and Central America. Aquat. Sci. 2013, 75, 133–149. [Google Scholar] [CrossRef]
- Li, Q.; Long, Z.; Wang, H.; Zhang, G. Functions of constructed wetland animals in water environment protection—A critical review. Sci. Total Environ. 2021, 760, 144038. [Google Scholar] [CrossRef] [PubMed]
- Zhu, L.; Zhang, H.; Li, Y.; Cheng, G.; Zhu, Y.; Song, C.; Wang, L.; Du, G. Long-term variation characteristics of nutrients in the water and sediments of a surface flow constructed wetland with micro-polluted water sources. Ecol. Eng. 2023, 187, 106848. [Google Scholar] [CrossRef]
- Ghosh, S.; Das, A. Urban expansion induced vulnerability assessment of East Kolkata Wetland using Fuzzy MCDM method. Remote Sens. Appl. Soc. Environ. 2019, 13, 191–203. [Google Scholar] [CrossRef]
- Ding, Q.; Chen, Y.; Bu, L.; Ye, Y. Multi-Scenario Analysis of Habitat Quality in the Yellow River Delta by Coupling FLUS with InVEST Model. Int. J. Environ. Res. Public Health 2021, 18, 2389. [Google Scholar] [CrossRef]
- Yang, L.; Zhang, S.; Yin, L.; Zhang, B. Global occupation of wetland by artificial impervious surface area expansion and its impact on ecosystem service value for 2001–2018. Ecol. Indic. 2022, 142, 109307. [Google Scholar] [CrossRef]
- Ricaurte, L.F.; Olaya-Rodríguez, M.H.; Cepeda-Valencia, J.; Lara, D.; Arroyave-Suárez, J.; Finlayson, C.M.; Palomo, I. Future impacts of drivers of change on wetland ecosystem services in Colombia. Glob. Environ. Chang. 2017, 44, 158–169. [Google Scholar] [CrossRef]
- Dang, A.T.N.; Kumar, L.; Reid, M.; Nguyen, H. Remote Sensing Approach for Monitoring Coastal Wetland in the Mekong Delta, Vietnam: Change Trends and Their Driving Forces. Remote Sens. 2021, 13, 3359. [Google Scholar] [CrossRef]
- Yu, M.-J.; Wu, J.-J.; Xu, J.M.; Shi, J.C. Studies on the Changes of Landscape Patterns of Hangzhou Xixi Wetland in 15 years. Bull. Sci. Technol. 2007, 23, 320–325. [Google Scholar] [CrossRef]
- Ranjan, R. Restoring natural wetlands through financial incentives based adoption of constructed wetlands on agricultural farms. J. Clean. Prod. 2021, 317, 128346. [Google Scholar] [CrossRef]
- Xu, Y.; Zhang, X.; Liu, X.; Zhang, Z. Biodiversity and Spatiotemporal Distribution of Spontaneous Vegetation in Tangdao Bay National Wetland Park, Qingdao City, China. Int. J. Environ. Res. Public Health 2022, 19, 11665. [Google Scholar] [CrossRef] [PubMed]
- Vymazal, J. Constructed Wetlands for Wastewater Treatment: Five Decades of Experience. Environ. Sci. Technol. 2011, 45, 61–69. [Google Scholar] [CrossRef] [PubMed]
- Gabr, M.E.; Al-Ansari, N.; Salem, A.; Awad, A. Proposing a Wetland-Based Economic Approach for Wastewater Treatment in Arid Regions as an Alternative Irrigation Water Source. Hydrology 2023, 10, 20. [Google Scholar] [CrossRef]
- Zhang, G.; Yao, T.; Chen, W.; Zheng, G.; Shum, C.K.; Yang, K.; Piao, S.; Sheng, Y.; Yi, S.; Li, J.; et al. Regional differences of lake evolution across China during 1960s–2015 and its natural and anthropogenic causes. Remote Sens. Environ. 2019, 221, 386–404. [Google Scholar] [CrossRef]
- Dong, L.; Wan, R.; Li, B.; Tan, Z.; Yang, S.; Zhang, T. Spatiotemporal dynamics of lake wetland in the Wanjiang Plain of the Yangtze River basin, China during the recent century. Ecol. Indic. 2022, 142, 109295. [Google Scholar] [CrossRef]
- Yang, S.; Wan, R.; Yang, G.; Li, B.; Dong, L. Combining historical maps and landsat images to delineate the centennial-scale changes of lake wetlands in Taihu Lake Basin, China. J. Environ. Manag. 2023, 329, 117110. [Google Scholar] [CrossRef]


| Data Type | Data | Year | Date of Acquisition | Spatial Resolution (m) | Sources |
|---|---|---|---|---|---|
| Remote sensing | Landsat 4/5 TM | 1980 | 01/11 | 30 × 30 | USGS: https://www.usgs.gov/ (accessed on 30 September 2021) |
| 1990 | 10/08 | 30 × 30 | |||
| 2000 | 04/26, 06/13, 09/17 | 30 × 30 | |||
| 2010 | 05/24, 10/31, 12/18 | 30 × 30 | |||
| Landsat 8 OLI | 2020 | 03/16, 05/19, 09/08 | 30 × 30 | ||
| Natural factors | Temperature | 2000, 2010, 2020 | 1000 × 1000 | The National Meteorological Information Center (http://data.cma.cn/, accessed on 28 July 2022) | |
| Precipitation | 1000 × 1000 | ||||
| DEM, Slope | 2020 | 30 × 30 | Geospatial Data Cloud: http://www.gscloud.cn/ (accessed on 28 July 2022) | ||
| Anthropogenic factors | Population | 2000–2020 | 1000 × 1000 | WorldPop: https://www.worldpop.org (accessed on 28 July 2022) | |
| Gross Domestic Product (GDP) | 2000–2020 | 1000 × 1000 | Resources and Environmental Sciences: http://www.resdc.cn and Wuxi Statistical Yearbook (accessed on 28 July 2022) | ||
| Roads | 2000–2020 | Openstreetmap: https://www.openstreetmap.org (accessed on 28 July 2022) | |||
| Land use/land cover | 1985 | 30 × 30 | Resources and Environmental Science Data Center of the Chinese Academy of Sciences: http://www.resdc.cn (accessed on 28 July 2022) | ||
| 1990 | |||||
| 2000 | |||||
| 2010 | |||||
| 2020 |
| Categories | Factors | Code | Unit |
|---|---|---|---|
| Anthropogenic activity | Distance to main roads | X1 | km |
| GDP | X2 | 104 yuan/km2 | |
| Population density | X3 | person/km2 | |
| Land-use type | X4 | categorical | |
| Climate | Average annual precipitation | X5 | mm |
| Average annual temperature | X6 | °C | |
| Topography | Slope | X7 | degree |
| Elevation | X8 | m |
| Categories \Factors | Distance to Main Roads | GDP | Population Density | Land-Use Type | Average Annual Precipitation | Average Annual Temperature | Slope | Elevation |
|---|---|---|---|---|---|---|---|---|
| 1 | 0–1.1 | 1442–8408 | 0–1610 | Farmland | 1197.1–1268.8 | 14.88–16.14 | 0–2 | 3–10 |
| 2 | 1.1–2.5 | 8408–15,799 | 1610–4258 | Forestry | 1268.8–1311.4 | 16.14–16.88 | 2–6 | 10–20 |
| 3 | 2.5–4.6 | 15,799–29,191 | 4258–9396 | Grassland | 1311.4–1350.1 | 16.88–17.29 | 6–12 | 20–30 |
| 4 | 4.6–7.3 | 29,191–55,251 | 9396–19,441 | Water body | 1350.1–1393.4 | 17.29–17.45 | 12–20 | 30–100 |
| 5 | 7.3–11.6 | 55,251–124,436 | 19,441–37,046 | Urban–rural construction land | 1393.4–1445.2 | 17.45–17.60 | 20–30 | 100–300 |
| 6 | 11.6–18.6 | 124,436–228,808 | 37,046–67,612 | Unused land | 1445.2–1548.2 | 17.60–17.80 | >30 | 300–585 |
| Interaction Relationship | Interaction |
|---|---|
| q(X1∩X2) > q(X1) + q(X2) | Enhanced, nonlinear |
| q(X1∩X2) = q(X1) + q(X2) | Independent |
| q(X1∩X2) > Max(q(X1), q(X2)) | Enhanced, double factors |
| Min(q(X1), q(X2)) < q(X1∩X2) < Max(q(X1), q(X2)) | Weakened, single-factor nonlinear |
| q(X1∩X2) < Min(q(X1), q(X2)) | Weakened, nonlinear |
| Serial Number | Geographical Coordinate | Image Extraction Area (hm2) | Field Survey Area (hm2) | Difference (hm2) | Error (%) | Location |
|---|---|---|---|---|---|---|
| 1 | 31°14′N, 119°46′E | 4.76 | 4.83 | −0.07 | −1.45 | Yixing district |
| 2 | 31°15′N, 119°50′E | 2.41 | 2.50 | −0.09 | −3.60 | |
| 3 | 31°33′N, 120°13′E | 2.93 | 2.98 | −0.05 | −1.68 | Binhu district |
| 4 | 31°35′N, 120°6′E | 4.71 | 4.88 | −0.17 | −3.48 | Huishan district |
| 5 | 31°46′N, 120°34′E | 1.85 | 1.94 | −0.09 | −4.64 | Jiangyin district |
| 6 | 31°52′N, 120°4′E | 2.23 | 2.33 | −0.10 | −4.29 |
Disclaimer/Publisher’s Note: The statements, opinions and data contained in all publications are solely those of the individual author(s) and contributor(s) and not of MDPI and/or the editor(s). MDPI and/or the editor(s) disclaim responsibility for any injury to people or property resulting from any ideas, methods, instructions or products referred to in the content. |
© 2023 by the authors. Licensee MDPI, Basel, Switzerland. This article is an open access article distributed under the terms and conditions of the Creative Commons Attribution (CC BY) license (https://creativecommons.org/licenses/by/4.0/).
Share and Cite
Zhang, J.; Chu, L.; Zhang, Z.; Zhu, B.; Liu, X.; Yang, Q. Evolution of Small and Micro Wetlands and Their Driving Factors in the Yangtze River Delta—A Case Study of Wuxi Area. Remote Sens. 2023, 15, 1152. https://doi.org/10.3390/rs15041152
Zhang J, Chu L, Zhang Z, Zhu B, Liu X, Yang Q. Evolution of Small and Micro Wetlands and Their Driving Factors in the Yangtze River Delta—A Case Study of Wuxi Area. Remote Sensing. 2023; 15(4):1152. https://doi.org/10.3390/rs15041152
Chicago/Turabian StyleZhang, Jiamin, Lei Chu, Zengxin Zhang, Bin Zhu, Xiaoyan Liu, and Qiang Yang. 2023. "Evolution of Small and Micro Wetlands and Their Driving Factors in the Yangtze River Delta—A Case Study of Wuxi Area" Remote Sensing 15, no. 4: 1152. https://doi.org/10.3390/rs15041152