Article

Spatiotemporal Distribution and Main Influencing Factors of Grasshopper Potential Habitats in Two Steppe Types of Inner Mongolia, China

1
Key Laboratory of Digital Earth Science, Aerospace Information Research Institute, Chinese Academy of Sciences, Beijing 100094, China
2
International Research Center of Big Data for Sustainable Development Goals, Beijing 100094, China
3
University of Chinese Academy of Sciences, Beijing 100049, China
4
Key Laboratory of Biohazard Monitoring and Green Prevention and Control in Artificial Grassland, Ministry of Agriculture and Rural Affairs, Hohhot 010010, China
5
Center for Territorial Spatial Planning and Real Estate Studies, Beijing Normal University, Zhuhai 519087, China
*
Author to whom correspondence should be addressed.
Remote Sens. 2023, 15(3), 866; https://doi.org/10.3390/rs15030866
Submission received: 5 January 2023 / Revised: 29 January 2023 / Accepted: 1 February 2023 / Published: 3 February 2023

Abstract

:
Grasshoppers can greatly interfere with agriculture and husbandry, and they will breed and grow rapidly in suitable habitats. Therefore, it is necessary to extract the distribution of the grasshopper potential habitat (GPH), analyze the spatial-temporal characteristics of the GPH, and detect the different effects of key environmental factors in the meadow and typical steppe. To achieve the goal, this study took the two steppe types of Xilingol (the Inner Mongolia Autonomous Region of China) as the research object and coupled them with the MaxEnt and multisource remote sensing data to establish a model. First, the environmental factors, including meteorological, vegetation, topographic, and soil factors, that affect the developmental stages of grasshoppers were obtained. Secondly, the GPH associated with meadow and typical steppes from 2018 to 2022 were extracted based on the MaxEnt model. Then, the spatial-temporal characteristics of the GPHs were analyzed. Finally, the effects of the habitat factors in two steppe types were explored. The results demonstrated that the most suitable and moderately suitable areas were distributed mainly in the southern part of the meadow steppe and the eastern and southern parts of the typical steppe. Additionally, most areas in the town of Gaorihan, Honggeergaole, Jirengaole, as well as the border of Wulanhalage and Haoretugaole became more suitable for grasshoppers from 2018 to 2022. This paper also found that the soil temperature in the egg stage, the vegetation type, the soil type, and the precipitation amount in the nymph stage were significant factors both in the meadow and typical steppes. The slope and precipitation in the egg stage played more important roles in the typical steppe, whereas the aspect had a greater contribution to the meadow steppe. These findings can provide a methodical guide for grasshopper control and management and for further ensuring the security of agriculture and husbandry.

Graphical Abstract

1. Introduction

Grasshoppers are among the most dangerous agricultural pests in grasslands [1] and they can threaten large areas of grasslands in a short time [2]. According to the statistical data, more than 6.67 million hectares of grasslands in China are damaged by grasshoppers every year, even with the highest reported loss of 13.33 million hectares occurring in 2009. Furthermore, when a grasshopper plague outbreaks, it can lead to several serious environmental and socioeconomic consequences such as grassland degradation and desertification [3,4]. China has gradually strengthened the prevention and control measures against grasshoppers [5,6,7]. However, affected by the diverse grassland types and vast areas [8], climate change [9], the long survival time of grasshopper eggs [10], and human activities [11,12], grasshoppers are still prone to infestation when the environmental conditions are suitable. This increases the complexity and difficulty of monitoring and controlling grasshoppers. Therefore, it is crucial to explore grasshoppers’ potential habitat (GPH), analyze the spatial-temporal distribution of the GPH, and understand the effect of the main influencing factors in different steppe types.
China has the largest natural grassland in the world, and Inner Mongolia accounts for 27% of the grasslands in China [13]. Therefore, it is difficult for grassland pest control stations to determine the regions in which grasshoppers are likely to occur and should thus be given attention. Recently, remote sensing technology has shown the advantages of large-scale observations, high spatial resolutions, and real-time monitoring [14]. Such technologies have been widely used in large-scale pest habitat monitoring and prediction, such as forest pests, grassland pests, and so on [15,16,17,18,19]. Furthermore, numerous models have been developed to monitor and predict grasshoppers, among which maximum entropy species distribution modeling (MaxEnt) model [20] performs best for mapping grasshopper distributions [21,22,23,24,25]. The GPH distribution is affected by environmental factors, so many studies have been conducted to explore the relationships between habitat factors and GPH [10,26,27], but those studies have focused mainly on single-type factors. Some studies have combined multiple factors to extract the GPH. For instance, Wysiecki et al. integrated the precipitation, temperature, and plant communities and explored the relationships between these factors and the grasshopper distribution in southern Pampas, Argentina [28]. Matenaar et al. coupled the vegetation heterogeneity, elevation, and cover of bare ground to establish relationships between grasshoppers and these factors [29]. These studies provided great contributions to monitoring GPHs and reveal the relationships between the GPH and habitat factors; however, the role of key factors’ contributions vary among different steppe types [13]. Therefore, it is necessary to extract the GPHs, analyze their spatiotemporal distributions, and explore the relationships between the GPHs and the region-specific environmental factors in different steppes.
In this study, the MaxEnt model was applied in combination with multisource remote sensing data and Oedaleus decorus asiaticus (Bey-Bienko) in two types of steppes of Xilingol which were regarded as the research objects. This paper aims to: (1) explore the distribution of GPHs by coupling the MaxEnt model with multisource remote sensing data; (2) analyze the spatiotemporal characteristics of GPHs in the meadow and typical steppe regions from 2018 to 2022; and (3) detect the effects of related environmental variables and determine the most relevant environmental factors of the two steppe types. By coupling the MaxEnt model and remote sensing data to extract the GPHs, we explored the spatiotemporal changes and the key factors affecting the GPHs in two main grassland types; this work can serve as methodological support to guide related grasshopper precautions and control and will thus be beneficial for ensuring ecological environment security and promoting sustainable husbandry development.

2. Materials and Methods

2.1. Study Area

In this study, two major steppe types of Xilingol league (42°32′~46°41′N, 111°59′~120°00′E) were selected as the study area (Figure 1a): a meadow steppe (Figure 1b) and a typical steppe (Figure 1c). The meadow steppe in the Xilingol often occurs on castanozem and saline-alkalized soils with poor fertility. The dominant grass L. chinensis has strong colonization capability. The species diversity is typically 10–15 species/m2. Moreover, the meadow steppe is grazed by sheep, goats, horses, and cattle. The proportion of the dominant grasses and the plant diversity appear to influence the performance of these domestic animals [30]. In the typical steppe, the most abundant grasses were Stipa Grandis and Achnatherum sibiricum, which are more favored by grasshoppers [31]. Additionally, compared with the meadow steppe, the fractional vegetation coverage is lower in the typical steppe. Therefore, it is easier to cause grasshopper infestation.
The study area has a temperate continental climate, characterized by being arid with sparse precipitation and a decreasing precipitation trend from east to west. The main geomorphological types are meadow soils, chernozems, and castanozems in the study area, all of which are suitable for grasshopper breeding [32]. In summary, the study area whether meadow or typical steppe has suitable soil types, climate conditions, and vegetation for grasshoppers so extensive grasshopper infestation areas are recorded every year [33].

2.2. Data Acquisition and Processing

2.2.1. Satellite Data

The MODIS products of MOD11A1, MOD13A2, and MOD09A1, covering the period from 2018 to 2022, were used to obtain the land surface temperature (LST), normalized difference vegetation index (NDVI), and soil salinity index (SI) values, respectively. The LST data included mean LST data and minimum LST data with a temporal resolution of 1 day. The NDVI and SI data had temporal resolutions of 16 days and 8 days, respectively. The aboveground biomass (AB) was calculated from the NDVI data with the following calculation formula as follows [13,34]:
A B = 26.38 e 3.8725 N D V I
The SI combines the green and red bands and is sensitive to the surface reflectance of salt-affected land [35]. This index has a good performance when indicating soil salinity. The calculation formula is as follows:
S I = B g B r
where B g and B r are the reflectance in the green band and red band, respectively.
All of the data were downloaded and calculated by Google Earth Engine [36].

2.2.2. Meteorological and Other Geospatial Data

The meteorological data covered the period from 2018 to 2022 and included the ERA5_LAND hourly dataset (Band: soil temperature level 1) and precipitation produced by the European Centre for Medium-Range Weather Forecasts and Global Precipitation Measurement (GPM) data.
In general, the soil type and topography (ground elevation, aspect, and slope) data showed little changes over the short period of study. Therefore, this paper hypothesized that these conditions did not change greatly during the study period. We downloaded topography data from the Geospatial Data Cloud of the Chinese Academy of Sciences. Soil type data were obtained from the 1:1,000,000 national database, which was updated in 2015. After preprocessing, which included steps such as mosaicking, masking, and reprojection, all of the data were resampled to a spatial resolution of 1 km.

2.2.3. Survey Data

The survey data used in this paper spanned from 2018 to 2022 and were obtained from the grassland pest control stations of the Xilingol (Figure 1). A regional survey method in accordance with the standards of the agricultural industry of the People’s Republic of China (NY/T 1578-2007, rules for investing locality and grasshopper in grassland) was used to investigate the overall grasshopper occurrence. The multipoint survey was carried out along the setting route that covered all the main natural geomorphic units, regular grasshopper occurrence areas, and occasional grasshopper occurrence areas. Sampling plots were set at an average interval of 10 km; then sampling points were set at an average interval of 100 m in each sample plot with triplicate repeated sampling. To reduce spatial autocorrelations, the grassland data were spatially rarefied with a radius of 1 km by using SDM toolbox 2.5 (Python-based GIS toolkit for species distribution model analyses) (http://www.sdmtoolbox.org/, assessed on 28 November 2022) and the observational grasshopper occurrence data were randomly assigned to the suitable vegetation area. Precise geographic grassland data were obtained from land cover data of 2020, which were downloaded from the Resource and Environment Science and Data Center (https://www.resdc.cn/, accessed on 5 June 2022).

2.3. Methods

The flowchart in Figure 2 demonstrates our methodology and shows the analytical method and the data used during each process. First, the factors that affected the grasshopper developmental stage were determined, including meteorological, soil, vegetation, and topographic. Then, by combining with the MaxEnt model, the GPH distribution was explored and the spatiotemporal characteristics of the GPHs were analyzed. Finally, the effects of the main influencing factors in the two steppe types were clarified, respectively.

2.3.1. Determination of Grasshopper Developmental Stage

There are a few dozen of species found in Xilingol, the most abundant species are Oedaleus decorus asiaticus (Bey-Bienko), Dasyhippus barbipes (Fischer von Waldheim), Bryodema luctuosum (Stoll), and Myrmeleotettix palpalis (Zubowsky). The Dasyhippus barbipes, Bryodema luctuosum, and Myrmeleotettix palpalis can be considered early hatching species, which almost cause less destruction to grassland. Oedaleus decorus asiaticus is considered an early-intermediate hatching species and its growing period is during the period when the pasture is flourishing [37]. Furthermore, it has the characteristics of aggregation, migration, and strong reproductive captaincy, so it can cause serious destruction to grassland. Additionally, the artificial survey time is during the Oedaleus decorus asiaticus’ growing period, so the majority records are based on this grasshopper. Therefore, the object of this paper is Oedaleus decorus asiaticus.
The developmental stages of grasshoppers can be classified into egg, nymph, and adult stages. When the temperature reaches the developmental initiation temperature of grasshoppers, they begin to hatch and turn into the first instar. Then, five or six instars will be experienced by the grasshoppers, lasting for one to two months. The period during which they grow from the first instar to the fifth or sixth instar is called the nymph stage. After finishing the nymph stage, they begin to eclosion and become adults. The adult grasshopper will find a mate and choose a suitable environment and weather to spawn its eggs. Generally, grasshoppers select sunny days with warm environmental conditions. After spawning, the eggs overwinter in the soil. The period after spawning until hatching in the next year is called the egg stage. According to previous studies, the egg stage in Xilingol spans from mid to late August in the previous year to mid-to-late May in the current year. The nymph period spans from mid-to-late May to early July. The adult period mainly spans from early July to mid-to-late August [38].

2.3.2. Select Influence Factors

The growth and occurrence of grasshoppers are affected by the climate, soil, vegetation, and topography. As a result, 20 habitat factors were selected herein to extract the GPH (Table 1) based on the difference principle and remote sensing operations. Vegetation is the main food source and significant breeding area for grasshoppers, though not all vegetation is favored by grasshoppers. The aboveground biomass is another vital factor that can reflect the amount of available food. The MeanLST, MinLST, precipitation, and soil temperature can determine egg mortality rate and grasshopper growth. Grasshopper oviposition, overwintering, and incubation occur in soil, and the soil salinity and soil type are important indicators of grasshopper growth and breeding [39,40]. To avoid strong collinearity between variables, we retained the variables with Pearson’s correlation coefficients smaller than 0.80 [41,42,43]. Finally, 14 habitat factors including AMeanLST, Aspect, EMinLST, EPre, ESI, EST, elevation, NSI, NAB, NMinLST, NPre, slope, soil type, and vegetation type were selected.

2.3.3. Extraction Method of GPH

In this study, MaxEnt (Version 3.4.1) was applied (https://biodiversityinformatics. amnh.org/open_source/MaxEnt/, accessed on 7 March 2022) [20] to extract the GPH distribution. This model has an effective predictive performance when modeling niche species’ habitat distributions and analyzing their relationship with environmental variables. The MaxEnt model formula is expressed as follows:
P w y | x = 1 z w x e ( i = 1 n w i f i x , y )
Z w x = y e ( i = 1 n w i f i x , y )
where x represents each input environmental variable, y is the location of the grasshopper occurrence, f i x , y is the characteristic function, w i is the weight of the characteristic function, n represents grasshopper occurrence point size, and P w y | x is the spatial distribution of the grasshopper habitat.
GPH maps were generated using the bootstrap approach with replicates set to 50 [44,45]. Grasshopper occurrence sites were randomly divided into two parts, the training (70%) and testing (30%) datasets for each year [46]. Matching environmental factors were applied as inputs to MaxEnt.
The model accuracy was evaluated in terms of the omission rate and predicted area (ORPA) and the area under the curve (AUC) of the receiver operating characteristic (ROC) curve [47]. The importance of every factor was evaluated based on the jackknife technique and the response curves were used to examine the specific relationships between habitat factors and the GPHs in the two steppe types. MaxEnt provides three output formats, and the logistic format was selected in this study. Output values represent the species distribution probability ranging from 0 to 1. According to a previous study [48] and the characteristics of the two steppe types, three levels of possibility were set: less suitable (0–0.5), moderately suitable (0.5–0.7), and most suitable (0.7–1).

3. Results

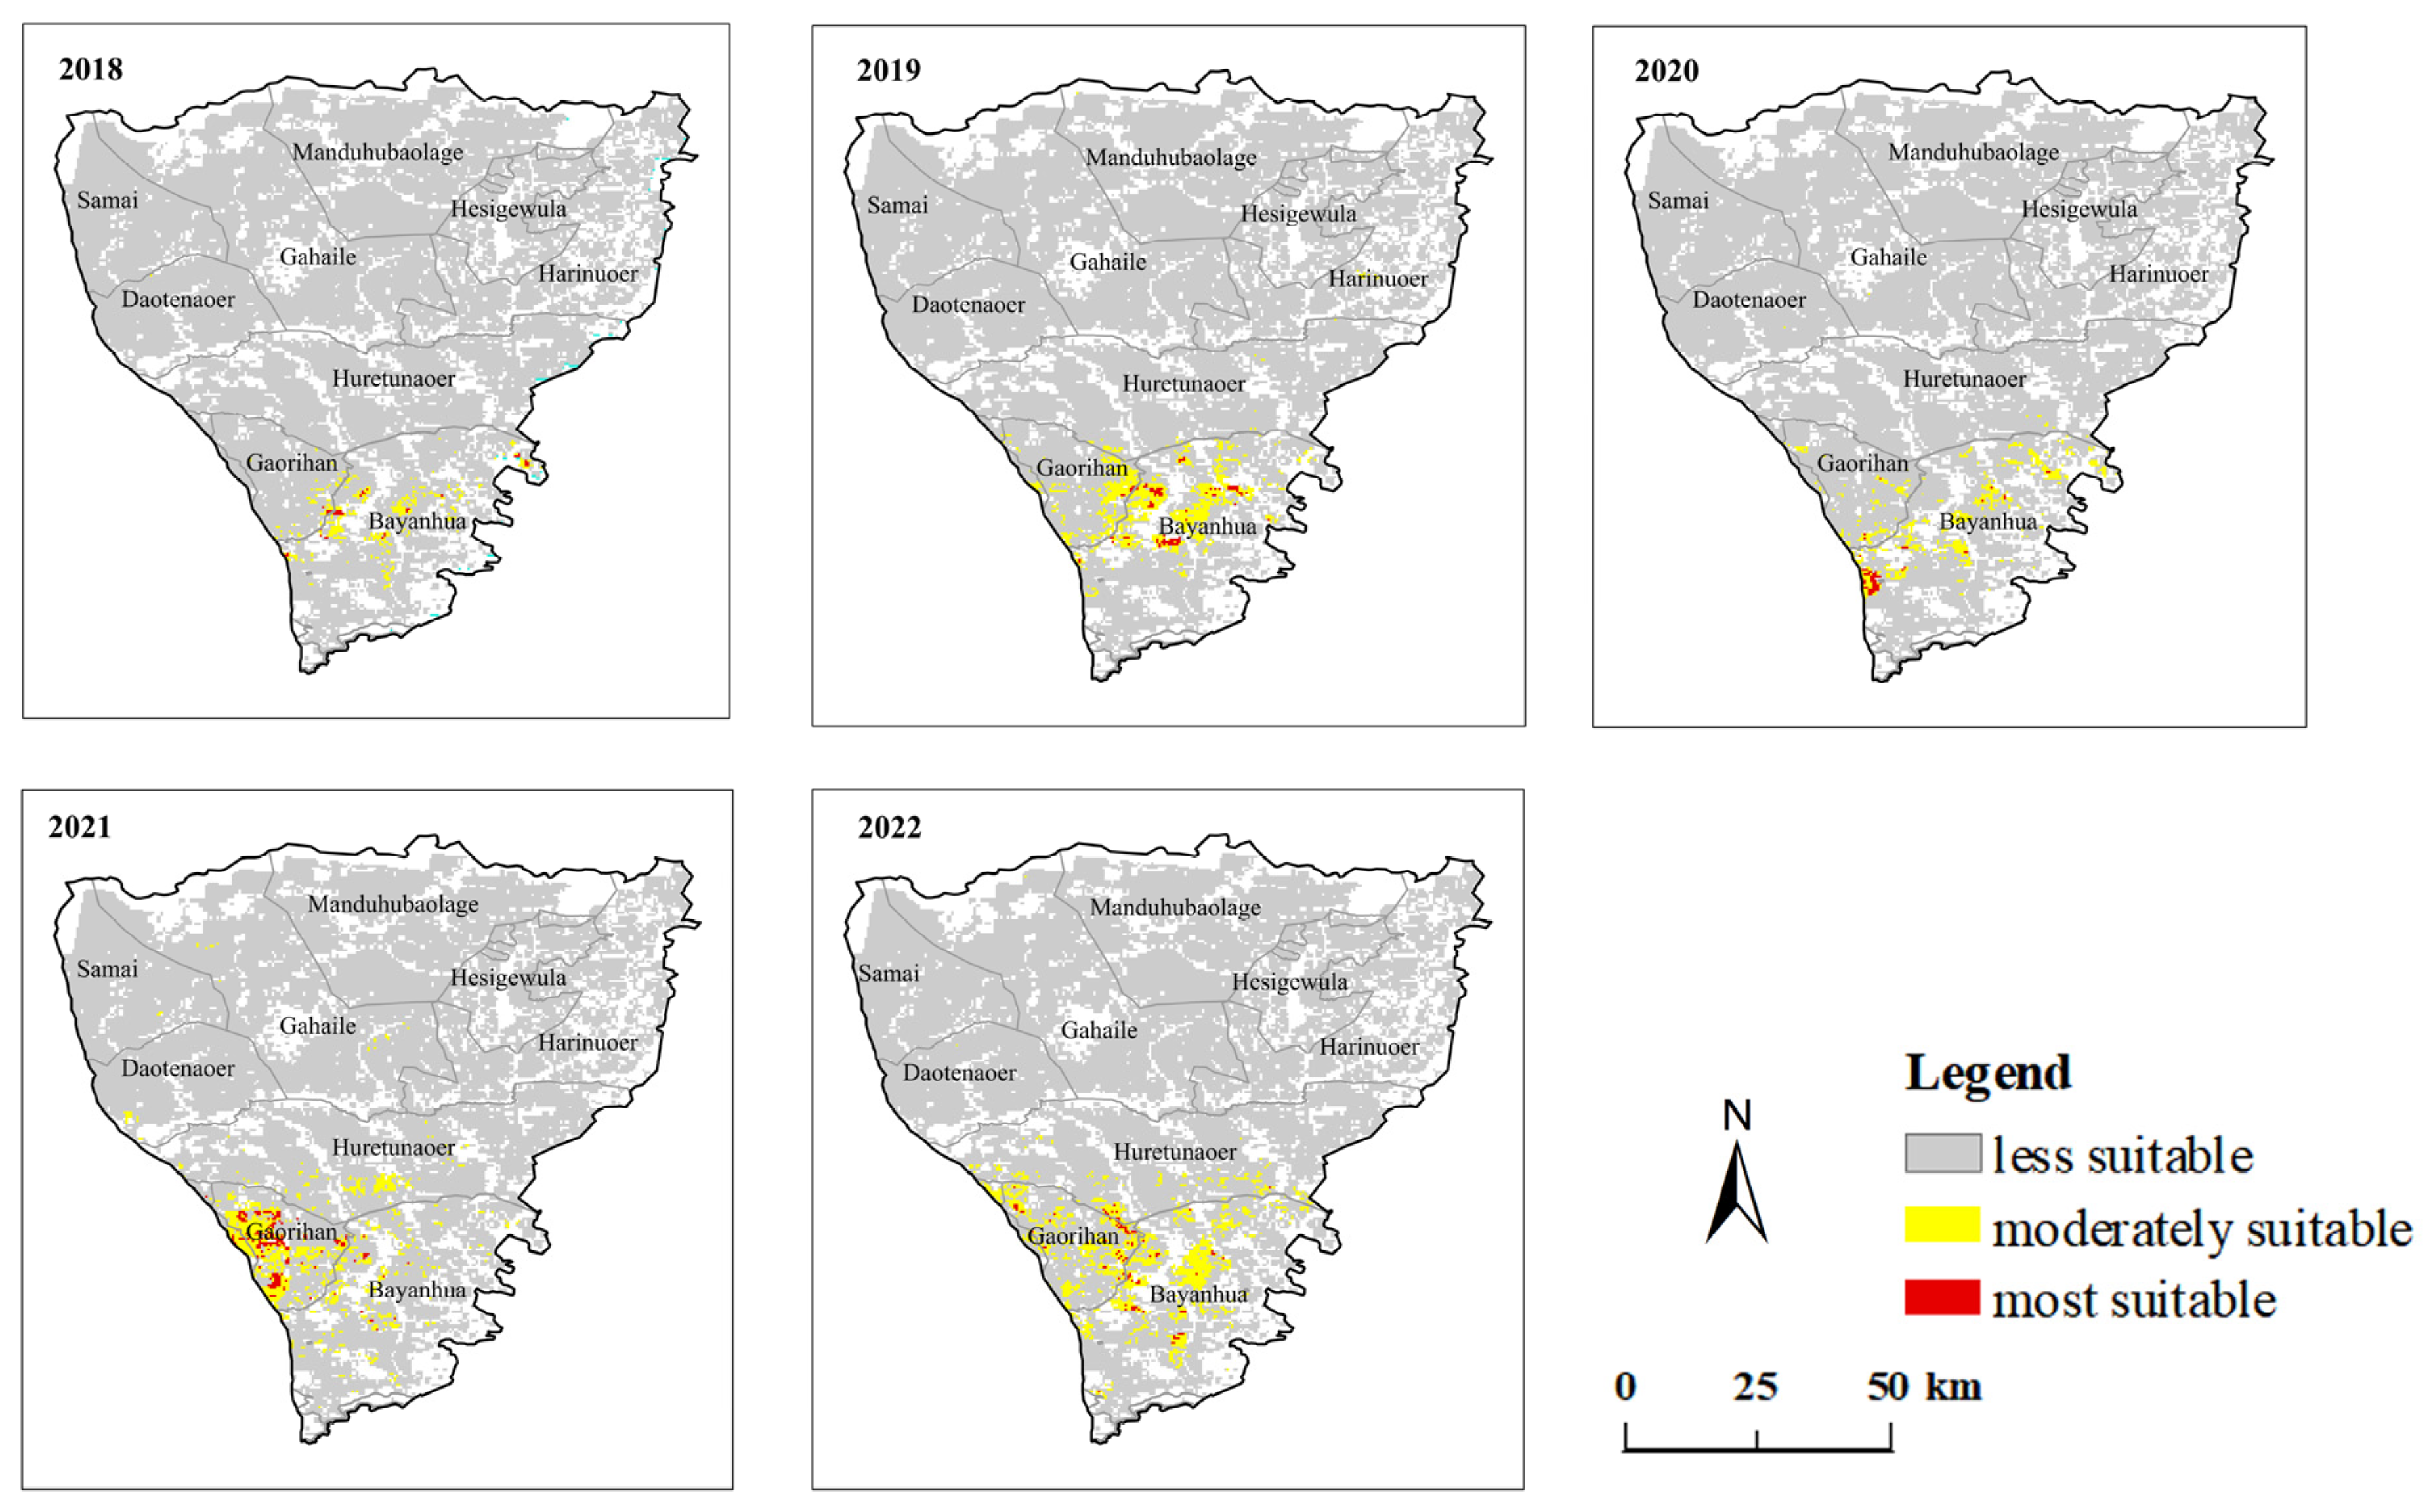
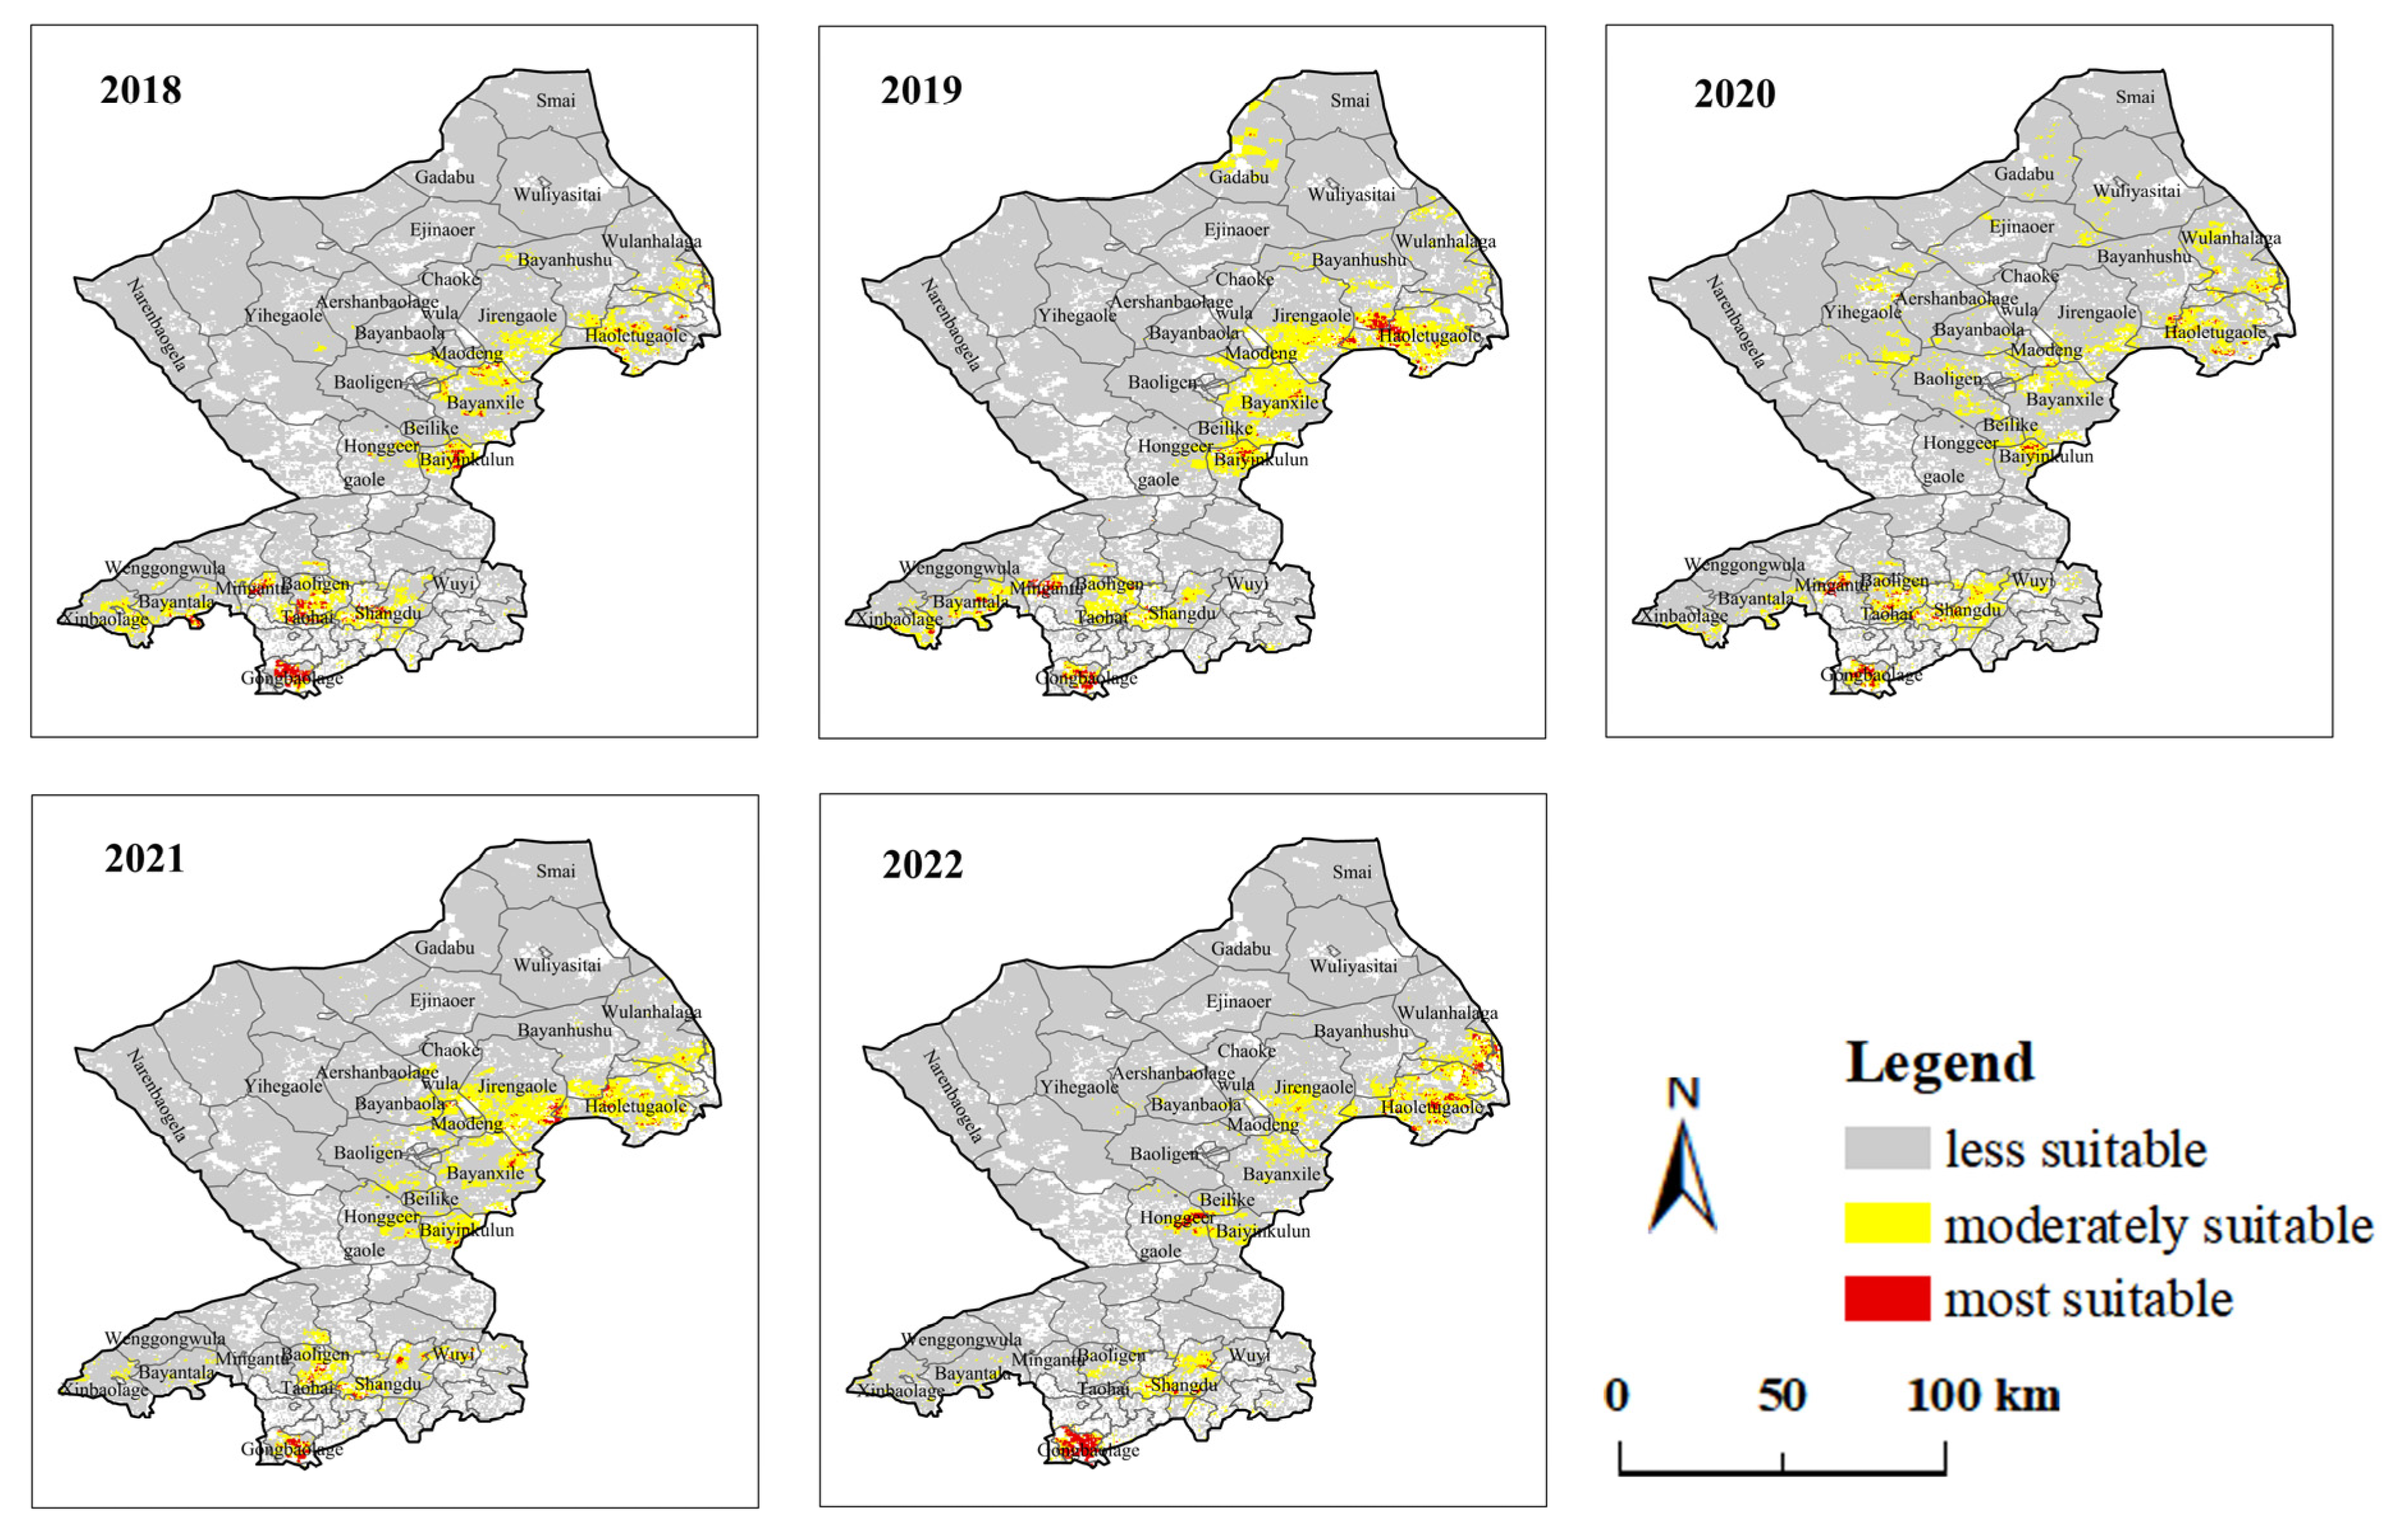
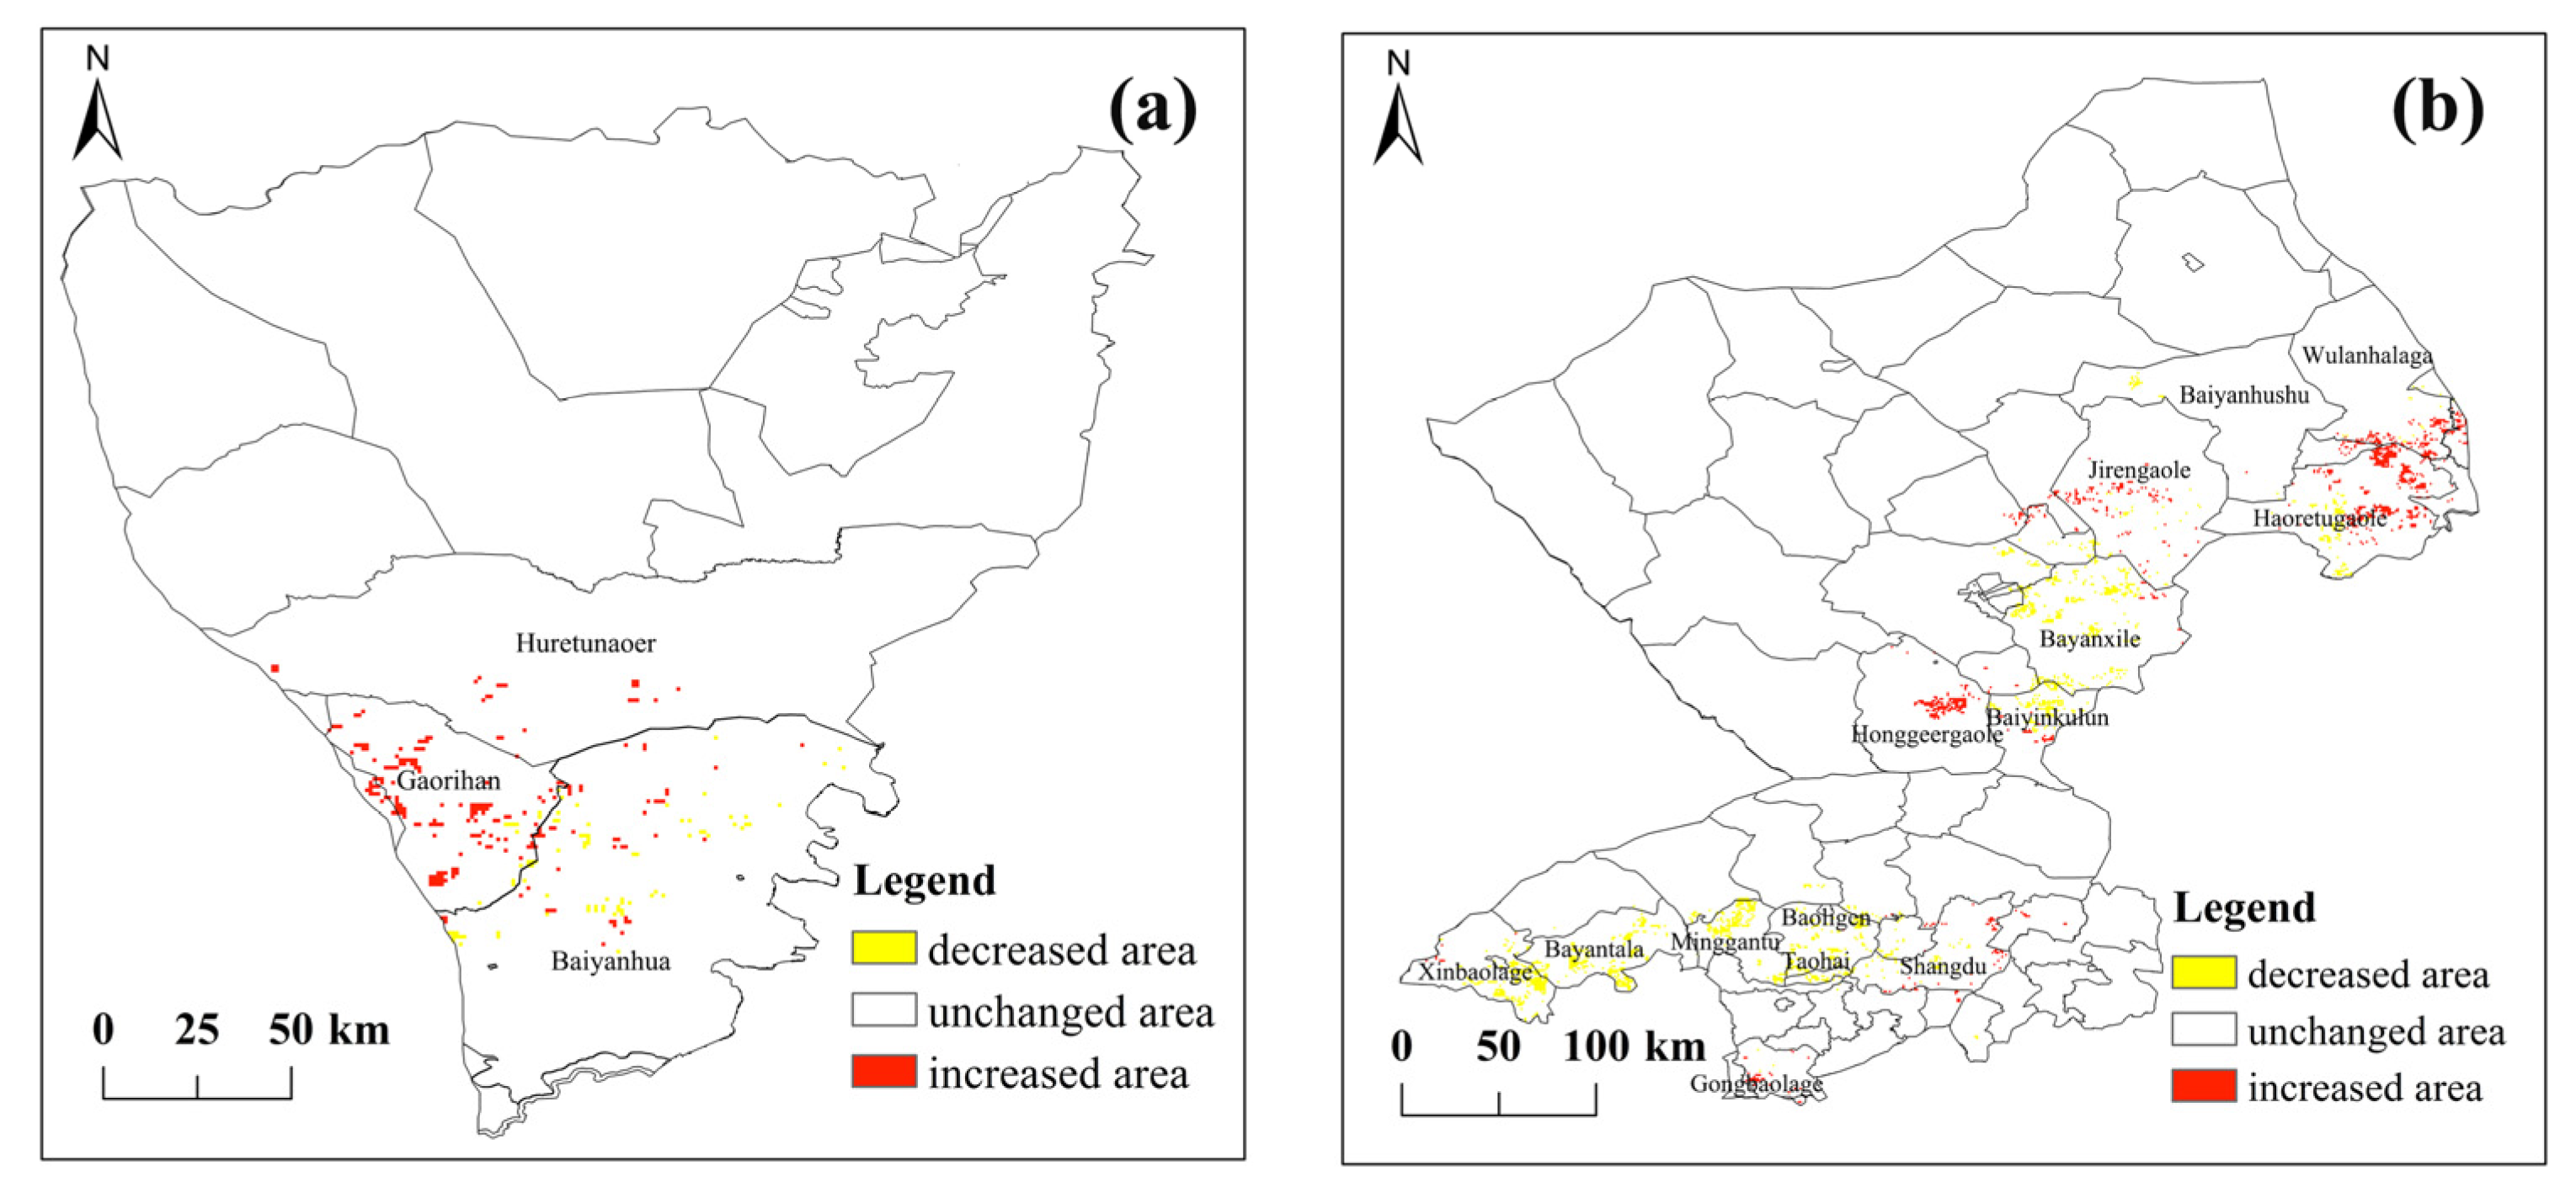
3.1. Spatial Distribution Characteristics of GPHs between Two Steppe Types

This paper analyzed the distributions of GPH in the meadow and typical steppes from 2018 to 2022 based on the history of grasshopper occurrence points and the MaxEnt model. Moreover, we applied the omission curve and ROC to validate the model’s accuracy. The results (Figure 3) demonstrated that the meadow steppe results’ AUC ranged from 0.978 to 0.911, and the typical steppe results’ AUC ranged from 0.856 to 0.888. The model accuracies all exceeded 0.8 in the two different steppe types, meaning that MaxEnt performed well when simulating the GPHs of Xilingol.
The GPH distribution in the meadow steppe from 2018 to 2022 is shown in Figure 4. The most suitable and moderately suitable areas were distributed mainly in the southern part of the meadow steppe, located in the towns of Gaorihan, Baiyanhua, and Huretunaoer. The less suitable habitats were distributed mainly in the middle and northern parts of the meadow steppe. This study concluded that the suitability level gradually decreases from south to north. By combining the areas corresponding to the suitability level statistics (Table 2), we found that the area of less suitable habitat was the largest except in 2022. The moderately suitable habitat accounted for the largest area in 2022. The areal proportion of the most suitable habitat was less than 1%.
From 2018 to 2019, more regions became suitable for grasshopper breeding and living. The moderately suitable habitat area increased by 728 km2, mainly in eastern Gaorihan and central Baiyanhua. The most suitable region also increased by 57 km2 and was located in the town of Baiyanhua. The moderately suitable area was located in the western part of Gaorihan. The middle of Baiyanhua almost turned into a less suitable area from 2019 to 2020. However, in the same year, eastern Baiyanhua became most suitable for grasshoppers. In 2021, the town of Gaorihan possessed the largest moderate and most suitable area for grasshopper breeding and living. Additionally, in the southern part of Huretunaoer, the less suitable region also transformed into a less suitable region. In 2022, the moderately suitable region increased by 405 km2. The increased area was in central Baiyanhua town. The most suitable area decreased in the town of Gaorihan. However, it was increased on the border of Gaorihan and Baiyanhua. Based on the above analysis, we can conclude that the towns of Gaorihan and Baiyanhua are more suitable for grasshopper breeding and living than the other towns, especially the western part of Gaorihan and the central Baiyanhua.
The GPH extraction results in the typical steppe region are shown in Figure 5. The most suitable and moderately suitable areas are scattered mainly in the eastern and southern parts of the typical steppe. The northern and western parts possessed habitats that were less suitable for grasshopper breeding and living. In summary, the suitability level of the typical grasslands demonstrated a decreasing trend from east to west. Furthermore, according to the statistical results, we found that the area of the most suitable regions changed little and accounted for the lowest proportion from 2018 to 2022. The town of Gongbaolage possessed the most suitable areas from 2018 to 2022, and its moderately suitable area was the largest in 2019 and the smallest in 2022, with the largest area of the steppe being less suitable for grasshoppers.
From 2018 to 2019, the area of moderately suitable habitat increased by 3631 km2, which is distributed mainly in the southern part of Jirengaole and the northern part of Baiyanxile. In the same year, the southern of Haoretugaole became more suitable for grasshoppers, and the town of Gadabu also possessed an enlarged moderately suitable area. For the most suitable area, the border of Bayanhushu and Haoletugaole increased considerably. In 2020, the study area had less moderately suitable areas than in 2019, and the changes occurred mainly in Jirengaole, Baiyanxile, and Baiyinkulun. In 2021, the south of Jiregaole, Bayanhushu, and Wulanhalage became more suitable for grasshoppers. Meanwhile, the town of Shangdu had a smaller moderately suitable area than in 2020. From 2021 to 2022, the most suitable region in the west of Honggeergaole increased considerably. Furthermore, the area of the most suitable habitats in Hongbaolage also increased. In the same year, the moderately suitable area in the towns of Baoligentaohai and Jirengaole decreased compared to the previous year.
The less suitable areas are unsuitable or less suitable for grasshopper activities. The moderately and most suitable areas represent the areas that are suitable for grasshopper breeding and living, where there is a relatively great probability for grasshoppers to occur. Therefore, we should pay more attention to the moderate and most suitable areas. Table 2 shows that the proportions of moderate and most suitable areas in the meadow steppe range from 1.35% to 5.17%. The same areas have proportions of 7.23% to 11.26% in the typical steppe. The most suitable and moderately suitable areas in the typical steppe region accounted for greater proportions than those in the meadow steppe region, so we can conclude that the typical steppe is more suitable for grasshopper breeding meaning the grasshoppers can more easily infest in the typical steppes than in the meadow steppes.

3.2. Temporal Variation Characteristics of GPH

To reveal the temporal variation trends in the grasshopper suitability index in the meadow and typical steppes, the suitability index changes corresponding to each pixel were analyzed, and the significance of these changes was tested according to the F value from 2018 to 2022. Only the trends that passed the F test had significant p values, meaning that the trend of the suitability index changed. The p value selected for this study was 0.1, meaning that at this level, the trend at least marginally significantly changed.
From Figure 6a we can see that most of the meadow steppe region underwent no change trends. The changed regions were located mainly in the middle and southern parts of this steppe type. Furthermore, the changes were all located in the towns of Haorenaoer, Gaorihan, and Baiyanhua. The areas corresponding to increasing trends were located mainly in Haorenaoer and Gaorihan, so these regions were more suitable for grasshopper breeding and living from 2018 to 2022. The decreased area was located in the town of Baiyanhua, indicating that this area became less suitable for grasshopper infestations.
The temporal variation trend of the grasshopper suitability index in the typical steppe region is shown in Figure 6b. Compared to the results obtained for the meadow steppe, there were more changed areas in the typical steppe. In addition, the changing area in the typical steppe mainly exhibited decreasing trends. The towns in the southern part of the typical steppe mainly had a decreasing trend, such as Xinbaolage, Bayantala, Minggantu, and Baoligentaohai. Additionally, the southern part of Haoretugaole, the northern part of Baiyanxile, and Baiyinkulun also had a decreasing trend, and the borders of Wulanhalage and Haoretugaole had more suitable areas than in the past. Furthermore, the towns of Honggeergaole and Jirengaole also had increasing trends.
In summary, the towns of Gaorihan, Honggeergaole, Baiyanhua, Jirengaole, Haoretugaole, and Wuanhalage were the regions that became more suitable for grasshopper infestation. These findings should be given more attention in future monitoring and early warning research.

3.3. Main Influencing Factors in the Meadow and Typical Steppes

To avoid strong collinearity between the variables, we retained the variables with Pearson’s correlation coefficients smaller than 0.8 (Figure 7). Finally, 14 habitat factors including AMeanLST, aspect, EMinLST, EPre, ESI, EST, elevation, NSI, NAB, NMinLST, NPre, soil type, slope, and vegtype were selected. These factors contained four habitat categories including meteorology, vegetation, soil, and topography. Additionally, they represented the important factors during each grasshopper’s developmental period, thereby reflecting the grasshopper’s growth and breeding more explicitly.
This paper regarded the factors with cumulative contributions exceeding 80% [49] as the main influence factors. Our estimations of the relative percentage contributions of all the environmental variables (Figure 8) demonstrated that the main influence factors differed between the two steppe types and in different years. However, the same factors were also found to play significant roles in the occurrence of grasshoppers.
In the meadow steppe, the EST, vegetation type, soil type, and aspect were the vital factors that affected the GPH distribution in five years of study. EST was the most vital factor in 2021 and 2022 with contributions of 36% and 32.8%, respectively. The vegetation type was the second contributing factor in 2018 and 2022. Furthermore, it was among the top three contributing factors in five years. The soil type also has the second-largest contribution in 2021 and was the fifth-largest contribution except in 2018. NPre had a crucial contribution in 2021 and it is the most powerful contributing factor in 2019. Elevation also had significant impacts in 2018, 2019, and 2020, with the highest contribution in 2018 and the second highest contribution in 2019. AMeanLST, EMinLST, ESI, and EPre had impacts in the years 2019, 2018, 2020, and 2022, respectively. Especially in the year 2020, ESI contributed the most.
In the typical steppe, the vegetation type, EST, soil type, and NPre were the vital factors affecting the GPH distribution in the five years of study. Moreover, the vegetation type had the second-highest contribution in 2018, 2019, 2020, and 2021. EST contributed the most in 2021. NPre was located at the top in 2018 and 2020. EPre and slope also had important contributions in 2021 and 2022, respectively. Furthermore, Epre also had the highest contributions in 2019 and 2022. Elevation was a significant factor in 2018, 2020, and 2022. Compared to the factor’s contributions in the meadow and typical steppes, we found that the EST, vegetation type, and soil type were vital factors in both the meadow and typical steppes from 2018 to 2022. NPre was also considered an important factor in the two steppe types because the only year it did not have a significant impact in the meadow steppe was 2021. However, there were also differences between the two steppe types. Among topographic factors, the aspect played a more important role in the meadow steppe, whereas slope had a more significant impact in the typical steppe. Among meteorology factors, EPre had a greater contribution to the typical steppe.

4. Discussion

4.1. Effeciency of the MaxEnt Model Coupled with Remote Sensing Technology

Grasshopper plagues are among the most important disasters in China and pose a great threat to agriculture and husbandry every year in northern China. However, the vast grassland areas in northern China have spatial heterogeneities in their meteorological, topographic, soil type, and grassland type conditions. These variabilities make it difficult to research the extraction of GPHs in such vast areas. Therefore, compared to traditional research methods based on meteorological data [50] we have extracted the habitat factors based on remote sensing at a high spatiotemporal resolution. Subsequently, we combined pest phenology, machine learning, remote sensing, and GIS technologies to extract the GPHs. In addition, the model comprehensively considered 20 environmental variables corresponding to four categories (topography, meteorological, vegetation, and soil) and three grasshopper developmental stages based on a large number of previous studies, statistical results, and theoretical analysis. However, most of the previous studies have considered just a single factor (such as meteorological factors) or a small number of factors affecting the suitability of grasshoppers [51,52].
Here, we achieved the goals of extracting the GPHs in two different steppe types, analyzing the spatiotemporal distribution of GPHs from 2018 to 2022, and exploring the roles of the main influencing factors in the two steppe types. MaxEnt is a mature model used to evaluate grasshopper distributions and detect the main environmental factors affecting those distributions. Remote sensing data provided meaningful contributions to the modeling process and to explaining the GPHs. The main contributions of remote sensing data were the improvements in the spatial and temporal resolutions, the expansion of the spatial scale, and the provision of directly related environmental data. The tests of the species–environmental matching models showed that the predictions derived from remote sensing data had reasonable distribution patterns and provided confidence for modeling GPHs.
The extraction of GPHs and analysis of their spatiotemporal distribution can guide for grassland pest control stations to control and manage grasshopper plagues. First, compared to traditional empirical grasshopper survey methods based on artificial point fields and surveys conducted by the local grassland protection staff, the use of remote sensing technology to dynamically extract GPH data has the characteristics of large areal consideration, high efficiency, and high accuracy. The GPH monitoring results can be used for quickly finding the grasshopper infestation risk regions to guide field survey investigators in identifying locations of grasshopper reproduction. Chemical pesticide treatments can then be guided and optimized by concentrating on regions with high grasshopper infestation risks. In addition, analyses of spatiotemporal characteristics could provide more accurate locations of the areas that are most suitable for grasshopper breeding. Furthermore, the combination of the GPH extraction results and the spatiotemporal distribution of GPHs can provide better theoretical guidance for the early prevention of grasshopper plagues, which is critical for identifying key grasshopper control areas and detecting new grasshopper-suitable habitats in time.

4.2. Reasons for the Main Influencing Factors Differing between the Two Steppe Types

Inner Mongolia has a vast grassland area that includes various steppe types. These different steppes are influenced by multiple environmental factors. Previous studies have been conducted to explore the contributions of these different factors to grasshoppers in various steppe types or years [13,48]. However, past studies mainly focused on one-year or single steppe type. In this study, we clarified the main influencing factors in two steppe types from 2018 to 2022 and found that the main influencing factors differed between the two steppes. However, the EST, vegetation type, and soil type were the main influencing factors with important contributions in both the meadow and typical steppes from 2018 to 2022. NPre played an important role in two steppes except 2021. Whether in the meadow steppe or typical steppe, the grasshoppers live in the soil as eggs for almost half of a year. The soil temperature in the egg stage is crucial for grasshoppers because of their long living times and the effect of the temperature on the egg mortality rate. When the temperature falls below −20 °C, the eggs freeze to death [53]. Vegetation is the main food source and habitat for grasshoppers, so they are likely to choose places that have adequate aboveground biomass and vegetation conditions that favor growth and breeding. Grasshopper spawning, overwintering, and hatching are all related to the soil type [54,55,56]. An adequate soil type can promote the activity of grasshoppers. This paper also found that the aspect played a more important role in the meadow steppe region, whereas the slope had a more significant impact in the typical steppe region. Coupled with recorded grasshopper occurrence points, we discovered that it is easier for grasshoppers to live in low-slope areas than high-slope areas. The slopes in the typical steppe region are lower than those in the meadow steppe region, so the typical steppe region is more suitable for grasshoppers.
Detecting the key factors in the two analyzed steppe types and various years is of great significance for identifying potential outbreak areas and ensuring food security. Finally, by clarifying the key factors in the two steppe types, the stakeholders could pay more attention to the specific steppe types when the main influencing factors are suitable to accomplish the precise control of grasshoppers and ensure food security.
In the future, each species’ potential habitat distribution and its main influencing factors should be analyzed. Additionally, other machine learning methods such as random forest, support vector machine, or training machine learning models, can be applied to monitor grasshoppers and other pests’ habitats.

5. Conclusions

In this study, we extracted the GPHs based on multisource habitat factors and the MaxEnt model, analyzed the spatiotemporal distribution of GPHs from 2018 to 2022, and detected the key factors in two steppe types. The results demonstrated that all of the extraction results’ AUCs were higher than 0.8 indicating that the MaxEnt model exhibited good performance in extracting the GPHs. The most suitable and moderately suitable regions were distributed mainly in the southern part of the meadow steppe and scattered in the eastern and southern parts of the typical steppe. Most areas in the towns of Gaorihan, Honggeergaole, and Jirengaole, as well as the borders of Wulanhalage and Haoretugaole became more suitable for grasshoppers. This paper also found that the soil temperature in the egg stage, the vegetation type, the soil type, and precipitation in the nymph stage are significant factors both in the meadow and typical steppe. The slope and precipitation during the egg stage played highly important roles in the typical steppe, whereas the aspect provided a greater contribution in the meadow steppe. Our research provides a methodological tool for the efficient prevention and control of grasshopper damage and serves as a basis for decision making to ensure national ecological environmental security and the sustainable development of husbandry.

Author Contributions

Conceptualization, J.G. and Y.D.; methodology, J.G., and L.L.; software, J.G.; validation, B.D., W.H., and B.Z.; formal analysis, C.D.; investigation, J.G.; resources, H.Y.; data curation, K.W.; writing—original draft preparation, J.G.; writing—review and editing, J.G.; visualization, Z.H.; supervision, Y.H. and N.W.; project administration, M.Z.; funding acquisition, W.H. All authors have read and agreed to the published version of the manuscript.

Funding

The work was supported by the National Key Research and Development Program of China (Grant No. 2022YFD1400503), Chinese Academy of Sciences (Grant No. 183611KYSB20200080), National Natural Science Foundation of China (Grant No.42071320), and Critical Technology Project of Inner Mongolia (Grant No. 2021ZD0011-2-4).

Data Availability Statement

The Elevation is available from Geospatial Data Cloud (https://www.gscloud.cn/, accessed on 16 February 2022; the Land Surface Temperature is available at (https://developers.google.cn/earth-engine/datasets/catalog/MODIS_006_MOD11A1/, accessed on 5 June 2022; the precipitation is available at (https://www.nasa.gov/mission_pages/GPM/, accessed on 5 July 2022; the soil temperature is available at https://cds.climate.copernicus.eu/portfolio/dataset/reanalysis-era5-land/, accessed on 19 July 2022; the vegetation type is available at (https://www.resdc.cn/, accessed on 1 August 2022; the above biomass is available at https://developers.google.cn/earth-engine/datasets/catalog/MODIS_006_MOD13A2/, accessed on 11 August 2022; the soil type is available at https://data.tpdc.ac.cn/, accessed on 15 August 2022; the soil salinity index is available at https://developers.google.cn/earth-engine/datasets/catalog/MODIS_006_MOD09A1/, accessed on 15 August 2022.

Acknowledgments

The authors would like to sincerely thank Binxiang Qian for his valuable guidance. We are grateful to the academic editor and reviewers for their insightful comments, which greatly helped us greatly improve the quality of this manuscript.

Conflicts of Interest

The authors declare no conflict of interest.

References

  1. Olfert, O.; Weiss, R.M.; Giffen, D.; Vankosky, M.A. Modeling Ecological Dynamics of a Major Agricultural Pest Insect (Melanoplus sanguinipes; Orthoptera: Acrididae): A Cohort-Based Approach Incorporating the Effects of Weather on Grasshopper Development and Abundance. J. Econ. Entomol. 2021, 114, 122–130. [Google Scholar] [CrossRef]
  2. Zhang, L.; Lecoq, M.; Latchininsky, A.; Hunter, D. Locust and Grasshopper Management. Annu. Rev. Entomol. 2019, 64, 15–34. [Google Scholar] [CrossRef]
  3. Onsager, J.A.; Olfert, O. What Tools have Potential for Pets Management of Acrididae? A North American Perspective; Lockwood, J.A., Latchininsky, A.V., Sergee, M.J., Eds.; Grasshoppers and Grassland Health; Kluwer Academic Publishers: Dordrecht, The Netherlands, 2000. [Google Scholar]
  4. Belovsky, G.E.; Slade, J.B. Grasshoppers affect grassland ecosystem functioning: Spatial and temporal variation. Basic Appl. Ecol. 2018, 26, 24–34. [Google Scholar] [CrossRef]
  5. Geng, Y.; Zhao, L.L.; Dong, Y.Y.; Huang, W.J.; Shi, Y.; Ren, Y.; Ren, B.Y. Migratory Locust Habitat Analysis With PB-AHP Model Using Time-Series Satellite Images. IEEE Access 2020, 8, 166813–166823. [Google Scholar] [CrossRef]
  6. Guo, J.; Zhao, L.L.; Huang, W.J.; Dong, Y.Y.; Geng, Y. Study on the Forming Mechanism of the High-Density Spot of Locust Coupled with Habitat Dynamic Changes and Meteorological Conditions Based on Time-Series Remote Sensing Images. Agronomy 2022, 12, 1610. [Google Scholar] [CrossRef]
  7. Zhao, L.L.; Huang, W.J.; Chen, J.S.; Dong, Y.Y.; Ren, B.Y.; Geng, Y. Land use/cover changes in the Oriental migratory locust area of China: Implications for ecological control and monitoring of locust area. Agric. Ecosyst. Environ. 2020, 303, 107110. [Google Scholar] [CrossRef]
  8. Wang, D.L.; Nkurunziza, V.; Barber, N.A.; Zhu, H.; Wang, J.T. Introduced ecological engineers drive behavioral changes of grasshoppers, consequently linking to its abundance in two grassland plant communities. Community Ecol. 2021, 195, 1007–1018. [Google Scholar]
  9. Helbing, F.; Fartmann, T.; Löffler, F.; Poniatowski, D. Effects of local climate, landscape structure and habitat quality on leafhopper assemblages of acidic grasslands. Agric. Ecosyst. Environ. 2017, 246, 94–101. [Google Scholar] [CrossRef]
  10. Wu, T.j.; Hao, S.G.; Kang, L. Effects of Soil Temperature and Moisture on the Development and Survival of Grasshopper Eggs in Inner Mongolian Grasslands. Front. Ecol. Evol. 2021, 9, 727911. [Google Scholar] [CrossRef]
  11. Poniatowski, D.; Stuhldreher, G.; Löffler, F.; Fartmann, T. Patch occupancy of grassland specialists: Habitat quality matters more than habitat connectivity. Biol. Conserv. 2018, 225, 237–244. [Google Scholar] [CrossRef]
  12. Platts, P.J.; Mason, S.C.; Palmer, G.; Hill, J.K.; Oliver, T.H.; Powney, G.D.; Fox, R.; Thomas, C.D. Habitat availability explains variation in climate-driven range shifts across multiple taxonomic groups. Sci. Rep. 2019, 9, 15039. [Google Scholar] [CrossRef] [Green Version]
  13. Lu, L.H.; Kong, W.P.; Eerdengqimuge; Ye, H.C.; Sun, Z.X.; Wang, N.; Du, B.; Zhou, Y.T.; Wei, J.; Huang, W.J. Detecting Key Factors of Grasshopper Occurrence in Typical Steppe and Meadow Steppe by Integrating Machine Learning Model and Remote Sensing Data. Insects 2022, 13, 894. [Google Scholar] [CrossRef]
  14. Hawryło, P.; Bednarz, B.; Wężyk, P.; Szostak, M. Estimating defoliation of Scots pine stands using machine learning methods and vegetation indices of Sentinel-2. Eur. J. Remote Sens. 2018, 51, 194–204. [Google Scholar] [CrossRef]
  15. Bhattarai, R.; Rahimzadeh-Bajgiran, P.; Weiskittel, A.; MacLean, D.A. Sentinel-2 based prediction of spruce budworm defoliation using red-edge spectral vegetation indices. Remote Sens. Lett. 2020, 11, 777–786. [Google Scholar] [CrossRef]
  16. Tappan, G.G.; Moore, D.G.; Knausenberger, W.I. Monitoring grasshopper and locust habitats in Sahelian Africa using GIS and remote sensing technology†. Int. J. Geogr. Inf. Syst. 1991, 5, 123–135. [Google Scholar] [CrossRef]
  17. Jia, H.M.; Lang, C.B.; Oliva, D.; Song, W.L.; Peng, X.X. Hybrid Grasshopper Optimization Algorithm and Differential Evolution for Multilevel Satellite Image Segmentation. Remote Sens. 2019, 11, 1134. [Google Scholar] [CrossRef]
  18. Klein, I.; Oppelt, N.; Kuenzer, C. Application of Remote Sensing Data for Locust Research and Management—A Review. Insects 2021, 12, 233. [Google Scholar] [CrossRef]
  19. Theron, K.J.; Pryke, J.S.; Samways, M.J. Identifying managerial legacies within conservation corridors using remote sensing and grasshoppers as bioindicators. Ecol. Appl. 2021, 32, e02496. [Google Scholar] [CrossRef]
  20. Phillips, S.J.; Anderson, R.P.; Schapire, R.E. Maximum entropy modeling of species geographic distributions. Ecol. Model. 2006, 190, 231–259. [Google Scholar] [CrossRef]
  21. Graham, C.H.; Elith, J.; Hijmans, R.J.; Guisan, A.; Peterson, A.T.; Loiselle, B.A.; NCEAS Predicting Species Distributions Working Group. The influence of spatial errors in species occurrence data used in distribution models. J. Appl. Ecol. 2008, 45, 239–247. [Google Scholar] [CrossRef]
  22. Kimathi, E.; Tonnang, H.Z.; Subramanian, S.; Cressman, K.; Abdel-Rahman, E.M.; Tesfayohannes, M. Prediction of breeding regions for the desert locust Schistocerca gregaria in East Africa. Sci. Rep. 2020, 10, 11937. [Google Scholar] [CrossRef]
  23. Dai, J.; Roberts, D.A.; Stow, D.A.; An, L.; Hall, S.J.; Yabiku, S.T.; Kyriakidis, P.C. Mapping understory invasive plant species with field and remotely sensed data in Chitwan, Nepal. Remote Sens. Environ. 2020, 250, 112037. [Google Scholar] [CrossRef]
  24. Huang, Y.R.; Dong, Y.Y.; Huang, W.J.; Ren, B.Y.; Deng, Q.; Shi, Y.; Bai, J.; Ren, Y.; Geng, Y.; Ma, H.Q. Overwintering Distribution of Fall Armyworm (Spodoptera frugiperda) in Yunnan, China, and Influencing Environmental Factors. Insects 2020, 11, 805. [Google Scholar] [CrossRef]
  25. Saha, A.; Rahman, S.; Alam, S. Modeling current and future potential distributions of desert locust Schistocerca gregaria (Forskål) under climate change scenarios using MaxEnt. J. Asia-Pac. Biodivers. 2021, 14, 399–409. [Google Scholar] [CrossRef]
  26. Li, L.L.; Zhao, C.Z.; Zhao, X.W.; Wang, D.W.; Li, Y. Pattern of plant communities’ influence to grasshopper abundance distribution in heterogeneous landscapes at the upper reaches of Heihe River, Qilian Mountains, China. Environ. Sci. Pollut. Res. 2022, 29, 13177–13187. [Google Scholar] [CrossRef]
  27. Rafuse, D.J. A MaxEnt Predictive Model for Hunter-Gatherer Sites in the Southern Pampas, Argentina. Open Quat. 2021, 7, 6. [Google Scholar] [CrossRef]
  28. Wysiecki, M.L.; Arturi, M.; Torrusio, S.; Cigliano, M. Influence of weather variables and plant communities on grasshopper density in the Southern Pampas, Argentina. J. Insect Sci. 2011, 11, 109. [Google Scholar]
  29. Matenaar, D.; Bazelet, C.S.; Hochkirch, A. Simple tools for the evaluation of protected areas for the conservation of grasshoppers. Biol. Conserv. 2015, 192, 192–199. [Google Scholar] [CrossRef]
  30. Wang, D.; Ba, L. Ecology of meadow steppe in northeast China. Rangel. J. 2008, 30, 247–254. [Google Scholar] [CrossRef]
  31. Giese, M.; Brueck, H.; Gao, Y.Z.; Lin, S.; Steffens, M.; Kögel-Knabner, I.; Glindemann, T.; Susenbeth, A.; Taube, F.; Butterbach-Bahl, K.; et al. N balance and cycling of Inner Mongolia typical steppe: A comprehensive case study of grazing effects. Ecol. Monogr. 2013, 83, 195–219. [Google Scholar] [CrossRef]
  32. Dai, H.Y.; Wang, H.M. Influence of rainfall events on soil moisture in a typical steppe of Xilingol. Phys. Chem. Earth 2021, 121, 102964. [Google Scholar] [CrossRef]
  33. Zhang, N.; Zhang, H.Y.; He, B.; Gexigeduren; Xin, Z.Y.; Lin, H. Spatiotemporal heterogeneity of the potential occurrence of Oedaleus decorus asiaticus in Inner Mongolia steppe habitats. J. Arid. Environ. 2015, 116, 33–43. [Google Scholar] [CrossRef]
  34. Ma, W.; Fang, J.; Yang, Y.; Mohammat, A. Biomass carbon stocks and their changes in northern China’s grasslands during 1982–2006. Sci. China Life Sci. 2010, 53, 841–850. [Google Scholar] [CrossRef]
  35. Wang, F.; Chen, X.; Luo, G.; Ding, J.L.; Chen, X.F. Detecting soil salinity with arid fraction integrated index and salinity index in feature space using Landsat TM imagery. J. Arid. Land 2013, 5, 340–353. [Google Scholar] [CrossRef]
  36. Gorelick, N.; Hancher, M.; Dixon, M.; Ilyushchenko, S.; Thau, D.; Moore, R. Google Earth Engine: Planetary-scale geospatial analysis for everyone. Remote Sens. Environ. 2017, 202, 18–27. [Google Scholar] [CrossRef]
  37. Hao, S.G.; Kang, L. Postdiapause Development and Hatching Rate of Three Grasshopper Species (Orthoptera: Acrididae) in Inner Mongolia. Environ. Entomol. 2004, 33, 1528–1534. [Google Scholar] [CrossRef]
  38. Bai, Y.M.; Liu, L.; Gao, S.H. Research on Grasshopper Meteorological Monitoring and Prediction; China Meteorological Press: Beijing, China, 2013; p. 160. [Google Scholar]
  39. Powell, L.R.; Berg, A.A.; Johnson, D.L.; Warland, J.S. Relationships of pest grasshopper populations in Alberta, Canada to soil moisture and climate variables. Agric. For. Meteorol. 2007, 144, 73–84. [Google Scholar] [CrossRef]
  40. Ni, S.X.; Wang, J.C.; Jiang, J.J.; Zha, Y. Rangeland Grasshoppers in Relation to Soils in the Qinghai Lake Region, China. Pedosphere 2007, 17, 84–89. [Google Scholar] [CrossRef]
  41. Cronin, J.B.; Hing, R.D.; McNair, P.J. Reliability and Validity of a Linear Position Transducer for Measuring Jump Performance. J. Strength Cond. Res. 2004, 18, 590–593. [Google Scholar]
  42. Xiao, C.; Ye, J.; Esteves, R.M.; Rong, C. Using Spearman’s correlation coefficients for exploratory data analysis on big dataset. Concurr. Comput. Pract. Exp. 2016, 28, 3866–3878. [Google Scholar] [CrossRef]
  43. Bujang, M.A.; Baharum, N. A simplified guide to determination of sample size requirements for estimating the value of intraclass correlation coefficient: A review. Arch. Orofac. Sci. 2017, 12, 1–11. [Google Scholar]
  44. Norris, D. Model thresholds are more important than presence location type: Understanding the distribution of lowland tapir (Tapirus terrestris) in a continuous Atlantic forest of southeast Brazil. Trop. Conserv. Sci. 2014, 7, 529–547. [Google Scholar]
  45. Lombardo, L.; Bachofer, F.; Cama, M.; Märker, M.; Rotigliano, E. Exploiting Maximum Entropy method and ASTER data for assessing debris flow and debris slide susceptibility for the Giampilieri catchment (north-eastern Sicily, Italy). Earth Surf. Process. Landf. 2016, 41, 1776–1789. [Google Scholar] [CrossRef]
  46. Bosso, L.; Russo, D.; Febbraro, M.D.; Cristinzio, G.; Zoina, A. Potential distribution of Xylella fastidiosa in Italy: A maximum entropy mode. Phypotathologia Mediterr. 2016, 55, 62–72. [Google Scholar]
  47. Young, N.; Carter, L.; Evangelista, P. A MaxEnt Model v3.3.3e Tutorial (ArcGIS v10). Natural Resource Ecology Laboratory, Colorado State University and the National Institute of Invasive Species Science: Fort Collins, CO, USA, 2011. [Google Scholar]
  48. Du, B.B.; Wei, J.; Lin, K.J.; Lu, L.H.; Ding, X.L.; Ye, H.C.; Huang, W.J.; Wang, N. Spatial and Temporal Variability of Grassland Grasshopper Habitat Suitability and Its Main Influencing Factors. Remote Sens. 2022, 14, 3910. [Google Scholar] [CrossRef]
  49. Wan, G.-Z.; Wang, L.; Jin, L.; Chen, J. Evaluation of environmental factors affecting the quality of Codonopsis pilosula based on chromatographic fingerprint and MaxEnt model. Ind. Crops Prod. 2021, 170, 113783. [Google Scholar] [CrossRef]
  50. Burt, P.J.; Colvin, J.; Smith, S.M. Remote sensing of rainfall by satellite as an aid to Oedaleus senegalensis (Orthoptera: Acrididae) control in the Sahel. Bull. Entomol. Res. 1995, 85, 455–462. [Google Scholar]
  51. Gage, S.H.; Mukerji, M.K. A Perspective of Grasshopper Population Distribution in Saskatchewan and Interrelationship with Weather. Environ. Entomol. 1977, 6, 469–479. [Google Scholar]
  52. Branson, D.H. Influence of a Large Late Summer Precipitation Event on Food Limitation and Grasshopper Population Dynamics in a Northern Great Plains Grassland. Environ. Entomol. 2008, 37, 686–695. [Google Scholar]
  53. Pang, B.P.; Li, N.; Zhou, X.R. Supercooling Capacity and Cold Hardiness of Band-Winged Grasshopper eggs (Orthoptera: Acrididae). J. Insect Sci. 2014, 14, 289. [Google Scholar] [CrossRef]
  54. Cease, A.J.; Harrison, J.F.; Hao, S.; Niren, D.C.; Zhang, G.; Kang, L.; Elser, J.J. Nutritional imbalance suppresses migratory phenotypes of the Mongolian locust (Oedaleus asiaticus). R. Soc. Open Sci. 2017, 4, 161039. [Google Scholar] [CrossRef]
  55. Geng, Y.; Zhao, L.L.; Huang, W.J.; Dong, Y.Y.; Ma, H.Q.; Guo, A.T.; Ren, Y.; Xing, N.C.; Huang, Y.R.; Sun, R.Q.; et al. A Landscape-Based Habitat Suitability Model (LHS Model) for Oriental Migratory Locust Area Extraction at Large Scales: A Case Study along the Middle and Lower Reaches of the Yellow River. Remote Sens. 2022, 14, 1058. [Google Scholar] [CrossRef]
  56. Groeters, F.R. The adaptive role of facultative embryonic diapause in the grasshopper Caledia captiva (Orthoptera: Acrididae) in southeastern Australia. Ecography 2006, 17, 221–228. [Google Scholar]
Figure 1. (a) Location of the study area; (b) location of the meadow steppe area and grasshopper occurrence points from 2018 to 2022; and (c) location of the typical steppe area and grasshopper occurrence points from 2018 to 2022.
Remotesensing 15 00866 g001
Figure 2. Flowchart of spatiotemporal distribution and main influencing factors of grasshopper potential habitats in two steppe types in Inner Mongolia, China.
Remotesensing 15 00866 g002
Figure 3. The accuracy of the GPH extraction results in meadow steppe and typical steppe from 2018 to 2022.
Remotesensing 15 00866 g003
Figure 4. Spatial distribution of the GPHs in the meadow steppe from 2018 to 2022.
Remotesensing 15 00866 g004
Figure 5. Spatial distribution of the GPHs in the typical steppe from 2018 to 2022.
Remotesensing 15 00866 g005
Figure 6. (a) The trends of the suitability index in meadow grasslands; and (b) typical steppe.
Remotesensing 15 00866 g006
Figure 7. Environmental factor correlation results from 2018 to 2022. (a) 2018; (b) 2019; (c) 2020; (d) 2021; and (e) 2022.
Remotesensing 15 00866 g007
Figure 8. The environmental factors contributions from 2018 to 2022 in the (a) meadow steppe, and (b) typical steppe.
Remotesensing 15 00866 g008
Table 1. Environmental variables influencing grasshoppers in each developmental stage.
CategoryEnvironmental VariablesDetailed
Description of Environmental Variables
Spatial Resolution
TopographyElevation
Slope
Aspect
90 m
90 m
90 m
MeteorologyLand surface temperatureMinimum land surface temperature in the egg stage (EMinLST)
Minimum land surface temperature in the nymph stage (NMinLST)
Mean land surface temperature in the nymph stage(NMeanLST)
Mean land surface temperature in the adult stage(AMeanLST)
1 km
PrecipitationPrecipitation in the egg stage (EPre)
Precipitation in the nymph stage (NPre)
Precipitation in the adult stage (APre)
0.1°
Soil
temperature
Soil temperature in the egg stage (EST)
Soil temperature in the nymph stage (NST)
Soil temperature in the adult stage (AST)
1 km
VegetationVegetation type 1 km
Aboveground biomassAboveground biomass in the nymph stage (NAB)
Aboveground biomass in the adult stage (AAB)
1 km
SoilSoil type 1 km
Soil salinity
index
Soil salinity in the egg stage (ESI)
Soil salinity in the nymph stage (NSI)
Soil salinity in the adult stage (ASI)
1 km
Table 2. Areas of each suitability level in the meadow and typical steppes from 2018 to 2022.
YearArea of Meadow Steppe (km2)Area of Typical Steppe (km2)
Most SuitableModerately SuitableLess SuitableMost SuitableModerately SuitableLess Suitable
20184440732,85310918829110,098
2019101113532,068105512,460106,503
20206469132,54968610,341108,991
2021192121831,89467210,8547491
2022102162231,58011927491111,335
Disclaimer/Publisher’s Note: The statements, opinions and data contained in all publications are solely those of the individual author(s) and contributor(s) and not of MDPI and/or the editor(s). MDPI and/or the editor(s) disclaim responsibility for any injury to people or property resulting from any ideas, methods, instructions or products referred to in the content.

