Article

Remote Sensing Image Change Detection Based on Deep Multi-Scale Multi-Attention Siamese Transformer Network

1
Key Laboratory of Intelligent Perception and Image Understanding of Ministry of Education, School of Artificial Intelligence, Xidian University, Xi’an 710071, China
2
School of Electronic Engineering, Xidian University, Xi’an 710071, China
*
Author to whom correspondence should be addressed.
Remote Sens. 2023, 15(3), 842; https://doi.org/10.3390/rs15030842
Submission received: 9 December 2022 / Revised: 18 January 2023 / Accepted: 1 February 2023 / Published: 2 February 2023
(This article belongs to the Special Issue Remote Sensing and Machine Learning of Signal and Image Processing)

Abstract

:
Change detection is a technique that can observe changes in the surface of the earth dynamically. It is one of the most significant tasks in remote sensing image processing. In the past few years, with the ability of extracting rich deep image features, the deep learning techniques have gained popularity in the field of change detection. In order to obtain obvious image change information, the attention mechanism is added in the decoder and output stage in many deep learning-based methods. Many of these approaches neglect to upgrade the ability of the encoders and the feature extractors to extract the representational features. To resolve this problem, this study proposes a deep multi-scale multi-attention siamese transformer network. A special contextual attention module combining a convolution and self-attention module is introduced into the siamese feature extractor to enhance the global representation ability. A lightly efficient channel attention block is added in the siamese feature extractor to obtain the information interaction among different channels. Furthermore, a multi-scale feature fusion module is proposed to fuse the features from different stages of the siamese feature extractor, and it can detect objects of different sizes and irregularities. To increase the accuracy of the proposed approach, the transformer module is utilized to model the long-range context in two-phase images. The experimental results on the LEVIR-CD and the CCD datasets show the effectiveness of the proposed network.

1. Introduction

Remote sensing images are one of the data sources for observing the earth’s surface [1,2], which is helpful for obtaining rich surface information. The aim of change detection is to compare the scene differences of multiple sets of images, obtained at different times, for the same scene [3]. Change detection has been applied in lots of fields, such as disaster monitoring [4], land cover detection [5], environmental detection [6], source exploration [7] and urban expansion [8].
A variety of change detection approaches are mainly based on the pixel-level statistical methods [9]. Using the independent pixels as detection units, the pixel spectral change information can be analyzed pixel by pixel. The traditional change detection methods can be categorized as the image arithmetic-based methods, the image transformation-based methods and the classification methods. The image arithmetic-based methods classify each pixel in the image directly. These methods usually use the algebraic operation-based methods to calculate the pixel values of images and classify the pixels in the difference map by setting the appropriate thresholds [10]. Jackson et al. proposed an image regression method [11] that calculated the index formed by the linear combination of the image in space and multiplied the target pixel point by point to obtain the changed spectrum. Todd et al. proposed an image quantitative method [12] in which the previous moment image data were divided by the next moment image data. The low ratios indicated areas where land use and land cover had changed. Ferraris et al. proposed a method to deal with different data sources [13], which fused optical images with different spaces and resolutions. Two images were predicted through the degradation of the fused images, and the decision rules were implemented to identify the changes. Although the image arithmetic-based methods are easy and simple, it is difficult to obtain the integral information of the images. The image transformation-based methods suppress the relevant information and highlight the changing information through statistics and the conversion of the images. The main idea is to apply the principal component analysis (PCA) [14] method to analyze and transform the bi-temporal images. Saha et al. proposed a convolutional neural network (CNN)-based network to transform images from the different image sources to the same domain in an unsupervised manner [15]. The change regions were detected through deep feature change vectors. Celik et al. proposed an unsupervised algorithm using the K-means clustering [16] and PCA. The K-means clustering was utilized to obtain the mean feature vectors, the PCA was applied to extract the difference feature vectors of the difference image’s non-overlapping blocks. By calculating the minimum Euclidean distance between the mean feature vectors and the difference feature vectors, the change detection map could be achieved. The image arithmetic-based methods and the image transformation-based methods only consider the spectral information of remote sensing images, where other image features are ignored. Regarding this problem, taxonomy was proposed on the basis of the compound classification method [17] and the post-classification comparison method [18,19], where the prior knowledge was required to train the classifier. The post-classification is the commonly used supervised approach. By using a classifier to classify the bi-temporal images, it can compare the obtained feature maps according to the corresponding positions and then obtain the changed areas. The post-classification method can obtain better change detection results, but the whole process is complex and they are sensitive to the classification results [14] and depend on the performance of the classifier [20].
In recent years, CNN has attracted extensive attention in remote sensing [21,22]. The deep features of images can be effectively extracted by CNN. Its ability to generalize the deep features is conducive to detecting changing areas. Liu et al. proposed LGPNet, which was based on the global and local pyramid change detection network [23]. The global and local feature pyramid modules captured the building objects of different scales from multiple angles, which was helpful for avoiding missing building objects of different sizes and shapes. Daudt et al. proposed two fully convolutional siamese networks [24]. FC-Siam-Conc output the results after fusing the features obtained by skip connections. Through skip connections, the decoder of the FC-Siam-Diff output the absolute value of the difference. They fused the image difference and the image stitching features during training and showed a fast speed and good performance in change detection. Peng et al. proposed the NestedUNet model [25], where the depth monitoring module was used to catch imperceptible changes in complex scenes. Zhang et al. proposed DSIFN, which was a deep siamese supervised fusion network [26]. In DSIFN, the deep features of dual time images were extracted by the VGG net [27], and the change detection branch enhanced the bi-temporal image features obtained from the VGG net by using spatial and channel attention modules. Fang et al. proposed the SNUNet [28], which was based on the NestedUNet and siamese network. A densely connected approach improved the problem of position information loss in deep networks, and a special channel attention module was applied to enhance the image features. Chen et al. proposed the double attentive siamese network (DASNet) [29] by utilizing the attention mechanisms to obtain the long-range correlations of images. The feature representations of the change map were obtained finally. Chen et al. proposed BiT, which was a transformer-based change detection network [30]. The transformer module was used to obtain long-range context in two-phase images. Shi et al. proposed DSAMNet, which was a deeply supervised attention metric network [31]. A deep metric module was used to learn the changing features, and a convolutional attention module was utilized to provide the discriminative features. Hou et al. proposed HRNet, which was based on the high-resolution triplet network and used a triple-input network to learn the two-phase image features [32]. The HRNet designed a dynamic inception module that enriched the multi-scale information of the extracted image features. We proposed a deep siamese network with contextual transformer (DSNCoT) [33], which used a contextual transformer module to enhance the representation power of feature extractors.
Although the deep learning-based techniques can accomplish a good performance in change detection, there are still some problems. With the advancement of imaging technology, remote sensing images have rich semantic information and high resolution. However, many algorithms underutilize the rich semantic information in high resolution images. Moreover, because of the interference of the shooting angles, climatic factors and lighting effects, it is difficult to distinguish spurious changes. The two-phase remote sensing images contain detected objects of different sizes. It is not considered how to identify objects of different sizes correctly in many change detection approaches. In addition, the two-phase optical remote sensing images include both the rich spatial information and the information interaction among the channels. Many algorithms do not make the most of the channel information and ignore the information interaction among the channels. They try to obtain the feature-represented change graphs by introducing the modules with the attention mechanisms after the feature extractor. The abilities to advance the encoder and the feature extractor are ignored.
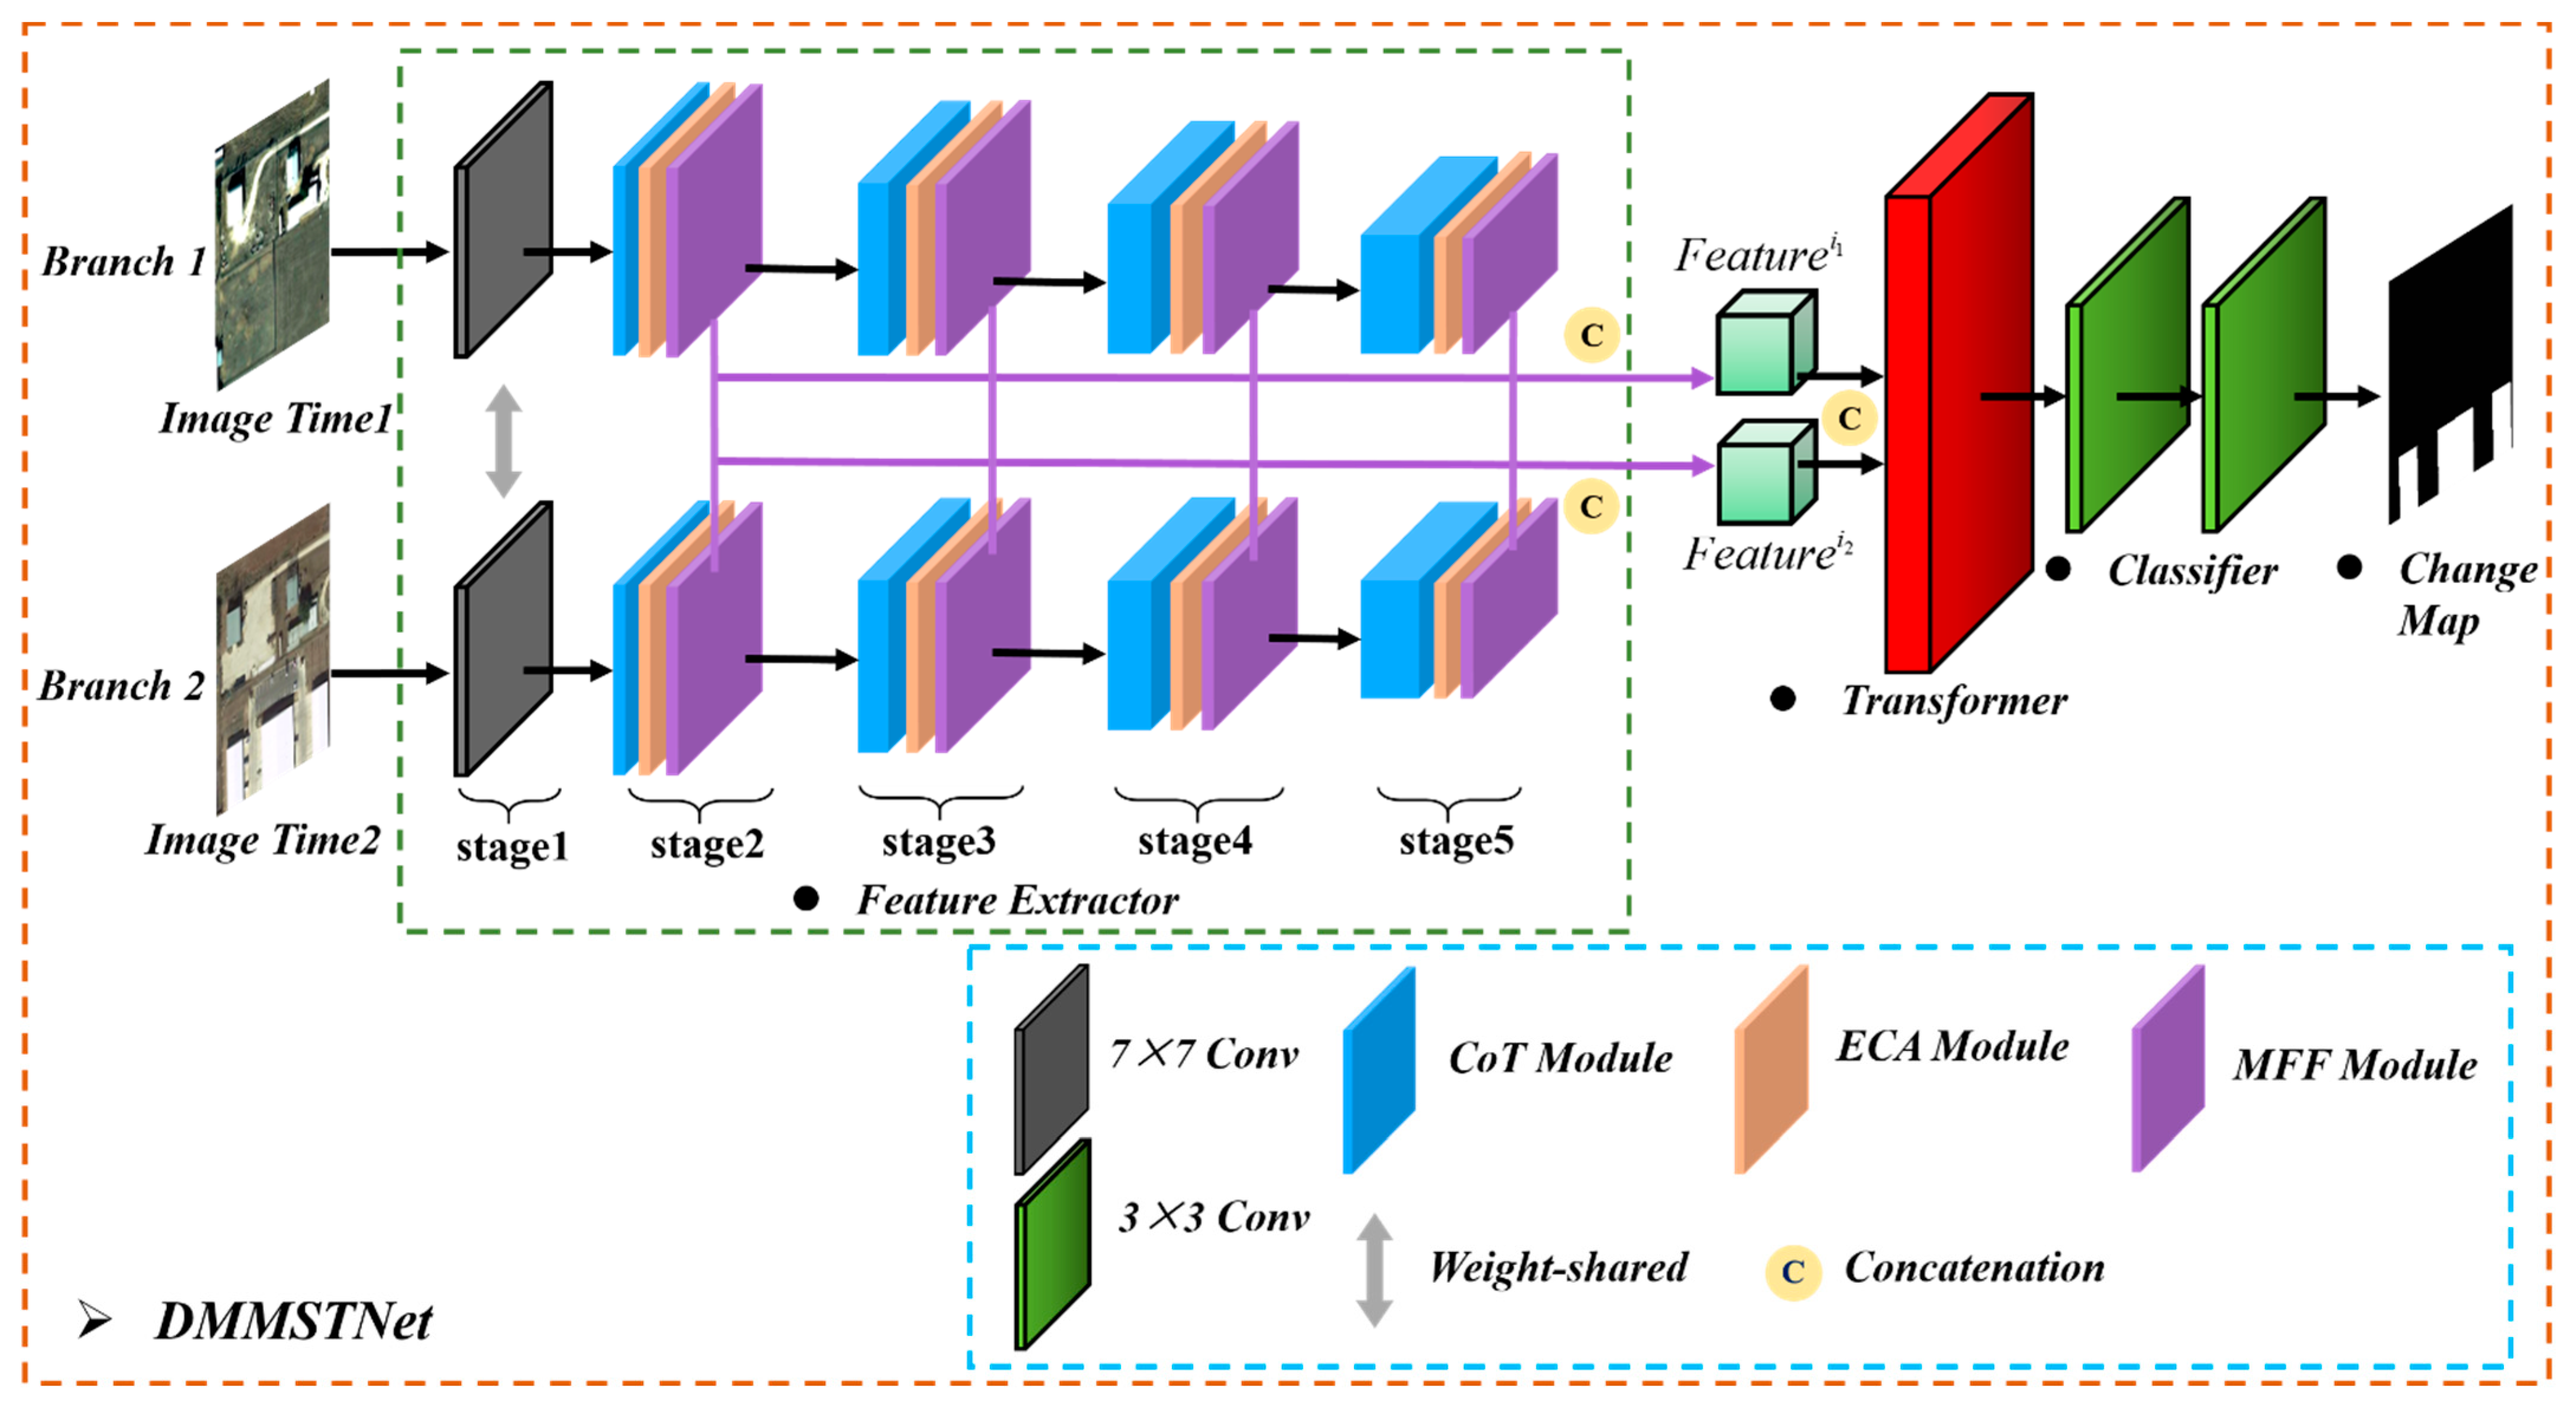
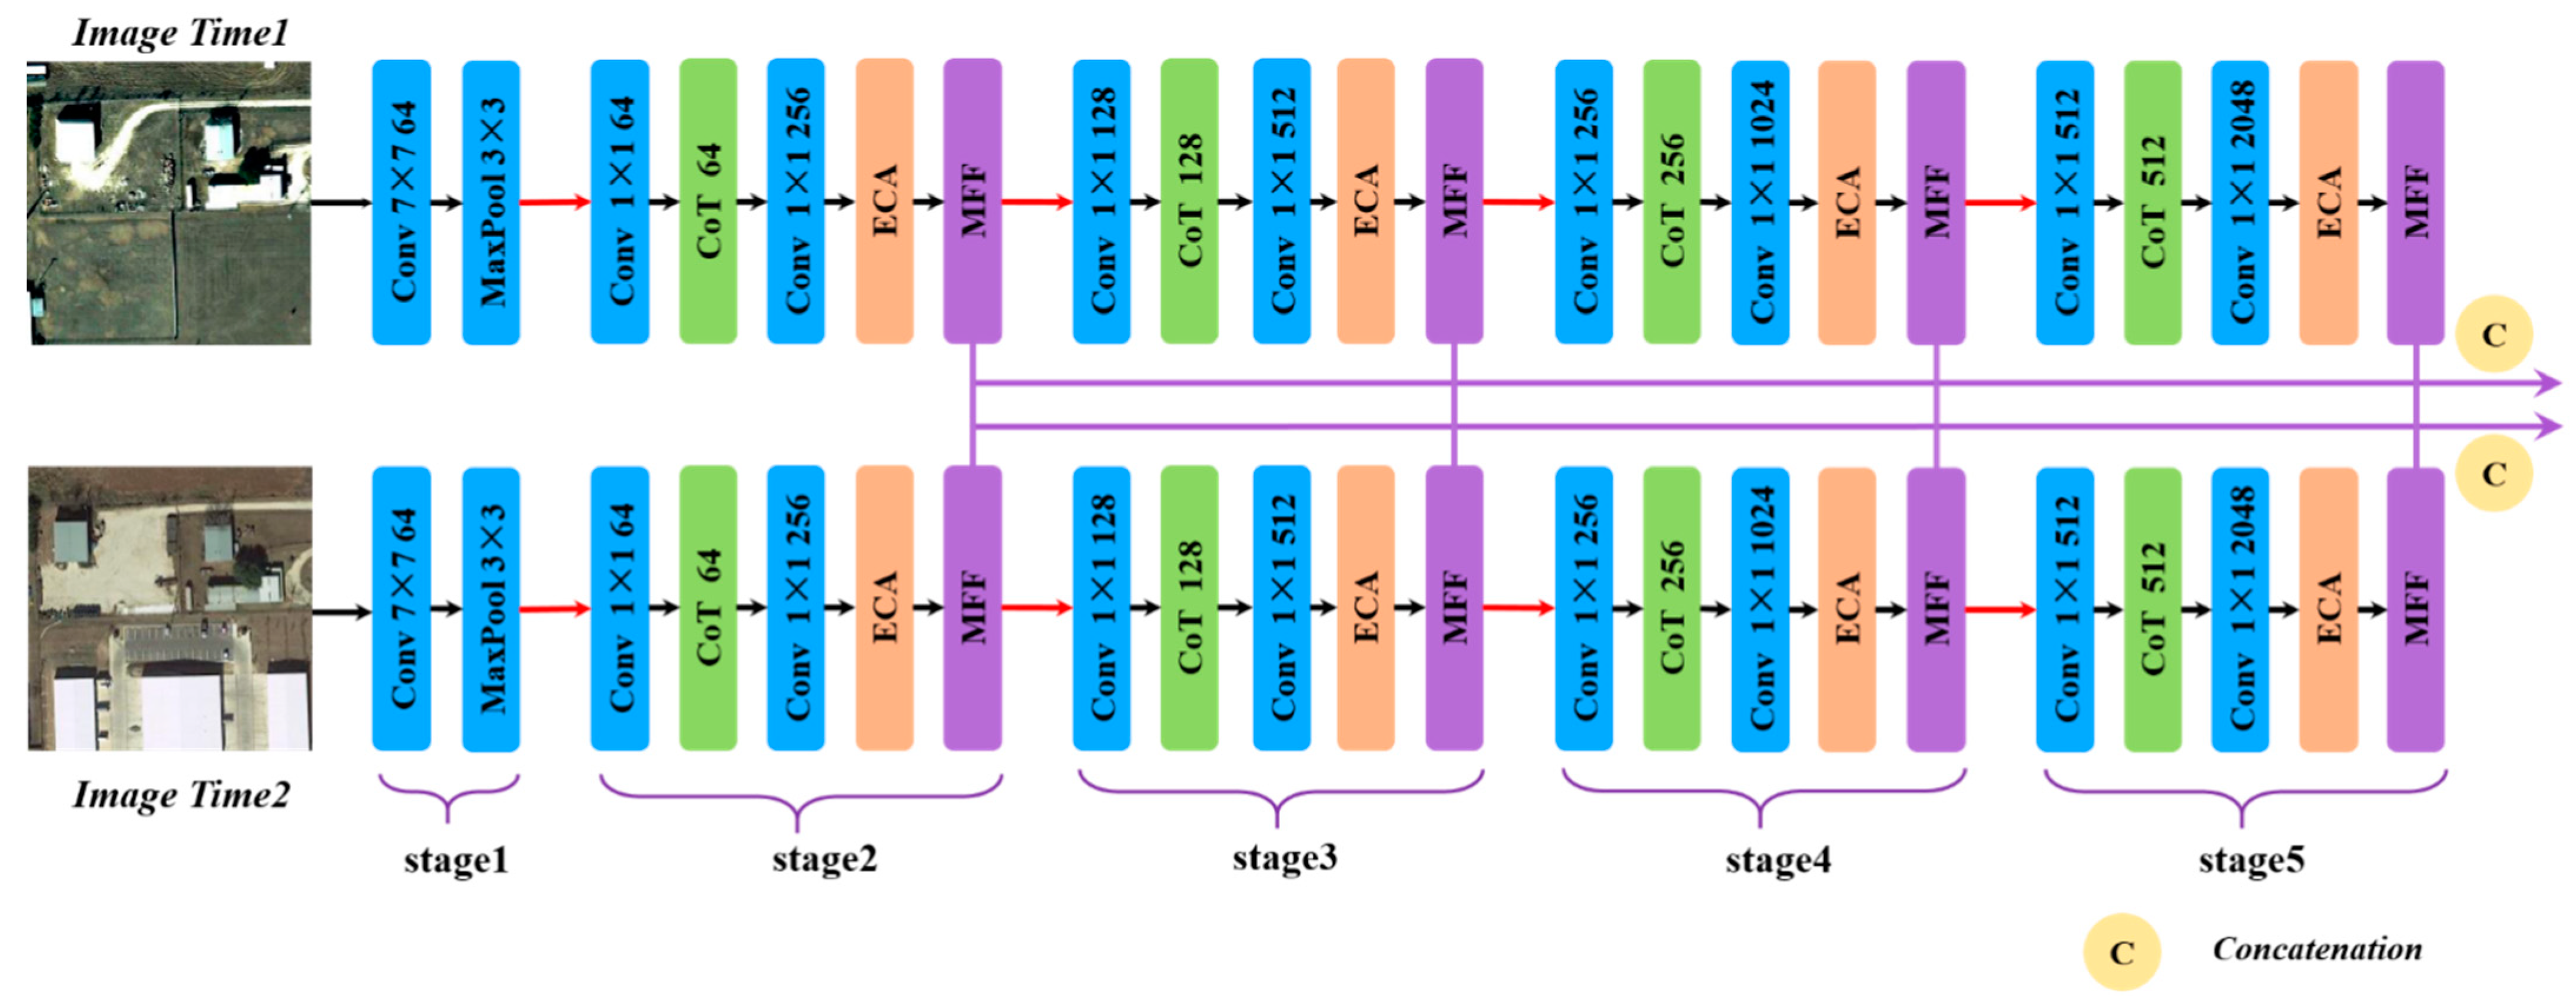
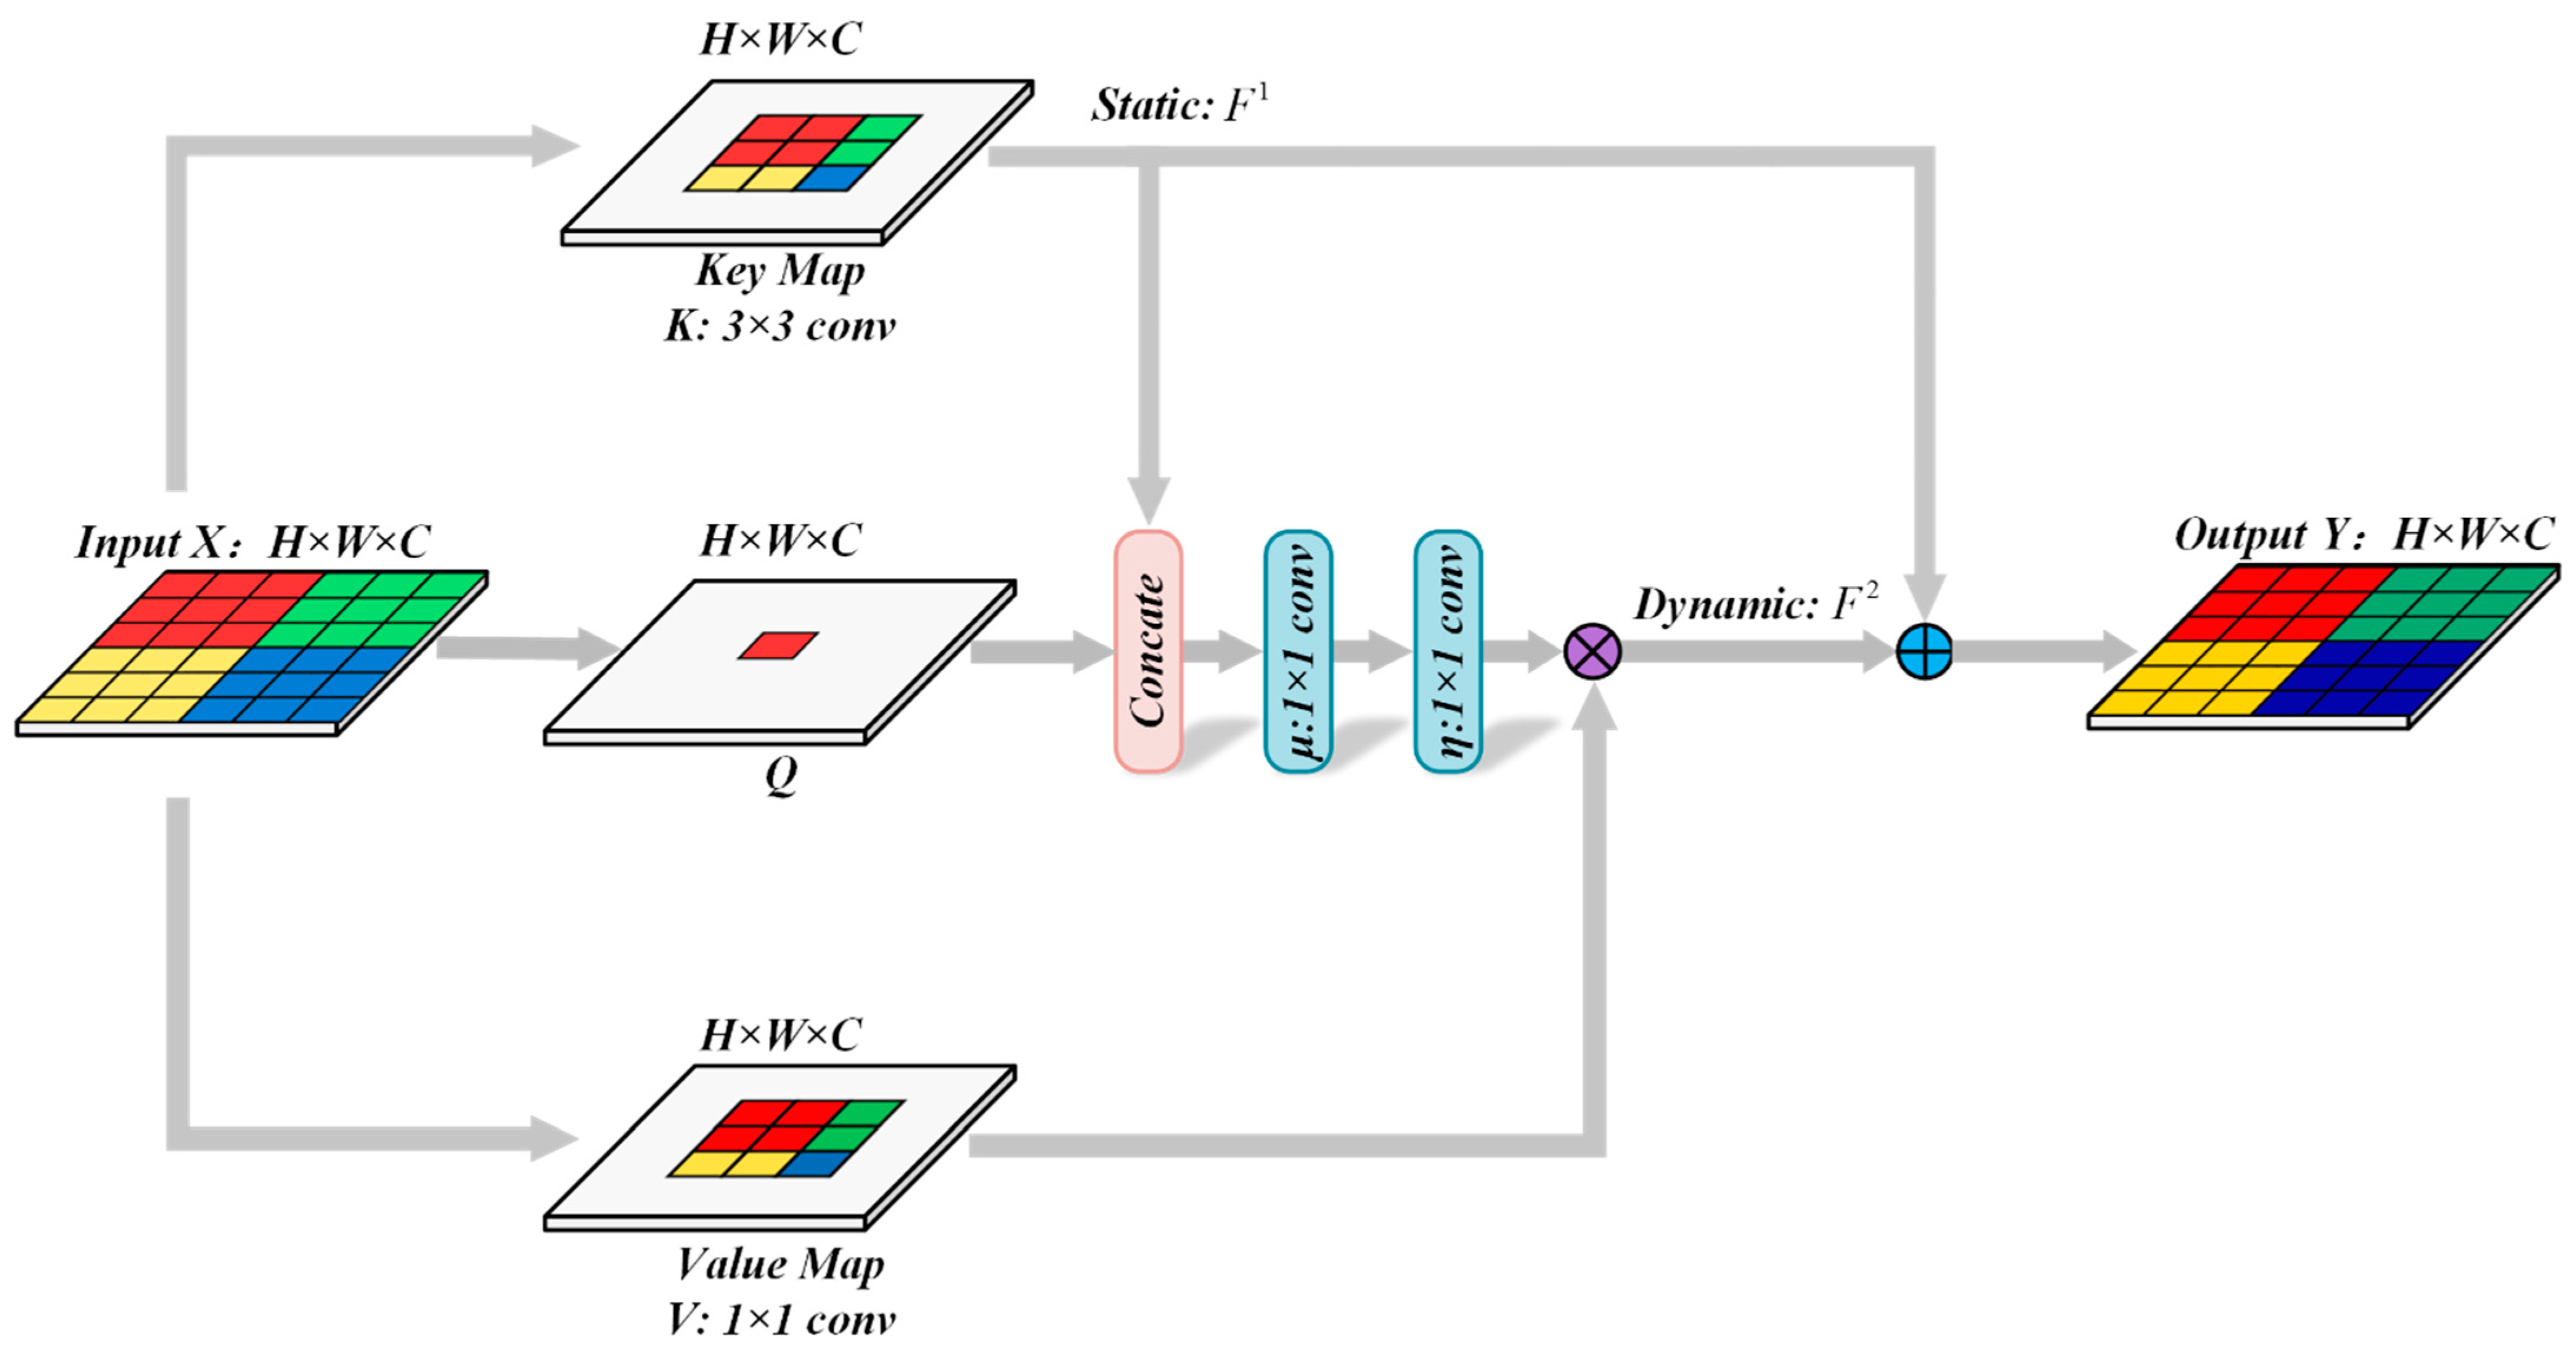
Addressing the above problems, a deep multi-scale multi-attention siamese transformer network (DMMSTNet) is proposed in this study. In the feature extractor, a special context transformer module (CoT) [
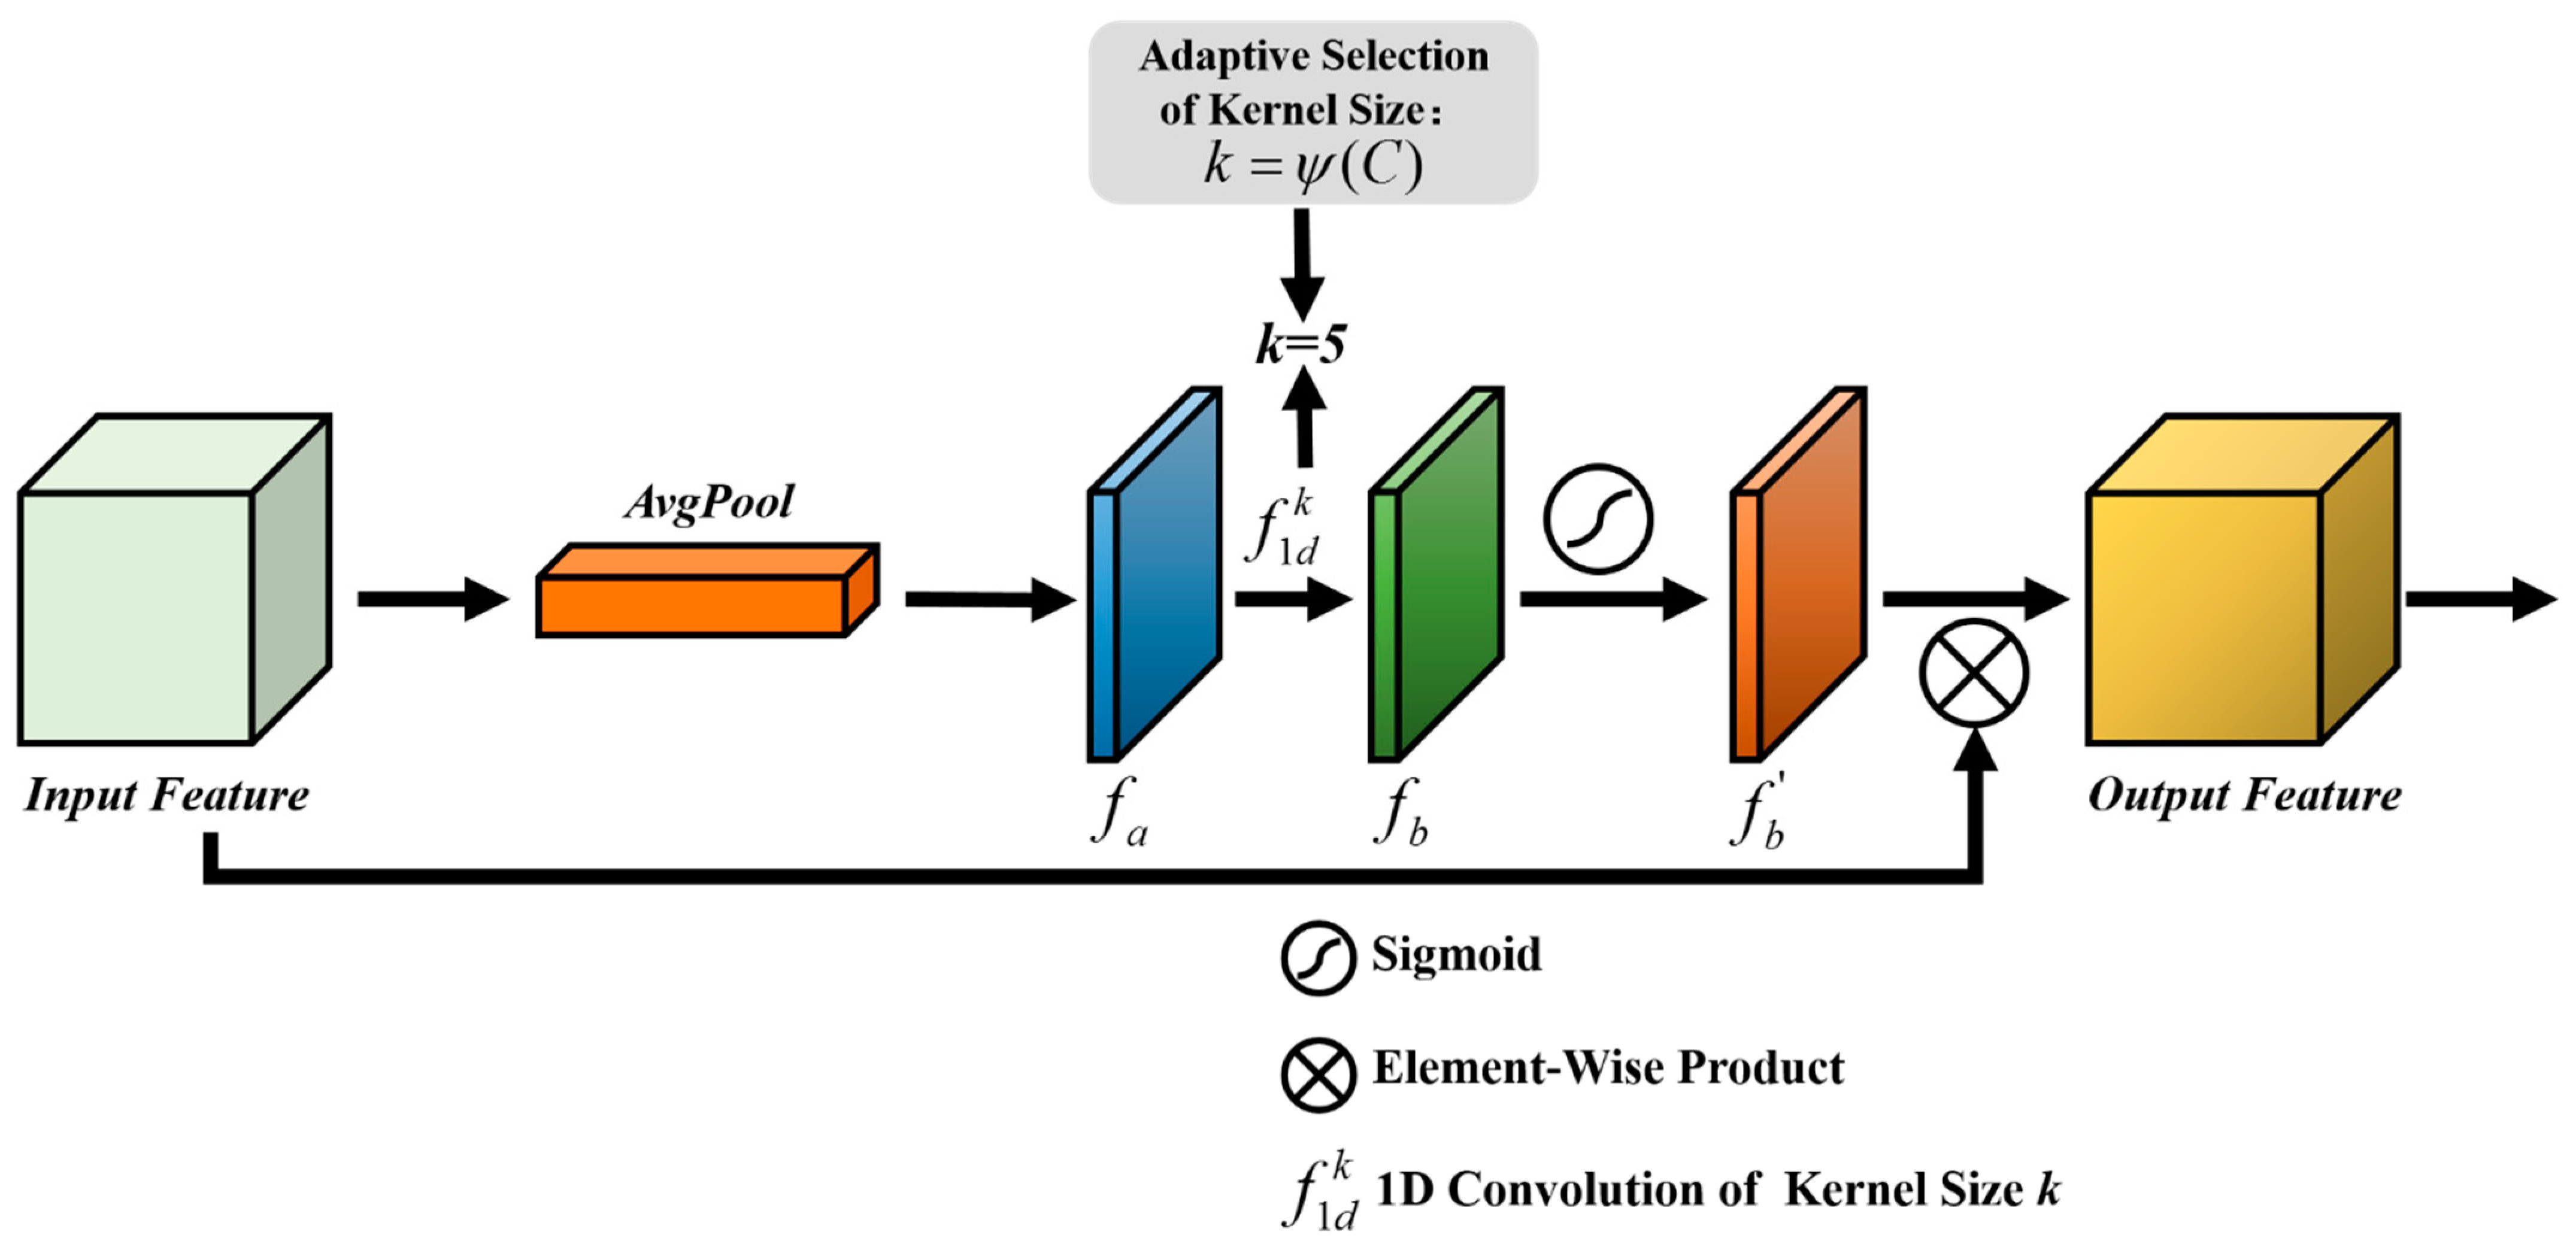
34] is present to concern the global information of the two-phase images. The CoT module combines convolution and self-attention, which can improve the spatial representation ability of the feature extractor. To make the most out of the channel information of the two-phase images, the feature extractor applies a lightly efficient channel attention module (ECA) [35] to improve the performance. The ECA module aggregates the information interaction between the image channels through average pooling and one-dimensional convolution, which can enhance the channel representation ability of the feature extractor. Furthermore, a multi-scale fusion module (MFF) is proposed, which consists of the deformable convolutions with different sizes. These deformable convolution kernels can recognize the detected objects of different sizes. Finally, a transformer [
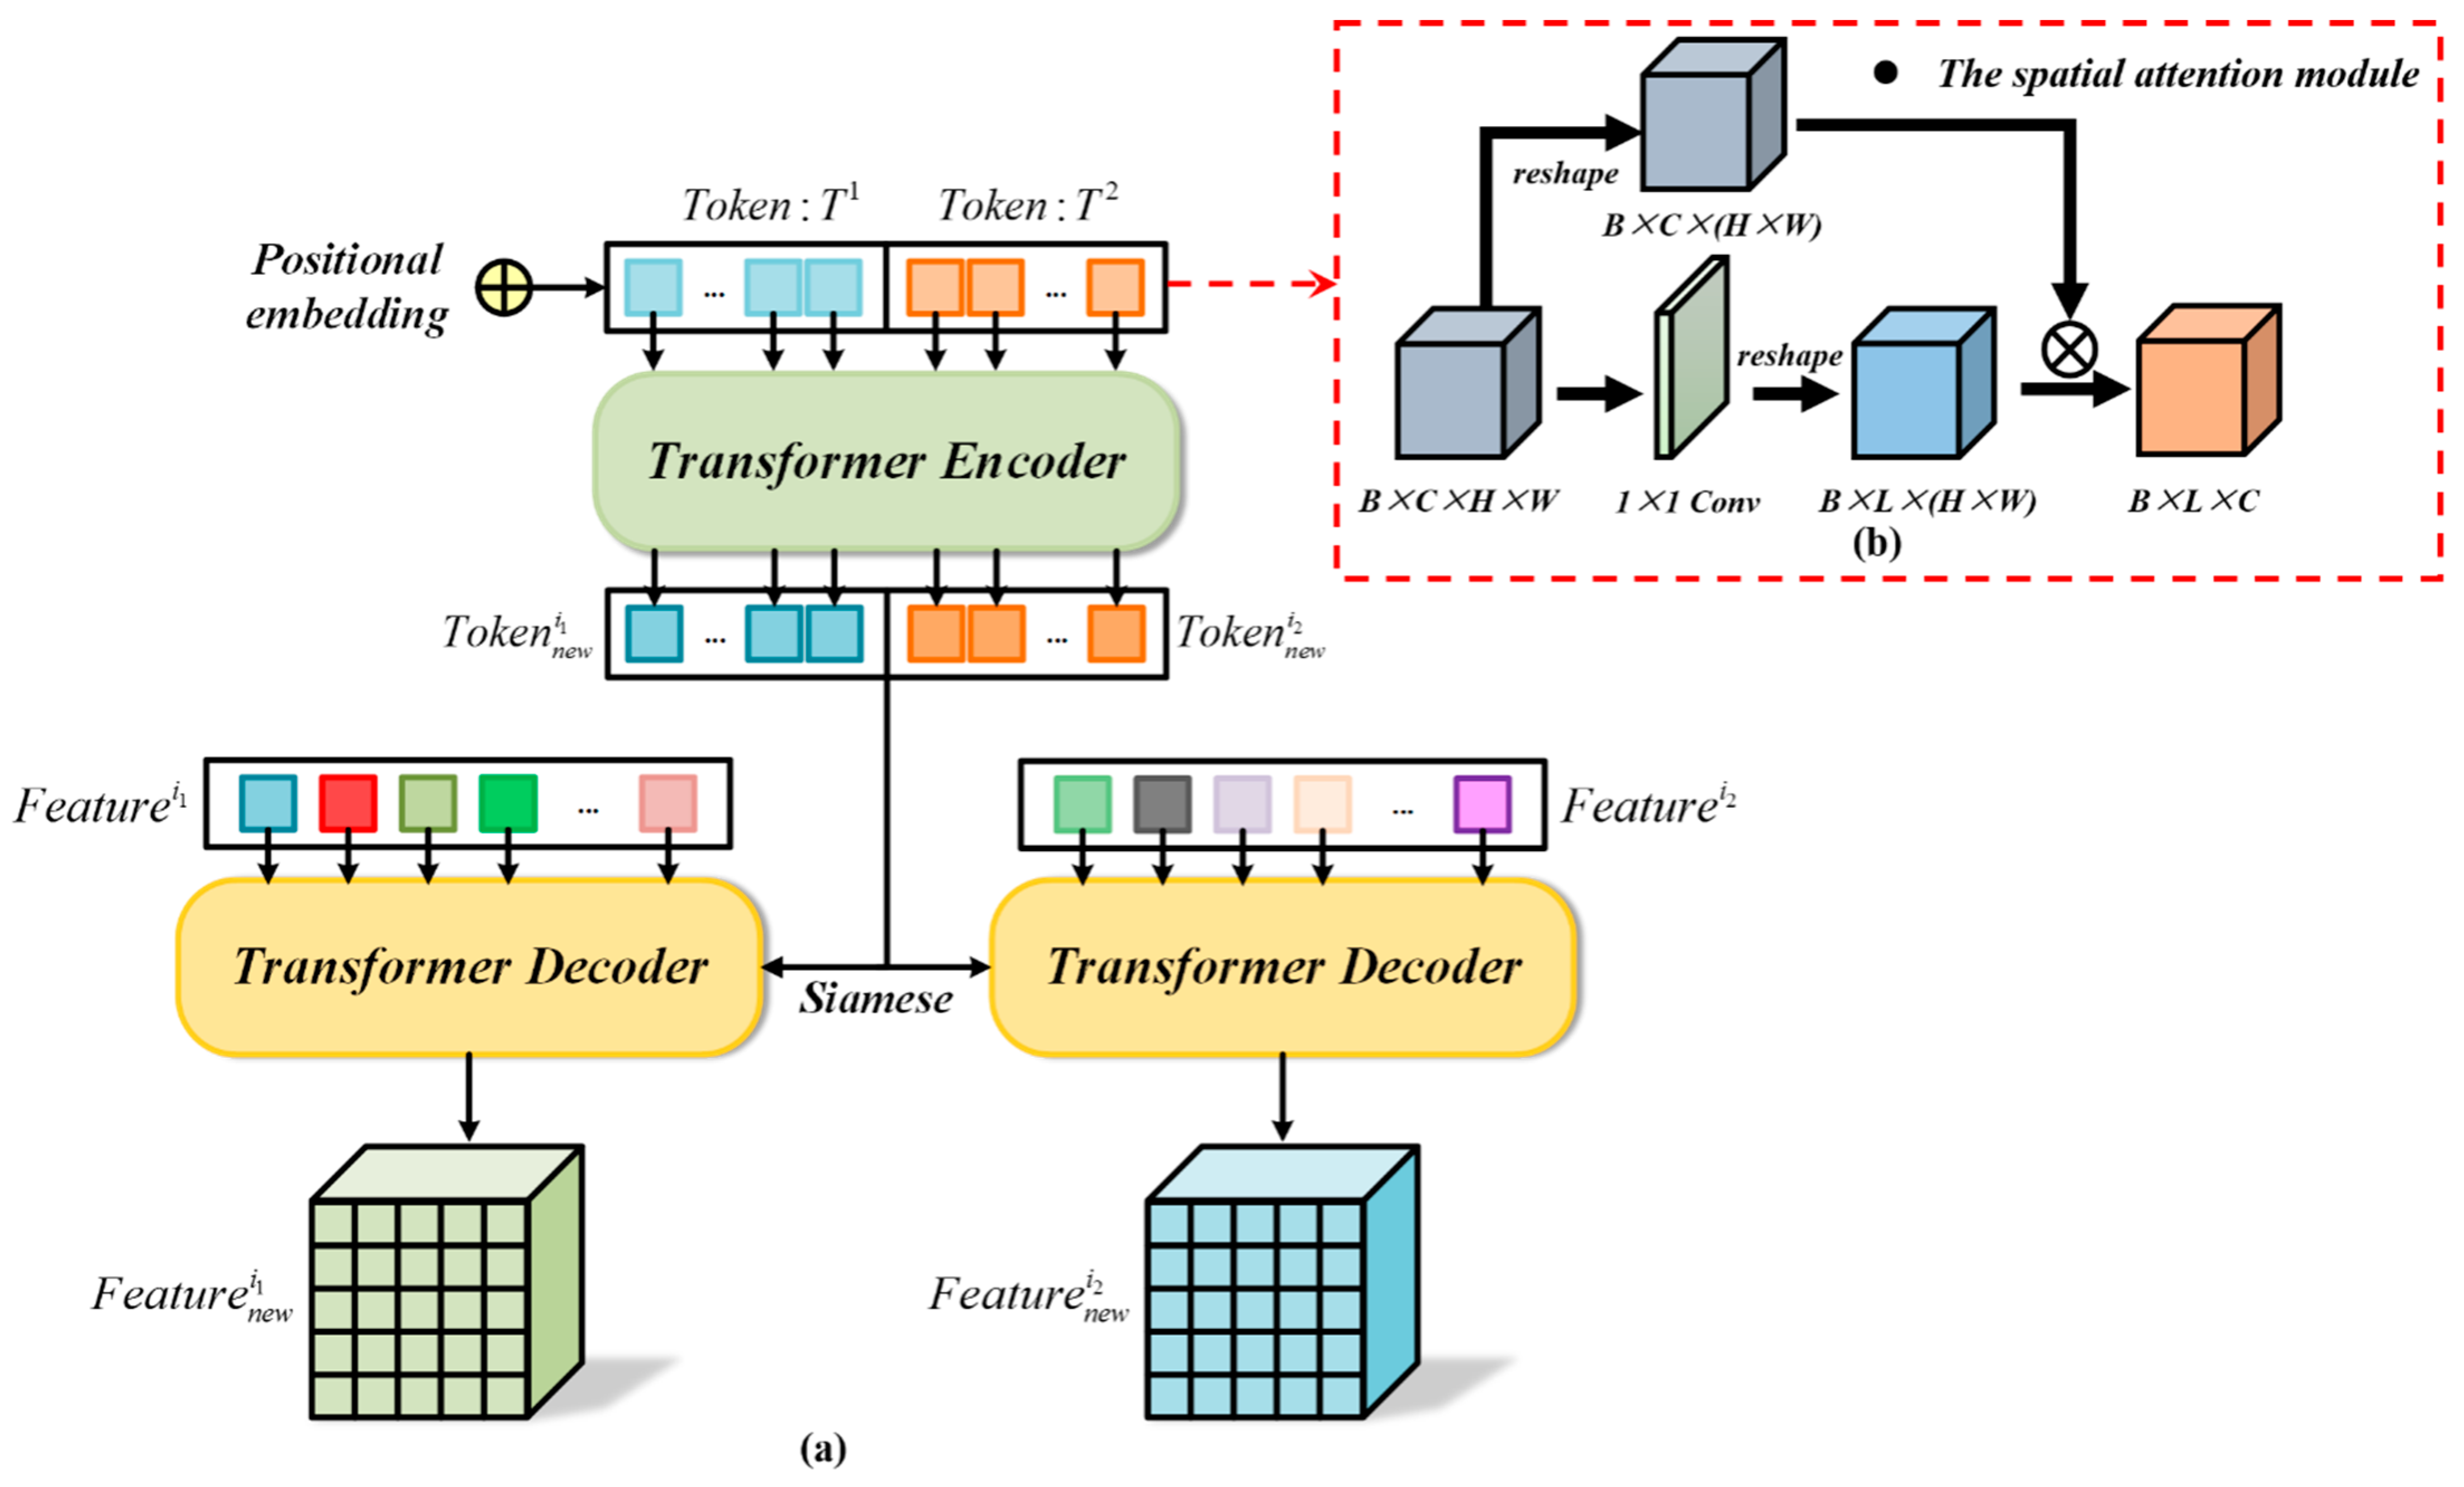
36] is applied to obtain the refined image features obtained by the feature extractor. The transformer module can aggregate the global information interaction of the image pixels. The transformer decoder uses the output features of the feature extractor as the query, and the output tokens of the transformer encoder is used as the key and value. The major contributions of this study can be summarized as follows:
  • The DMMSTNet is based on the multi-scale contextual transformer and the channel attention. It takes full advantage of remote sensing images’ rich spatial, channel and semantic information. The DMMSTNet incorporates the CoT module into the siamese feature extractor to acquire rich global spatial image features. The CoT module is a hybrid module that combines the advantages of self-attention and convolution. It calculates the attention score of each pixel in a 3 × 3 grid to generate a self-attention matrix, and the gained matrix is used to multiply the input to obtain the attention relationship.
  • The ECA is embedded in the feature extractor to concern the information correlation among the channels in this study. The channel attention aims to establish the correlation among the different channels and acquire the significance of each channel features automatically. The important channel features can be strengthened, and the unimportant features can be suppressed. Obtaining the information correlation among the channels of images is helpful for boosting the performance of the feature extractor.
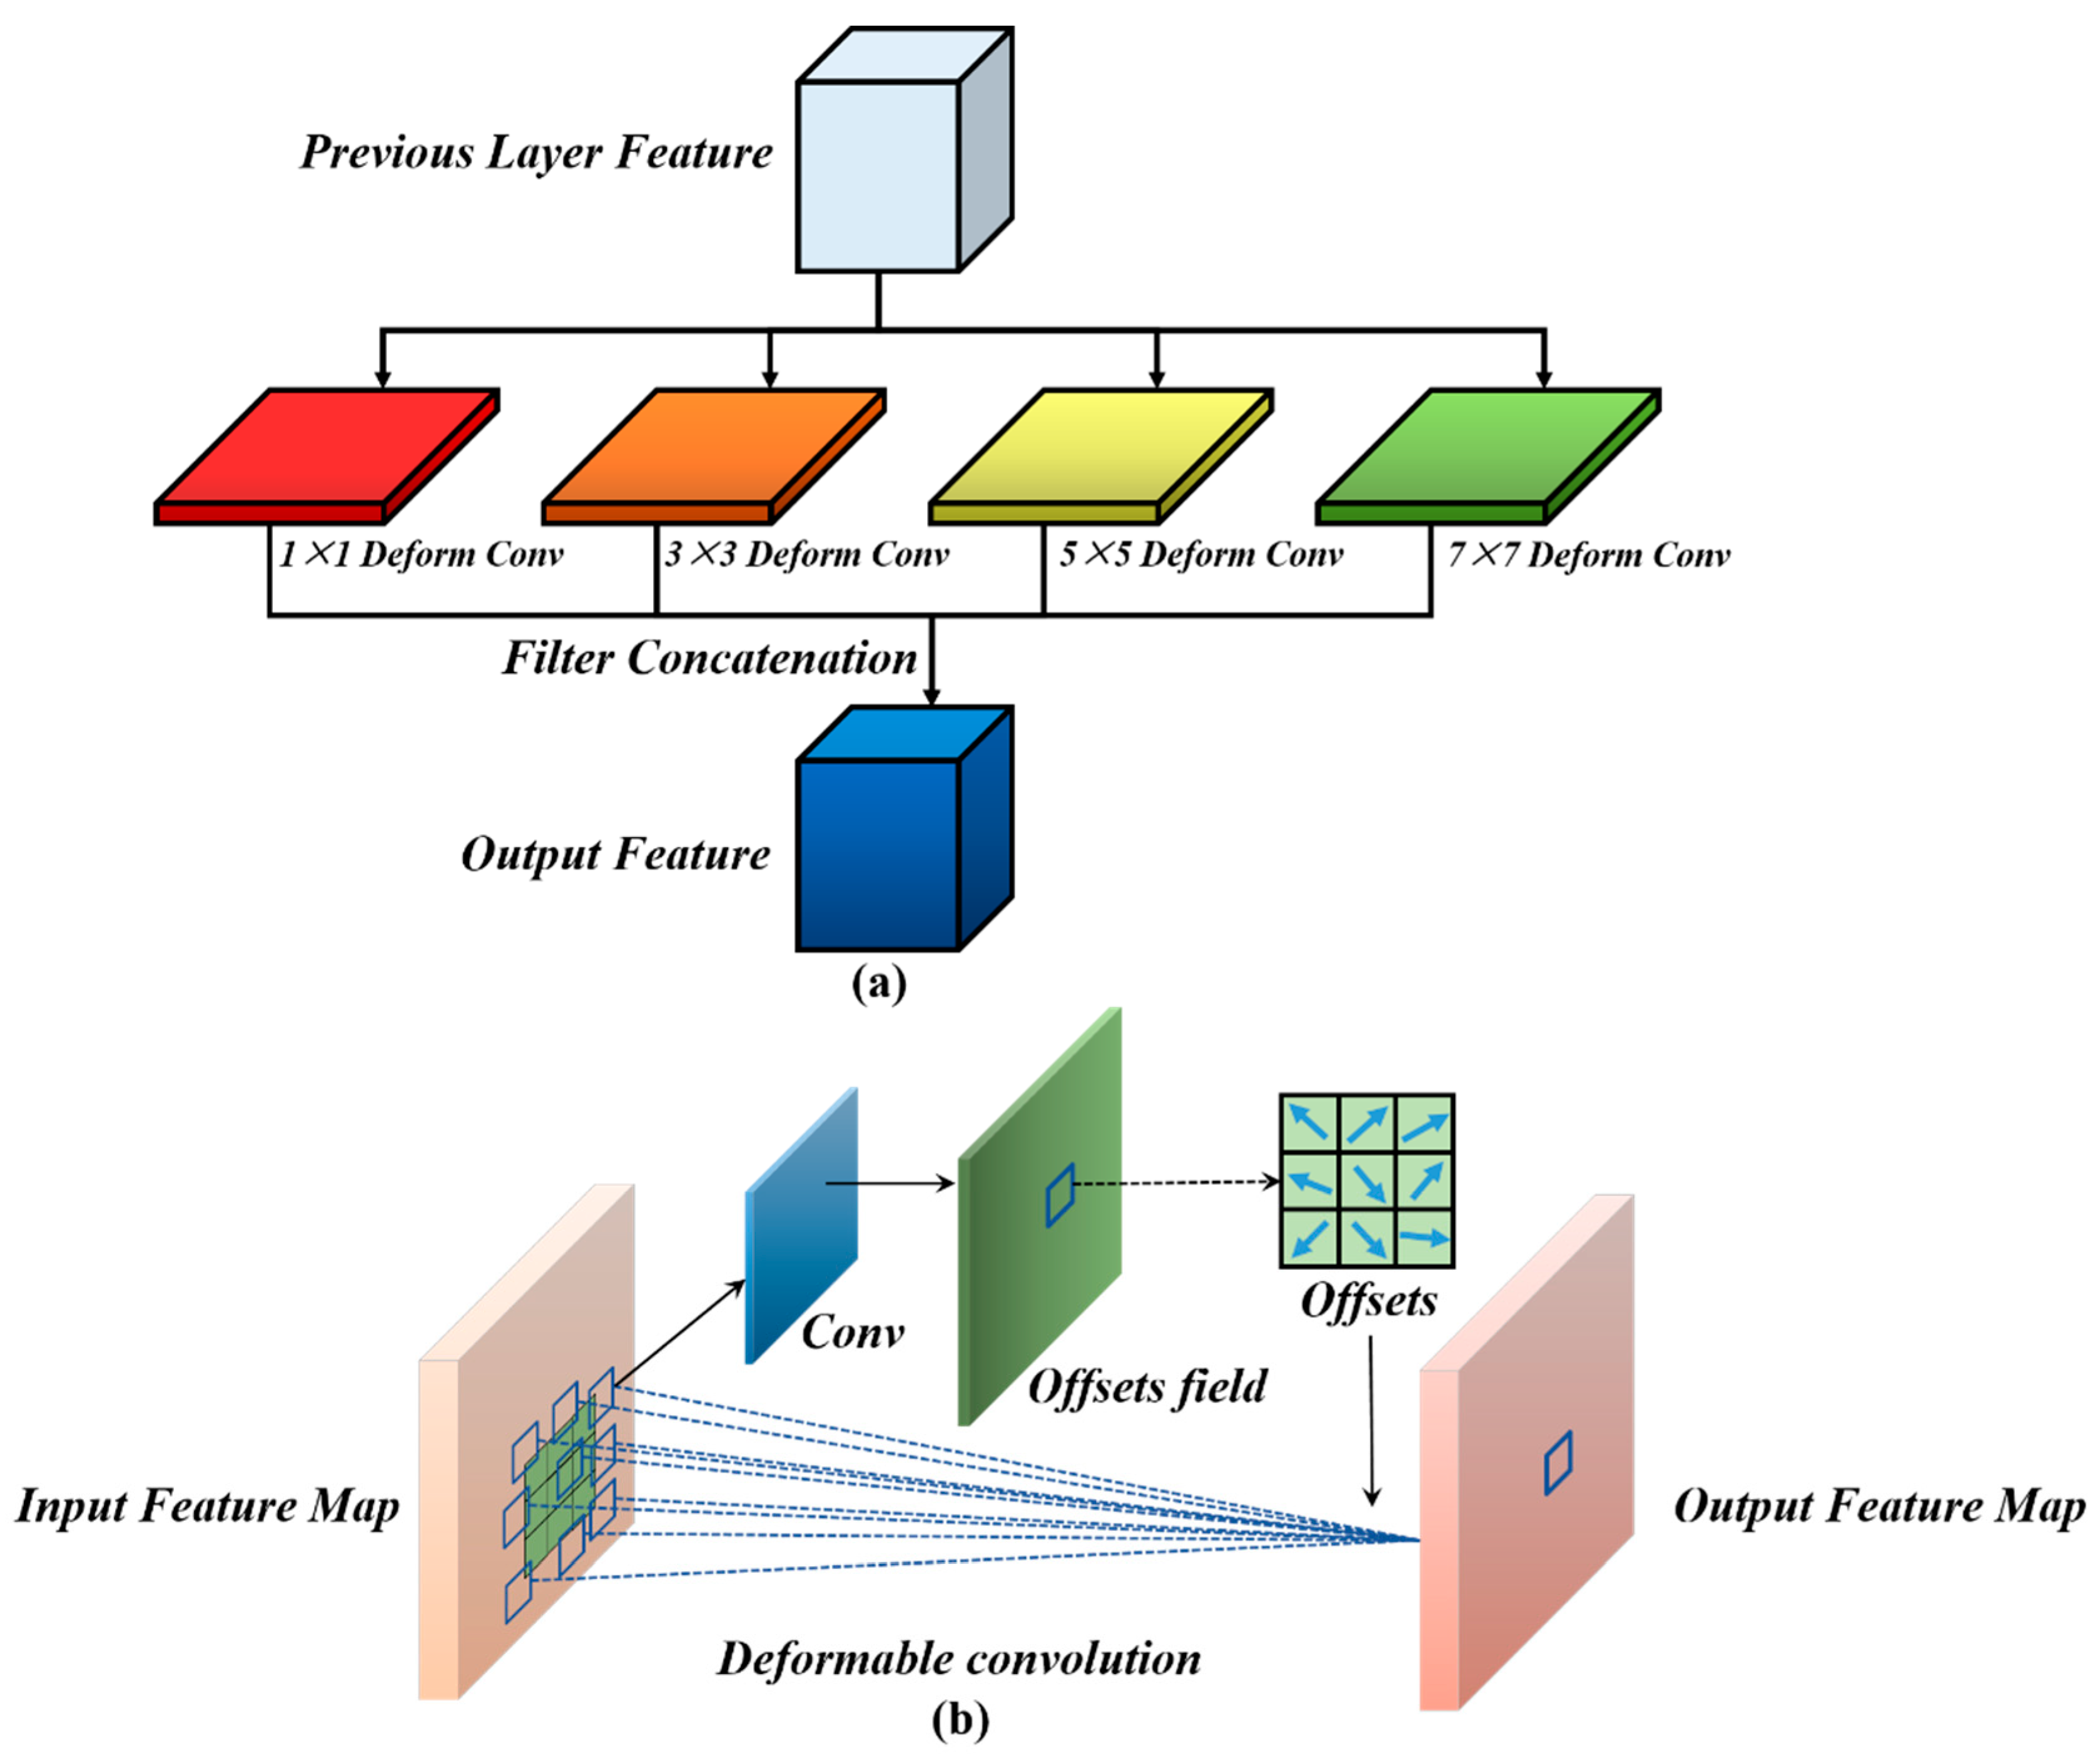
  • The MFF module is proposed in this study. Background objects of different sizes and shapes usually have different receptive field requirements. The semantic information of the different layers needs to be fused while identifying background objects of different sizes. The multi-scale feature representation of the images can be extracted, and the different levels of semantic information can be fused by the MFF. Then, the MFF can obtain the receptive fields of different sizes. The ground objects in remote sensing images have different sizes. The MFF module can obtain ground objects of different sizes, which shows the effectiveness of the change detection.
The rest of this study is organized as follows. The related work is introduced in Section 2. The proposed DMMSTNet will be described in Section 3. The experimental results will be presented and analyzed in Section 4. The conclusion and future work is provided in Section 5.

2. Related Works

2.1. Deep Siamese Network in Change Detection

The siamese network has a double branch structure, in which two identical network structures are contained and the weight parameters can be shared. The double branch structure can accept the different inputs, and the specific network module calculates the similarity between the two inputs. Bromley et al. was the first to propose the siamese network for signature verification [37]. The extracted feature vector was compared with the one stored by the signer in the verification process. Koch et al. combined the siamese network with the CNN for image classification [38]. The network adopted a special structure to rank the similarity between the inputs. By using the feature extraction ability of the CNN, it generalized the prediction ability of the network to the new data and the new category of the location distribution. Recently, many siamese-based approaches have been proposed. These networks can be categorized as (1) based on the encoder-decoder, such as U-Net [39]; (2) based on the classical image classification networks, such as VGG [27] and ResNet [40].
Many U-net-based networks have been proposed in change detection. Daudt et al. proposed two network structures [24], a predicted change map with precise boundaries in the output could be obtained by supplying the coding information with the means of the skip connections. Liu et al. proposed the LGPNet for building change detection [23]. A global-local pyramid structure feature extractor was proposed. The global spatial pyramid and the local feature pyramid modules were used to detect the different scales of buildings both globally and locally. The omission of buildings from different scales and shapes could be avoid. Fang et al. proposed the SNUNet, based on the NestedUNet [25], for high- resolution change detection [28]. Setting the entire network as the dense skip connections, the SNUNet alleviated the deterministic error of small targets and the indeterminacy of the edge pixels of changing targets while maintaining the high-resolution and the fine-grained representation. Peng et al. proposed a skip-connected algorithm based on the NestedUNet [25]. The NestedUNet was used as the backbone and could learn the visual features with multi-scale. By connecting bi-temporal images, different semantics can be viewed as the input of the network. In addition, the multi-side fusion deeply supervised module was added into the backbone network, which could reduce the gradient disappearance problem and enhance the astringency of the deep network. Shao et al. proposed the SUNet to deal with the problem that the different source remote sensing images are difficult to detect, and it was called the heterogeneous image change detection [41]. The SUNet utilized two different feature extractors to generate feature maps of two heterogeneous images, respectively. The obtained heterogeneous feature maps were connected and inputted into the decoder to obtain the edge auxiliary information from heterogeneous two-phase images using a canny edge detector and hough transform. Zheng et al. proposed the CLNet, which was an end-to-end cross-layer CNN [42]. A special cross-layer block (CLB) was proposed to incorporate the different stage context information and the multi-scale image features. The CLB was able to reuse the extracted features and capture pixel-level changes in complex scenes.
With the exception of U-Net, some network models used VGG [27] as the backbone network [26,43]. Zhang et al. used the VGG net to extract deep image features and proposed the FDCNN change detection algorithm [43]. The VGG, the FD-Net and the FF-Net were used as the encoder, the decoder and the classifier, respectively. The FD-Net could fuse deep image features with different stages. The fusion of feature difference maps of different sizes was achieved to obtain accurate boundary information of background targets. The FF-Net was utilized to solve the selection and fusion problem that the feature difference maps are obtained by the FD-Net. Zhang et al. proposed DSIFN by using the VGG as the feature extractor to obtain the representative deep features [26]. DSFIN combined the convolutional channel and spatial attention modules to solve the fusion problem of deep features and difference features. These two modules were helpful for enhancing the boundary integrity of the objects of the output results. In [44], a feature fusion module was proposed to fuse the features from the different stages of the backbone network. The low-resolution features were converted into the high-resolution change predictions through the up sampling of the decoder. In [31], the DSAMNet was proposed to learn the change graph through deep metric learning. It introduced a convolutional channel attention block to boost the performance of the whole network. Furthermore, a deep supervision module was introduced to boost the representation capability of the features and reduce the vanishing gradient problem of the deep network. Chen et al. proposed the DASNet by applying the ResNet50 as the feature extractor to obtain image features [29]. The spatial and the channel attention modules are used to establish the relationship between the local image features. The WDMC loss function solved the problem of sample imbalance by setting boundaries on the pixels in change regions. It enhanced the performance of the network to identify changing information.

2.2. Attention Mechanism

Attention mechanisms are introduced into computer vision tasks to imitate the human visual system. It can make the networks notice the significant change regions. The attention mechanisms can be classified into six categories, according to the data domain: spatial attention, channel attention, temporal attention, branch attention, spatial-channel attention and spatial-temporal attention. The aim of spatial attention is to determine the positional information of interest by learning all of the channels of the images, and the learned weight matrix represents the importance of certain spatial positional information. Jaderberg et al. proposed a spatial transformation network that utilized an explicit process to transform the images’ spatial information [45]. The network focused on the relevant regions. It could automatically select the regional features of interest during training and realized the spatial transformation of various deformation data. The channel attention calculates the weight of each channel feature, which represents the importance of the relevant information in the channels. Hu et al. designed a termed squeeze and excitation network (SENet) to obtain the relationship among channels [46]. The representational ability of the SENet was enhanced by the novel channel attention block. The temporal attention is usually applied in video tasks by computing the weight of the temporal dimension features to choose when to pay attention. Liu et al. proposed a novel temporal adaptive module (TAM) to solve the complex temporal dynamics problem in video datasets [47]. The TAM could be used to acquire a special video kernel, which was utilized to capture different motion patterns. This module applied global spatial average pooling to the feature maps, which ensured that the adaptive module had a lower computing cost. The branch attention is usually used in multi-branch networks, which is a mechanism to determine which branch should be selected by computing the attention weights of the different branches. Li et al. proposed a selectable kernel unit network (SKNet) that used softmax attention to fuse multiple branches of convolution kernels [48]. The different attention degrees of different branches made the receptive fields of neurons different during fusion. Therefore, the SKNet achieved the ability to adjust the receptive field on the different branches automatically. The spatial-channel attention can combine the advantages of spatial and channel attention. Woo et al. proposed a convolutional block attention module (CBAM) [49], which is applied to the overall network from the two dimensions of space and channel. The CBAM applied weights to the image features in a sequential calculation manner and refined the image feature representation. The spatial-temporal attention aggregates the image features from two dimensions of time and space, which focus on the location information of interest, spatially, and pay attention to the important temporal frame sequences, temporally. Du et al. proposed a novel approach to deal with the video tasks, which was called the recurrent spatial-temporal attention network [50]. The spatial-temporal attention was exploited to identify the pivotal features predicted by the LSTM at each temporal frame from the global video context, adaptively.
Recently, many change detection algorithms have attempted to add the attention mechanisms to emphasize the meaningful information while attenuating the unwanted information. Chen et al. proposed the DASNet, which utilized double attention to acquire the associations among the extracted features. The obtained global contextual information was optimized by the WDMC loss function [29]. Huang et al. proposed the MASNet [51], which was a multi-attention siamese network. The MASNet added the selected kernel convolution to the encoder for enhancing the capability of the feature extraction. Then, an attention fusion module was designed to improve the decoder, which achieved image feature fusion and selection from different scales. Chen et al. proposed the BiT [30], which was a two-phase image transformer network. The BiT used a transformer encoder after the feature extractor to model the compact pixel information in the spatial-temporal context. The original features were refined through a transformer decoder. Guo et al. proposed the MSPSNet [52], which contained parallel convolutional structures and a self-attention module. The MSPSNet used the constructed self-attention module to enhance the image information representation. Chen et al. proposed the STANet, which used special attention to simulate the spatial-temporal relationship [53]. By computing the attention weights among pixels in different locations and times, the spatial-temporal attention module could generate more distinguishing features.

3. The Proposed Method

3.1. Overview

The DMMSTNet is composed of a weight-shared feature extractor and a transformer module. The siamese feature extractor can extract the deep features from two-phase images. The compact spatial-temporal context is refined by the transformer module. Furthermore, in this study, the siamese feature extractor applies the CoT [34] to enhance its feature extraction capability. The ECA module [35] is introduced to capture the interaction of information among the remote sensing image channels. A MFF module is designed to obtain a complete change map for the inspected objects of different sizes. Finally, in order to give the image features rich semantic information, the transformer [36] is utilized to model the compact spatial-temporal global contextual information.
Let I i 1 , I i 2 R H × W × C denote the two-phase images at different times i 1 and i 2 , and y denotes the labels of the changing area. The pipeline of the DMMSTNet is given in Figure 1. Firstly, the two-temporal images I i 1 , I i 2 R H × W × C are preprocessed using the data augmentation methods, such as random flipping, interception and angle rotation. The siamese feature extractor consists of two branches. Branch 1 and branch 2 of the siamese feature extractor receive the preprocessed two-temporal images I i 1 , I i 2 R H × W × C to obtain two sets of multi-scale features F s = { f e a t u r e s 2 , ... , f e a t u r e s 5 } , s = i 1 , i 2 at different stages. In the feature extractor, the ECA and the MFF module are contained from the second stage to the fifth stage. In branch 1 and branch 2, we concatenate the multi-scale features obtained from the second to fifth stages in the channel dimension, respectively. The ECA module is utilized to improve the channel features of two-phase images. The MFF module can fuse the multi-scale features obtained from different stages and acquire a pair of two-phase image features F e a t u r e i 1 and F e a t u r e i 2 . Secondly, before sending F e a t u r e i 1 and F e a t u r e i 2 to the transformer encoder, the two sets of features obtained by branch 1 and branch 2 need to be concatenated in the channel dimension. Then, the two sets of features are tokenized and inputted into the transformer module. The contextual modeling of the token-based compact space-time is used to obtain F e a t u r e n e w i 1 and F e a t u r e n e w i 2 by applying the transformer module. Finally, a simple, fully convolutional network is used in the classifier to obtain the change map from F e a t u r e n e w i 1 and F e a t u r e n e w i 2 by the absolute values of the difference. While training the DMMSTNet, the cross-entropy (CE) loss function is utilized to optimize the overall network parameters.

3.2. Feature Extractor in DMMSTNet

As shown in Figure 2, the proposed feature extractor adopts a weight-sharing siamese network structure. We apply ResNet [40] to build the feature extractor and load the pre-trained ResNet50 parameters from ImageNet [54]. With the widespread application of transformer [38] models in computer vision, the transformer [36] and its variants have gradually been used to replace the most popular CNN backbone networks. As the basis of the transformer, the self-attention can obtain the information interaction and the global context information among all of the image pixels. We adopt the CoT module [34] to replace the 3 × 3 convolutional layers in ResNet50 for improving the global representation capability of the feature extractor.
The high-level features have imprecise location information but contain rich semantic information. The content of the low-level features is opposite to that contained in the high-level features. It is helpful for detecting background objects of different sizes accurately by making the most of the rich semantics in the high-level features and the spatial information in the low-level features. In this study, a MFF module is designed to integrate the two-phase features obtained by the siamese feature extractor. Moreover, in order to obtain the information interaction among the remote sensing image channels, the ECA [35] module is used to complete the channel feature integration. In Figure 2, the proposed feature extractor consists of five stages. The strides of the first three stages of the feature extractor are set according to the setting of ResNet50. The strides of stage 1 and stage 3 are set to two. The stride of stage 2 is set to one. In order to reduce the loss of the spatial details, we set the strides of the last two stages to one. The pointwise convolution is added after the feature extractor to decrease the dimension of the features. Firstly, stage 1 extracts the low-level features by using the convolutional layers with a kernel size of 7 × 7, and the maxpool is used after 7 × 7 convolution and 2 × 2 maxpooling to reduce feature dimensionality. From stage 2 to stage 5, the features output by the first stage are first passed through the CoT module to obtain the features containing the context information. The ECA module is embedded to aggregate the channel information. Finally, the MFF module utilizes its deformable convolutions of different sizes to obtain the multi-scale aggregation of the features. The deformable convolution kernel sizes in MFF are 1, 3, 5 and 7, where the numbers of the output channels are C 1 , C 2 , C 3 and C 4 ( C 1 , C 2 , C 3 and C 4 are set to 128) and the stride is one, respectively. Thus, four sets of multi-scale features from stage 2 to stage 5 of the feature extractor can be obtained. These four sets of features are connected in the channel dimension.

3.2.1. Contextual Transformer Module

The traditional self-attention mechanisms combine the feature interactions at different spatial locations. The method of combination usually depends on the input. All of the query-key relationships are isolated in the traditional self-attention mechanism, where the rich contextual information among them is not explored. In contrast to traditional self-attention mechanisms, the CoT module [34] can integrate the contextual information mining and the self-attention together in the same architecture. It can promote the self-attention learning whilst effectively making the most of the context information of the adjacent pixels. The representation ability of the output feature maps can be enhanced.
The detailed calculation process of the CoT module in the feature extractor is shown in Figure 3. The input feature map is supposed to X R H × W × C . H represents the height, W represents the width and C represents the number of channels of the image features. We define the query as Q , key as K and value as V , where Q = X , K = X and V = X W v , respectively. The CoT module performs 3 × 3 convolution operations on all adjacent K in the 3 × 3 grid, spatially. The feature map obtained by the 3 × 3 convolution is defined as the static context F 1 R H × W × C , which reflects the static context information among the local K . Concatenating F 1 and Q , the local attention matrix is obtained by two 1 × 1 convolutions:
l o c a l   a t t e n t i o n = [ F 1 , Q ] W μ W η
where both W μ and W η represent the 1 × 1 convolution, respectively. The local attention matrix l o c a l   a t t e n t i o n can learn each spatial location based on the Q and F 1 . The way of mining the static context F 1 can enhance the ability of the self-attention learning. Thus, an effective feature representation can be obtained through the combination of the static context F 1 and the value- V , which is named as the dynamic context F 2 . The calculation process is formulated as follow:
F 2 = V l o c a l   a t t e n t i o n
The output Y is acquired by adding the static context F 1 and the dynamic context F 2 at last.
Figure 3. The detailed calculation process of the CoT module.
Remotesensing 15 00842 g003

3.2.2. Efficient Channel Attention Module

In order to make the most of the information interaction among the remote sensing image channels, the ECA [35] module is introduced to aggregate the local cross-channel information interaction. The image channel features are refined by the channel attention map, which is obtained by the ECA module. The significance of each channel is encoded by the channel attention map, and its weights are automatically updated during the network training. By multiplying the input features with the corresponding weights of the channel attention map, the channel information to be focused on in the change detection is emphasized while the uncorrelated channel information is suppressed. In this case, the ECA module concerns the channels which can enhance the changed features.
As shown in Figure 4, the calculation process of the ECA module can be described as follows. Firstly, the aggregated features f a are acquired by the global average pooling layer. Then, the channel attention weights f b are generated by the one-dimensional convolution f 1 d k , where 1 d and k indicate the one-dimensional convolution kernel and its size, respectively, k is set to a value of five in this study. The channel attention weights f 1 d k obtain the normalized channel attention weights f b by the sigmoid activation function. Finally, by multiplying f b with the input features to obtain the channel-refined features. In the ECA module, the number of channels and the convolution kernel size are interrelated. The mapping relationship between C and k is usually an exponential function with a base value of two, which is a nonlinear mapping function, where C is the channel dimension and k is adaptive selection of kernel size.

3.2.3. Multiscale Feature Fusion Module

The ground objects usually have different scales and sizes. In the change detection task, the images contain background objects of different sizes. To obtain ground objects with different sizes, it is necessary to set different receptive fields for multi-scale feature fusion. Inspired by [55], this study proposes the MFF module, which is utilized to aggregate targets of different sizes and different resolutions. The MFF module utilizes both the low-level location information and the deep semantics of the feature extractor. The low-level feature map with high resolution has abundant location information and a small receptive field, which is fit to recognize small target objects. On the contrary, the deep feature with a lower resolution has rich semantic information and a large receptive field, which is fit to identify large target objects.
Figure 5a shows the details of the MFF module. To acquire the long-range dependencies and the irregular objects, the MFF module is achieved by setting the deformable convolution kernels [56] of different sizes, and it is added in the end of stages 2–5 of the siamese feature extractor to obtain the multi-scale features. In stages 2–5, the MFF takes the output features as the input and concatenates the channels of the multi-scale features obtained after stage 5. In the MFF, as shown in Figure 5b, the deformable convolution is a novel convolution calculation within the n × n grids. An offset is set at each position in the n × n grid to implement the convolution operation. The workflow of the deformable convolution is shown in Figure 5b. Its calculation can be described as Equations (3)–(5). In Equation (3), the original image feature f is subjected to a traditional convolution to obtain the output image feature z 1 , where w represents the weights to be updated. p 0 * represents each location within the R grid, p n * represents the location in the exhaustive grid R , Δ p n is the offsets in the R grid, where R represents a regular grid. The output feature z 2 is obtained by setting an offset within grid R in Equation (4). In Equation (5), the bilinear interpolation G ( ) is used to calculate p * and q * , where p * represents any location p * = p 0 * + p n * + Δ p n * and q * represents all spatial locations in the original feature map f .
z 1 ( p 0 * ) = p n * R w ( p n * ) f ( p 0 * + p n * )
z 2 ( p 0 * ) = p n * R w ( p n * ) f ( p 0 * + p n * + Δ p n * )
g ( p * ) = q * G ( q * , p * ) f ( q * )

3.3. Transformer Module

As shown in Figure 6a, the transformer-based [36] encoder and decoder are utilized to capture and aggregate the contextual features from the feature extractor. To obtain the long-range dependencies among the image pixels, the transformer module is applied to proceed the image features obtained by the feature extractor. In contrast to the CNN, the transformer needs to convert the input into two-dimensional vectors. As shown in Figure 6b, the spatial attention module (SAM) is used to tokenize the two-temporal image features obtained by the feature extractor. Before entering the transformer encoder, we need to concatenate the dual-branch features obtained by the feature extractor in the channel dimension. Then, the tokenized T o k e n : T 1 and T o k e n : T 2 are fed into the encoder. After T o k e n : T 1 and T o k e n : T 2 are processed by the transformer encoder, we divide them into two groups and input them into the siamese transformer decoder. To take advantage of both the feature extractor and the transformer, the features F e a t u r e i 1 and F e a t u r e i 2 obtained by the feature extractor are inputted into the transformer decoder as query Q , and the transformer encoder output is utilized as key K and value V . After the processing of the transformer decoder, the refined two-temporal image features F e a t u r e n e w i 1 and F e a t u r e n e w i 2 are obtained.

3.3.1. Transformer Encoder

The transformer needs to convert the image into a set of embedding vectors [57]. To deal with the features obtained from the feature extractor, the input features are converted into a set of token embeddings by the SAM. Then, the set of token embeddings is fed into the subsequent encoder. Figure 6 shows the overall transformer network. Given an input feature map X R H × W × C , the pointwise convolution is adopted in the SAM to obtain an intermediate feature X R H × W × L . H indicates the height, W indicates the width and C indicates the number of channels in the input feature map. L indicates the length of the token, which is set to four in this study. Then, the softmax function is applied to operate on the height and the width dimensions of the intermediate features. X * and X are reshaped into tokens, named as x * R ( H × W ) × C and x R ( H × W ) × L . Thus, a spatial attention map is obtained. Finally, a set of token embeddings are obtained by the einsum operation, which is formulated as follow:
T o k e n = x H W L · x * H W C
where x * H W C and x H W L represent the input image feature map and the mid-spatial attention map, respectively.
After feeding the feature map from the feature extractor into the transformer encoder, the transformer encoder [36] is utilized to aggregate the contextual information in the token. It can exploit the spatial-temporal global semantic relationship of the token sets and generate context-rich token representations. As shown in Figure 6a, the position embedding vector is embedded when the feature embedding vector is input. The multi-head self-attention module (MHSA) and the feed-forward neural network (FFN) are the two main components of the transformer. In each layer, the self-attention input is a ternary vector obtained from T o k e n :
Q = T o k e n ( l 1 ) W q l 1
K = T o k e n ( l 1 ) W k l 1
V = T o k e n ( l 1 ) W v l 1
where Q , K , V are the query vector, key vector and value vector, respectively. W q l 1 , W k l 1 and W v l 1 are three matrices initialized randomly. l represents the encoder in the l -th layer. The single-head attention formula is defined as follow:
a t t e n ( Q , K , V ) = σ ( Q · K T d ) V
where σ indicates that the softmax function is used for normalization in the channel dimension. d indicates the dimensions of Q and K , where d is set to 64.
The MHSA is the core of the transformer encoder. It can make the encoder aggregate space information at different locations. The MHSA computes the multi-head self-attention in parallel and connects each attention head. It performs linear mapping to obtain the final value. The calculation of the MHSA is formulated as follows:
h e a d i * = a t t e n ( T o k e n ( l 1 ) W q l 1 , T o k e n ( l 1 ) W k l 1 , T o k e n ( l 1 ) W v l 1 )
M H S A ( Q , K , V ) = c o n c a t ( h e a d 1 * , ... , h e a d 8 * ) · W O
where h e a d i * represents the self-attention mechanism calculation of the i -th head. W q l 1 , W k l 1 and W v l 1 represent the weights of the linear layer maps Q , K and V of the i-th head, respectively. W O is the weight of the last linear layer in MHSA.
The FFN module is used to transform the learnable token of the MHSA. The FFN module is composed of a hidden layer and two linear connection layers, followed by a gaussian error linear unit [58] as the activation function.

3.3.2. Transformer Decoder

To obtain the pixel-level features, the compact high-level semantic information needs to be projected to the pixel space. The transformer decoder receives both the feature map z from the feature extractor and the T o k e n n e w i from the encoder. The feature map z obtained by the siamese feature extractor is inputted into the transformer decoder as query Q . The output T o k e n n e w i of the transformer encoder is utilized as key K and value V . The transformer decoder is made up of a multi-head cross self-attention (MHCSA) module and a FFN module. In contrast to the decoder in [38], MHCSA is used to replace MHSA. MHCSA utilizes the features output by the feature extractor as the query, and the tokens output by the transformer encoder are used as the key and value. The combination of the query, key and value can make full use of the pixels from the features obtained by the feature extractor and the tokens obtained by the transformer encoder. Therefore, the transformer decoder can output the features with rich semantics. In MHCSA, z is converted to the decoder’s Q through a random initial matrix. T o k e n n e w is converted to the decoder’s K and V through two random initial matrices. Therefore, the calculation of MHCSA is formulated as:
M H C S A ( z , T o k e n n e w i ) = c o n c a t ( h e a d 1 * , ... , h e a d 8 * ) · W O
h e a d i * = a t t e n ( z W q l 1 , T o k e n n e w i W k l 1 , T o k e n n e w i W v l 1 )
where z represents query Q from the feature extractor. T o k e n n e w i represents key K and value V from the siamese encoder. W q l 1 , W k l 1 and W v l 1 represent linear projection through the random initial matrices.

3.4. Classifier and Loss Function

A simple classifier is used to complete the classification task in this study. The classifier is composed of two 3 × 3 convolutions, and the number of output channels of the two convolutions is 32 and 2. Given the training bi-temporal images and its ground truth, the accurate predictions are obtained by optimizing the objective function. During the training stage, the CE loss function is minimized to optimize the DMMSTNet parameters. The calculation process is written as:
L c e = [ Y * log Y + 1 Y * l o g ( 1 Y ) ] = 1 H * × W * h = 1 , w = 1 H * , W * l ( Y h w , Y h w * )
where L c e represents the CE loss function. Y and Y * indicate the prediction map and label map, respectively. h and w represent the pixel position. H * and W * are the height and the width of the original image, respectively.

4. Experimental Results

By showing and discussing the experimental results, in this section, we verify the effectiveness of the proposed DMMSNet. The experimental setting is given first. The general overview of the change detection experimental datasets, the evaluation indicators of the change detection and five comparison approaches are introduced next. Then, the change detection results of the DMMSTNet and the comparison approaches on the datasets are analyzed and discussed. Furthermore, the ablation experiments of the DMMSTNet are given to verify the effectiveness of the different modules.

4.1. Experiment Setting

4.1.1. Experimental Datasets

The LEVIR-CD [53] dataset and the CCD [59] dataset are selected as the experimental datasets in this study. The LEVIR-CD is a building change detection dataset, which is shown in Figure 7a. It was collected by Google Earth API in Texas, USA, between 2002 and 2018 and contains 637 high-resolution bi-temporal remote sensing images (0.5 m/pixel). Each image size is 1024 × 1024. The LEVIR-CD dataset contains various types of buildings with different shapes and sizes, such as factory, vegetation, apartments, garages, villa houses, etc. Following the division rules of the dataset, the training set, test set and validation set are divided by 7:2:1. Each image is segmented into 16 images, 256 × 256 in size. Then, the training set, test set and validation set contain 7120, 2048 and 1024 pairs of bi-temporal images, respectively. The CCD is a dataset of urban landforms that vary with the seasons. As shown in Figure 7b, it contains 16,000 bi-temporal images of real seasonal images (0.03–1 m/pixel). The training set, test set and validation set are 10,000, 3000 and 3000, respectively. Each image size is 256 × 256. The CCD dataset not only contains the change information of large targets, such as buildings, forests, urban roads, etc., but also the change information of many small targets, such as cars, etc. The LEVIR-CD dataset can be available online: https://justchenhao.github.io/LEVIR/, accessed on 22 May 2020. The CCD dataset can be available online: https://drive.google.com/file/d/1GX656JqqOyBi_Ef0w65kDGVto-nHrNs9, accessed on 7 June 2018.

4.1.2. Comparison Methods

To verify the effectiveness and the superiority of the DMMSTNet, five popular change detection methods are selected as the comparison approaches in this study, which are described as follows:
(1)
IFN [26] is a network that combines a deep supervision block and an attention module. It can learn the representative deep image features based on a siamese VGG net. The reconstructed change map can be acquired by fusing the multi-level depth feature of the original image with the image difference feature through the attention module.
(2)
SNUNet [28] is based on the NestedUnet and contains the densely connected structure. It can alleviate the loss of the deep localization information in whole networks through dense skip connections. An integrated channel attention block is introduced for deep supervision to enhance the features at different semantic levels.
(3)
STANet [53] utilizes the spatial-temporal attention block to refine the image features. The spatial-temporal attention block can model the spatial-temporal relationship in the image, which is embedded into the feature extraction process to acquire the discriminative features. The change graph is finally obtained using the metrics module.
(4)
BiT [30] is a transformer-based network. The transformer encoder is applied to model the spatial-temporal context of the compact pixel information. Then, the original features can be refined through a transformer decoder.
(5)
MSPSNet [52] contains parallel convolutional structures and a self-attention module. Parallel convolution introduces different dilated convolutions to perform feature aggregation and improve the receptive field. The self-attention module highlights the regions where changes are easier to detect.

4.1.3. Implementation Details and Evaluation Metrics

All of the experiments are performed on a workstation with NIVDIA RTX 3090 using the Pytorch framework. The parameters applied in all of the comparison algorithms are as consistent as possible with the original papers. For the DMMSTNet, a stochastic gradient descent optimizer is employed. The hyperparameter momentum is set to 0.99, the learning rate is set to 0.01, the weight decay is set to 0.0005, and linear decay is set to 0, respectively. The whole network is trained for 200 epochs until it is converged. Meanwhile, the batchsize is set to eight during training and testing.
Five widely used indices, including the overall accuracy (OA), precision (Pre), recall (Rec), F1 score (F1) and intersection over union (IoU), are utilized as the evaluation metrics in the experiments. Among these metrics, TP, TN, FP and FN indicate true positive, true negative, false positive, false negative, respectively. The calculations of these five indicators are formulated as follows:
O A = T P + T N T P + T N + F P + F N
P r e = T P T P + F P
R e c = T P T P + F N
F 1 = 2 × P r e × R e c P r e + R e c
I o U = T P T P + F N + F P

4.2. Comparison Experiments

4.2.1. Comparison Results on the LEVIR-CD Dataset

Table 1 shows the numerical results of the comparison approaches on the LEVIR-CD dataset. The DMMSTNet gains the best results for the F1 score (90.83%), Rec (89.59%), IoU (83.20%) and OA (99.08%). Figure 8 shows the visualized results of all of the approaches. The edge of the change map obtained by IFN is rough and includes false detections. IFN may not be able to detect the complete edges of some objects. Compared with the other four methods, the change regions detected by the DMMSTNet and SNUNet have more complete boundaries. Their detection results also include fewer missed detections and false detections. The STANet accomplishes the best precision value for the reason that the spatial-temporal attention module is embedded into the feature extractor to emphasize the characteristics of the changing regions. With a transformer module that can emphasize the connection among the high-level semantic features, the BiT has no false detections and missed detections. However, the edge features of its detected objects are not sensitive. This may cause the edges, corners and the objects to be detected as a unity. Introducing the dense connections, the multi-level feature integration and the attention methods, the SNUNet shows a good detection performance and achieves the second highest value on the F1 score. Compared with the other five methods, the DMMSTNet achieves the highest values for the four indicators. It demonstrates the effectiveness of the method in multi-scale feature extraction, aggregation and refinement modules.

4.2.2. Comparison Results on the CCD Dataset

Table 2 shows the numerical results of all of the algorithms on the CCD dataset. As the objects in the CCD dataset are sparse and small, the detection results are suggestible to some factors, such as noise, which may result in some false detections. Compared with the other five networks, the DMMSTNet achieves the best results for the Rec (96.11%), F1 score (96.56%), IoU (93.35%), OA (99.19%). Figure 9 shows the visualized results of all of the approaches. The IFN can obtain change maps in most of the change regions of large targets, but it is not good enough at catching small targets. The SNUNet can acquire the whole change region in most situations, but it is insensitive to some edge information. In addition, the IFN and SNUNet may miss and misdetect small target objects. The STANet emphasizes the change regions by utilizing the proposed spatial-temporal attention module. It can enhance the ability to extract deep features and the performance of the network has been significantly improved. However, when capturing the edge information in the large-size target, it is insensitive to the weak change of the edge information. The BiT can obtain a complete change map, but the false detection and the miss detection problems are still present. Its detection performance on irregular objects is not good enough. The DMMSTNet almost captures the complete regions of variation and provides fewer false and missed regions. The DMMSTNet obtains the highest F1 score. It can identify irregular objects and obtain the complete change map of large and small objects.

4.3. Ablation Experiments

To verify the effectiveness of the ECA module and the MFF module in the DMMSTNet, we conduct two ablation studies on the two datasets. Base1 is ResNet50 [40]. In the following experiments, “Base1 + CoT” represents the ResNet50 with the CoT module, and “Base1 + transformer” represents the ResNet50 with the transformer module. The Base2 experimental results are obtained from DSNCoT [33], which is a deep siamese network with a novel self-attention. In DSNCoT, the CoT module is added into the siamese feature extractor, and the transformer module is used to obtain the refined pixel-level features. In the following experiments, “Base2 + MFF” represents the proposed network with the MFF module and “Base2 + ECA” represents the proposed network with the ECA module.
The numerical metrics of the ablation base1 experiments on the two datasets are listed in Table 3 and Table 4. Compared with Base1, the values of the Pre, F1 and IoU of “Base1 + CoT” are increased by 3.34%, 1.36% and 2.18% on LEVIR-CD dataset, shown in Table 3. Additionally, its values of Pre, Rec, F1 and IoU are increased by 2.04%, 4.51%, 3.32% and 5.97% on the CCD dataset, shown in Table 4. The visualization results of the ablation Base1 experiments are shown in Figure 10 and Figure 11. With the Transformer module, the values of Pre, F1 and IoU for the “Base1 + transformer” are increased by 6.41%, 1.66% and 2.66% on the LEVIR-CD dataset, shown in Table 3. Additionally, its values of Pre, Rec, F1 and IoU are increased by 1.03%, 4.3%, 2.71% and 4.84% on the CCD dataset, shown in Table 4. Although Base1 can obtain the background target more completely, the edge of the obtained background target is rough. In addition, Base1 struggles to obtain small targets, and there are problems such as missed detections and false detections. By adding the CoT module, “Base1 + CoT” can obtain a more complete change map, which improves the overall detection performance of the network. Therefore, the CoT module we introduce can aggregate the features efficiently. By adding the transformer module, “Base1 + Transformer” can provide more complete change maps, as shown in Figure 10 and Figure 11. It reflects that the transformer module is helpful for aggregating the global feature information.
The numerical metrics of the ablation experiments on the two datasets are listed in Table 5 and Table 6. Compared with Base2, the values of F1 and IoU of “Base2 + ECA” are increased by 0.94% and 1.56% on the LEVIR-CD dataset, as shown in Table 5. However, it does not achieve a good performance on the CCD dataset. The visualization results of the ablation experiments are shown in Figure 12 and Figure 13. It can be considered that the image quality of the LEVIR-CD dataset is better than that of the CCD dataset. The high quality of images in the LEVIR-CD dataset may help the ECA module to integrate the channel information into the whole network. With the MFF module, the values of F1 and IoU of “Base2 + MFF” are increased by 0.87% and 1.44% on the LEVIR-CD dataset, shown in Table 5. Additionally, its values of F1 and IoU are increased by 0.13% and 0.24% on the CCD dataset, shown in Table 6. Compared with Base2, “Base2 + MFF” can provide more detailed information, as shown in Figure 12 and Figure 13. It reflects that the MFF module is helpful for capturing small and irregular objects. When using both the ECA module and MFF module, the DMMSTNet can capture the slight change regions and precisely categorize pixels that are likely to change.

5. Conclusions

This study proposes a deep siamese transformer network that is based on multi-scale feature fusion and multi-attention for remote sensing image change detection. The DMMSTNet mainly includes four modules: the CoT module, the ECA module, the MFF module and the transformer module. Both the CoT and the ECA module are embedded into the feature extractor. The CoT module combines the advantages of convolution and self-attention. It can enable the feature extractor to obtain the rich global contextual features and improve the global spatial feature extraction capability. The ECA module can enhance the information interaction among the channels and boost the performance of the feature extractor. The MFF module can fuse the rich deep semantic features and the location-accurate low-level features of the feature extractor. Then, the features can be fused at different stages of the feature extraction, and the representative ability of the feature extractor can be improved. Furthermore, the MFF module consists of multiple deformable convolutions of different sizes. Convolution kernels of different sizes have different receptive fields, so targets of different sizes can be obtained. Deformable convolutions incorporate learnable offsets in the receptive field. These offsets make the receptive field of deformable convolution no longer a regular square, but a receptive field close to the actual shape of the object. Thus, it can detect objects of different sizes and is helpful for detecting irregular objects. Using a semantic tokenizer, the transformer module can model the temporal and spatial contextual features obtained by the feature extractor. The self-attention is utilized to establish the global pixel relationships of the two-phase image features. It can obtain rich image semantic features and enhance the performance of the entire network. Compared with several popular change detection approaches, the DMMSTNet can achieve a better performance on the LEVIR-CD and the CCD datasets. It is able to obtain a nearly complete change map and has a strong discrimination ability for small targets and irregular targets. The ablation experiments show the effectiveness of the CoT module, the ECA module, the MFF module and the transformer module. To osbtain a superior performance, the DMMSTNet requires abundant supervised data to train the network. We are going to attempt to upgrade the network for change detection with a relatively small number of training samples in future work. In addition, we will try to reduce the complexity of the network and enhance the computation efficiency, whilst maintaining the high classification accuracy. We will also design the network for automatic change detection.

Author Contributions

Conceptualization, M.Z.; Funding acquisition, M.Z., L.L. and J.F.; Project administration, M.Z. and L.L.; Methodology, M.Z.; Software, Z.L.; Validation, Z.L. and M.Z.; Writing—original draft preparation, M.Z., Z.L. and L.L.; Writing—review and editing, M.Z.; Supervision and suggestions, L.J. and J.F. All authors have read and agreed to the published version of the manuscript.

Funding

This work was supported in part by the Natural Science Basic Research Program of Shaanxi: No. 2022JM-336; in part by the National Natural Science Foundation of China under Grant No. 62271374; in part by the Fundamental Research Funds for the Central Universities: No. XJS211906, No. XJS210205; in part by National Natural Science Foundation of China under Grant No. 61902298; in part by 2018 Postdoctoral Foundation of Shaanxi Province No. 2018BSHEDZZ46; in part by Key Scientific Research Program of Education Department in Shaanxi Province of China No. 20JY023.

Data Availability Statement

Publicly available datasets were analyzed in this study. The LEVIR-CD dataset can be found on: https://justchenhao.github.io/LEVIR/, accessed on 22 May 2020. The CCD dataset can be found on: https://drive.google.com/file/d/1GX656JqqOyBi_Ef0w65kDGVto-nHrNs9, accessed on 7 June 2018.

Conflicts of Interest

The authors declare no conflict of interest.

References

  1. Hong, D.; Gao, L.; Yokoya, N.; Yao, J.; Chanussot, J.; Du, Q.; Zhang, B. More Diverse Means Better: Multimodal Deep Learning Meets Remote-Sensing Imagery Classification. IEEE Trans. Geosci. Remote Sens. 2021, 59, 4340–4354. [Google Scholar]
  2. Rasti, B.; Hong, D.; Hang, R.; Ghamisi, P.; Kang, X.; Chanussot, J.; Benediktsson, J.A. Feature Extraction for Hyperspectral Imagery: The Evolution from Shallow to Deep: Overview and Toolbox. IEEE Geosci. Remote Sens. Mag. 2020, 8, 60–88. [Google Scholar] [CrossRef]
  3. Singh, A. Review Article Digital change detection techniques using remotely-sensed data. Int. J. Remote Sens. 1989, 10, 989–1003. [Google Scholar]
  4. Koltunov, A.; Ustin, S.L. Early fire detection using non-linear multitemporal prediction of thermal imagery. J Remote Sens. Environ. 2007, 110, 18–28. [Google Scholar]
  5. Bruzzone, L.; Serpico, S.B. An iterative technique for the detection of land-cover transitions in multitemporal remote-sensing images. J IEEE Trans. Geosci. Remote Sens. 1997, 35, 858–867. [Google Scholar] [CrossRef]
  6. Mucher, C.A.; Steinnocher, K.; Kressler, F.P.; Heunks, C. Land cover characterization and change detection for environmental monitoring of pan-Europe. Int. J. Remote Sens. 2000, 21, 1159–1181. [Google Scholar]
  7. Häme, T.; Heiler, I.; Miguel-Ayanz, J.S. An unsupervised change detection and recognition system for forestry. Int. J. Remote Sens. 1998, 19, 1079–1099. [Google Scholar]
  8. Xiao, J.; Shen, Y.; Ge, J.; Tateishi, R.; Tang, C.; Liang, Y.; Huang, Z. Evaluating urban expansion and land use change in Shijiazhuang, China, by using GIS and remote sensing. Landsc. Urban Plan. 2006, 75, 69–80. [Google Scholar]
  9. Glass, G.V. Primary, Secondary, and Meta-Analysis of Research1. Educ. Res. 1976, 5, 3–8. [Google Scholar] [CrossRef]
  10. Yu, C.; Wang, J.; Peng, C.; Gao, C.; Yu, G.; Sang, N. BiSeNet: Bilateral Segmentation Network for Real-Time Semantic Segmentation. In Proceedings of the European Conference on Computer Vision (ECCV), Munich, Germany, 8–14 September 2018; pp. 334–349. [Google Scholar]
  11. Jackson, R.D. Spectral indices in N-Space. Remote Sens. Environ. 1983, 13, 409–421. [Google Scholar]
  12. Todd, W.J. Urban and regional land use change detected by using Landsat data. J. Res. US Geol. Surv. 1977, 5, 529–534. [Google Scholar]
  13. Ferraris, V.; Dobigeon, N.; Wei, Q.; Chabert, M. Detecting Changes Between Optical Images of Different Spatial and Spectral Resolutions: A Fusion-Based Approach. IEEE Trans. Geosci. Remote Sens. Environ. 2018, 56, 1566–1578. [Google Scholar]
  14. Kuncheva, L.I.; Faithfull, W.J. PCA Feature Extraction for Change Detection in Multidimensional Unlabeled Data. IEEE Trans. Neural Netw. Learn. Syst. 2014, 25, 69–80. [Google Scholar]
  15. Saha, S.; Bovolo, F.; Bruzzone, L. Unsupervised Deep Change Vector Analysis for Multiple-Change Detection in VHR Images. IEEE Trans. Geosci. Remote Sens. Environ. 2019, 57, 3677–3693. [Google Scholar] [CrossRef]
  16. Çelik, T. Unsupervised Change Detection in Satellite Images Using Principal Component Analysis and $k$-Means Clustering. IEEE Geosci. Remote Sens. Lett. 2009, 6, 772–776. [Google Scholar] [CrossRef]
  17. Bovolo, F.; Bruzzone, L.; Marconcini, M. A Novel Approach to Unsupervised Change Detection Based on a Semisupervised SVM and a Similarity Measure. IEEE Trans. Geosci. Remote Sens. 2008, 46, 2070–2082. [Google Scholar]
  18. Wu, C.; Du, B.; Cui, X.; Zhang, L. A post-classification change detection method based on iterative slow feature analysis and Bayesian soft fusion. Remote Sens. Environ. 2017, 199, 241–255. [Google Scholar] [CrossRef]
  19. Sun, W.; Yang, G.; Ren, K.; Peng, J.; Ge, C.; Meng, X.; Du, Q. A Label Similarity Probability Filter for Hyperspectral Image Postclassification. IEEE J. Sel. Top. Appl. Earth Obs. Remote Sens. 2021, 14, 6897–6905. [Google Scholar]
  20. Wu, C.; Du, B.; Zhang, L.-p. A Subspace-Based Change Detection Method for Hyperspectral Images. IEEE J. Sel. Top. Appl. Earth Obs. Remote Sens. 2013, 6, 815–830. [Google Scholar]
  21. Ma, L.; Liu, Y.; Zhang, X.-l.; Ye, Y.; Yin, G.; Johnson, B. Deep learning in remote sensing applications: A meta-analysis and review. ISPRS J. Photogramm. Remote Sens. 2019, 152, 166–177. [Google Scholar] [CrossRef]
  22. Dong, W.; Zhang, T.; Qu, J.; Xiao, S.; Liang, J.; Li, Y.; Sensing, R. Laplacian Pyramid Dense Network for Hyperspectral Pansharpening. IEEE Trans. Geosci. Remote Sens. 2022, 60, 1–13. [Google Scholar]
  23. Liu, T.; Gong, M.; Lu, D.; Zhang, Q.; Zheng, H.; Jiang, F.; Zhang, M. Building Change Detection for VHR Remote Sensing Images via Local–Global Pyramid Network and Cross-Task Transfer Learning Strategy. IEEE Trans. Geosci. Remote Sens. 2022, 60, 1–17. [Google Scholar]
  24. Daudt, R.C.; Saux, B.L.; Boulch, A. Fully Convolutional Siamese Networks for Change Detection. In Proceedings of the 25th IEEE International Conference on Image Processing (ICIP), Athens, Greece, 7–10 October 2018; pp. 4063–4067. [Google Scholar]
  25. Peng, D.; Zhang, Y.; Guan, H. End-to-End Change Detection for High Resolution Satellite Images Using Improved UNet++. Remote Sens. 2019, 11, 1382. [Google Scholar]
  26. Zhang, C.; Yue, P.; Tapete, D.; Jiang, L.; Shangguan, B.; Huang, L.; Liu, G. A deeply supervised image fusion network for change detection in high resolution bi-temporal remote sensing images. Isprs J. Photogramm. Remote Sens. 2020, 166, 183–200. [Google Scholar]
  27. Simonyan, K.; Zisserman, A.J.C. Very Deep Convolutional Networks for Large-Scale Image Recognition. In Proceedings of the International Conference on Learning Representations (ICLR), San Diego, CA, USA, 7–9 May 2015; pp. 1–14. [Google Scholar]
  28. Fang, S.; Li, K.; Shao, J.; Li, Z. SNUNet-CD: A Densely Connected Siamese Network for Change Detection of VHR Images. IEEE Geosci. Remote Sens. Lett. 2022, 19, 1–5. [Google Scholar] [CrossRef]
  29. Chen, J.; Yuan, Z.; Peng, J.; Chen, L.; Huang, H.; Zhu, J.; Liu, Y.; Li, H. DASNet: Dual Attentive Fully Convolutional Siamese Networks for Change Detection in High-Resolution Satellite Images. IEEE J. Sel. Top. Appl. Earth Obs. Remote Sens. 2021, 14, 1194–1206. [Google Scholar] [CrossRef]
  30. Chen, H.; Qi, Z.; Shi, Z. Remote Sensing Image Change Detection with Transformers. IEEE Trans. Geosci. Remote Sens. 2022, 60, 1–14. [Google Scholar]
  31. Shi, Q.; Liu, M.; Li, S.; Liu, X.; Wang, F.; Zhang, L. A Deeply Supervised Attention Metric-Based Network and an Open Aerial Image Dataset for Remote Sensing Change Detection. IEEE Trans. Geosci. Remote Sens. 2022, 60, 1–16. [Google Scholar] [CrossRef]
  32. Hou, X.; Bai, Y.; Li, Y.; Shang, C.; Shen, Q. High-resolution triplet network with dynamic multiscale feature for change detection on satellite images. ISPRS J. Photogramm. Remote Sens. 2021, 177, 103–115. [Google Scholar]
  33. Zhang, M.; Liu, Z.; Feng, J.; Jiao, L.; Liu, L. Deep Siamese Network with Contextual Transformer for Remote Sensing Images Change Detection. In Proceedings of the Fifth International Conference on Intelligence Science (ICIS), Xi’an, China, 28–31 October 2022; pp. 193–200. [Google Scholar]
  34. Li, Y.; Yao, T.; Pan, Y.; Mei, T. Contextual Transformer Networks for Visual Recognition. IEEE Trans. Pattern Anal. Mach. Intell. 2022, 45, 1489–1500. [Google Scholar] [CrossRef]
  35. Wang, Q.; Wu, B.; Zhu, P.; Li, P.; Zuo, W.; Hu, Q. ECA-Net: Efficient Channel Attention for Deep Convolutional Neural Networks. In Proceedings of the IEEE/CVF Conference on Computer Vision Pattern Recognition (CVPR), Seattle, WA, USA, 13 June 2020–19 June 2020; pp. 11531–11539. [Google Scholar]
  36. Vaswani, A.; Shazeer, N.; Parmar, N.; Uszkoreit, J.; Jones, L.; Gomez, A.N.; Kaiser, Ł.; Polosukhin, I. Attention is all you need. In Proceedings of the 31st International Conference on Neural Information Processing Systems (NIPS), Long Beach, California, USA, 4–9 December 2017; pp. 6000–6010. [Google Scholar]
  37. Bromley, J.; Bentz, J.W.; Bottou, L.; Guyon, I.; LeCun, Y.; Moore, C.; Säckinger, E.; Shah, R. Signature Verification Using a "Siamese" Time Delay Neural Network. In Advances in Neural Information Processing Systems; MIT Press: Cambridge, MA, USA, 1993. [Google Scholar]
  38. Koch, G.; Zemel, R.; Salakhutdinov, R. Siamese Neural Networks for One-Shot Image Recognition. In Proceedings of the International Conference on Machine Learning (ICML) Deep Learning Workshop, Lille, France, 6–11 July 2015; Volume 2, pp. 1–8. [Google Scholar]
  39. Ronneberger, O.; Fischer, P.; Brox, T. U-Net: Convolutional Networks for Biomedical Image Segmentation. In Medical Image Computing and Computer-Assisted Intervention–MICCAI 2015: 18th International Conference, Munich, Germany, 5–9 October 2015, Proceedings, Part III 18; Springer International Publishing: Cham, Switzerland, 2015; pp. 234–241. [Google Scholar]
  40. He, K.; Zhang, X.; Ren, S.; Sun, J. Deep Residual Learning for Image Recognition. In Proceedings of the 2016 IEEE Conference on Computer Vision and Pattern Recognition (CVPR), Las Vegas, NV, USA, 27–30 June 2016; pp. 770–778. [Google Scholar]
  41. Shao, R.; Du, C.; Chen, H.; Li, J. SUNet: Change Detection for Heterogeneous Remote Sensing Images from Satellite and UAV Using a Dual-Channel Fully Convolution Network. Remote Sens. 2021, 13, 3750. [Google Scholar]
  42. Zheng, Z.; Wan, Y.; Zhang, Y.; Xiang, S.; Peng, D.; Zhang, B. CLNet: Cross-layer convolutional neural network for change detection in optical remote sensing imagery. Isprs J. Photogramm. Remote Sens. Environ. 2021, 175, 247–267. [Google Scholar]
  43. Zhang, M.; Shi, W. A Feature Difference Convolutional Neural Network-Based Change Detection Method. IEEE Trans. Geosci. Remote Sens. 2020, 58, 7232–7246. [Google Scholar] [CrossRef]
  44. Yang, L.; Chen, Y.; Song, S.; Li, F.; Huang, G. Deep Siamese Networks Based Change Detection with Remote Sensing Images. Remote Sens. 2021, 13, 3394. [Google Scholar]
  45. Jaderberg, M.; Simonyan, K.; Zisserman, A.; Kavukcuoglu, K. Spatial Transformer Networks. In Proceedings of the NIPS, Montreal, QC, Canada, 7–12 December 2015. [Google Scholar]
  46. Hu, J.; Shen, L.; Albanie, S.; Sun, G.; Wu, E. Squeeze-and-Excitation Networks. IEEE Trans. Pattern Anal. Mach. Intell. 2020, 42, 2011–2023. [Google Scholar] [CrossRef]
  47. Liu, Z.; Wang, L.; Wu, W.; Qian, C.; Lu, T. TAM: Temporal Adaptive Module for Video Recognition. In Proceedings of the IEEE/CVF International Conference on Computer Vision (ICCV), Montreal, QC, Canada, 10–17 October 2021; pp. 13688–13698. [Google Scholar]
  48. Li, X.; Wang, W.; Hu, X.; Yang, J. Selective Kernel Networks. In Proceedings of the IEEE/CVF Conference on Computer Vision Pattern Recognition (CVPR), Long Beach, CA, USA, 15–20 June 2019; pp. 510–519. [Google Scholar]
  49. Woo, S.; Park, J.; Lee, J.-Y.; Kweon, I.-S. CBAM: Convolutional Block Attention Module. In Proceedings of the ECCV, Munich, Germany, 8–14 September 2018. [Google Scholar]
  50. Du, W.; Wang, Y.; Qiao, Y. Recurrent Spatial-Temporal Attention Network for Action Recognition in Videos. IEEE Trans. Image Process. 2018, 27, 1347–1360. [Google Scholar]
  51. Huang, J.; Shen, Q.; Wang, M.; Yang, M. Multiple Attention Siamese Network for High-Resolution Image Change Detection. IEEE Trans. Geosci. Remote Sens. 2022, 60, 1–16. [Google Scholar]
  52. Guo, Q.; Zhang, J.; Zhu, S.; Zhong, C.; Zhang, Y. Deep Multiscale Siamese Network with Parallel Convolutional Structure and Self-Attention for Change Detection. IEEE Trans. Geosci. Remote Sens. 2022, 60, 1–12. [Google Scholar]
  53. Chen, H.; Shi, Z. A Spatial-Temporal Attention-Based Method and a New Dataset for Remote Sensing Image Change Detection. Remote Sens. 2020, 12, 1662. [Google Scholar] [CrossRef]
  54. Krizhevsky, A.; Sutskever, I.; Hinton, G.E. ImageNet classification with deep convolutional neural networks. Commun. ACM 2012, 60, 84–90. [Google Scholar]
  55. Szegedy, C.; Liu, W.; Jia, Y.; Sermanet, P.; Reed, S.E.; Anguelov, D.; Erhan, D.; Vanhoucke, V.; Rabinovich, A. Going deeper with convolutions. In Proceedings of the IEEE Conference on Computer Vision Pattern Recognition (CVPR), Boston, MA, USA, 7–12 June 2015; pp. 1–9. [Google Scholar]
  56. Dai, J.; Qi, H.; Xiong, Y.; Li, Y.; Zhang, G.; Hu, H.; Wei, Y. Deformable Convolutional Networks. In Proceedings of the IEEE International Conference on Computer Vision, Venice, Italy, 22–29 October 2017; pp. 764–773. [Google Scholar]
  57. Dosovitskiy, A.; Beyer, L.; Kolesnikov, A.; Weissenborn, D.; Zhai, X.; Unterthiner, T.; Dehghani, M.; Minderer, M.; Heigold, G.; Gelly, S.; et al. An Image is Worth 16x16 Words: Transformers for Image Recognition at Scale. arXiv 2021, arXiv:2010.11929. [Google Scholar]
  58. Hendrycks, D.; Gimpel, K. Gaussian Error Linear Units (GELUs). arXiv 2016, arXiv:1606.08415. [Google Scholar]
  59. Lebedev, M.A.; Vizilter, Y.V.; Vygolov, O.V.; Knyaz, V.A.; Rubis, A.Y. Change Detection in Remote Sensing Images Using Conditional Adversarial Networks. Int. Arch. Photogramm. Remote Sens. Spat. Inf. Sci. 2018, 422, 565–571. [Google Scholar] [CrossRef] [Green Version]
Figure 1. The architecture of the proposed DMMSTNet.
Remotesensing 15 00842 g001
Figure 2. The architecture of the feature extractor.
Remotesensing 15 00842 g002
Figure 4. The details of the ECA module.
Remotesensing 15 00842 g004
Figure 5. (a) The details of the MFF module. (b) The implementation of deformable convolution.
Remotesensing 15 00842 g005
Figure 6. (a) The details of the transformer module. (b) The details of the spatial attention module.
Remotesensing 15 00842 g006
Figure 7. Bitemporal images and ground truth maps from the LEVIR and the CCD datasets. The first row represents the image at Time1. The second row represents the image at Time2. The third row represents the ground truth map.
Remotesensing 15 00842 g007
Figure 8. Visualization on the LEVIR-CD dataset. (a) The images at time1. (b) The images at time2. (c) The ground truth. (d) The results of IFN. (e) The results of SNUNet. (f) The results of STANet. (g) The results of BiT. (h) The results of MSPSNet. (i) The results of DMMSTNet. The true positives are marked in white color, the true negatives are marked in black color, the false positives are marked in red color and the false negatives are marked in green color.
Remotesensing 15 00842 g008
Figure 9. Visualization results on the CCD dataset. (a) The images at time1. (b) The images at time2. (c) The ground truth. (d) The results of IFN. (e) The results of SNUNet. (f) The results of STANet. (g) The results of BiT. (h) The results of MSPSNet. (i) The results of DMMSTNet.
Remotesensing 15 00842 g009
Figure 10. Ablation Base1 experimental results on the LEVIR-CD dataset. (a) The images at time1. (b) The images at time2. (c) The ground truth. (d) The results of Base1. (e) The results of “Base1 + CoT”. (f) The results of “Base1 + Transformer”.
Remotesensing 15 00842 g010
Figure 11. Ablation Base1 experimental results on the CCD dataset. (a) The images at time1. (b) The images at time2. (c) The ground truth. (d) The results of Base1. (e) The results of “Base1 + CoT”. (f) The results of “Base1 + Transformer”.
Remotesensing 15 00842 g011
Figure 12. Ablation Base2 experimental results on the LEVIR-CD dataset. (a) The images at time1. (b) The images at time2. (c) The ground truth. (d) The results of Base2. (e) The results of “Base2 + ECA”. (f) The results of “Base2 + MFF”. (g) The results of DMMSTNet.
Remotesensing 15 00842 g012
Figure 13. Ablation Base2 experimental results on the CCD dataset. (a) The images at time1. (b) The images at time2. (c) The ground truth. (d) The results of Base2. (e) The results of “Base2 + ECA”. (f) The results of “Base2 + MFF”. (g) The results of DMMSTNet.
Remotesensing 15 00842 g013
Table 1. Numerical Results on LEVIR-CD Dataset.
MethodPre (%)Rec (%)F1 (%)IoU (%)OA (%)
IFN90.2580.2784.9773.8698.55
SNUNet91.6788.9690.2982.1199.04
STANet94.5483.9888.9580.1098.94
BiT89.2489.3789.3180.6898.92
MSPSNet90.9388.9789.9381.7298.99
DMMSTNet92.1189.5990.8383.2099.08
Table 2. Numerical Results on CCD Dataset.
MethodPre (%)Rec (%)F1 (%)IoU (%)OA (%)
IFN97.4686.9691.9185.0398.19
SNUNet92.0784.6488.2078.6997.33
STANet95.6193.8194.7089.9498.76
BiT96.0294.2995.1490.7498.86
MSPSNet95.6595.1195.3891.1798.91
DMMSTNet97.0296.1196.5693.3599.19
Table 3. Numerical Ablation Base1 Results on LEVIR-CD Dataset.
MethodPre (%)Rec (%)F1 (%)IoU (%)OA (%)
Base1 [40]88.8586.3187.5677.8798.75
Base1 + CoT92.1985.8688.9280.0598.79
Base1 + Transformer95.2683.8989.2280.5398.88
Table 4. Numerical Ablation Base1 Results on CCD Dataset.
MethodPre (%)Rec (%)F1 (%)IoU (%)OA (%)
Base1 94.9890.6692.7786.5198.33
Base1 + CoT97.0295.1796.0992.4899.11
Base1 + Transformer96.0194.9695.4891.3598.97
Table 5. Numerical Ablation Base2 Results on LEVIR-CD Dataset.
MethodPre (%)Rec (%)F1 (%)IoU (%)OA (%)
Base2 [33]90.2989.2589.7781.4498.96
Base2 + ECA92.2289.2790.7183.0099.07
Base2 + MFF92.5188.8490.6482.8899.06
DMMSTNet92.1189.5990.8383.2099.08
Table 6. Numerical Ablation Base2 Results on CCD Dataset.
MethodPre (%)Rec (%)F1 (%)IoU (%)OA (%)
Base296.8895.8196.3492.9499.14
Base2 + ECA97.1895.0696.1192.5199.09
Base2 + MFF96.9396.0296.4793.1899.17
DMMSTNet97.0296.1196.5693.3599.19
Disclaimer/Publisher’s Note: The statements, opinions and data contained in all publications are solely those of the individual author(s) and contributor(s) and not of MDPI and/or the editor(s). MDPI and/or the editor(s) disclaim responsibility for any injury to people or property resulting from any ideas, methods, instructions or products referred to in the content.

