Article

G-Rep: Gaussian Representation for Arbitrary-Oriented Object Detection

1
School of Engineering Science, University of Chinese Academy of Sciences, Beijing 100049, China
2
Peng Cheng Laboratory, Shenzhen 518055, China
3
Department of Computer Science and Engineering, Shanghai Jiao Tong University, Shanghai 200240, China
*
Author to whom correspondence should be addressed.
Remote Sens. 2023, 15(3), 757; https://doi.org/10.3390/rs15030757
Submission received: 18 December 2022 / Revised: 20 January 2023 / Accepted: 25 January 2023 / Published: 28 January 2023
(This article belongs to the Special Issue Oriented Object Detection in Aerial Image)

Abstract

:
Typical representations for arbitrary-oriented object detection tasks include the oriented bounding box (OBB), the quadrilateral bounding box (QBB), and the point set (PointSet). Each representation encounters problems that correspond to its characteristics, such as boundary discontinuity, square-like problems, representation ambiguity, and isolated points, which lead to inaccurate detection. Although many effective strategies have been proposed for various representations, there is still no unified solution. Current detection methods based on Gaussian modeling have demonstrated the possibility of resolving this dilemma; however, they remain limited to OBB. To go further, in this paper, we propose a unified Gaussian representation called G-Rep to construct Gaussian distributions for OBB, QBB, and PointSet, which achieves a unified solution to various representations and problems. Specifically, PointSet- or QBB-based object representations are converted into Gaussian distributions and their parameters are optimized using the maximum likelihood estimation algorithm. Then, three optional Gaussian metrics are explored to optimize the regression loss of the detector because of their excellent parameter optimization mechanisms. Furthermore, we also use Gaussian metrics for sampling to align label assignment and regression loss. Experimental results obtained on several publicly available datasets, such as DOTA, HRSC2016, UCAS-AOD, and ICDAR2015, show the excellent performance of the proposed method for arbitrary-oriented object detection.

1. Introduction

With the development of deep convolutional neural networks (CNNs), object detection, especially arbitrary-orientation object detection [1,2,3,4,5], has developed rapidly and a variety of methods have been proposed. Arbitrary-orientation object detection has a broad range of applications in various scenarios, such as the analysis of aerial images [6] and SAR images [7], scene text detection [8], industry and agriculture automation [9,10,11], facial recognition [12], and target detection in retail scenes [13].
Popular representations of the arbitrary-oriented object are divided into the oriented bounding box (OBB) [14], the quadrilateral bounding box (QBB) [15] and the point set (PointSet) [16]. Each of these representations encounters intrinsic challenges because of the properties of its definitions, which are summarized as follows and illustrated in Figure 1.
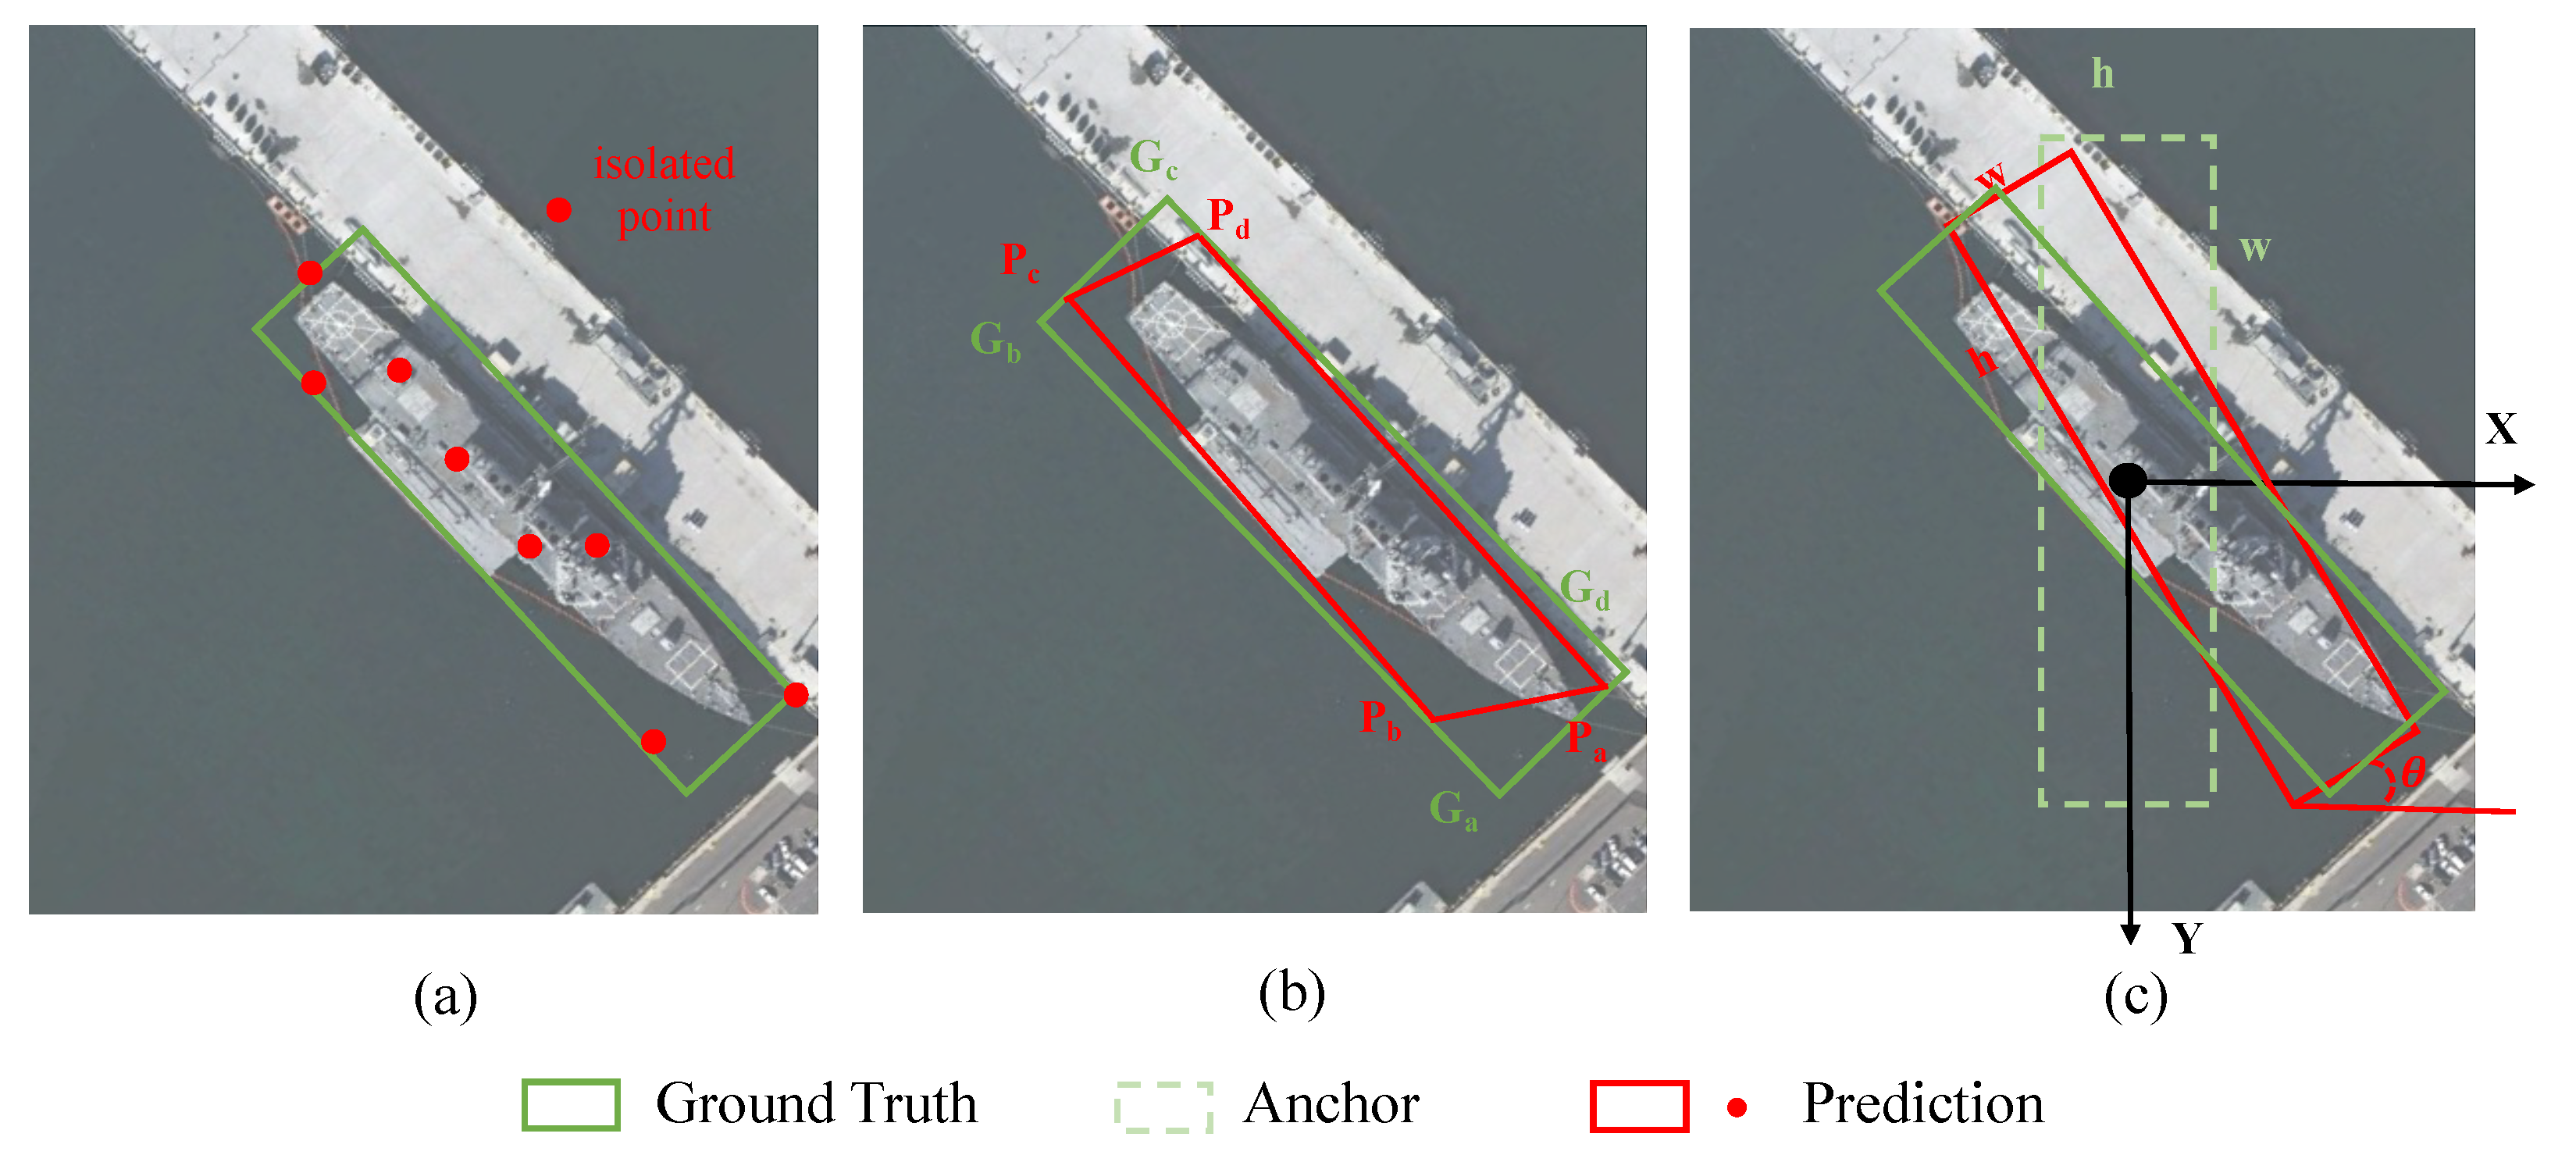
  • PointSet uses several individual points to represent the overall arbitrary-oriented object. The independent optimization between the points makes the trained detector very sensitive to isolated points, particularly for objects with large aspect ratios, because a slight deviation causes a sharp drop in the intersection-over-union (IoU) value. As shown in Figure 1a, although most of the points are predicted correctly, an outlier makes the final prediction fail. Therefore, the joint optimization loss (e.g., IoU loss [17,18,19]) based on the point set is more popular than the independent optimization loss (e.g., L n loss).
  • As a special case of PointSet, QBB is defined as the four corners of a quadrilateral bounding box. In addition to the inherent problems of PointSet described above, QBB also suffers from the representation ambiguity problem [15]. Quadrilateral detection often sorts the points first (as shown in Figure 1b, represented by the green box) to facilitate point matching between the ground-truth and prediction bounding boxes to calculate the final loss. Although the red prediction box in Figure 1b does not satisfy the sorting rule and obtains a large loss value accordingly using the L n loss, this prediction is correct according to the IoU-based evaluation metric.
  • OBB is the most popular choice for oriented object representation because of its simplicity and intuitiveness. However, the boundary discontinuity and square-like problem are obstacles to high-precision locating, as detailed in [5,20,21,22]. Figure 1c illustrates the boundary problem of OBB representation, considering the OpenCV acute angle definition ( θ [ π / 2 , 0 ) ) as an example [14]. The height (h) and width (w) of the box swap at the angle boundary, resulting in a sudden change in the loss value, which is coupled with the periodicity of the angle and makes regression difficult.
To improve detection performance, many researchers have proposed solutions for some issues, which mainly include the boundary discontinuity [3,20], square-like problem [21,23], representation ambiguity [15], and isolated points. For instance, in previous works [3,20], the authors aimed to solve the boundary discontinuity in OBB. DCL [21] dynamically adjusts the periodicity of loss weights through the aspect ratio to alleviate the square-like problem in OBB. RSDet [23] uses the modulated loss to smooth the boundary loss jump in both OBB and QBB. RIDet [15] uses the Hungarian matching algorithm to eliminate the representation ambiguity caused by the ordering of points in QBB. However, there is still no concise and unified solution to these problems because different solutions require different model settings.
Recent methods, such as GWD [5] and KLD [22], have broken the paradigm of existing regular regression frameworks from a unified regression loss perspective. Specifically, OBB is mapped to the Gaussian distribution using a matrix transformation, as shown in the upper left of Figure 2, and then robust Gaussian regression losses are designed. Although promising results have been achieved, the limitations of the OBB representation make them not truly unified solutions in terms of representation. Additionally, although several distances for the Gaussian distribution have been explored and devised as the regression losses, the metric for dividing positive and negative samples in label assignment (i.e, sample selection) has not been changed accordingly and IoU is still used.
In this paper, we aim to develop a fully unified solution to the problems that result from various representations. Specifically, the PointSet representation and its special cases, QBB, are converted into the Gaussian distribution, and the parameters of the Gaussian distribution are evaluated using the maximum likelihood estimation (MLE) algorithm [24]. Furthermore, three evaluation metrics are explored for computing the similarity of two Gaussian distributions, and Gaussian regression losses based on these metrics are designed. Accordingly, the selection of positive and negative samples is modified using the Gaussian metric by designing fixed and dynamic label assignment strategies. The entire pipeline is shown in Figure 2. The highlights of this paper are as follows:
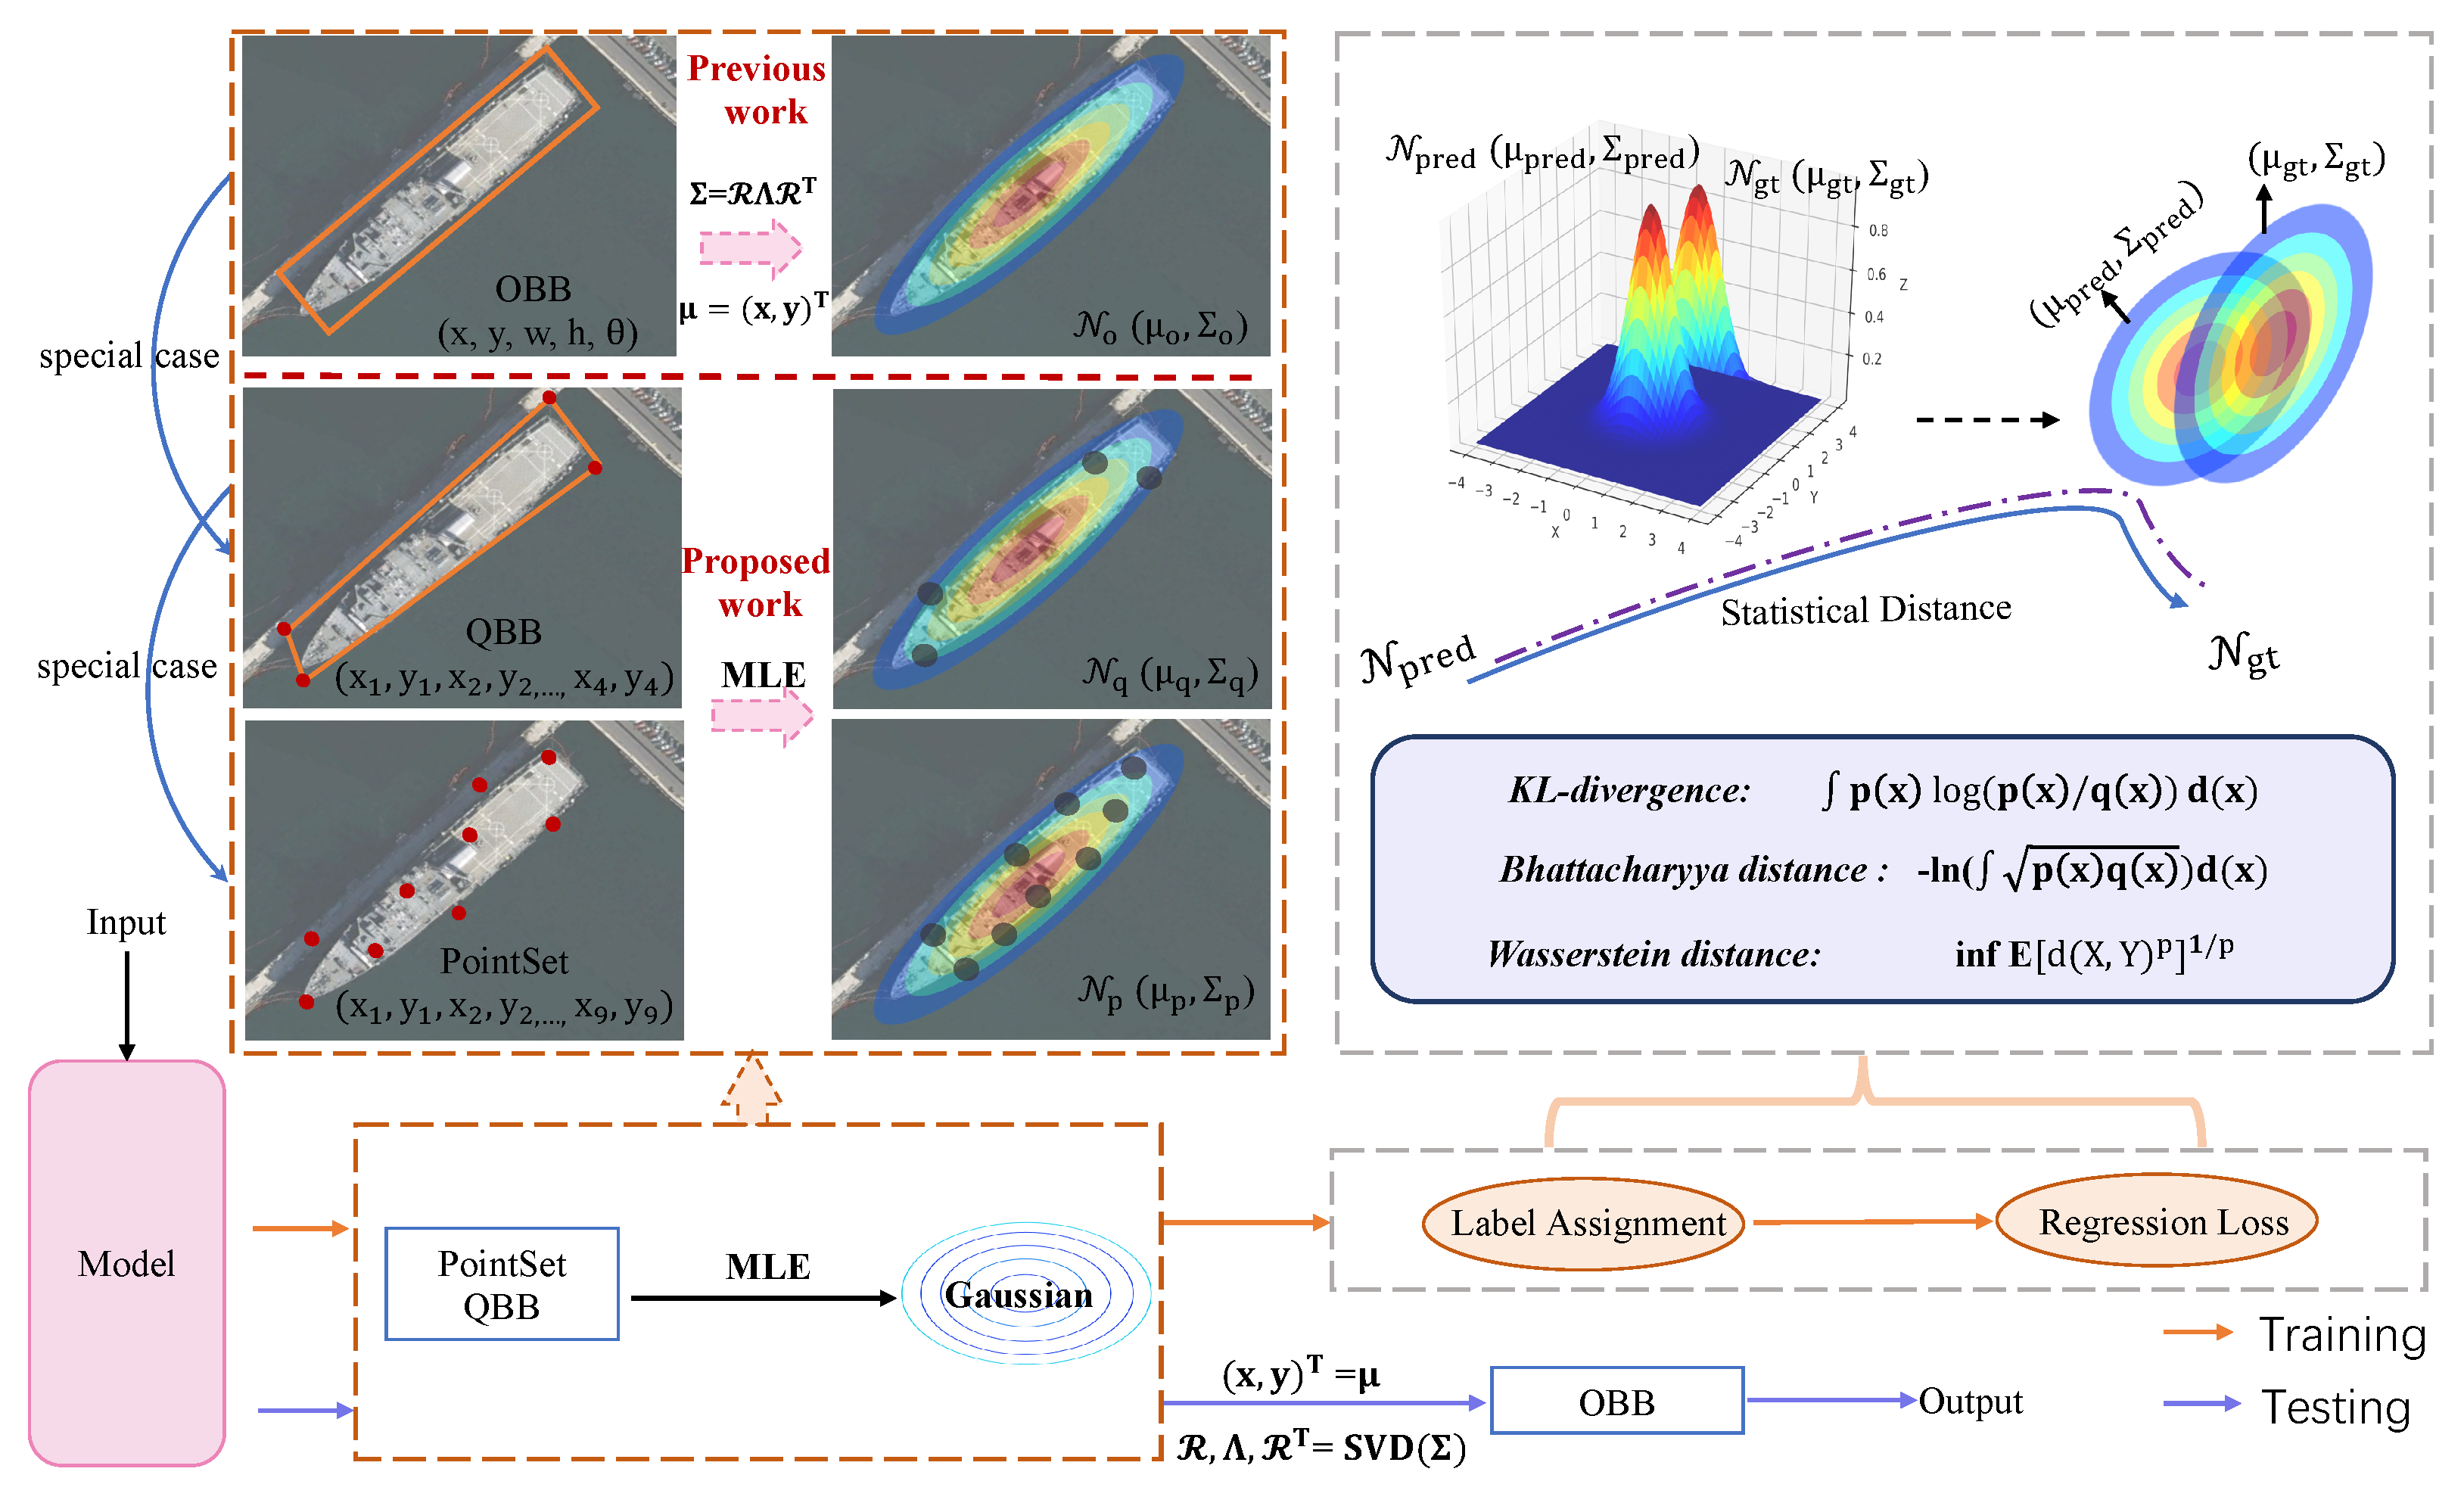
  • To uniformly solve the different problems introduced by different representations (OBB, QBB, and PointSet), Gaussian representation (G-Rep) is proposed to construct the Gaussian distribution using the MLE algorithm.
  • To achieve an effective and robust measurement for the Gaussian distribution, three statistical distances, the Kullback–Leibler divergence (KLD) [25], the Bhattacharyya distance (BD) [26], and the Wasserstein distance (WD) [27], are explored and corresponding regression loss functions are designed and analyzed.
  • To realize the consistency in measurement between sample selection and loss regression, fixed and dynamic label assignment strategies are constructed based on a Gaussian metric to further boost performance.
  • Extensive experiments were conducted on several publicly available datasets, e.g., DOTA, HRSC2016, UCAS-AOD, and ICDAR2015, and the results demonstrated the excellent performance of the proposed techniques for arbitrary-oriented object detection.

2. Related Work

2.1. Oriented Object Representations

The most popular representation of oriented object detection uses the five-parameter OBB, the IoU value as the metric in label assignment, and Smooth l 1 as the regression loss to regress the five parameters ( x , y , w , h , θ ) [2,3,4,14,20,23], where ( x , y ) , w, h, and θ denote the center coordinates, width, height, and angle of the box, respectively. Additionally, some researchers have proposed methods using an eight-parameter QBB to represent the object and Smooth l 1 as the regression loss to regress the four corner points of QBB [15,28]. The recent anchor-free method CFA [16] uses flexible PointSet (i.e., point set) to represent the oriented objects, inspired by the horizontal object detection method RepPoints [29]. In addition, other complex representations exist, such as polar coordinates [30,31] and middle lines [32]. In previous works, GWD [5] and KLD [22] transform OBB to Gaussian distribution, while GBB (Gaussian bounding box) [33] does not need to obtain a Gaussian representation underlying the OBB and can be seen as an elliptical intrinsic representation of the object. Moreover, GWD [5], KLD [22], and GBB [33] are all anchor-based methods. In this paper, G-Rep applies the Gaussian representation to the anchor-free method for the first time, converting irregularly distributed points into a Gaussian distribution. In addition, we design label assignment strategies based on Gaussian distance metrics. Compared with previous works, G-Rep is less computationally intensive, more accurate in its positioning, and achieves better performance.

2.2. Regression Loss in Arbitrary-Oriented Object Detection

The mainstream regression loss for OBB and QBB is Smooth l 1 , which encounters boundary discontinuity and square-like problems. To solve these problems, SCRDet [3] and RSDet [23] adopt the IoU–Smooth l 1 loss and modulated loss to smooth the boundary loss jump. CSL [20] and DCL [21] transform angular prediction from regression to classification. RIDet [15] uses the representation invariant loss to optimize the bounding box regression. Using the IoU value as the regression loss [17] has become a research topic of great interest in oriented object detection, which can avoid partial problems caused by the regression of the angle parameter or point ordering. Many variants of the IoU loss have subsequently been developed, such as GIoU [18], DIoU [19] and PIoU [13]. However, at the same time, the losses of IoU series suffer from infeasible optimization, slow convergence speed, and gradient vanishing in the case of non-overlapping bounding boxes. GWD [5] and KLD [22] construct the Gaussian distribution for OBB, which overcomes the dilemma of object detection and demonstrates the possibility of a unified solution for various issues. However, the aforementioned two works are limited to OBB representation and are not truly unified solutions in terms of representation.

2.3. Label Assignment Strategies

Label assignment plays a vital role in detection performance, and many fixed and dynamic label assignment strategies have been proposed. Classic object detection methods, such as Faster RCNN (region-based convolutional neural network) [34] and RetinaNet [35], adopt a fixed maximum IoU strategy, which requires predefined thresholds for positive and negative samples in advance. To overcome the difficulty in setting hyper-parameters, ATSS (adaptive training sample selection) [36] uses statistical characteristics to calculate dynamic IoU thresholds. Furthermore, PAA (probabilistic anchor assignment) [37] adaptively separates anchors into positive and negative samples for a ground-truth bounding box in a probabilistic manner. Additionally, other excellent dynamic label assignment strategies exist. For instance, DAL (dynamic anchor learning) [38] dynamically assigns labels according to a defined matching degree, and FreeAnchor [39] dynamically selects labels under the maximum likelihood principle. Nevertheless, these methods still rely on the IoU value as the main indicator to evaluate the quality of the sample.
In addition, some excellent works focus on optimized models to improve detection results. For example, Wang et al. [40] proposed an adaptive feature-aware method, which performs brilliantly in real-time object detection tasks. Wang et al. [41] proposed an absorption pruning method for the object detection network in remote-sensing images. Tong et al. [42] designed a compound semantic feature fusion method to generate an effective semantic description for better pixel-wise object center point interpretation. Ma et al. [43] proposed a feature split–merge–enhancement network (SME-Net) to handle objects with significant scale differences. Yu et al. [44] considered the spatial distribution property of objects to generate higher-quality candidate bounding boxes. Li et al. [45] proposed a meta-learning-based method for few-shot object detection on remote-sensing images. Although the above research efforts have advanced the development of object detection, the study of object representation has not received sufficient attention.

3. Proposed Method

The three main contributions of this paper are as follows: First, Gaussian distribution is constructed for PointSet and QBB representation, which overcomes the dilemma shown in previous studies [5,22] that the Gaussian distribution can only be applied to OBB. Second, new regression loss functions are designed and analyzed for supervising network learning based on the Gaussian distribution. Third, the measurement between label assignment and loss regression based on the Gaussian distribution is aligned, and the new fixed and dynamic label assignment strategies are designed accordingly.
Figure 2 shows an overview of the proposed method. In the training phase, the predicted bounding box and ground truth box are converted into the Gaussian distributions in a manner according to their respective representations. For example, the MLE algorithm is used for the boxes in PointSet or QBB representation [46], and the OBB uses the matrix conversion described in [5], or is converted to QBB and then uses the MLE algorithm. Then, the devised fixed or dynamic G-Rep label assignment strategy is used to select samples based on Gaussian distance metrics (KLD, BD, or WD). Finally, regression loss functions based on the Gaussian distance metrics are designed to minimize the distance between two Gaussian distributions. In the testing phase, the output in OBB form is obtained from the trained model, which is constructed based on the unified Gaussian representation.

3.1. Object Representation Based on Gaussian Distribution

PointSet. RepPoints [29] is an anchor-free method, which is also a baseline method used in this paper. It is constructed with a backbone network, an initial detection head and a refined detection head. The object is represented as a set of adaptive sample points (i.e., PointSet) and the regression framework adopts deformable convolution [47] for point learning. The object is represented as PointSet R, which is defined as:
R = x i , y i i = 1 K ,
where x i , y i are the coordinates of the i-th point and K is the number of points in a point set, set to nine by default according to [29], which is a trade-off between performance and efficiency. In the refined detection head, the model predicts offset ( Δ x i , Δ y i ) for refinement, and the new refined predicted point set can be simply expressed as:
R = x i + Δ x i , y i + Δ y i i = 1 K .
QBB. The baseline with QBB representation is constructed on the anchor-based method Cas-RetinaNet proposed in [15], which contains a backbone network and two detection heads. QBB is defined as the four corner points of the object ( Q = x i q , y i q i = 1 4 ). Note that the four corner points of QBB must be sorted in advance to match the corners of the given ground truth representation one-to-one for regression in the original QBB baseline. Additionally, from the definitions of the three representations, we can deduce that QBB can be regarded as a special case of PointSet, and OBB can be regarded as a special case of QBB. Therefore, constructing the Gaussian distribution for PointSet is extremely generalized, which is also the major focus of this paper.
Transformation between PointSet/QBB and G-Rep. Considering ( x i , y i ) as a two-dimensional (2-D) variable x i , its probability density under the Gaussian distribution N ( μ , Σ ) is defined as
N x i μ , Σ = exp 1 2 x i μ T Σ 1 x i μ 2 π det Σ .
The mean value μ and covariance matrix Σ of the Gaussian distribution are calculated using the maximum likelihood estimation (MLE) algorithm [46].
Figure 3 illustrates the Gaussian learning process based on PointSet. The MLE algorithm evaluates the parameters of the Gaussian distribution for the initialized PointSet. The coordinates of the points are updated according to the gradient feedback of the loss and the Gaussian parameters are updated correspondingly.
Transformation between OBB and G-Rep. In previous studies, such as [5], a 2-D Gaussian distribution for OBB is constructed by a matrix transformation. There are two Gaussian transformation methods adopted in this paper: MLE and matrix transformation. The former can be used for the conversion of all representations (OBB/QBB/PointSet), but is inefficient and inaccurate. The latter is more precise, but only supports OBB. Therefore, when transforming ground truth, matrix transformation is chosen to avoid unnecessary bias.
The transformation from a Gaussian distribution to an OBB is necessary for calculating the mean average precision (mAP) in the testing process. As shown in Figure 2, prediction (QBB or PointSet) is obtained in the testing process. Because network learning is supervised based on the object Gaussian distribution, the prediction of the network output is also distributed in the form of the object Gaussian distribution. Therefore, it is necessary to convert the prediction (PointSet or QBB) into the Gaussian distribution, whose parameters are calculated using the MLE algorithm [46]. To go further, the OBB of the predicted object is obtained from the Gaussian distribution. For a predicted Gaussian distribution where μ and Σ are known, the parameters of the corresponding OBB ( x , y , w , h , θ ) can also be obtained using the singular value decomposition (SVD) through a matrix transformation [5].

3.2. Gaussian Distance Metrics

The keystone of an effective regression loss and label assignment is how to compute the similarity between the predicted Gaussian distribution N p x p μ p , Σ p and the ground-truth Gaussian distribution N g x g μ g , Σ g . Next, we will focus on three metrics to calculate the distance between two Gaussian distributions and further analyze their characteristics.
Kullback–Leibler Divergence (KLD) [25]. The KLD between two Gaussian distributions is defined as
D K N g , N p = 1 2 ( tr Σ p 1 Σ g + ln Σ p Σ g 2 + μ p μ g Σ p 1 μ p μ g ) .
Although KLD is not strictly a mathematical distance because it is asymmetric, it is scale-invariant. According to Equation (4), each item of KLD contains shape parameters Σ and center parameters μ . All parameters form a chain coupling relationship and influence each other, which is very conducive to high-precision detection, as demonstrated in previous work [22].
Bhattacharyya Distance (BD) [26]. The BD between two Gaussian distributions is defined as
D B N g , N p = 1 8 μ g μ p T Σ 1 μ g μ p + 1 2 ln Σ Σ g Σ p ,
where Σ = 1 2 Σ p + Σ g . Although BD is symmetric, it is not an actual distance either, because it does not satisfy the triangle inequality. Similar to KLD, BD is also scale-invariant.
Wasserstein Distance (WD) [27]. The WD between two Gaussian distributions is defined as
D W N g , N p = μ p μ q 2 + Tr Σ p + Tr Σ q 2 Tr Σ p 1 / 2 Σ q Σ p 1 / 2 1 / 2 .
Different from KLD and BD, WD is an actual mathematical distance, which satisfies the triangle inequality and is symmetric. Note that WD is mainly divided into two parts: the distance between the center points ( x , y ) and the coupling terms about h, w, and θ . Although WD can greatly improve the performance of high-precision rotation detection because of the coupling between parts of the parameters, the independent optimization of the center point slightly shifts the detection result [22]. Note that the above-mentioned Gaussian distance metrics are all in the range [ 0 , + ) , making them unsuitable for direct use in both regression loss and label assignment strategy. The normalization design for the three metrics is discussed in the following sections.

3.3. Regression Loss Based on Gaussian Metric

The actual value obtained by the distance metric between Gaussian distributions is too large to be the regression loss, which leads to convergence difficulties. Therefore, normalization is necessary so that the Gaussian distance can be used as the regression loss. To find appropriate normalized functions for the regression loss, we first set a general form of the function for KLD, BD and WD, which is defined as
L reg = 1 1 λ + f ( D N g , N p ) ,
where λ is the normalization factor and f ( ) is the normalization function. The actual λ and f ( ) are chosen according to the experiments described in Section 4.2. D N g , N p refers to the three Gaussian metrics, which are defined in Equations (4)–(6), respectively.
Recall that the most common regression loss for object detection is the Smooth l 1 loss. The Smooth l 1 loss independently minimizes each parameter of the prediction. Taking the OBB as an example, the center point ( x , y ) , the width w, the height h, and the angle θ are optimized separately. In fact, different objects have different sensitivities to different parameters. For instance, objects with large aspect ratios are sensitive to angle error. Hence, the decoupled regression approach has difficulty handling various objects with diverse shapes. For different representations, the Smooth l 1 loss suffers from different issues, as illustrated in Figure 1. By contrast, all three Gaussian metric-based regression losses avoid issues of boundary discontinuity, square-like problems, representation ambiguity, and isolated points. Among them, WD is strictly the actual distance because of its triangle equality and symmetry, whereas KLD is asymmetric and BD satisfies the triangle inequality. Although the three proposed regression loss functions have different characteristics, the overall difference in detection performance is slight and all are superior to the traditional Smooth l 1 or IoU loss.

3.4. Label Assignment Based on Gaussian Metric

Label assignment strategy is another key task for object detection. The most popular label assignment strategy is the IoU-based strategy, which assigns a label by comparing IoU values (proposals and ground truth) with the IoU threshold. However, if the regression loss is based on a Gaussian distribution, inconsistencies can occur when the metrics of label assignment and regression loss are different. Therefore, new label assignment strategies based on the Gaussian distribution are devised. To go further, dynamic label assignment strategies with better adaptability and fewer hyper-parameters are also designed for G-Rep.
Fixed G-Rep Label Assignment. The range of the IoU value is 0 , 1 according to the definition of IoU, and the threshold values are selected empirically in the range 0.3 , 0.7 . However, this strategy is clearly not applicable to the Gaussian distribution distance calculated by the three metrics described in Section 3.2, whose value ranges are not closed intervals. Along with the concept of G-Rep regression loss design, normalized functions for each distance evaluation metric are adopted. The general form of the normalized metric for KLD, BD, and WD used in the label assignment process is defined as
S la = 1 α + [ D N g , N p ] β ,
where S denotes the normalized metric for evaluating the similarity between the Gaussian distribution of a proposal and the ground truth, and α and β are normalization factors whose values are selected based on the experiments described in Section 4.2. The optimal hyper-parameters require empirical and experimental optimization. A series of experiments were conducted with a unified positive threshold of 0.4 and a negative threshold of 0.3, respectively. The results are listed in Table 4, where rows 2–4 demonstrate that optimal hyper-parameter thresholds are difficult to set for different distance metrics; hence, dynamic label assignment strategies based on a Gaussian are further explored.
Dynamic G-Rep Label Assignment. Dynamic G-Rep label assignment strategies are devised based on the three distance metrics in Section 3.2 to avoid the difficulty of selecting the optimal hyper-parameters. Inspired by ATSS [36], the threshold for selecting positive and negative samples is calculated dynamically according to the statistical characteristics of all the normalized distances (calculated in Equation (8)). For the i-th ground truth, the dynamic threshold T is calculated as
T i = 1 J j = 1 J I i , j + 1 J j = 1 J ( I i , j 1 J j = 1 J I i , j ) 2 ,
where J is the number of candidate samples, and I i , j is the normalized value of KLD, BD, or WD between the i-th ground truth and the j-th proposal, which is calculated in Equation (8). Next, positive samples are selected using the general assignment strategy; that is, candidates are selected whose similarity values are greater than or equal to the threshold T i .
Furthermore, motivated by PAA [37], another approach using Gaussian distributions in the label assignment process is adopted in this paper. Specifically, each sample is assigned a score for quality evaluation. The Gaussian mixture model (GMM) with two components is adopted to model the score distribution of samples, and the parameters of the GMM are calculated using the expectation-maximization algorithm [24]. Finally, samples are assigned labels according to their probabilities. PAA and ATSS are modified and combined to construct the robust dynamic label assignment strategy PATSS in the proposed method.

4. Experiments

4.1. Datasets and Implementation Details

Experiments were conducted on the public aerial image datasets DOTA [48], HRSC2016 [49], UCAS-AOD [50], and scene text dataset ICDAR2015 [51] to verify the superiority of the proposed method.
DOTA [48] is a public benchmark dataset for oriented object detection in aerial images, which contains 15 object categories: plane (PL), baseball diamond (BD), bridge (BR), ground track field (GTF), small vehicle (SV), large vehicle (LV), ship (SH), tennis court (TC), basketball court (BC), storage tank (ST), soccer ball field (SBF), roundabout (RA), harbor (HA), swimming pool (SP), and helicopter (HC). In the experiments, DOTA’s official training and validation dataset sets were selected as the training set, whose images were split into blocks of 1024 × 1024 pixels with an overlap of 200 pixels and scaled to 1333 × 1024 for training.
HRSC2016 [49] is a public aerial image dataset for ship detection. The number of images in the training, validation, and testing sets are 436, 181 and 444, respectively.
The public aerial image dataset UCAS-AOD [50] is another multi-class oriented object detection dataset, and contains two categories: car and airplane.
ICDAR2015 [51] is commonly used for oriented scene text detection and spotting. This dataset contains 1000 training images and 500 testing images.
Experiments were conducted using the MMDetection framework [52] (under the Apache-2.0 License) on 2 Titan V GPUs with 11GB memory. Two baselines of RepPoints with PointSet and Cas-RetinaNet with QBB were defined.
The optimizers of the RepPoints and Cas-RetinaNet frameworks were SGD with a 0.01 initial learning rate and Adam with a 0.0001 initial learning rate, respectively.
The framework for the RepPoints baseline was trained for 12 and 36 epochs on DOTA and HRSC2016 for the ablation experiments, and 40, 80, 120 and 240 epochs on DOTA, HRSC2016, UCAS-AOD and ICDAR2015 with data augmentation, respectively. The framework for the Cas-RetinaNet baseline was trained for 12, 100, 36 and 100 epochs on DOTA, HRSC2016, UCAS-AOD and ICDAR2015, respectively.
The mAP was adopted as an evaluation metric for testing results on DOTA, HRSC2016 and UCAS-AOD. Precision, recall, and F-measure (i.e., F1) were adopted on ICDAR2015, following official criteria.

4.2. Normalized Function Design

The design principle of the normalized factors for regression loss and label assignment is mapping the calculated values of the Gaussian statistical distance to the values in a suitable range. Experiments were conducted to explore the selection of normalization factors and functions mentioned in Equations (7) and (8), the results of which are listed in Table 1. For the regression loss function, λ was chosen from { 0 , 1 , 2 } , and the normalization function f ( ) was selected from several frequently-used functions, such as log ( ) , e * and a . For label assignment strategy, α was selected from { 1 , 2 } , and β was selected from { 0.5 , 1 , 1.5 , 2 } . The results in Table 1 show that the specific design of the normalized functions had a significant impact on the detection accuracy. Compared with exponential functions, logarithmic functions and power functions are more suitable for regression loss design. Note that the three Gaussian metrics have different mathematical properties, so that we applied different normalization factors and functions on different metrics in our experiments. Finally, the appropriate normalized functions were selected according to the best results of the experiments (the rows indicated by the bold “mAP” values in Table 1).

4.3. Ablation Study

Table 2 compares the performance of the G-Rep and PointSet on the DOTA dataset. “IoU (Max)” and “IoU (ATSS)” represent the fixed predefined threshold strategy and dynamic ATSS [36] label assignment strategy based on the IoU metric, respectively. The baseline method of PointSet is RepPoints [29] with ResNet50-FPN [53,54]. Note that the IoU for the Gaussian distribution was calculated as the IoU between the box transformed by the Gaussian distribution and ground truth. The predefined positive and negative thresholds in the fixed strategy for IoU and S KLD were 0.4 and 0.3, respectively. The superiority of G-Rep was reflected in two ways: regression loss and label assignment.
Analysis of regression loss based on G-Rep. Even if only the GIoU was replaced by L KLD , the performance of G-Rep was better than that of PointSet (64.63% vs. 63.97%). The dynamic label assignment strategies avoid the influence of unsuitable hyper-parameters for a fair comparison of the GIoU and Gaussian regression loss. Additionally, the superiority of G-Rep was clearly demonstrated when the dynamic label assignment strategies were used. L KLD still surpassed the GIoU with the same dynamic label assignment strategy ATSS on DOTA (70.45% vs. 68.88%).
Analysis of label assignment based on G-Rep. The label assignment strategy is another important factor for high detection performance. For the L KLD loss, Table 2 shows the detection results of the different label assignment strategies. Using KLD resulted in better performance than using IoU as a metric of the label assignment, which demonstrates the effectiveness of aligning the label assignment and regression loss metrics. The optimal fixed negative and positive thresholds for selecting samples are difficult to select, whereas dynamic label assignment strategies avoid this issue. PATSS denotes the combination of the ATSS [36] and PAA [37] strategies. The mAP further reached 70.45% and 72.08% under the more robust dynamic selection strategies ATSS and PATSS, respectively. Without additional features, the combination of the dynamic label assignment strategy and regression loss increased the mAP by 8.11% compared with the baseline method.
Analysis of the advantages for an object with a large aspect ratio. Outliers often cause more serious location errors for objects with large aspect ratios than for square objects. Table 3 shows that G-Rep was more effective than PointSet for the objects with a large aspect ratio, where the mAP increased by 6.18% for the five typical categories with narrow objects on DOTA because G-Rep was not sensitive to isolated points.
Comparison of different Gaussian distance metrics.Table 4 compares the performances when different evolution metrics, KLD, WD and BD, were used in fixed and dynamic label assignment strategies and regression loss. The performances based on fixed label assignment strategies varied greatly as a result of the hand-crafted hyper-parameters. Therefore, experiments based on dynamic label assignment strategies were constructed to objectively compare the performances of the metrics. The experimental results demonstrate that the overall performance of the G-Rep loss functions surpassed that of the GIoU loss. There were tolerable performance differences between BD and the other two losses, and a slight difference (within 0.5%) between KLD and WD. To further explore whether KLD and WD are more suitable as the regression loss than BD, the label assignment metrics were unified as KLD (rows 5, 8 and 9) for the ablation study of the loss functions. In fact, all three G-Rep losses outperformed the baseline (RepPoints) [29]. There were slight differences between them in detection performance.
Table 4. Comparison of the three Gaussian distances as metrics for label assignment and regression loss on HRSC2016.
Rep. S L mAP (%)
PointSetIoU (ATSS)GIoU78.07
G-Rep S KLD (Max) L KLD 73.44
S BD (Max) L BD 46.71
S WD (Max) L WD 84.39
S KLD (ATSS) L KLD 88.06
S BD (ATSS) L BD 85.32
S WD (ATSS) L WD 88.56
S KLD (ATSS) L BD 88.90
S KLD (ATSS) L WD 88.80
S BD (ATSS) L KLD 85.32
S BD (ATSS) L WD 85.28
Ablation study on various datasets.Table 5 shows the experimental results of G-Rep using two baselines on various datasets. The QBB baseline adopted the anchor-based method Cas-RetinaNet [15] (i.e., the cascaded RetinaNet [35]). G-Rep resulted in varying degrees of improvement on the anchor-based baseline with QBB and the anchor-free baseline with PointSet on various datasets.
There are three key aspects to these results:
  • Elongated objects. On the datasets containing a large number of elongated objects (e.g., HRSC2016, ICDAR2015), the improvement in G-Rep applied to PointSet was more pronounced than that applied to QBB, as shown in Table 3, mainly because the greater the number of points, the more accurate the Gaussian distribution obtained, and, thus, the more accurate the representation of the elongated object.
  • Size of dataset. The performance on the small datasets (e.g., UCAS-AOD) tended to be saturated, so the improvement was relatively small.
  • High baseline. Models with a high-performance baseline were hard to improve significantly (e.g., HRSC2016-QBB, DOTA-PointSet).

4.4. Time Cost Analysis

Table 6 compares the time cost of G-Rep and the other two methods. Since their parameters are the same, the main difference during inference lies in the post-processing. Although MLE slowed down the inference speed, G-Rep achieved a performance improvement of 5.17% over baseline, which was worthwhile. In addition, G-Rep achieved better performance with fewer parameters based on RepPoints (anchor-free) compared to S 2 ANet (anchor-based).

4.5. Comparison with Other Methods

The performance of the proposed method was compared with that of other state-of-the-art detection methods on the DOTA dataset, which is a benchmark aerial image dataset for multi-class oriented object detection. The experimental results are shown in Table 7, where R-50/101, RX-101, D-53, H-104 and Swin-T denote ResNet-50/101 [53], ResNeXt-101 [55], DarkNet53 [56], Hourglass-104 [57], and Swin-Transformer [58], respectively.
The results in Table 7 show that the one-stage methods exhibited a trend of outperforming the two-stage methods, and the G-Rep based on the anchor-free method RepPoints achieved the state-of-the-art performance. With the excellent backbone Swin-T [58] and some common tricks, such as data augmentation, G-Rep achieved 80.16% mAP on the DOTA dataset. In addition, the results showed that G-Rep performed better on some object categories with large aspect ratios (e.g., BR, LV, and HC). Based on the anchor-free baseline, G-Rep was superior to the anchor-free method ACE [68] 8.64% mAP. G-Rep is a pioneering new paradigm in oriented object detection.
To further verify the effectiveness of the proposed method and compare it with other state-of-the-art detectors, a series of experiments were conducted on HRSC2016 and UCAS-AOD. The results are shown in Table 8 and Table 9, respectively. The results demonstrate that the models using G-Rep achieved state-of-the-art performance. Although DCL [21] achieved the same performance as G-Rep (PointSet) on the ship detection dataset HRSC2016, G-Rep did not require preset anchors and required fewer hyper-parameters and computations, proving the robustness of G-Rep. Table 9 shows that G-Rep (PointSet) achieved 0.93% and 0.54% higher mAP than RIDet (OBB) and RIDet (QBB) [15], respectively, indicating the superiority of using Gaussian representation for objects.
To further demonstrate the generalizability of G-Rep, we also conducted some extended experiments on the oriented text detection dataset ICDAR2015. The experimental results are listed in Table 10. Precision, recall and the F-measure were used as the evaluation metrics following the official criteria of the ICDAR2015 dataset. The experimental results showed that G-Rep (PointSet) outperformed the one-stage method RO 3 D [72] and the two-stage method SCRDet [3] on recall and the F-measure, demonstrating the universality and superior performance of G-Rep.

4.6. Visualization Analysis

Figure 4 visualizes the detection results of PointSet and G-Rep on HRSC2016. The points of PointSet were distributed at the boundary of objects, while the points of the G-Rep were distributed in the interior of the object. Therefore, G-Rep is superior in terms of accurate localization and is not sensitive to outliers.
More visualization examples of the experimental results on DOTA and UCAS-AOD datasets are shown in Figure 5 and Figure 6. The visualization results show that points of G-Rep were concentrated in the interior of the object, which is a relatively accurate localization of the object. The points of PointSet, on the other hand, focused on the boundaries of the object, which can easily cause deviations in localization. These visualization results of different kinds of objects on different datasets are sufficient to demonstrate the superiority of G-Rep.

4.7. More Discussion

Although the proposed method provides a uniform representation of the Gaussian distribution for various representations of the input, an obvious limitation is that the format of the output can only be OBB. The output points are dispersed as the Gaussian distribution inside the object, and OBB is transformed from the Gaussian distribution of the output points. Additionally, the angle prediction of the square-like object transformed by the isotropic Gaussian is inaccurate. Note that the irregular PointSet and QBB representations are more accurate than the OBB representation for most objects. However, for some square-like regular objects, OBB representation is more accurate than PointSet and QBB representations.

5. Conclusions

The main contribution of this study is that G-Rep was proposed to construct the Gaussian distribution on PointSet and QBB, which overcame the limitation of Gaussian applications for current object detection methods and achieved a truly unified solution. Additionally, various label assignment strategies for the Gaussian distribution were designed, and the metrics were aligned between label assignment and regression loss. Through extensive experiments, G-Rep was demonstrated to be effective in many areas, including:
  • G-Rep uses Gaussian representation to alleviate the challenges posed by other common representations. The experimental results in Table 5 show that G-Rep resulted in a substantial increase of up to 9.99% of mAP on the HRSC2016 dataset when applied to PointSet.
  • G-Rep uses the normalized Gaussian distance for the regression loss function and a label assignment strategy instead of the IoU-based metric, which resulted in significant increases in mAP, up to 3.20% on the DOTA dataset and 11.07% on the HRSC2016 dataset, as shown in Table 2.
  • G-Rep utilizes a Gaussian distribution to guide the regression of points in PointSet and QBB, which makes the detection results less sensitive to outliers and more accurate for elongated objects. As shown in Table 3, G-Rep resulted in a 6.18% improvement in mAP for elongated objects on the DOTA dataset.
More importantly, G-Rep resolves the current dilemma and provides inspiration for exploring other forms of label assignment strategies and regression loss functions. However, despite the effectiveness of G-Rep, additional matrix transformations resulting from Gaussian representation may slow down the inference speed, and the loss of directional information caused by the isotropic Gaussian distribution can slightly reduce the detection accuracy for square-like objects. The above limitations will be investigated further in future work.

Author Contributions

Conceptualization, L.H., X.Y. and J.X.; methodology, L.H., K.L. and X.Y.; software, L.H. and Y.L.; validation, L.H., J.X. and K.L.; formal analysis, L.H. and Y.L.; investigation, L.H. and Y.L.; resources, K.L. and J.X.; data curation, L.H. and Y.L.; writing—original draft preparation, L.H.; writing—review and editing, J.X.; visualization, L.H.; supervision, K.L. and J.X.; project administration, J.X.; funding acquisition, K.L. and J.X. All authors have read and agreed to the published version of the manuscript.

Funding

This research was funded by the National Natural Science Foundation of China grant numbers 61731022, 61871258, 61929104 and U21B2049, the NSFC Key Projects of International (Regional) Cooperation and Exchanges grant number 61860206004, and the Key Project of Education Commission of Beijing Municipal grant number KZ201911417048.

Data Availability Statement

Four publicly available datasets, including DOTA, HRSC2016, UCAS-AOD and ICDAR2015, were analyzed in this study. The DOTA dataset can be found at https://captain-whu.github.io/DOTA (accessed on 1 December 2019); the HRSC2016 dataset can be found at https://aistudio.baidu.com/aistudio/datasetdetail/31232 (accessed on 15 December 2020); the ICDAR2015 dataset can be found at https://iapr.org/archives/icdar2015/index.html%3Fp=254.html (accessed on 12 November 2021) and https://aistudio.baidu.com/aistudio/datasetdetail/46088 (accessed on 12 November 2021); the UCAS-AOD dataset can be found at https://hyper.ai/datasets/5419 (accessed on 15 October 2021).

Conflicts of Interest

The authors declare no conflict of interest.

References

  1. Azimi, S.M.; Vig, E.; Bahmanyar, R.; Körner, M.; Reinartz, P. Towards multi-class object detection in unconstrained remote sensing imagery. In Proceedings of the Asian Conference on Computer Vision, Perth, Australia, 4–6 December 2018; Springer: Berlin/Heidelberg, Germany, 2018; pp. 150–165. [Google Scholar]
  2. Ding, J.; Xue, N.; Long, Y.; Xia, G.S.; Lu, Q. Learning RoI Transformer for Oriented Object Detection in Aerial Images. In Proceedings of the IEEE Conference on Computer Vision and Pattern Recognition, Long Beach, CA, USA, 16–20 June 2019; pp. 2849–2858. [Google Scholar]
  3. Yang, X.; Yang, J.; Yan, J.; Zhang, Y.; Zhang, T.; Guo, Z.; Sun, X.; Fu, K. Scrdet: Towards more robust detection for small, cluttered and rotated objects. In Proceedings of the IEEE International Conference on Computer Vision, Seoul, Republic of Korea, 27 October–2 November 2019; pp. 8232–8241. [Google Scholar]
  4. Yang, X.; Yan, J.; Feng, Z.; He, T. R3Det: Refined Single-Stage Detector with Feature Refinement for Rotating Object. AAAI Conf. Artif. Intell. 2021, 35, 3163–3171. [Google Scholar] [CrossRef]
  5. Yang, X.; Yan, J.; Qi, M.; Wang, W.; Xiaopeng, Z.; Qi, T. Rethinking Rotated Object Detection with Gaussian Wasserstein Distance Loss. In Proceedings of the International Conference on Machine Learning, Virtual Event, 18–24 July 2021. [Google Scholar]
  6. Han, J.; Ding, J.; Li, J.; Xia, G.S. Align deep features for oriented object detection. IEEE Trans. Geosci. Remote. Sens. 2021, 60, 1–11. [Google Scholar] [CrossRef]
  7. Paolo, F.; Lin, T.T.T.; Gupta, R.; Goodman, B.; Patel, N.; Kuster, D.; Kroodsma, D.; Dunnmon, J. xView3-SAR: Detecting Dark Fishing Activity Using Synthetic Aperture Imagery. arXiv 2022, arXiv:2206.00897. [Google Scholar]
  8. Ye, J.; Chen, Z.; Liu, J.; Du, B. TextFuseNet: Scene Text Detection with Richer Fused Features. IJCAI 2020, 20, 516–522. [Google Scholar]
  9. Zhou, C.; Li, D.; Wang, P.; Sun, J.; Huang, Y.; Li, W. ACR-Net: Attention Integrated and Cross-Spatial Feature Fused Rotation Network for Tubular Solder Joint Detection. IEEE Trans. Instrum. Meas. 2021, 70, 1–12. [Google Scholar] [CrossRef]
  10. Zolfi, A.; Amit, G.; Baras, A.; Koda, S.; Morikawa, I.; Elovici, Y.; Shabtai, A. YolOOD: Utilizing Object Detection Concepts for Out-of-Distribution Detection. arXiv 2022, arXiv:2212.02081. [Google Scholar]
  11. Liu, H.; Jiao, L.; Wang, R.; Xie, C.; Du, J.; Chen, H.; Li, R. WSRD-Net: A Convolutional Neural Network-Based Arbitrary-Oriented Wheat Stripe Rust Detection Method. Front. Plant Sci. 2022, 13, 876069. [Google Scholar] [CrossRef]
  12. Shi, X.; Shan, S.; Kan, M.; Wu, S.; Chen, X. Real-time rotation-invariant face detection with progressive calibration networks. In Proceedings of the IEEE Conference on Computer Vision and Pattern Recognition, Salt Lake City, UT, USA, 18–23 June 2018; pp. 2295–2303. [Google Scholar]
  13. Chen, Z.; Chen, K.; Lin, W.; See, J.; Yu, H.; Ke, Y.; Yang, C. Piou loss: Towards accurate oriented object detection in complex environments. In Proceedings of the European Conference on Computer Vision, Glasgow, UK, 23–28 August 2020; Springer: Berlin/Heidelberg, Germany, 2020; pp. 195–211. [Google Scholar]
  14. Yang, X.; Sun, H.; Fu, K.; Yang, J.; Sun, X.; Yan, M.; Guo, Z. Automatic ship detection in remote sensing images from google earth of complex scenes based on multiscale rotation dense feature pyramid networks. Remote Sens. 2018, 10, 132. [Google Scholar] [CrossRef] [Green Version]
  15. Ming, Q.; Miao, L.; Zhou, Z.; Yang, X.; Dong, Y. Optimization for Arbitrary-Oriented Object Detection via Representation Invariance Loss. IEEE Geosci. Remote. Sens. Lett. 2022, 19, 1–5. [Google Scholar] [CrossRef]
  16. Guo, Z.; Liu, C.; Zhang, X.; Jiao, J.; Ji, X.; Ye, Q. Beyond Bounding-Box: Convex-Hull Feature Adaptation for Oriented and Densely Packed Object Detection. In Proceedings of the IEEE Conference on Computer Vision and Pattern Recognition, Nashville, TN, USA, 20–25 June 2021; pp. 8792–8801. [Google Scholar]
  17. Yu, J.; Jiang, Y.; Wang, Z.; Cao, Z.; Huang, T. Unitbox: An advanced object detection network. In Proceedings of the 24th ACM International Conference on Multimedia, Amsterdam, The Netherlands, 15–19 October 2016; pp. 516–520. [Google Scholar]
  18. Rezatofighi, H.; Tsoi, N.; Gwak, J.; Sadeghian, A.; Reid, I.; Savarese, S. Generalized intersection over union: A metric and a loss for bounding box regression. In Proceedings of the IEEE Conference on Computer Vision and Pattern Recognition, Long Beach, CA, USA, 15–20 June 2019; pp. 658–666. [Google Scholar]
  19. Zheng, Z.; Wang, P.; Liu, W.; Li, J.; Ye, R.; Ren, D. Distance-IoU Loss: Faster and Better Learning for Bounding Box Regression. AAAI Conf. Artif. Intell. 2020, 35, 12993–13000. [Google Scholar] [CrossRef]
  20. Yang, X.; Yan, J. Arbitrary-Oriented Object Detection with Circular Smooth Label. In Proceedings of the European Conference on Computer Vision, Glasgow, UK, 23–28 August 2020; Springer: Berlin/Heidelberg, Germany, 2020; pp. 677–694. [Google Scholar]
  21. Yang, X.; Hou, L.; Zhou, Y.; Wang, W.; Yan, J. Dense label encoding for boundary discontinuity free rotation detection. In Proceedings of the IEEE Conference on Computer Vision and Pattern Recognition, Nashville, TN, USA, 20–25 June 2021; pp. 15819–15829. [Google Scholar]
  22. Yang, X.; Yang, X.; Yang, J.; Ming, Q.; Wang, W.; Tian, Q.; Yan, J. Learning high-precision bounding box for rotated object detection via kullback-leibler divergence. Adv. Neural Inf. Process. Syst. 2021, 34, 18381–18394. [Google Scholar]
  23. Qian, W.; Yang, X.; Peng, S.; Yan, J.; Guo, Y. Learning Modulated Loss for Rotated Object Detection. AAAI Conf. Artif. Intell. 2021, 35, 2458–2466. [Google Scholar] [CrossRef]
  24. Dempster, A.P.; Laird, N.M.; Rubin, D.B. Maximum likelihood from incomplete data via the EM algorithm. Proc. R. Stat. Soc. 1977, 39, 1–22. [Google Scholar]
  25. Kullback, S.; Leibler, R.A. On information and sufficiency. Ann. Math. Stat. 1951, 22, 79–86. [Google Scholar] [CrossRef]
  26. Bhattacharyya, A. On a measure of divergence between two statistical populations defined by their probability distributions. Bull. Calcutta Math. Soc. 1943, 35, 99–109. [Google Scholar]
  27. Villani, C. Optimal Transport: Old and New; Springer Science & Business Media: Berlin/Heidelberg, Germany, 2008; Volume 338. [Google Scholar]
  28. Xu, Y.; Fu, M.; Wang, Q.; Wang, Y.; Chen, K.; Xia, G.S.; Bai, X. Gliding vertex on the horizontal bounding box for multi-oriented object detection. IEEE Trans. Pattern Anal. Mach. Intell. 2020, 43, 1452–1459. [Google Scholar] [CrossRef]
  29. Yang, Z.; Liu, S.; Hu, H.; Wang, L.; Lin, S. Reppoints: Point set representation for object detection. In Proceedings of the IEEE International Conference on Computer Vision, Seoul, Republic of Korea, 27 October–2 November 2019; pp. 9657–9666. [Google Scholar]
  30. Zhou, L.; Wei, H.; Li, H.; Zhang, Y.; Sun, X.; Zhao, W. Arbitrary-oriented object detection in remote sensing images based on polar coordinates. IEEE Access 2020, 8, 223373–223384. [Google Scholar] [CrossRef]
  31. Zhao, P.; Qu, Z.; Bu, Y.; Tan, W.; Guan, Q. Polardet: A fast, more precise detector for rotated target in aerial images. Int. J. Remote Sens. 2021, 42, 5821–5851. [Google Scholar] [CrossRef]
  32. Wei, H.; Zhang, Y.; Chang, Z.; Li, H.; Wang, H.; Sun, X. Oriented objects as pairs of middle lines. ISPRS J. Photogramm. Remote Sens. 2020, 169, 268–279. [Google Scholar] [CrossRef]
  33. Llerena, J.M.; Zeni, L.F.; Kristen, L.N.; Jung, C. Gaussian Bounding Boxes and Probabilistic Intersection-over-Union for Object Detection. arXiv 2021, arXiv:2106.06072. [Google Scholar]
  34. Ren, S.; He, K.; Girshick, R.; Sun, J. Faster r-cnn: Towards real-time object detection with region proposal networks. In Proceedings of the 28th International Conference on Neural Information Processing Systems, Montreal, Canada, 7–12 December 2015; pp. 91–99. [Google Scholar]
  35. Lin, T.Y.; Goyal, P.; Girshick, R.; He, K.; Dollár, P. Focal loss for dense object detection. In Proceedings of the IEEE International Conference on Computer Vision, Venice, Italy, 22–29 October 2017; pp. 2980–2988. [Google Scholar]
  36. Zhang, S.; Chi, C.; Yao, Y.; Lei, Z.; Li, S.Z. Bridging the Gap Between Anchor-Based and Anchor-Free Detection via Adaptive Training Sample Selection. In Proceedings of the IEEE Conference on Computer Vision and Pattern Recognition, Seattle, WA, USA, 13–19 June 2020; pp. 9756–9765. [Google Scholar] [CrossRef]
  37. Kim, K.; Lee, H.S. Probabilistic Anchor Assignment with IoU Prediction for Object Detection. In Proceedings of the European Conference on Computer Vision, Glasgow, UK, 23–28 August 2020; Springer: Berlin/Heidelberg, Germany, 2020; pp. 355–371. [Google Scholar]
  38. Ming, Q.; Zhou, Z.; Miao, L.; Zhang, H.; Li, L. Dynamic Anchor Learning for Arbitrary-Oriented Object Detection. AAAI Conf. Artif. Intell. 2021, 35, 2355–2363. [Google Scholar] [CrossRef]
  39. Zhang, X.; Wan, F.; Liu, C.; Ji, X.; Ye, Q. Learning to Match Anchors for Visual Object Detection. IEEE Trans. Pattern Anal. Mach. Intell. 2021, 44, 3096–3109. [Google Scholar] [CrossRef] [PubMed]
  40. Wang, J.; Gong, Z.; Liu, X.; Guo, H.; Yu, D.; Ding, L. Object Detection Based on Adaptive Feature-Aware Method in Optical Remote Sensing Images. Remote Sens. 2022, 14, 3616. [Google Scholar] [CrossRef]
  41. Wang, J.; Cui, Z.; Zang, Z.; Meng, X.; Cao, Z. Absorption Pruning of Deep Neural Network for Object Detection in Remote Sensing Imagery. Remote Sens. 2022, 14, 6245. [Google Scholar] [CrossRef]
  42. Zhang, T.; Zhuang, Y.; Wang, G.; Dong, S.; Chen, H.; Li, L. Multiscale Semantic Fusion-Guided Fractal Convolutional Object Detection Network for Optical Remote Sensing Imagery. IEEE Trans. Geosci. Remote Sens. 2022, 60, 1–20. [Google Scholar] [CrossRef]
  43. Ma, W.; Li, N.; Zhu, H.; Jiao, L.; Tang, X.; Guo, Y.; Hou, B. Feature Split–Merge–Enhancement Network for Remote Sensing Object Detection. IEEE Trans. Geosci. Remote Sens. 2022, 60, 1–17. [Google Scholar] [CrossRef]
  44. Yu, D.; Ji, S. A New Spatial-Oriented Object Detection Framework for Remote Sensing Images. IEEE Trans. Geosci. Remote Sens. 2022, 60, 1–16. [Google Scholar] [CrossRef]
  45. Li, X.; Deng, J.; Fang, Y. Few-Shot Object Detection on Remote Sensing Images. IEEE Trans. Geosci. Remote Sens. 2022, 60, 1–14. [Google Scholar] [CrossRef]
  46. Richards, F.S. A method of maximum-likelihood estimation. J. R. Stat. Soc. Ser. B Methodol. 1961, 23, 469–475. [Google Scholar] [CrossRef]
  47. Dai, J.; Qi, H.; Xiong, Y.; Li, Y.; Zhang, G.; Hu, H.; Wei, Y. Deformable convolutional networks. In Proceedings of the IEEE International Conference on Computer Vision, Venice, Italy, 22–29 October 2017; pp. 764–773. [Google Scholar]
  48. Xia, G.S.; Bai, X.; Ding, J.; Zhu, Z.; Belongie, S.; Luo, J.; Datcu, M.; Pelillo, M.; Zhang, L. DOTA: A large-scale dataset for object detection in aerial images. In Proceedings of the IEEE Conference on Computer Vision and Pattern Recognition, Salt Lake City, UT, USA, 18–23 June 2018; pp. 3974–3983. [Google Scholar]
  49. Liu, Z.; Yuan, L.; Weng, L.; Yang, Y. A high resolution optical satellite image dataset for ship recognition and some new baselines. In Proceedings of the International Conference on Pattern Recognition Applications and Methods, Porto, Portugal, 24–26 February 2017; Volume 2, pp. 324–331. [Google Scholar]
  50. Zhu, H.; Chen, X.; Dai, W.; Fu, K.; Ye, Q.; Jiao, J. Orientation robust object detection in aerial images using deep convolutional neural network. In Proceedings of the 2015 IEEE International Conference on Image Processing, Quebec City, QC, Canada, 27–30 September 2015; pp. 3735–3739. [Google Scholar]
  51. Karatzas, D.; Gomez-Bigorda, L.; Nicolaou, A.; Ghosh, S.; Bagdanov, A.; Iwamura, M.; Matas, J.; Neumann, L.; Chandrasekhar, V.R.; Lu, S.; et al. ICDAR 2015 competition on robust reading. In Proceedings of the 2015 13th International Conference on Document Analysis and Recognition, Tunis, Tunisia, 23–26 August 2015; pp. 1156–1160. [Google Scholar]
  52. Chen, K.; Wang, J.; Pang, J.; Cao, Y.; Xiong, Y.; Li, X.; Sun, S.; Feng, W.; Liu, Z.; Xu, J.; et al. MMDetection: Open MMLab Detection Toolbox and Benchmark. arXiv 2019, arXiv:1906.07155. [Google Scholar]
  53. He, K.; Zhang, X.; Ren, S.; Sun, J. Deep residual learning for image recognition. In Proceedings of the IEEE Conference on Computer Vision and Pattern Recognition, Las Vegas, NV, USA, 26 June–1 July 2016; pp. 770–778. [Google Scholar]
  54. Lin, T.Y.; Dollár, P.; Girshick, R.; He, K.; Hariharan, B.; Belongie, S. Feature pyramid networks for object detection. In Proceedings of the IEEE Conference on Computer Vision and Pattern Recognition, Honolulu, HI, USA, 21–26 July 2017; pp. 2117–2125. [Google Scholar]
  55. Xie, S.; Girshick, R.; Dollár, P.; Tu, Z.; He, K. Aggregated residual transformations for deep neural networks. In Proceedings of the IEEE Conference on Computer Vision and Pattern Recognition, Honolulu, HI, USA, 21–26 July 2017; pp. 1492–1500. [Google Scholar]
  56. Redmon, J.; Farhadi, A. YOLOv3: An Incremental Improvement. arXiv 2018, arXiv:1804.02767. [Google Scholar]
  57. Newell, A.; Yang, K.; Deng, J. Stacked hourglass networks for human pose estimation. In Proceedings of the European Conference on Computer Vision, Amsterdam, The Netherlands, 8–16 October 2016; Springer: Berlin/Heidelberg, Germany, 2016; pp. 483–499. [Google Scholar]
  58. Liu, Z.; Lin, Y.; Cao, Y.; Hu, H.; Wei, Y.; Zhang, Z.; Lin, S.; Guo, B. Swin transformer: Hierarchical vision transformer using shifted windows. In Proceedings of the IEEE/CVF International Conference on Computer Vision, Montreal, BC, Canada, 11–17 October 2021; pp. 10012–10022. [Google Scholar]
  59. Li, W.; Wei, W.; Zhang, L. GSDet: Object Detection in Aerial Images Based on Scale Reasoning. IEEE Trans. Image Process. 2021, 30, 4599–4609. [Google Scholar] [CrossRef] [PubMed]
  60. Li, Y.; Huang, Q.; Pei, X.; Jiao, L.; Shang, R. Radet: Refine feature pyramid network and multi-layer attention network for arbitrary-oriented object detection of remote sensing images. Remote Sens. 2020, 12, 389. [Google Scholar] [CrossRef] [Green Version]
  61. Zhang, G.; Lu, S.; Zhang, W. Cad-net: A context-aware detection network for objects in remote sensing imagery. IEEE Trans. Geosci. Remote Sens. 2019, 57, 10015–10024. [Google Scholar] [CrossRef] [Green Version]
  62. Wang, Y.; Zhang, Y.; Zhang, Y.; Zhao, L.; Sun, X.; Guo, Z. SARD: Towards scale-aware rotated object detection in aerial imagery. IEEE Access 2019, 7, 173855–173865. [Google Scholar] [CrossRef]
  63. Li, C.; Xu, C.; Cui, Z.; Wang, D.; Zhang, T.; Yang, J. Feature-attentioned object detection in remote sensing imagery. In Proceedings of the 2019 IEEE International Conference on Image Processing, Taipei, Taiwan, 22–25 September 2019; pp. 3886–3890. [Google Scholar]
  64. Yang, F.; Li, W.; Hu, H.; Li, W.; Wang, P. Multi-Scale Feature Integrated Attention-Based Rotation Network for Object Detection in VHR Aerial Images. Sensors 2020, 20, 1686. [Google Scholar] [CrossRef] [PubMed] [Green Version]
  65. Wang, J.; Yang, W.; Li, H.C.; Zhang, H.; Xia, G.S. Learning center probability map for detecting objects in aerial images. IEEE Trans. Geosci. Remote Sens. 2020, 59, 4307–4323. [Google Scholar] [CrossRef]
  66. Song, Q.; Yang, F.; Yang, L.; Liu, C.; Hu, M.; Xia, L. Learning point-guided localization for detection in remote sensing images. IEEE J. Sel. Top. Appl. Earth Obs. Remote Sens. 2020, 14, 1084–1094. [Google Scholar] [CrossRef]
  67. Yang, X.; Yan, J.; Yang, X.; Tang, J.; Liao, W.; He, T. SCRDet++: Detecting Small, Cluttered and Rotated Objects via Instance-Level Feature Denoising and Rotation Loss Smoothing. arXiv 2020, arXiv:2004.13316. [Google Scholar] [CrossRef]
  68. Dai, P.; Yao, S.; Li, Z.; Zhang, S.; Cao, X. ACE: Anchor-Free Corner Evolution for Real-Time Arbitrarily-Oriented Object Detection. IEEE Trans. Image Process. 2022, 31, 4076–4089. [Google Scholar] [CrossRef]
  69. Yu, F.; Wang, D.; Shelhamer, E.; Darrell, T. Deep layer aggregation. In Proceedings of the IEEE Conference on Computer Vision and Pattern Recognition, Salt Lake City, UT, USA, 18–23 June 2018; pp. 2403–2412. [Google Scholar]
  70. Yi, J.; Wu, P.; Liu, B.; Huang, Q.; Qu, H.; Metaxas, D. Oriented object detection in aerial images with box boundary-aware vectors. In Proceedings of the IEEE Winter Conference on Applications of Computer Vision, Waikoloa, HI, USA, 3–8 January 2021; pp. 2150–2159. [Google Scholar]
  71. Pan, X.; Ren, Y.; Sheng, K.; Dong, W.; Yuan, H.; Guo, X.; Ma, C.; Xu, C. Dynamic refinement network for oriented and densely packed object detection. In Proceedings of the IEEE/CVF Conference on Computer Vision and Pattern Recognition, Seattle, WA, USA, 13–19 June 2020; pp. 11207–11216. [Google Scholar]
  72. Hou, L.; Lu, K.; Xue, J. Refined One-Stage Oriented Object Detection Method for Remote Sensing Images. IEEE Trans. Image Process. 2022, 31, 1545–1558. [Google Scholar] [CrossRef] [PubMed]
  73. Huang, Z.; Li, W.; Xia, X.G.; Tao, R. A General Gaussian Heatmap Label Assignment for Arbitrary-Oriented Object Detection. IEEE Trans. Image Process. 2022, 31, 1895–1910. [Google Scholar] [CrossRef] [PubMed]
  74. Ma, J.; Shao, W.; Ye, H.; Wang, L.; Wang, H.; Zheng, Y.; Xue, X. Arbitrary-oriented scene text detection via rotation proposals. IEEE Trans. Multimed. 2018, 20, 3111–3122. [Google Scholar] [CrossRef]
Figure 1. Illustrations of different problems for different representations: (a) Dissociation of PointSet; (b) Representation ambiguity of QBB; (c) Boundary discontinuity of OBB.
Remotesensing 15 00757 g001
Figure 2. Overview of the main contributions of this paper. Gaussian distributions of QBB and PointSet are constructed, and label assignment strategies and regression losses are designed in an alignment manner based on statistical distances.
Remotesensing 15 00757 g002
Figure 3. Illustration of the learning process of the Gaussian distribution based on PointSet.
Remotesensing 15 00757 g003
Figure 4. Comparison of the visualization results of PointSet and G-Rep on HRSC2016 dataset. (a) PointSet. (b) G-Rep.
Remotesensing 15 00757 g004
Figure 5. Comparison of the visualization results of PointSet and G-Rep on the DOTA dataset. (a) PointSet. (b) G-Rep.
Remotesensing 15 00757 g005
Figure 6. Comparison of the visualization results of PointSet and G-Rep on the UCAS-AOD dataset. (a) PointSet. (b) G-Rep.
Remotesensing 15 00757 g006
Table 1. Experiment results of normalized function design for label assignment ( S ) and regression loss ( L ) on HRSC2016.
MetricFunc. of S Range of S Func. of L Range of L mAP (%)
KLD 1 2 + D K ( 0 , 0.5 ] 1 1 0 + exp ( D K ) [ 0 , 1 ) 87.32
1 2 + D K ( 0 , 0.5 ] 1 1 0 + exp ( D K 2 ) [ 0 , 1 ) 50.73
1 2 + D K ( 0 , 0.5 ] 1 1 2 + D K [ 0.5 , 1 ) 88.06
1 1 + ( D K ) 3 ( 0 , 1 ] 1 1 2 + D K [ 0.5 , 1 ) 87.96
BD 1 1 + D B 2 ( 0 , 1 ] 1 1 1 + D B 2 [ 0 , 1 ) 81.02
1 1 + D B 2 ( 0 , 1 ] 1 1 1 + D B [ 0 , 1 ) 69.32
1 1 + D B 2 ( 0 , 1 ] 1 1 1 + D B [ 0 , 1 ) 85.32
1 1 + D B ( 0 , 1 ] 1 1 1 + D B [ 0 , 1 ) 85.12
WD 1 2 + D W ( 0 , 0.5 ] 1 1 2 + D W [ 0.5 , 1 ) 87.04
1 2 + D W ( 0 , 0.5 ] 1 1 0 + exp ( D W ) [ 0 , 1 ) 88.24
1 2 + D W ( 0 , 0.5 ] 1 1 1 + log ( 1 + D W ) [ 0 , 1 ) 88.56
1 2 + D W ( 0 , 0.5 ] 1 1 1 + log ( 1 + D W ) [ 0 , 1 ) 87.54
Table 2. Ablation study of G-Rep for PointSet on DOTA and HRSC2016. S and L represent the label assignment strategy and regression loss function, respectively.
DatasetRep. S L mAP (%)
DOTAPointSetIoU (Max)GIoU63.97
G-RepIoU (Max) L KLD 64.63 (+0.66)
S KLD (Max) L KLD 65.07 (+1.10)
PointSetIoU (ATSS)GIoU68.88
G-Rep S KLD (ATSS) L KLD 70.45 (+1.57)
S KLD (PATSS) L KLD 72.08 (+3.20)
HRSC2016PointSetIoU (ATSS)GIoU78.07
G-Rep S KLD (ATSS) L KLD 88.06 (+9.99)
S KLD (PATSS) L KLD 89.15 (+11.07)
Table 3. Performance comparison of PointSet and G-Rep for large aspect ratio objects. The ratio number in the parentheses next to the category name in the first row is the mean aspect ratio (ratio of the long side to the short side) of all targets in that category.
Rep.BR (2.93)SV (1.72)LV (3.45)SH (2.40)HC (2.34)mAP (%)
PointSet46.8777.1071.6583.7132.9362.45
G-Rep50.8279.3375.0787.3250.6368.63
(+3.95)(+2.23)(+3.51)(+3.61)(+17.70)(+6.18)
Table 5. Ablation study of G-Rep for QBB representations on various datasets. The regression loss of G-Rep is the L KLD . “*” denotes that dynamic ATSS-based strategies are adopted.
DatasetRep.Eval.Gain ↑
DOTAPointSet *68.88
G-Rep * (PointSet)70.45+1.57
QBB63.05
G-Rep (QBB)67.92+4.87
HRSC2016PointSet *78.07
G-Rep * (PointSet)88.06+9.99
QBB87.70
G-Rep (QBB)88.01+0.31
UCAS-AODPointSet *90.15
G-Rep * (PointSet)90.20+0.05
QBB88.50
G-Rep (QBB)88.82+0.32
ICDAR2015PointSet *76.20
G-Rep * (PointSet)81.30+5.10
QBB75.10
G-Rep (QBB)75.83+0.73
Table 6. Comparison of the time cost on DOTA.
MethodmAP (%)ParamsSpeed
RepPoints70.3936.1M24.0fps
S 2 ANet74.1237.3M19.9fps
G-Rep (ours)75.5636.1M19.3fps
Table 7. Comparison of various detectors of mAP values on the OBB-based task of the DOTA-v1.0. “MS” indicates multi-scale training.
MethodBackboneMSPLBDBRGTFSVLVSHTCBCSTSBFRAHASPHCmAP (%)
two-stage:
ICN [1]R-10181.4074.3047.7070.3064.9067.8070.0090.8079.1078.2053.6062.9067.0064.2050.2068.20
GSDet [59]R-101 81.1276.7840.7875.8964.5058.3774.2189.9279.4078.8364.5463.6766.0458.0152.1368.28
RADet [60]RX-10179.4576.9948.0565.8365.4574.4068.8689.7078.1474.9749.9264.6366.1471.5862.1669.06
RoI-Transformer [2]R-10188.6478.5243.4475.9268.8173.6883.5990.7477.2781.4658.3953.5462.8358.9347.6769.56
CAD-Net [61]R-101 87.8082.4049.4073.5071.1063.5076.7090.9079.2073.3048.4060.9062.0067.0062.2069.90
SCRDet [3]R-10189.9880.6552.0968.3668.3660.3272.4190.8587.9486.8665.0266.6866.2568.2465.2172.61
SARD [62]R-101 89.9384.1154.1972.0468.4161.1866.0090.8287.7986.5965.6564.0466.6868.8468.0372.95
FADet [63]R-10190.2179.5845.4976.4173.1868.2779.5690.8383.4084.6453.4065.4274.1769.6964.8673.28
MFIAR-Net[64]R-15289.6284.0352.4170.3070.1367.6477.8190.8585.4086.2263.2164.1468.3170.2162.1173.49
Gliding Vertex [28]R-101 89.6485.0052.2677.3473.0173.1486.8290.7479.0286.8159.5570.9172.9470.8657.3275.02
CenterMap [65]R-10189.8384.4154.6070.2577.6678.3287.1990.6684.8985.2756.4669.2374.1371.5666.0676.03
CSL (FPN-based) [20]R-15290.2585.5354.6475.3170.4473.5177.6290.8486.1586.6969.6068.0473.8371.1068.9376.17
RSDet [23]R-15289.9384.4553.7774.3571.5278.3178.1291.1487.3586.9365.6465.1775.3579.7463.3176.34
OPLD [66]R-10189.3785.8254.1079.5875.0075.1386.9290.8886.4286.6262.4668.4173.9868.1163.6976.43
SCRDet++ [67]R-10190.0584.3955.4473.9977.5471.1186.0590.6787.3287.0869.6268.9073.7471.2965.0876.81
one-stage:
P−RSDet [30]R-101 89.0273.6547.3372.0370.5873.7172.7690.8280.1281.3259.4557.8760.7965.2152.5969.82
O 2 - Det [32]H-104 89.3182.1447.3361.2171.3274.0378.6290.7682.2381.3660.9360.1758.2166.9861.0371.04
ACE [68]DAL34[69] 89.5076.3045.1060.0077.8077.1086.5090.8079.5085.7047.0059.4065.7071.7063.9071.70
R 3 Det [4]R-15289.2480.8151.1165.6270.6776.0378.3290.8384.8984.4265.1057.1868.1068.9860.8872.81
BBAVectors [70]R-10188.3579.9650.6962.1878.4378.9887.9490.8583.5884.3554.1360.2465.2264.2855.7073.32
DRN [71]H-10489.7182.3447.2264.1076.2274.4385.8490.5786.1884.8957.6561.9369.3069.6358.4873.23
GWD [5]R-152 88.8880.4752.9463.8576.9570.2883.5688.5483.5184.9461.2465.1365.4571.6973.9074.09
RO 3 D [72]R-10188.6979.4152.2665.5174.7280.8387.4290.7784.3183.3662.6458.1466.9572.3269.3474.44
CFA [16]R-101 89.2681.7251.8167.1779.9978.2584.4690.7783.4085.5454.8667.7573.0470.2464.9675.05
KLD [22]R-50 88.9183.7150.1068.7578.2076.0584.5889.4186.1585.2863.1560.9075.0671.5167.4575.28
S 2 A - Net [6]R-101 88.7081.4154.2859.7578.0480.5488.0490.6984.7586.2265.0365.8176.1673.3758.8676.11
PolarDet [31]R-10189.6587.0748.1470.9778.5380.3487.4590.7685.6386.8761.6470.3271.9273.0967.1576.64
DAL ( S 2 A - Net ) [38]R-5089.6983.1155.0371.0078.3081.9088.4690.8984.9787.4664.4165.6576.8672.0964.3576.95
GGHL [73]D-53 89.7485.6344.5077.4876.7280.4586.1690.8388.1886.2567.0769.4073.3868.4570.1476.95
DCL ( R 3 Det ) [21]R-15289.2683.6053.5472.7679.0482.5687.3190.6786.5986.9867.4966.8873.2970.5669.9977.37
RIDet [15]R-50 89.3180.7754.0776.3879.8181.9989.1390.7283.5887.2264.4267.5678.0879.1762.0777.62
QBB (baseline)R-50 77.5257.3837.2065.9756.2969.9970.0490.3181.1455.3457.9849.8856.0162.3258.3763.05
PointSet (baseline)R-50 87.4882.5345.0765.1678.1258.7275.4490.7882.5485.9860.7767.6860.9370.3644.4170.39
G-Rep (QBB)R-101 88.8974.6243.9270.2467.2667.2679.8090.8784.4678.4754.5962.6066.6767.9852.1670.59
G-Rep (PointSet)R-50 87.7681.2952.6470.5380.3480.5687.4790.7482.9185.0161.4868.5167.5373.0263.5475.56
G-Rep (PointSet)RX-10188.9879.2157.5774.3581.3085.2388.3090.6985.3885.2563.6568.8277.8778.7671.7478.47
G-Rep (PointSet)Swin-T88.1581.6461.3079.5080.9485.6888.3790.9085.4787.7771.0167.4277.1981.2375.8380.16
Table 8. Comparison of the mAP of various rotation methods on HRSC2016.
MethodmAP (%)
RoI-Transformer [2]86.20
RSDet [23]86.50
Gliding Vertex [28]88.20
BBAVectors [70]88.60
R 3 Det [4]89.26
DCL [21]89.46
G-Rep (QBB)88.02
G-Rep (PointSet)89.46
Table 9. Comparison of the AP with state-of-the-art methods on UCAS-AOD.
MethodCarAirplanemAP (%)
RetinaNet [35]84.6490.5187.57
Faster RCNN [34]86.8789.8688.36
RoI-Transformer [2]88.0290.0289.02
RIDet-Q [15]88.5089.9689.23
RIDet-O [15]88.8890.3589.62
DAL [38]89.2590.4989.87
G-Rep (QBB)87.3590.3088.82
G-Rep (PointSet)89.6490.6790.16
Table 10. Comparison of the performance of different methods on ICDAR2015.
MethodPrecisionRecallF-Measure
GWD [5]80.574.077.1
RRPN [74]82.273.277.4
SCRDet [3]81.378.980.1
RO 3 D [72]83.978.681.2
G-Rep (QBB)80.571.475.8
G-Rep (PointSet)81.681.181.3
Disclaimer/Publisher’s Note: The statements, opinions and data contained in all publications are solely those of the individual author(s) and contributor(s) and not of MDPI and/or the editor(s). MDPI and/or the editor(s) disclaim responsibility for any injury to people or property resulting from any ideas, methods, instructions or products referred to in the content.

