Article

Dominant Contribution of South Asia Monsoon to External Moisture for Extreme Precipitation Events in Northern Tibetan Plateau

1
Key Laboratory of Land Surface Pattern and Simulation, Institute of Geographic Science and Natural Resources Research, Chinese Academy of Sciences, Beijing 100101, China
2
Ministry of Education Key Laboratory for Earth System Modeling, Department of Earth System Science, Institute for Global Change Studies, Tsinghua University, Beijing 100084, China
3
State Key Laboratory of Tibetan Plateau Earth System and Resource Environment, Institute of Tibetan Plateau Research, Chinese Academy of Sciences, Beijing 100101, China
*
Author to whom correspondence should be addressed.
Remote Sens. 2023, 15(3), 735; https://doi.org/10.3390/rs15030735
Submission received: 9 December 2022 / Revised: 21 January 2023 / Accepted: 24 January 2023 / Published: 27 January 2023

Abstract

:
Numerous previous studies have pointed out that the South Asia monsoon (SAM) contributes most moisture to the southern Tibetan Plateau, whilst the moisture over the Northern Tibetan Plateau (NTP) is supplied by the westerlies, but the moisture sources for extreme precipitation events remain unclear. In this study, the tracking of external moisture sources was performed on ten extreme precipitation events over each of six target subregions of the NTP during the summer of 2010–2018. We found that the SAM provided most of the external moisture for extreme precipitation events in the NTP, except for the largest contribution from East Asia to extreme precipitation in the easternmost subregion. The moisture carried by westerly winds is the second foreign source over the western NTP. In addition, more than 40% of the NTP extreme precipitation events occurred under the synergy of weak westerlies and enhanced SAM, and these events have a longer duration than others. Thus, SAM plays a key role in moisture transport for the extreme precipitation events over the NTP, even though its contribution to the climatological moisture is not significant.

1. Introduction

The Tibetan Plateau (TP) is a key area for atmospheric water vapor transport and conversion, known as the Asian Water Tower [1]. Many studies have figured out that water vapor over the TP mainly comes from moisture transportation from its surroundings and local evaporation [1,2,3]. However, the moisture source of TP weather and climate is overly complex, and it is affected by South Asian Monsoon (SAM), East Asian Monsoon (EAM), westerlies, and the local water cycle. The moisture contributions to the TP by monsoons and westerlies are still controversial. In summer, the SAM carries lots of moisture from low-latitude oceans, such as the Arabian Sea, Bay of Bengal, South China Sea, etc., into the TP, whilst the moisture provided by the westerlies is dominant during winter [2,3,4,5,6]. Studies have suggested that monsoons contribute more moisture to the TP than the westerlies, whose moisture contribution is only 32% of that by monsoons [5,6,7]. Correspondingly, other studies have inferred that there is more water vapor entering the TP from the western border than that from the southern, even during summer [8], and it indicated that the westerlies should play a leading role.
Generally, moistures brought by the SAM and EAM have significant influences on the southern and eastern TP but show little effect on the Northern Tibetan Plateau (NTP; [2,3,6,7,9]). The NTP precipitation and its moisture source are mainly controlled by the westerlies [10,11,12]. The majority of studies focus on the moisture source and its influences on the NTP from a view of climatology. For example, at annual or interannual scales, using the limited isotopic observations, several studies [2,6,13] figured out that monsoon’s influences are concentrated in the southern TP (south of 33°N) and westerlies dominate over the northern TP (north of 35°N). Zhang et al. (2019) found that the moisture from the continent and ocean south of TP could only contribute 17.9% of moisture to the NTP precipitation, which is much less than its contribution to the precipitation in southern TP. Wang et al. (2019) reported that westerly prevalence would inhibit moisture delivery from the Bay of Bengal into NTP [14]. Pan et al. (2018) figured out that Europe and northern Asia are the dominant foreign moisture sources during summer over the NTP, which could provide 18.6 ± 4.1% and 20.6 ± 3.7% of its moisture, respectively [15]. What is more, the features of moisture transport show significant differences during large-scale, small-scale, and non-precipitation events [16,17]. Sun and Wang (2014) indicated that most of the atmospheric moisture in the NTP are taken by the westerly winds when there is no precipitation, but in case of precipitation, the moisture contribution of the South Asia subcontinent will increase significantly [17]. Yang et al. (2021) also emphasized that moisture sources from monsoon regions, i.e., Bay of Bengal, are generally ignored for annual mean moisture over the Qiangtang plateau, but they are very important during the precipitation events [18]. Thus, the influences of monsoons on the NTP precipitation should gain more attention.
In recent decades, the TP precipitation has shown an overall increasing trend [19,20,21,22], and its characteristics are also changing, i.e., the intensity and frequency of extremely heavy rainfall over the whole TP show increasing trends, but they have large spatial variabilities [20]. Extreme precipitation has a strong correlation with the local annual precipitation, especially over the dry regions (i.e., the NTP) [22], and its occurrence and development is also a good indicator of hydrological disasters. Thus, exploring the moisture transport during extreme precipitation events is greatly helpful to understand the monsoon influence on the NTP climate and hydrology. Till now, related studies on NTP are scarce, and monsoons’ contribution to the extreme precipitations in NTP is still not clear.
In this study, we focused on the moisture source and transport during extreme precipitation events over NTP to quantitatively explore the moisture contribution of the South Asia monsoon. Section 2 lists the description of data, definition of extreme precipitation events, and method of tracking moisture sources. The results of moisture sources and their contributions to NTP precipitation and atmospheric circulation patterns prior to the precipitation events are presented in Section 3. Section 4 gives a discussion on the precipitation characteristics and their influencing factors. The summary is shown in Section 5.

2. Materials and Methods

2.1. Data

The reanalysis datasets of ERA-interim and ERA5 were generated by the European Medium-Range Weather Forecasting Centre (ECMWF, [23,24,25]), which provides large amounts of atmospheric, land, and oceanic climate variables at multi-temporal scales (hourly, daily, monthly, yearly). The ERA-interim has a spatial resolution of ~80 km and contains 60 vertical levels, while the ERA5 datasets provide a finer grid of ~30 km and more vertical levels of 137 layers. The ERA5, which shows better performance in detecting precipitation events compared with many commonly used satellite-based precipitation products, i.e., mainland China [26], is used to explore the spatial patterns of precipitation and atmospheric circulation and to determine the extreme precipitation events in this study. The moisture derived from the ERA-Interim has high consistency with that from the ERA5 [27]. In addition, it also indicates that the moisture flux of ERA-Interim also has high consistency with that from the ERA5 (Figure S1). To reduce the computation costs, the ERA-interim was used instead of the ERA5 to track trajectories of moisture transport during each precipitation event over the target subregions.

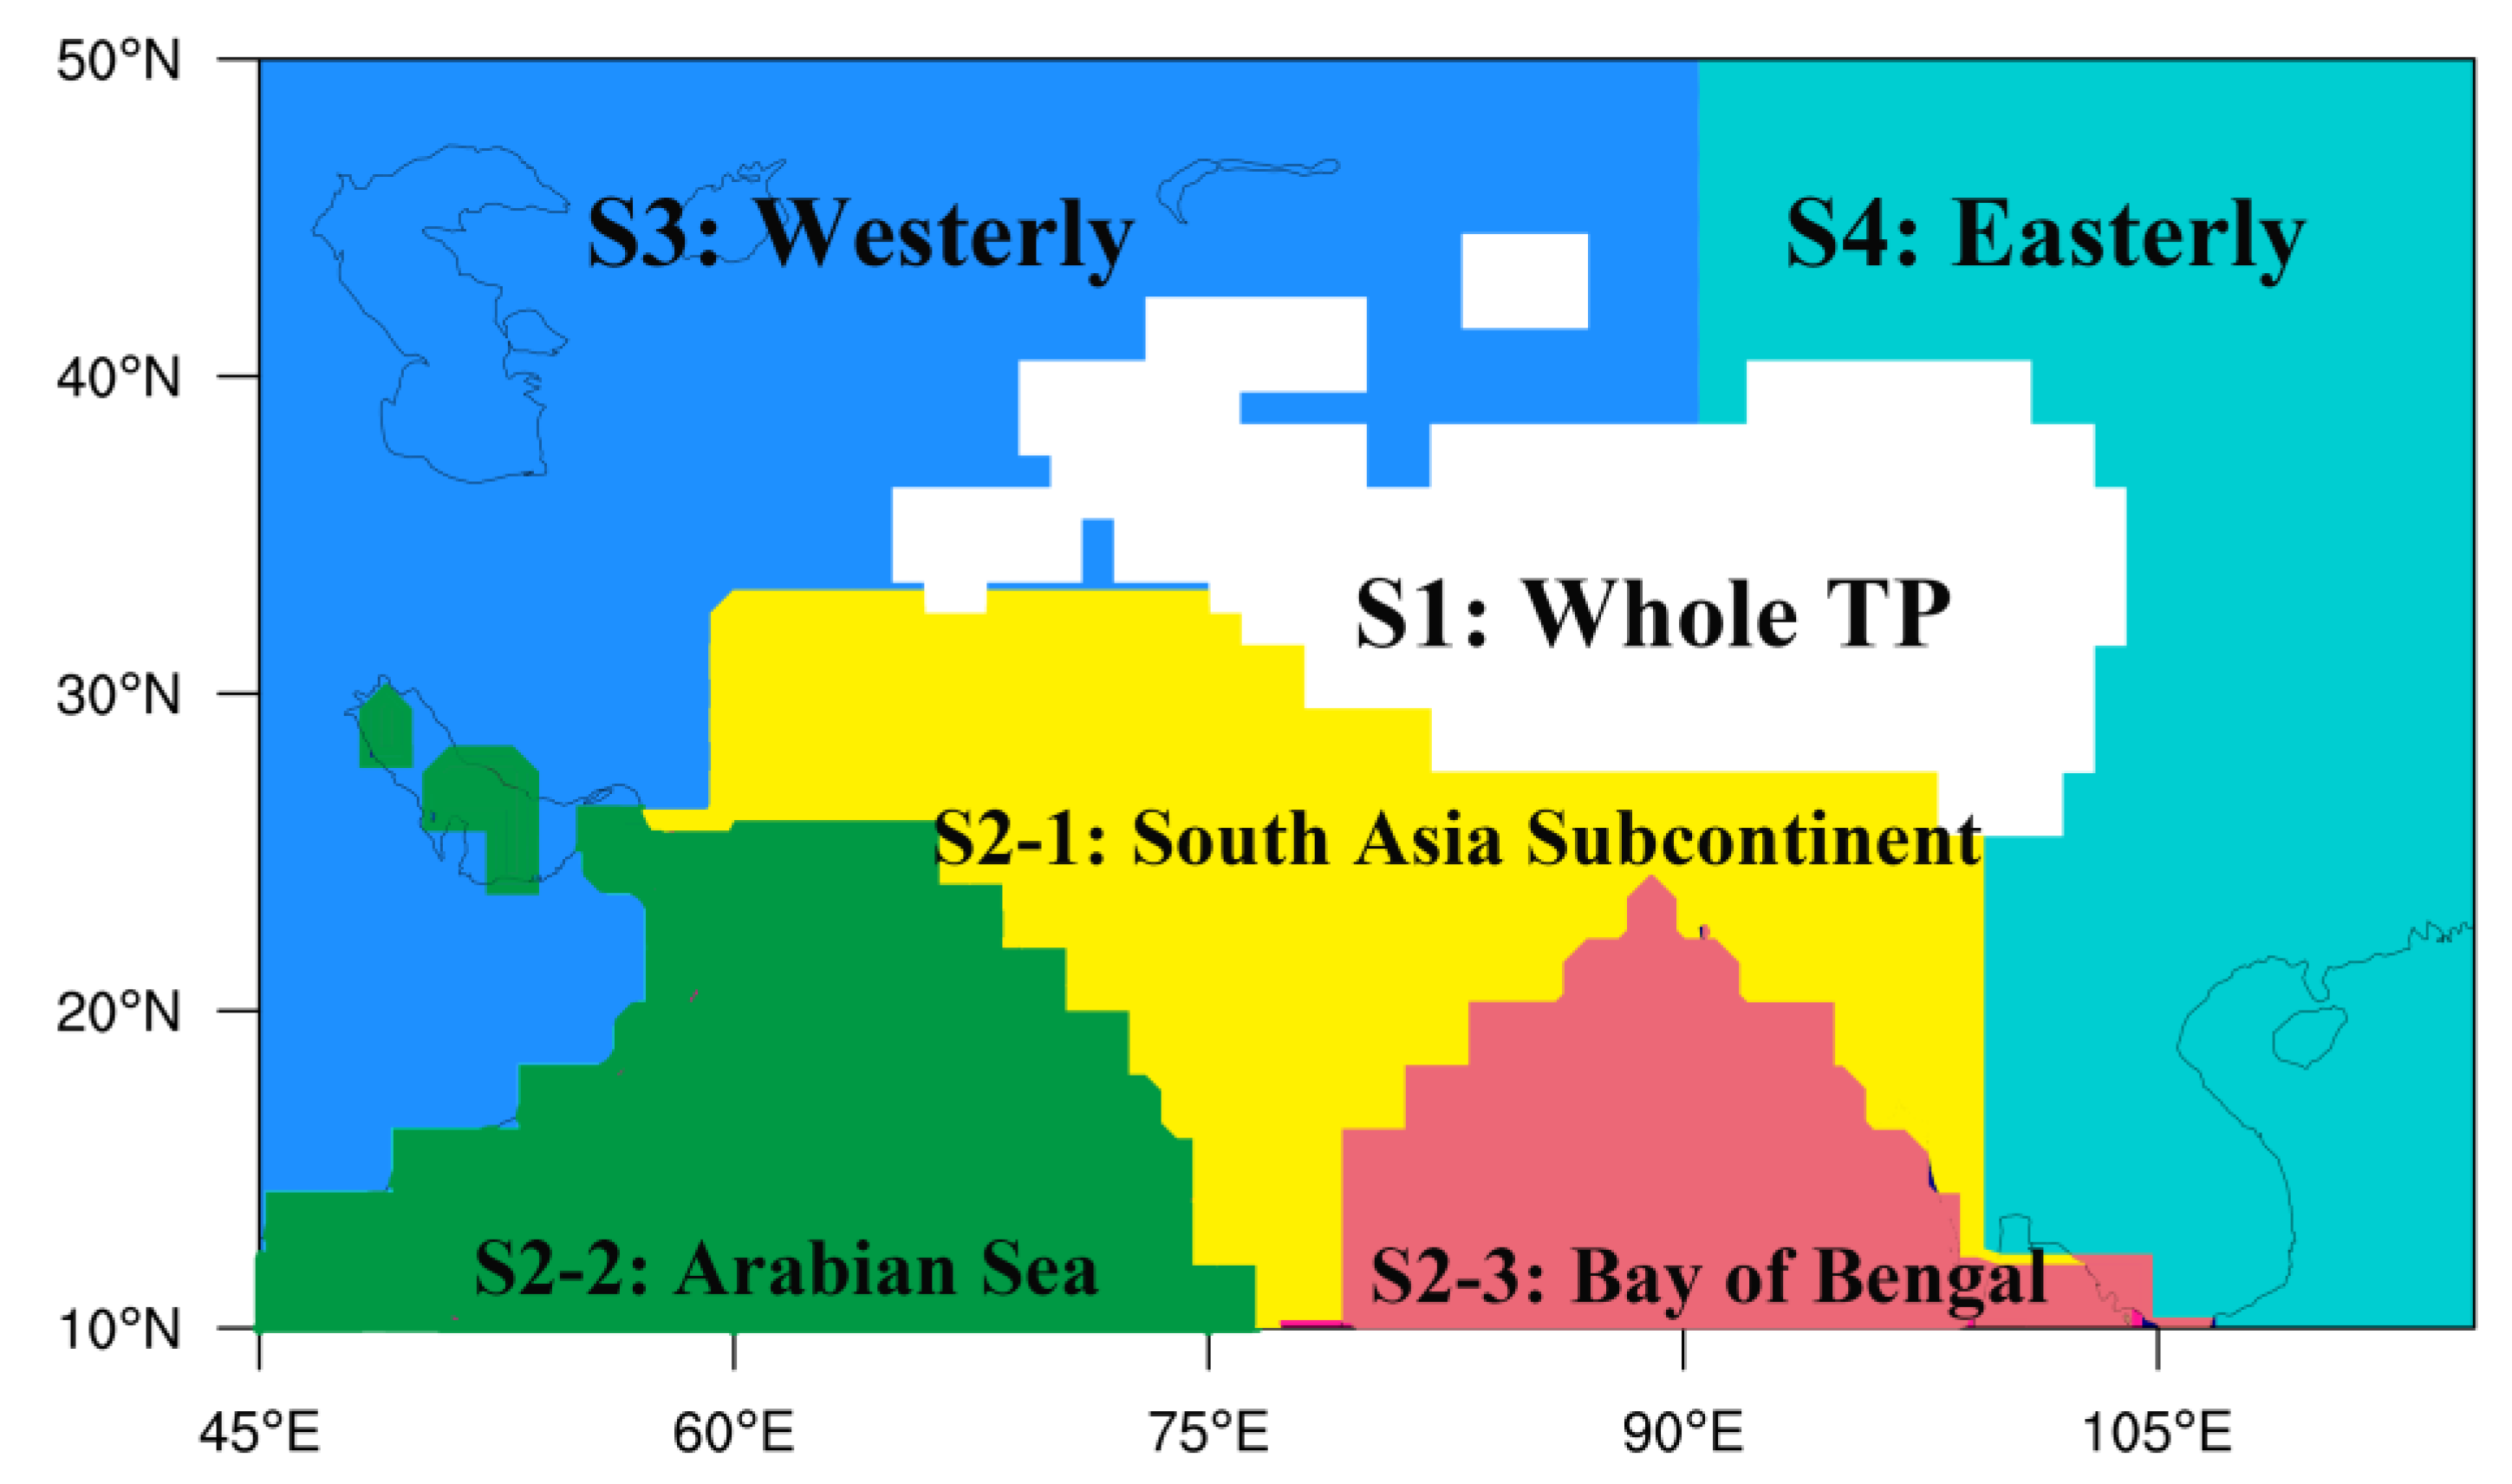
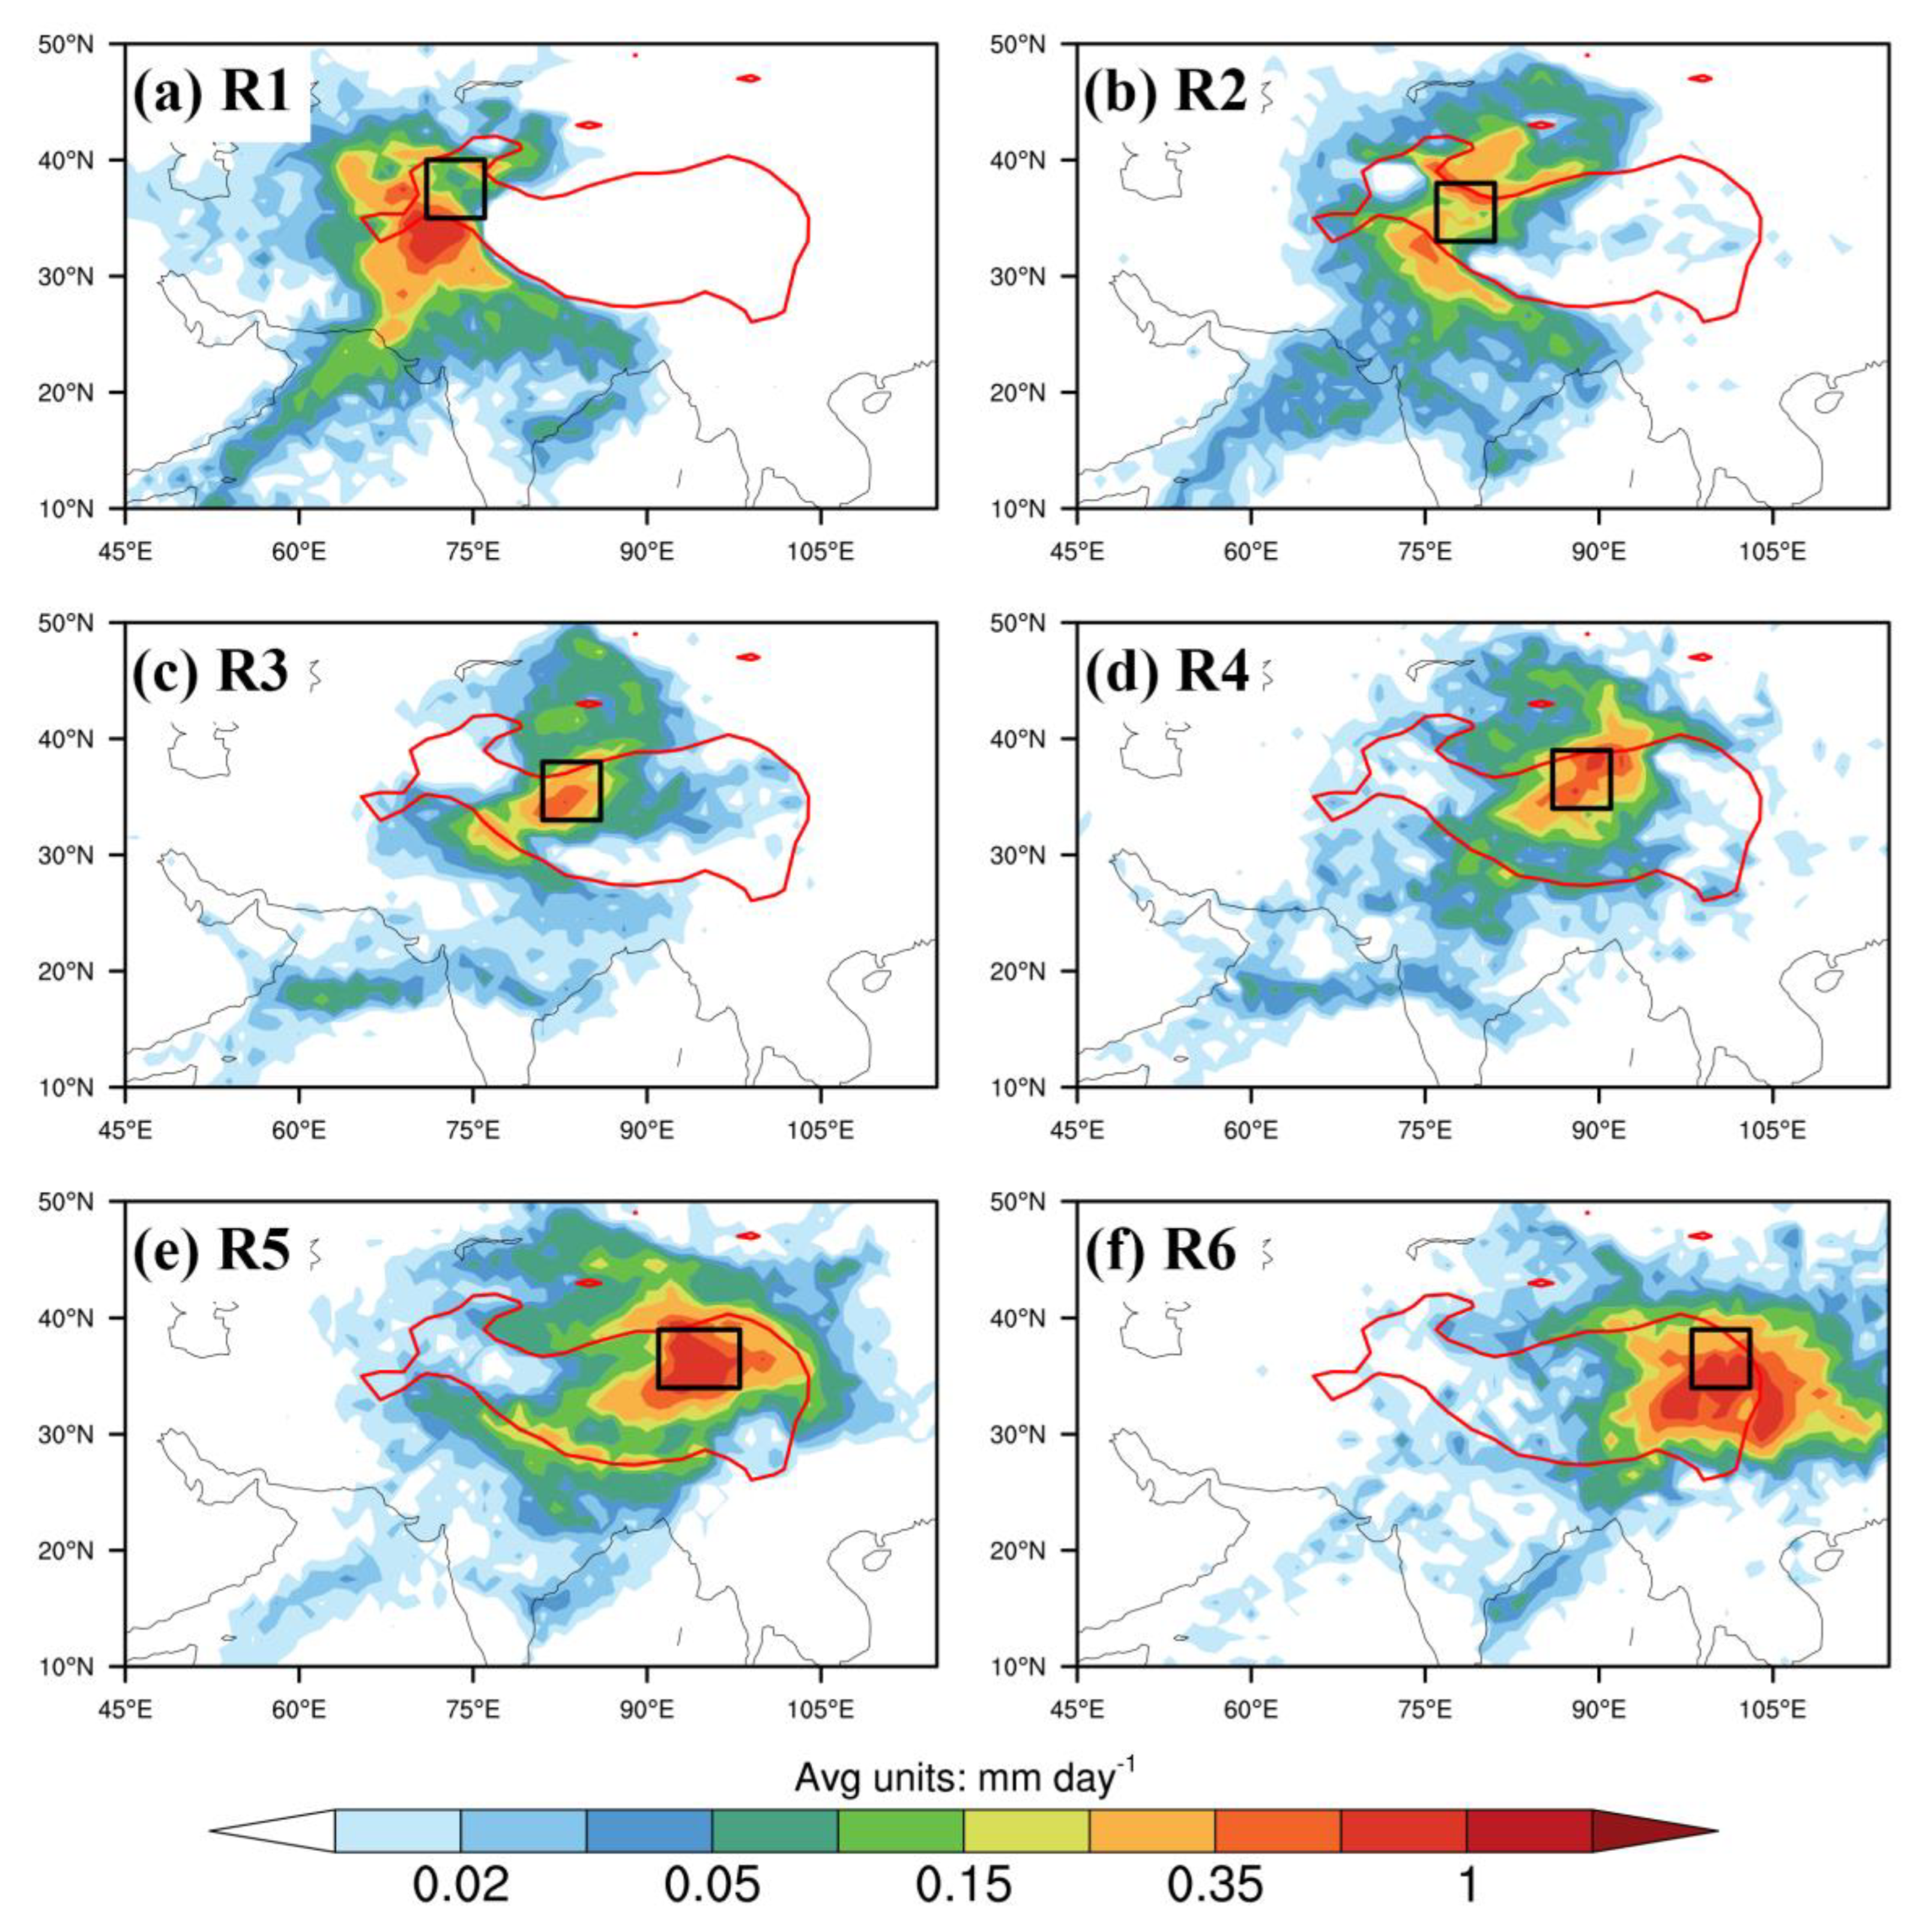
2.2. Identifications of Six Target Subregions and Extreme Precipitation Events

The precipitation in TP has a remarkable spatial variability (Figure 1a), and it leads to the unique patterns of other climate variables, i.e., soil moisture shows a consistent distribution as that of precipitation, with wet conditions in the southern TP but dry conditions in the NTP. Numerous studies have shown that the unique patterns of climate and ecology in the TP result from the combined effects of monsoons and westerlies. The precipitation over the TP mainly appears during the monsoon season (June-July-August-September: JJAS), accounting for 60–90% of the annual precipitation [28]. Thus, it is critical to explore the characteristics of monsoon precipitation and its moisture sources, to better understand its effects on the NTP climate and hydrology processes.
In this study, we divided the NTP, with an elevation higher than 2500 m above sea level, into six target subregions (Figure 1). The target subregion stretches across five degrees of latitude and five degrees of longitude except the subregion of R5, which includes the low-elevation area of Qaidam Basin. To specify the differences among the six subregions, using ERA5 precipitation data, we sifted out the ten heaviest precipitation events during JJAS from 2010 to 2018 over each target subregion. First, extreme precipitation days are defined as the precipitation excessing the 90th percentile for all monsoon days over each target subregion. Then, the ten extreme precipitation events were selected as periods containing the ten heaviest precipitation days, and each event was defined as containing one or more consecutive extreme precipitation days.

2.3. Moisture Trajectory Calculations

To define the moisture sources, the Lagrangian trajectories during each precipitation event were backward-tracked by LAGRANTO version 2 [29,30], which is widely used in the atmospheric sciences to identify moisture transport pathways. All the starting points in each target subregion are located above 2500 m, as shown in Figure S1, and the effective numbers of starting points were: R1~21, R2~20, R3~19, R4~24, R5~29, R6~19. They were distributed on a horizontal grid of 100 km and vertical spacing of 40 hPa from the surface to 200 hPa. The duration of moisture backward tracking was 10 days from all starting points, and it was initialized every 6 h. The configurations in this study can refer to the methodology of Huang et al. (2018) [31]. In this study, we further considered the moisture supplement caused by evaporation supply and its loss resulting from precipitation along each trajectory [31,32], based on the assumption formalized as follows:
D q D t = E P ,
where q is specific humidity, t is time, E is evaporation, P is precipitation. Along the air parcel trajectories, the moisture source contribution can be calculated as follows:
q t = q x t q x t 6 h ,  
where q t is the moisture variations for a given trajectory x t at t time, and it is estimated for each 6 h interval. More details are shown in Figure S3. Then, the precipitation at the starting point over target region is estimated, as follows:
P E = p q t = 0 ρ w g  
where P E is the estimated precipitation, p is the vertical depth of air parcel of 40 hPa, ρ w is the density of water (103 kg/m3), g is the gravitational acceleration, and q t = 0 is the moisture variation of air parcel as it arrives at its starting position.
In addition, all moisture sources along the trajectory x t are identified by examining moisture variations during the period between t = −6 and t = −240 h. The net moisture contribution of q t from each uptake location is estimated as follows:
q t = m = q t = m + q t = n × q t = m q x t = n 6 h  
where m and n are negative values that represent times along the trajectory (|m|>|n|). Here, the moisture increases ( q t > 0 ) are classified as moisture uptake locations (moisture sources) for precipitation at the starting points over the target region. Meanwhile, the moisture decreases ( q t < 0 ) , which mean reducing the contributions from moisture from the uptake locations, are treated as precipitation along the trajectory. Thus, we could quantitatively determine the moisture contribution rate of each precipitation event in the target regions.

2.4. Classification of Moisture Sources

The moisture sources of the six target subregions differ greatly from each other. According to all the trajectories with 516 different starting times (total precipitation event duration of 129 days × 4 times per day) over the NTP, we grouped all the moisture sources into four categories with six regions (Figure 2), including S1: Whole Tibetan Plateau which is located above 2500 m a.s.l., S2: South Asia Monsoon (SAM) region, which contains the South Asia subcontinent, Arabian Sea, and Bay of Bengal, S3: West region, west to 90°E and regions of S1 and S2 are taken out, S4: East region, east to 90°E and regions of S1 and S2 are also taken out. The S1 represents the local evaporation over the whole TP. The S2 indicates the moisture supply from South Asia monsoon to each target region. The S3 hints at the influences of westerlies and the S4 would rather tell us the effects of easterly winds.

3. Results

3.1. Characteristics of the NTP Extreme Precipitation Events

The NTP is an arid zone with low values of precipitation amount and frequency (Figure 1a). The rainy days (daily precipitation ≥ 1 mm) in TP show a similar spatial pattern as the precipitation amount (Figure 1). The rainy days over the NTP are much less than that over the southern TP, and they account for less than 50% of the total monsoon days over the NTP. In each target region, the 90th percentile of monsoon precipitation is: R1~4.4 mm day−1, R2~4.3 mm day−1, R3~5.0 mm day−1, R4~5.4 mm day−1, R5~5.2 mm day−1, R6~8.7 mm day−1. Therefore, the thresholds to define extreme precipitation days is varied with the target subregions.
The specific date and duration of each extreme precipitation event is listed in Table 1. The durations of extreme precipitation events are short in all the target subregions, with total durations of 23 days in R1, 29 days in R2, 29 days in R3, 14 days in R4, 23 days in R5, and 11 days in R6, respectively (Table 1). However, they occupy a considerable proportion of the monsoon precipitation amount (Figure 1). For example, the duration of the ten extreme precipitation events is less than 29 days over the R1 and R2, but it contributes more than 80% of precipitation sum in one monsoon season (JJAS) of 122 days. Over the western NTP, the extreme events belong to medium- or long-term precipitation whose duration is longer than two days (Table 1). Meanwhile, the short-term precipitation plays a dominant role over the eastern NTP (i.e., R6), where durations in most extreme events are only one day. Further, the ten extreme events could account for 35–65% of the average precipitation during a monsoon season. It indicates that the extreme precipitation events over target subregions are intricately connected to different atmospheric circulations and moisture sources, which will be further discussed in Section 4.

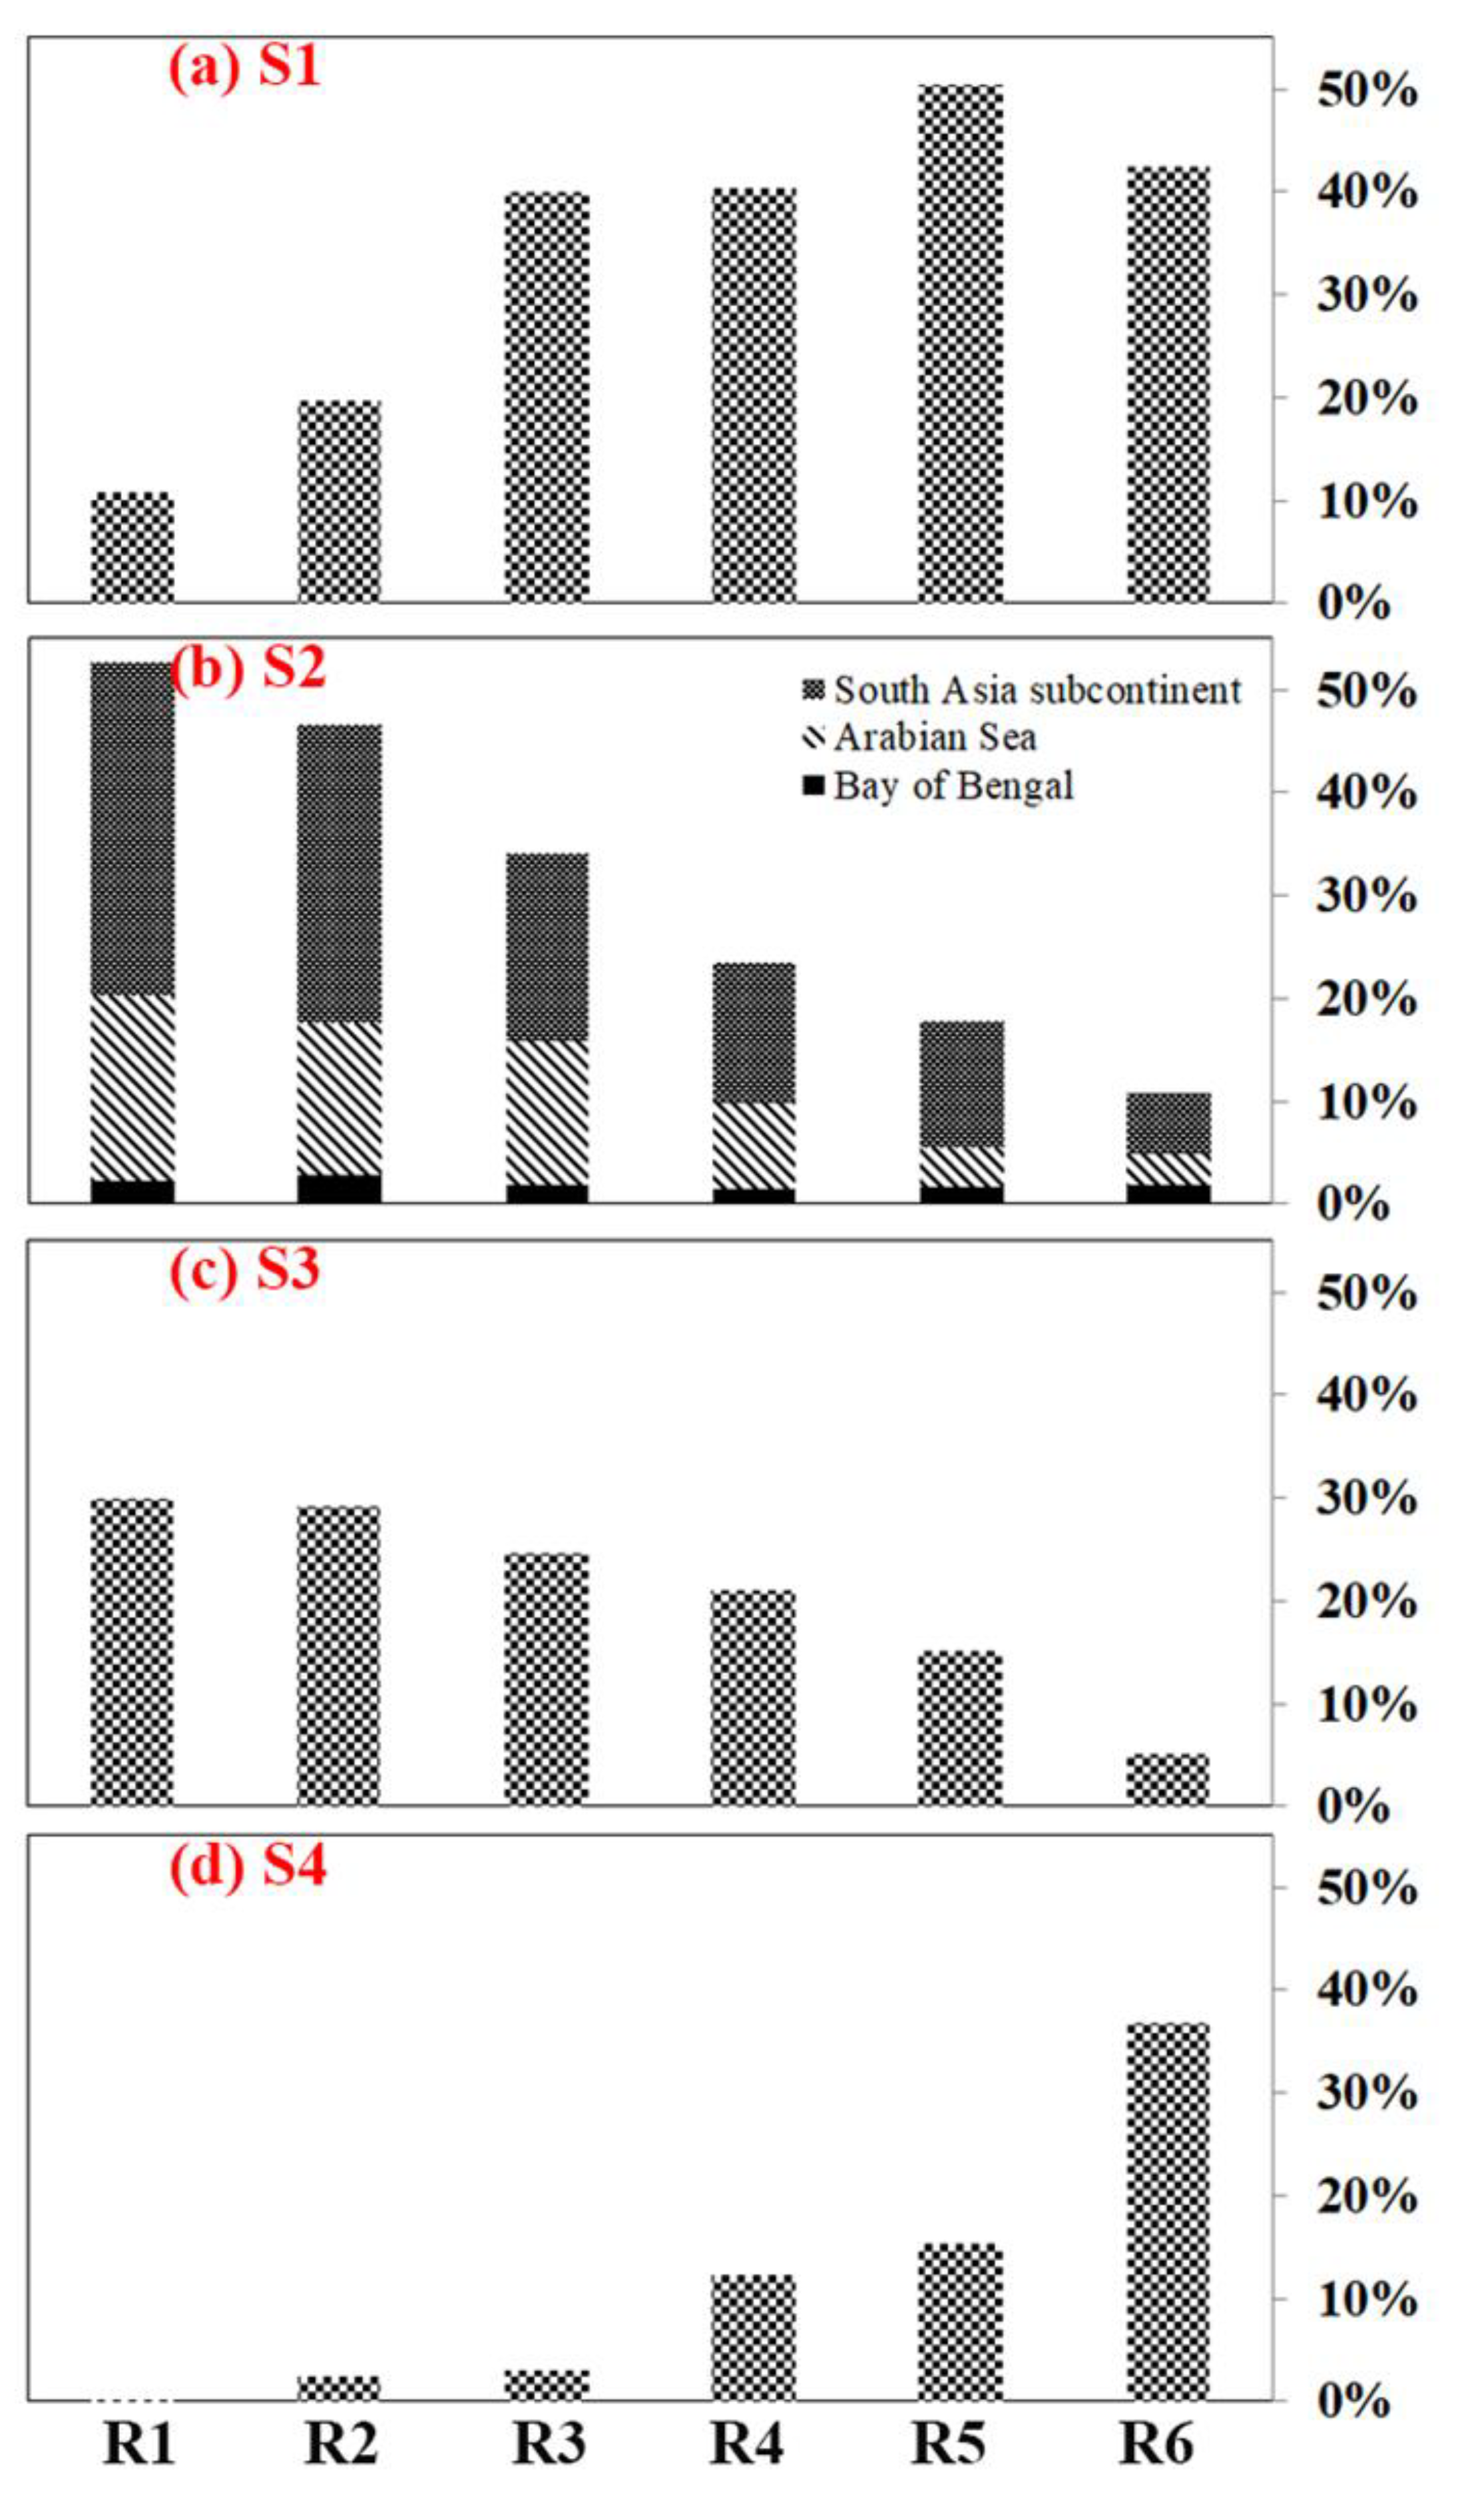
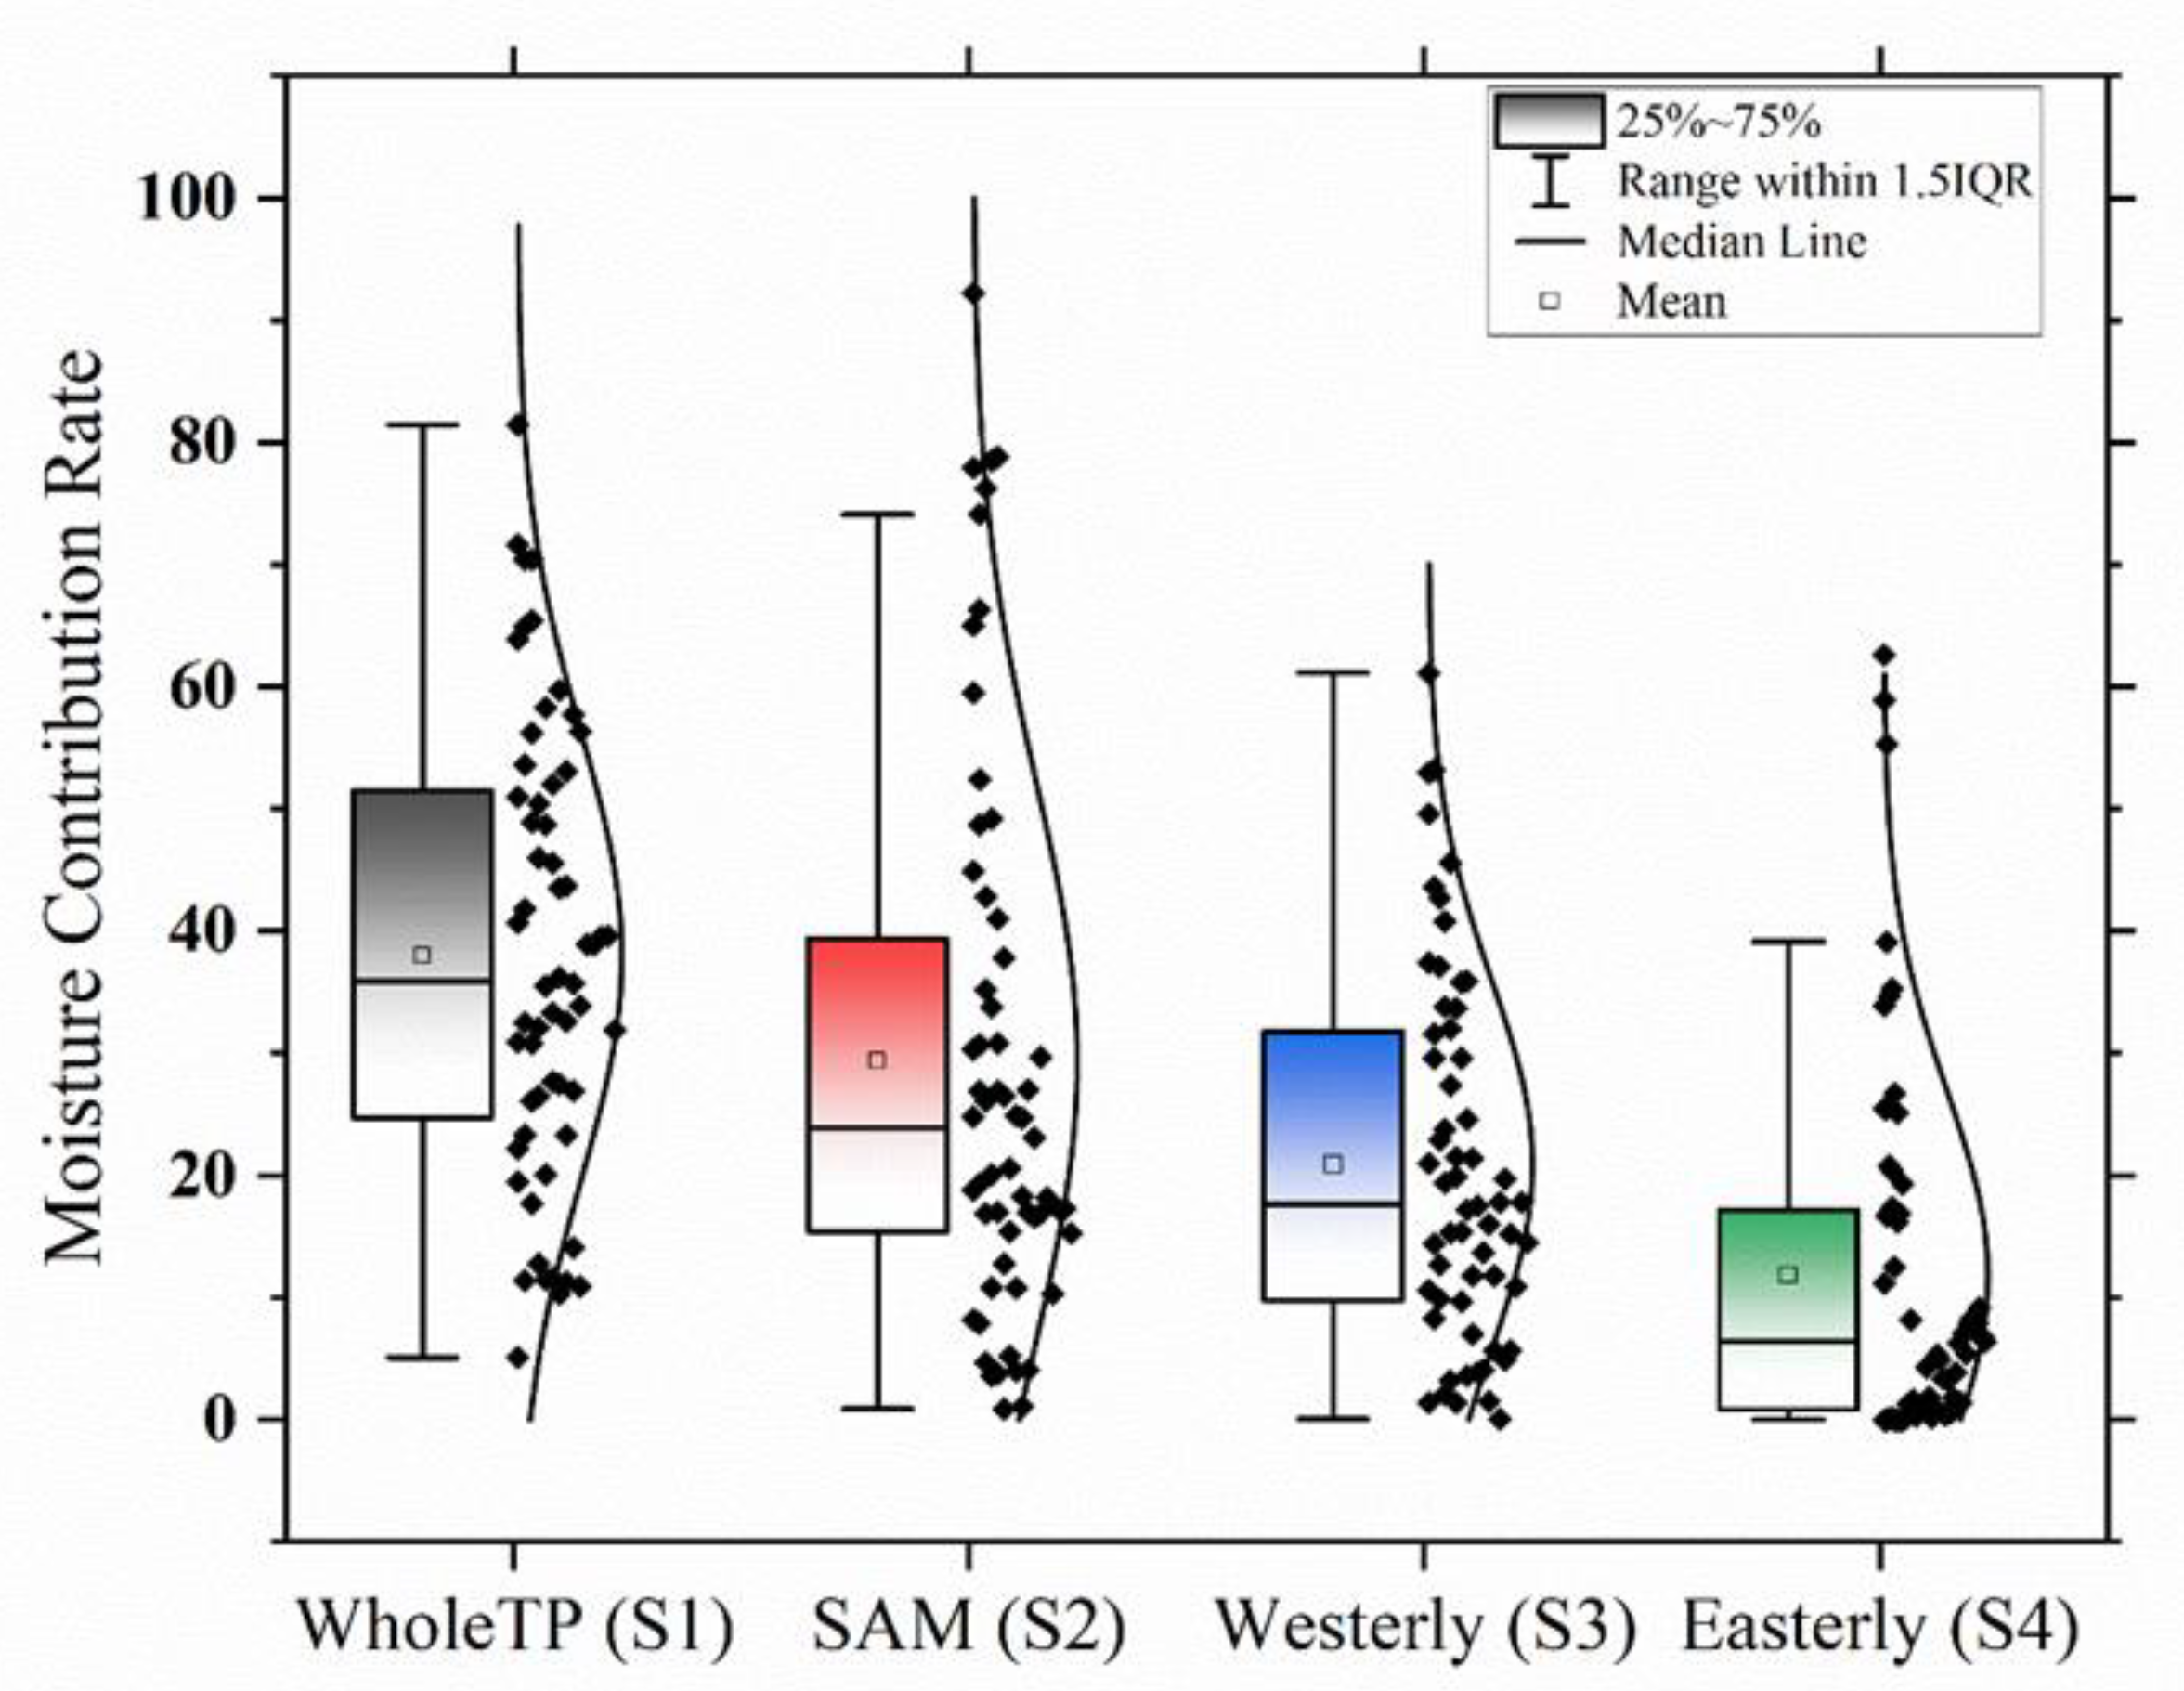
3.2. Moisture Sources and Their Contributions

During the ten extreme precipitation events in the R1 region, the effective moisture is mainly from external source regions of S2 and S3. The moisture contribution of S2 is comprised of the South Asia subcontinent, Arabian Sea, Bay of Bengal, with supplied moisture rate values of 30.7%, 18.1%, and 2.2%, respectively. The source region of S3 dominated by the westerly winds could share 30% of effective moisture, while source region S1 of the whole TP contributes almost all the remaining moisture during the extreme precipitation events of target subregion R1 (Figure 3a and Figure 4). It is difficult to transport moisture from the EAM region to the R1 because of the resisting effect of the unique terrain of the TP and inhibition of the westerly prevalence.
Similar to the R1, the S2 of the SAM region is also the leading moisture source of extreme precipitation over the target subregion of R2 (Figure 3b and Figure 4). The total effective moisture contribution rate of S2 is around 47.0%, including 29.4%, which is from the South Asia subcontinent, 14.8% provided by Arabian Sea and 2.8% offered from Bay of Bengal. By contrast with the R1, the interior TP and the Tarim Basin show a greater impact on the R2 target region (Figure 3b). The evaporation from the S1 region could contribute less than 20% effective moisture to the R2 during extreme precipitations.
Over both R1 and R2 target subregions, the second largest moisture source contribution is westerly moisture, which could provide about 30% moisture to extreme precipitation (Figure 4), followed by the whole TP evaporation, which offers less than 20% moisture. It indicates that the contribution of local moisture recycle to extreme precipitation is much less than that to the local climatology, which was reported to be around 60% [8,33]. Lastly, the moisture contribution by the easterly winds is the smallest and can be almost ignored over the western NTP.
The moisture influence from the SAM weakens gradually from the western to the eastern NTP (Figure 3c–e). However, it still provides substantial moisture contribution to the extreme precipitation in the central NTP (Figure 4): 33.1% to the target subregion R3, 23.5% to the R4, 18.0% to the R5, respectively. The evaporation from the whole TP is the dominant moisture source of central NTP, and its contributions to the R3, R4, and R5 are 40.0%, 40.3%, and 50.4%, respectively. However, the SAM moisture is still the most important external source for the extreme precipitation events over central NTP. The westerly moisture is the second largest foreign source, which is much larger than the moisture brought by the easterly winds.
As shown in Figure 3 and Figure 4, the EAM has little effect on the extreme precipitation over most NTP subregions but could contribute 37.0% of moisture to the target subregion R6. The SAM influences on the target subregion R6 are not apparent, with a total moisture contribution fraction of only 10.9%. The whole TP evaporation in source S1 is the dominant moisture source of R6 extreme precipitation and could provide around 46.0% of effective moisture, which is much larger than the fraction in source S2. In summary, the dominant moisture source for extreme precipitation events over each subregion in the NTP shows apparent differences. The SAM moisture is the leading moisture source of extreme precipitation events in the subregions of R1 and R2, while both the SAM and whole TP evaporation play important roles in the subregions of R3 and R4. Further, TP evaporation is the predominant contributor to subregion R5, and TP evaporation, together with the easterly winds, contribute around 80% effective moisture to subregion R6.

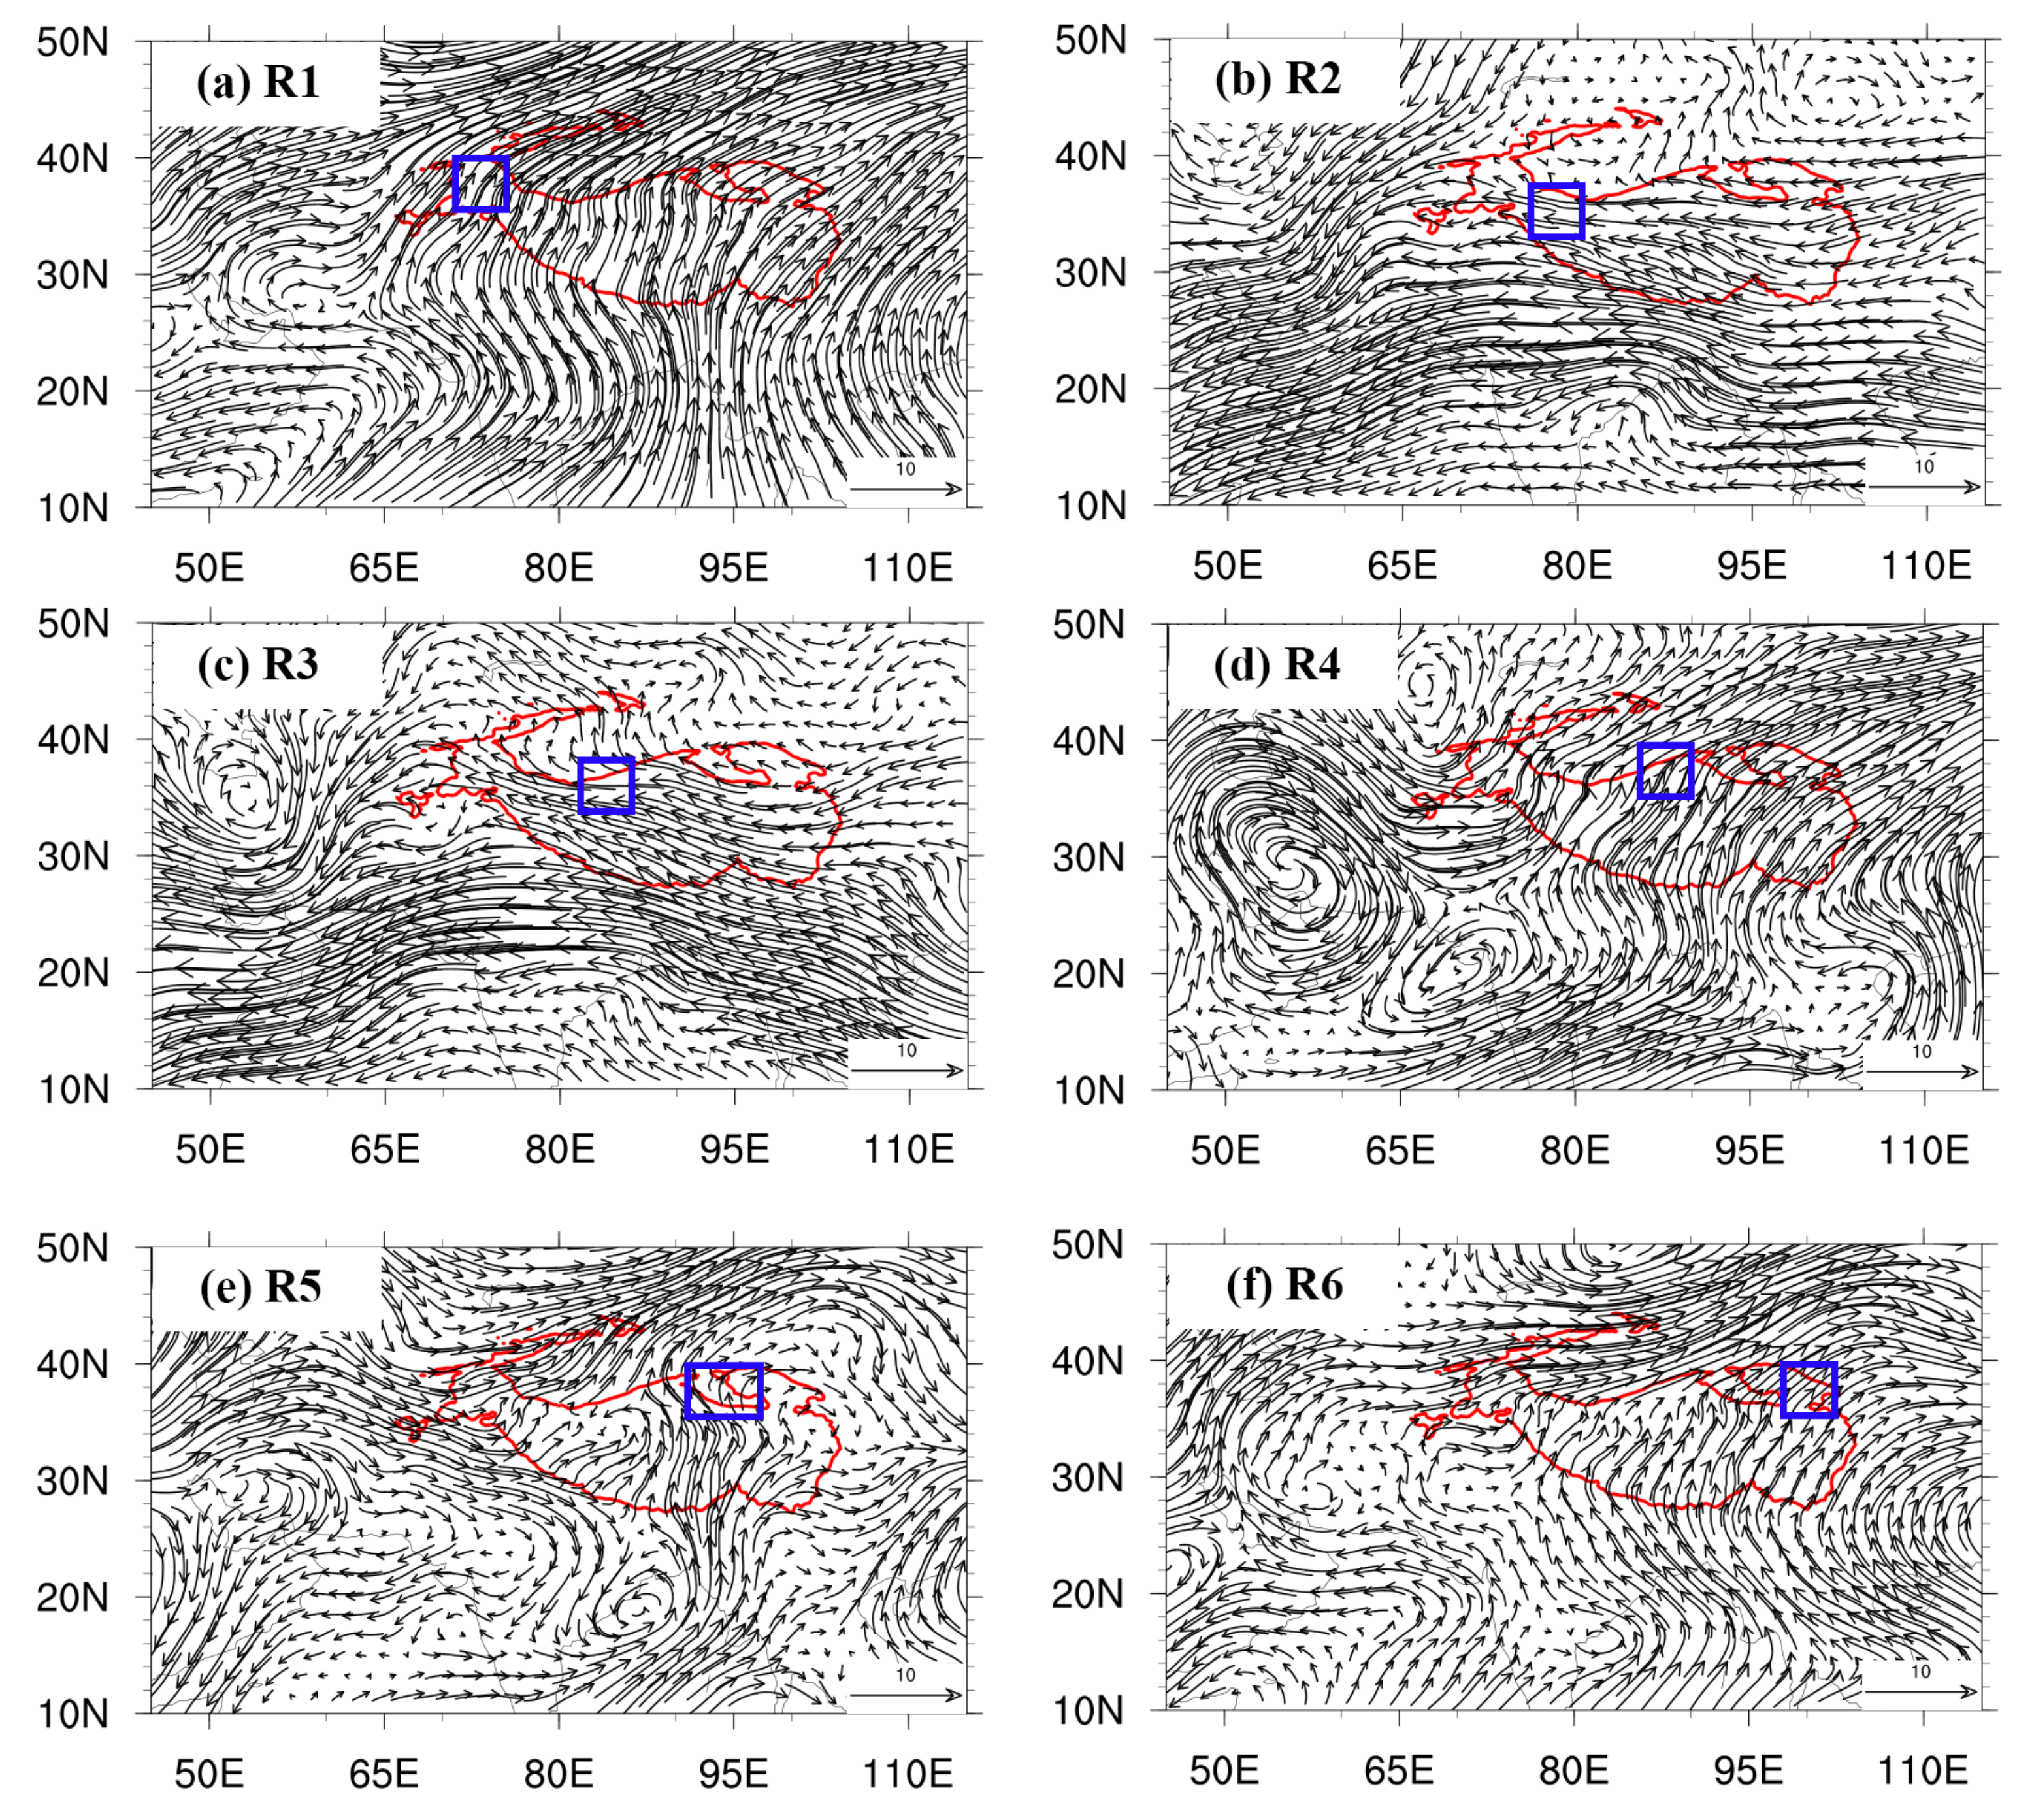
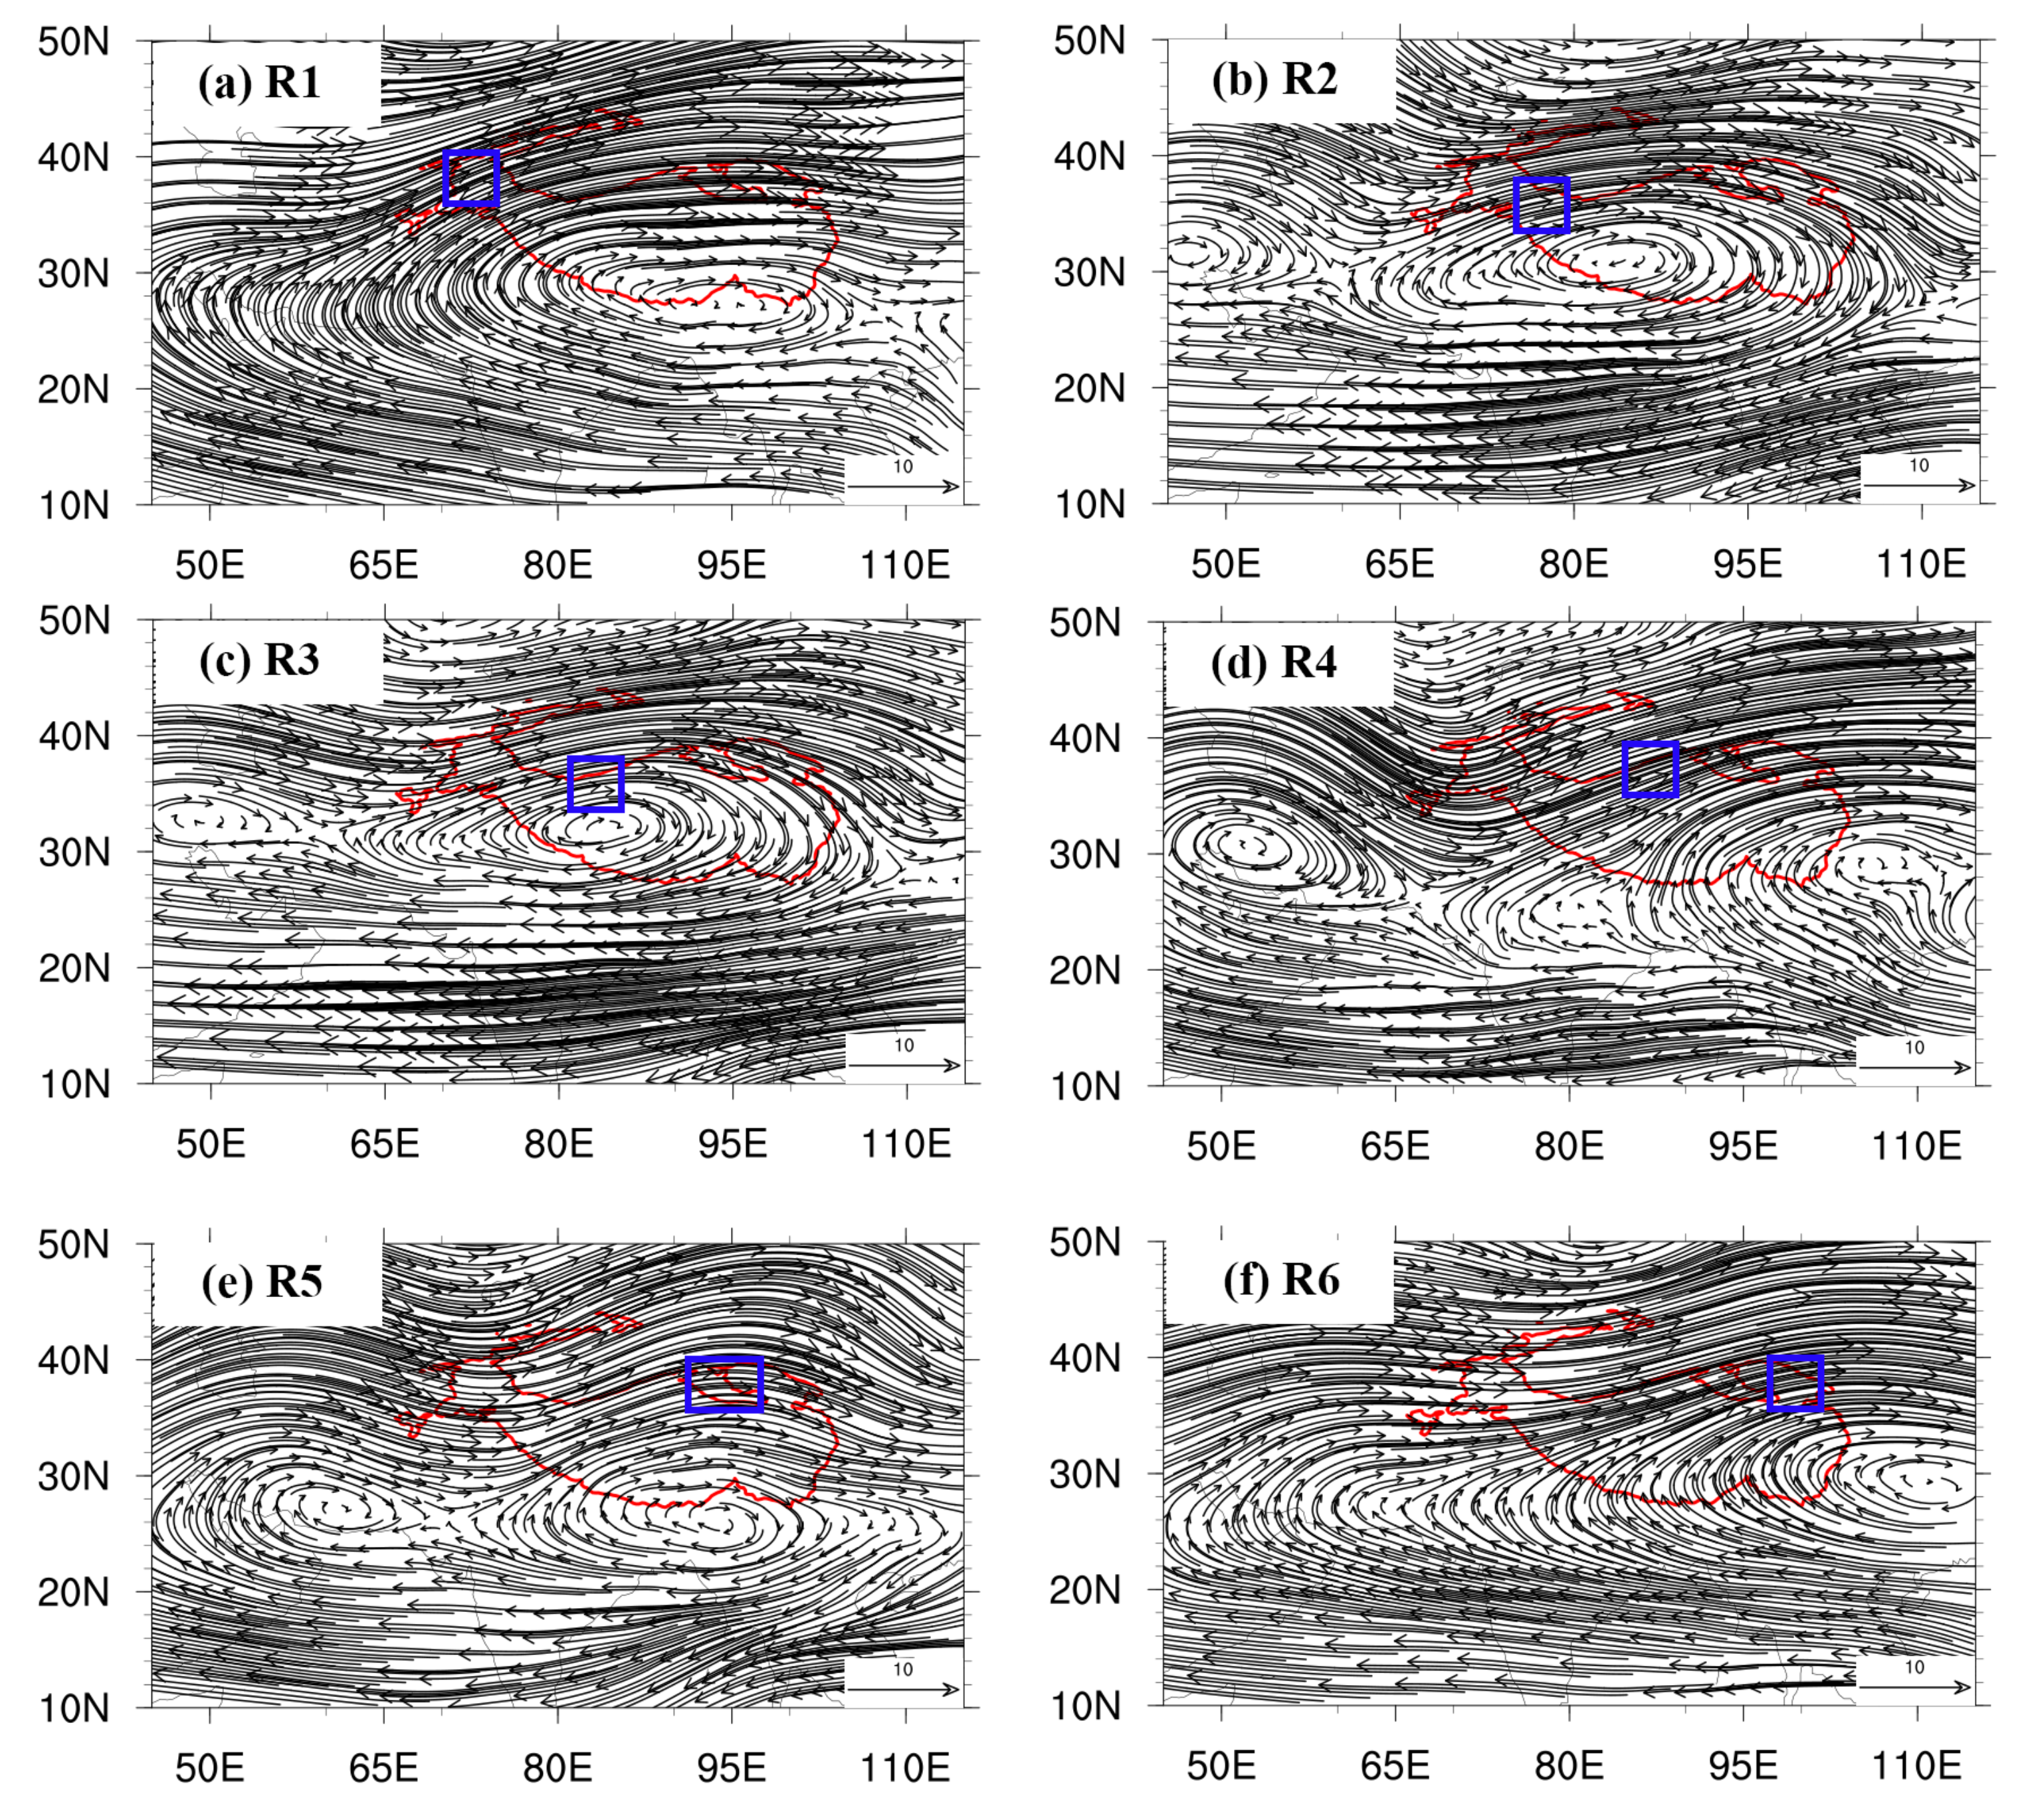
3.3. Atmospheric Circulation Patterns Prior to Extreme Precipitation Events

Among the 60 extreme precipitation events over the NTP (Table 1), the averaged moisture contribution from the SAM is comparable to the whole TP evaporation (Figure 5). The local moisture recycle could play a leading role in 37% of the extreme precipitation events over the NTP (Table 1). Meanwhile, only around 15% of events are dominated by the westerly winds, and the rest of events are led by the Asia monsoon moisture (the SAM and EAM). Among the external moisture sources, around 50% of extreme events originated from SAM moisture. What is more, in all three subregions of R1, R2, and R3, the SAM moisture contribution rates to several precipitation events appear with values of greater than 70% (Table 1 and Figure 5). It indicates that the SAM moisture has a vital role in extreme precipitation events of western NTP, whose influence may be greater than the westerlies and local moisture recycle.
Many previous studies pointed out that the westerlies control the weather and climate in the NTP [2,3,7,34]. However, extreme precipitation events dominated by the westerly moisture alone are very rare, and they mainly occur in the subregions of R1 and R2 (Table 1). Thus, we further explore the patterns of atmospheric circulation prior to the occurrence of extreme precipitation events, which are dominated by the Asia monsoon (SAM or EAM) moisture, whose contribution is greater than the others in Table 1. For example, over the target subregion of R1, the SAM dominated five in ten extreme precipitation events (Figure 6a).
(1)
Circulation configurations at low atmosphere of 500 hPa
At 500 hPa atmospheric layer, within the two days prior to the precipitation events, the southerly wind predominates over the target subregions of R1, R4, R5, and R6, while the easterly wind dominates overwhelmingly over the R2 and R3 subregions (Figure 6). Over the SAM regions, there are obviously cyclonic circulation patterns, i.e., there are cyclones over the Arabian Sea, which is conducive to the SAM moisture transport into the target subregion R4 (Figure 6d). As shown in Figure 6e, there is a cyclone over the western of Bengal Bay, which makes the moisture of Bengal Bay go straightly northward to the subregion R5, and there are cyclones over both the Arabian Sea and Bengal Bay, which also help moisture transport into subregion R6 (Figure 6f). When the monsoon cyclone has a large scale and its position leans toward the north, the TP will be completely under the control of the southerly or easterly winds, such as the circulation pattern of R1–R3 (Figure 6a–c).
Compared to the climatology average during the monsoon season from 2010 to 2018, the westerly winds are anomalously weak, and the easterly winds are anomalously strong at 500 hPa (Figure S4) prior to the extreme precipitation events over the subregions of R2 and R3. We could also find that there are obvious anomalous southerly wind intrusions from the SAM region in advance of the extreme precipitation events over the other subregions. All these atmospheric configurations are favorable for moisture transport from the low latitudes to the target regions.
(2)
Circulation configurations at high atmosphere
At a high atmospheric layer of 200 hPa, a closed South Asian High (SAH) is always inside (i.e., R2 and R3 target subregions) or around the TP (Figure 7) in advance to the extreme precipitation over all the six target subregions. A considerable trough (hereafter, Eurasian through) occurs over the TP and its north. All six target subregions are in front of Eurasian through (Figure 7). At the same time, a secondary anticyclone could be found west of the TP prior to the extreme precipitation over target subregions of R2, R3, R4, and R5. Compared against the average circulation at 200 hPa (Figure S5), there are westerly perturbations, sometimes of several closed cyclones and anticyclones appearing prior to the extreme precipitation, which results in anomalous strong easterlies (i.e., R2 and R3) and southerly winds (i.e., R1 and R6). It suggested that westerly weakening at high atmosphere is favorable to the extreme precipitation over the NTP.
Above all, when extreme precipitation occurs, all six subregions locate in front of the tough at 200 hPa. The positions and intensity of SAH influence the positions of precipitation. Meanwhile, they cooperated with the cyclones at 500 hPa to create considerably favorable conditions for SAM moisture transportation into the NTP. Against the climatology average, the upper-level westerly winds are abnormally weak, and the monsoon winds at the low-level atmosphere are abnormally enhanced during extreme precipitation events. The synergistic effects between the westerlies and Asia Monsoon are the key factors to induce the SAM moisture into the NTP during extreme precipitation events.

4. Discussion

The different characteristics of durations and circulation background were observed in extreme precipitation events led by different moisture sources. For instance, the median precipitation duration associated with the SAM moisture is three days. Meanwhile, when the westerly moisture plays a leading role in extreme precipitation events, its duration is around two days. Further, the precipitation duration is notably short to only one day when the whole TP evaporation or easterly wind dominates.
Because the SAM belongs to a synoptic scale system, it is stable during summer, and its influences cover widespread scopes and duration. Although the westerlies are planetary-scale meteorology systems, the westerly perturbations associated with the NTP extreme precipitation are usually on a medium scale. Moreover, the moisture content taken by the westerlies is much less than that from the SAM, which contains abundant moisture. Thus, the precipitation duration led by the westerly perturbations is shorter than that dominated by the SAM. The interactions between the westerlies and Asia monsoon could induce small-scale local cyclones [33], which are favorable for the whole TP evaporation releasing as precipitation. The EAM could enter the northeastern TP under weak westerly conditions, when the dominated systems are usually on a small or medium scale [17,35]. Thus, the extreme precipitation of moisture originating from the S2 or S4 is a short-time event.

5. Conclusions

The moisture in the Arabian Sea and the South Asia subcontinent provided by the SAM and the local evaporation of the entire TP are the dominant moisture sources of NTP extreme precipitation. However, the contributions of different sources varied with subregions in NTP. The SAM could contribute more than 50% moisture to the extreme precipitation events over western NTP, while only around 10% to the eastern NTP. In the central and eastern NTP regions, 40–50% moisture should owe to the whole TP evaporation. Besides, precipitation in the eastern NTP is not only controlled by the entire TP water cycle but also greatly affected by the easterly winds, which could bring 37% moisture to the extreme precipitation over eastern NTP. In addition, the SAM moisture is the leading foreign moisture and contributes much greater moisture than the westerlies. However, both the enhanced SAM and weakened westerly winds could help to trigger or to enhance the precipitation in the NTP. The modifications of upper-level large-scale and low-level synoptic-scale circulation are key factors influencing heavy rainfall events.
In short, the NTP is far from the ocean, there is very little moisture invading from the SAM regions into the NTP in climatology average. However, during the extreme precipitation events over the NTP, the moisture carried by the South Asia monsoon makes an apparent contribution. Therefore, it is necessary to consider the South Asia weather or climate conditions to predict and analyze the NTP extreme weather in future.

Supplementary Materials

The following supporting information can be downloaded at: https://www.mdpi.com/article/10.3390/rs15030735/s1, Figure S1: Spatial distribution of trajectory starting positions (blue dots), which are above 2500 m a.s.l., over each target sub-region in the Northern Tibetan Plateau (NTP). The number of starting points is presented in every sub-graph.

Author Contributions

Conceptualization, K.Y. and Y.W.; methodology, Y.W. and W.H.; software, W.H. and. T.Q.; formal analysis and investigation, Y.W.; writing-original draft preparation, Y.W.; writing—review and editing, Y.W., B.W., K.Y., W.H. and T.Q. All authors have read and agreed to the published version of the manuscript.

Funding

This research was funded by the National Science Foundation of China (Grant No. 41905087), the Second Tibet Plateau Scientific Expedition and Research Program (STEP) (Grant No. 2019QZKK0903-02 and Grant No. 2019QZKK0906) and Supported by National Science Foundation of China (Grant No. 41975125).

Data Availability Statement

The meteorology datasets of ERA-interim (https://www.ecmwf.int/node/8174 (accessed on 1 June to 30 September, 2010 to 2018) and ERA5 (https://doi.org/10.24381/cds.bd0915c6 (accessed on 1 June to 30 September, 2010 to 2018) are used to explore the extreme precipitation events and their moisture trajectories. And the soil moisture product is from ESA CCI (https://climate.esa.int/en/odp/#/project/soil-moisture (accessed on 1 June to 30 September, 2010 to 2018), which is used in supplements to understand the influences of precipitation on ecology.

Conflicts of Interest

The authors declare no conflict of interest.

References

  1. Xu, X.; Lu, C.; Shi, X.; Gao, S. World water tower: An atmospheric perspective. Geophys. Res. Lett. 2008, 35, l035867. [Google Scholar] [CrossRef]
  2. Yao, T.; Masson-Delmotte, V.; Gao, J.; Yu, W.; Yang, X.; Risi, C.; Sturm, C.; Werner, M.; Zhao, H.; He, Y.; et al. A review of climatic controls on δ18O in precipitation over the Tibetan Plateau: Observations and simulations. Rev. Geophys. 2013, 51, 525–548. [Google Scholar] [CrossRef]
  3. Yao, T.; Thompson, L.; Yang, W.; Yu, W.; Gao, Y.; Guo, X.; Yang, X.; Duan, K.; Zhao, H.; Xu, B.; et al. Different glacier status with atmospheric circulations in Tibetan Plateau and surroundings. Nat. Clim. chang. 2012, 2, 663–667. [Google Scholar] [CrossRef]
  4. Chen, B.; Xu, X.-D.; Yang, S.; Zhang, W. On the origin and destination of atmospheric moisture and air mass over the Tibetan Plateau. Theor. Appl. Climatol. 2012, 110, 423–435. [Google Scholar] [CrossRef]
  5. Feng, L.; Zhou, T. Water vapor transport for summer precipitation over the Tibetan Plateau: Multidata set analysis. J. Geophys. Res. Atmos. 2012, 117, 17012. [Google Scholar] [CrossRef] [Green Version]
  6. Hren, M.T.; Bookhagen, B.; Blisniuk, P.M.; Booth, A.L.; Chamberlain, C.P. δ18O and δD of streamwaters across the Himalaya and Tibetan Plateau: Implications for moisture sources and paleoelevation reconstructions. Earth Planet. Sci. Lett. 2009, 288, 20–32. [Google Scholar] [CrossRef]
  7. Wang, Z.; Duan, A.; Yang, S.; Ullah, K. Atmospheric moisture budget and its regulation on the variability of summer precipitation over the Tibetan Plateau. J. Geophys. Res. Atmos. 2017, 122, 614–630. [Google Scholar] [CrossRef]
  8. Curio, J.; Maussion, F.; Scherer, D. A 12-year high-resolution climatology of atmospheric water transport over the Tibetan Plateau. Earth Syst. Dyn. 2015, 6, 109–124. [Google Scholar] [CrossRef] [Green Version]
  9. Ma, Y.; Lu, M.; Chen, H.; Pan, M.; Hong, Y. Atmospheric moisture transport versus precipitation across the Tibetan Plateau: A mini-review and current challenges. Atmos. Res. 2018, 209, 50–58. [Google Scholar] [CrossRef]
  10. Guan, X.; Yang, L.; Zhang, Y.; Li, J. Spatial distribution, temporal variation, and transport characteristics of atmospheric water vapor over Central Asia and the arid region of China. Glob. Planet. chang. 2019, 172, 159–178. [Google Scholar] [CrossRef]
  11. Liu, Z.; Wen, X.; Brady, E.C.; Otto-Bliesner, B.; Yu, G.; Lu, H.; Cheng, H.; Wang, Y.; Zheng, W.; Ding, Y.; et al. Chinese cave records and the East Asia Summer Monsoon. Quat. Sci. Rev. 2014, 83, 115–128. [Google Scholar] [CrossRef]
  12. Mölg, T.; Maussion, F.; Yang, W.; Scherer, D. The footprint of Asian monsoon dynamics in the mass and energy balance of a Tibetan glacier. Cryosphere 2012, 6, 1445–1461. [Google Scholar] [CrossRef] [Green Version]
  13. Yamada, H.; Kurita, N. The Role of Local Moisture Recycling Evaluated Using Stable Isotope Data from over the Middle of the Tibetan Plateau during the Monsoon Season. J. Hydrometeorol. 2008, 9, 760–775. [Google Scholar] [CrossRef]
  14. Wang, X.; Chen, M.; Gong, P.; Wang, C. Perfluorinated alkyl substances in snow as an atmospheric tracer for tracking the interactions between westerly winds and the Indian Monsoon over western China. Env. Int. 2019, 124, 294–301. [Google Scholar] [CrossRef]
  15. Pan, C.; Zhu, B.; Gao, J.; Kang, H.; Zhu, T. Quantitative identification of moisture sources over the Tibetan Plateau and the relationship between thermal forcing and moisture transport. Clim. Dyn. 2018, 52, 181–196. [Google Scholar] [CrossRef]
  16. Huang, Y.; Cui, X. Moisture sources of an extreme precipitation event in Sichuan, China, based on the Lagrangian method. Atmos. Sci. Lett. 2015, 16, 177–183. [Google Scholar] [CrossRef]
  17. Sun, B.; Wang, H. Moisture Sources of Semiarid Grassland in China Using the Lagrangian Particle Model FLEXPART. J. Clim. 2014, 27, 2457–2474. [Google Scholar] [CrossRef]
  18. Yang, M.; Wang, X.; Pang, G.; Wan, G.; Liu, Z. The Tibetan Plateau cryosphere: Observations and model simulations for current status and recent changes. Earth-Sci. Rev. 2019, 190, 353–369. [Google Scholar] [CrossRef]
  19. Lei, Y.; Zhu, Y.; Wang, B.; Yao, T.; Yang, K.; Zhang, X.; Zhai, J.; Ma, N. Extreme Lake Level Changes on the Tibetan Plateau Associated With the 2015/2016 El Niño. Geophys. Res. Lett. 2019, 46, 5889–5898. [Google Scholar] [CrossRef]
  20. Xiong, J.; Yong, Z.; Wang, Z.; Cheng, W.; Li, Y.; Zhang, H.; Ye, C.; Yang, Y. Spatial and Temporal Patterns of the Extreme Precipitation across the Tibetan Plateau (1986–2015). Water 2019, 24, 1453. [Google Scholar] [CrossRef]
  21. Yang, K.; Ye, B.; Zhou, D.; Wu, B.; Foken, T.; Qin, J.; Zhou, Z. Response of hydrological cycle to recent climate changes in the Tibetan Plateau. Clim. chang. 2011, 109, 517–534. [Google Scholar] [CrossRef]
  22. Zhang, J.; Shen, X.; Wang, B. Changes in precipitation extremes in Southeastern Tibet, China. Quat. Int. 2015, 380, 49–59. [Google Scholar] [CrossRef]
  23. Berrisford, P.; Dee, D.P.; Poli, P.; Brugge, R.; Fielding, M.; Fuentes, M.; Kållberg, P.W.; Kobayashi, S.; Uppala, S.; Simmons, A. The ERA-Interim Archive Version 2.0, in ERA Report Series; ECMWF: Reading, UK, 2011; p. 23. [Google Scholar]
  24. Dee, D.P.; Uppala, S.M.; Simmons, A.J.; Berrisford, P.; Poli, P.; Kobayashi, S.; Andrae, U.; Balmaseda, M.A.; Balsamo, G.; Bauer, P.; et al. The ERA-Interim reanalysis: Configuration and performance of the data assimilation system. Q. J. R. Meteorol. Soc. 2011, 137, 553–597. [Google Scholar] [CrossRef]
  25. Hersbach, H.; Bell, B.; Berrisford, P.; Biavati, G.; Horányi, A.; Muñoz Sabater, J.; Nicolas, J.; Peubey, C.; Radu, R.; Rozum, I.; et al. ERA5 Hourly Data on Single Levels from 1979 to Present; Copernicus Climate Change Service (C3S), Climate Data Store (CDS): Brussels, Belgium, 2018. [Google Scholar]
  26. Jiang, Q.; Li, W.; Fan, Z.; He, X.; Sun, W.; Chen, S.; Wang, J. Evaluation of the ERA5 reanalysis precipitation dataset over Chinese Mainland. J. Hydrol. 2021, 595, 125660. [Google Scholar] [CrossRef]
  27. Zhang, Y.; Cai, C.; Chen, B.; Dai, W. Consistency Evaluation of Precipitable Water Vapor Derived From ERA5, ERA-Interim, GNSS, and Radiosondes Over China. Radio Sci. 2019, 54, 561–571. [Google Scholar] [CrossRef]
  28. Maussion, F.; Scherer, D.; Mölg, T.; Collier, E.; Curio, J.; Finkelnburg, R. Precipitation Seasonality and Variability over the Tibetan Plateau as Resolved by the High Asia Reanalysis. J. Clim. 2014, 27, 1910–1927. [Google Scholar] [CrossRef] [Green Version]
  29. Sprenger, M.; Wernli, H. The LAGRANTO Lagrangian analysis tool—Version 2.0. Geosci. Model Dev. 2015, 8, 2569–2586. [Google Scholar] [CrossRef] [Green Version]
  30. Wernli, B.H.; Davies, H.C. A lagrangian-based analysis of extratropical cyclones. I: The method and some applications. Q. J. R. Meteorol. Soc. 1997, 123, 467–489. [Google Scholar] [CrossRef]
  31. Huang, W.; He, X.; Yang, Z.; Qiu, T.; Wright, J.S.; Wang, B.; Lin, D. Moisture Sources for Wintertime Extreme Precipitation Events Over South China During 1979–2013. J. Geophys. Res. Atmos. 2018, 123, 6690–6712. [Google Scholar] [CrossRef]
  32. Sodemann, H.; Schwierz, C.; Wernli, H. Interannual variability of Greenland winter precipitation sources: Lagrangian moisture diagnostic and North Atlantic Oscillation influence. J. Geophys. Res. 2008, 113, 8503. [Google Scholar] [CrossRef]
  33. Yang, M.; Yao, T.; Gou, X.; Tang, H. Water Recycling between the Land Surface and Atmosphere on the Northern Tibetan Plateau—A Case Study at Flat Observation Sites. Arct. Antarct. Alp. Res. 2007, 39, 694–698. [Google Scholar]
  34. Chen, B.; Zhang, W.; Yang, S.; Xu, X. Identifying and contrasting the sources of the water vapor reaching the subregions of the Tibetan Plateau during the wet season. Clim. Dyn. 2019, 53, 6891–6907. [Google Scholar] [CrossRef]
  35. Zongxing, L.; Yan, G.; Yamin, W.; Yanhui, P.; Jianguo, L.; Aifang, C.; Tingting, W.; Chuntan, H.; Yaoxuan, S.; Theakstone, W.H. Can monsoon moisture arrive in the Qilian Mountains in summer? Quat. Int. 2015, 358, 113–125. [Google Scholar] [CrossRef]
Figure 1. The distribution of precipitation features over the Northern Tibetan Plateau in the monsoon season (June-September or JJAS) from 2010 to 2018. (a) The mean JJSA precipitation averaged from 2010 to 2018 (unit: mm/JJAS), (b) the total day number of daily precipitation amount larger than 1 mm, from 2010 to 2018, (c) the ratio of precipitation amount in the strongest ten events to the precipitation during the monsoon-seasons (JJAS) (units: %), (d) the ratio of precipitation duration (precipitation amount) in the strongest ten events to that during JJAS (units: %). Note: from west to east, the target subregions were named as R1 (Lat: 35–40°N, Lon: 71–76°E), R2 (Lat: 33–38°N, Lon: 76–81°E), R3 (Lat: 33–38°N, Lon: 81–86°E), R4 (Lat: 34–39°N, Lon: 86–91°E), R5 (Lat: 34–39°N, Lon: 91–98°E), and R6 (Lat: 34–39°N, Lon: 98–103°E).
Remotesensing 15 00735 g001
Figure 2. Tracked moisture source regions. S1: Whole Tibetan Plateau with an elevation higher than 2500 m; S2: South Asian monsoon region including South Asia subcontinent, Arabian Sea, and Bay of Bengal; S3: West region of 90°E and regions of S1 and S2 are taken out; S4: East region of 90°E and regions of S1 and S2 are taken out.
Remotesensing 15 00735 g002
Figure 3. Spatial distributions of mean contributions (units: mm day−1) of moisture sources for ten extreme precipitation events over the six subregions. The solid red line denotes the boundary of Tibetan Plateau with an elevation higher than 2500 m. Black rectangles in the panels (af) represent the subregions, respectively.
Remotesensing 15 00735 g003
Figure 4. Moisture contribution ratios of the source regions of (a) S1, (b) S2, (c) S3, and (d) S4 for extreme precipitation events in each target subregion (R1, R2, R3, R4, R5, and R6).
Remotesensing 15 00735 g004
Figure 5. Boxplot from raw data (black dots) of moisture contribution ratios of the four source regions during all the 60 extreme precipitation events in the Northern Tibetan Plateau. Note: The curve right to the boxplot is a normal distribution curve from raw data of moisture contribution ratio.
Remotesensing 15 00735 g005
Figure 6. The spatial distributions of composed ERA5 wind at 500 hPa, which were averaged over two days in advance of the extreme precipitation events controlled by the Asia Monsoon over the six subregions. Blue rectangles in the panels (a–f) represent the subregions, respectively.
Remotesensing 15 00735 g006
Figure 7. Similar to Figure 6, but at 200 hPa. Blue rectangles in the panels (a–f) represent the subregions, respectively.
Remotesensing 15 00735 g007
Table 1. Information of the top ten extreme precipitation events in each target region, including the precipitation date, precipitation amount, external moisture contribution rate of each precipitation event, etc.
Target RegionOccurrence TimeDuration (Days)Precipitation (mm)External Moisture Contribution Rate (%)
SAM (S2)Westerly (S3)Easterly (S4)
R13–4 Jun. 2010215.0224.8530
21–22 Jul. 2010214.3759.5210
28–30 Jul. 2010343.9577.910.60.1
17–18 Sep. 2010214.8726.949.60.2
17–18 Sep. 2012221.7630.343.60
12–14 Aug. 2013326.2844.937.40
15–16 Aug. 2014214.8926.161.10
2–5 Sep. 2014423.9874.114.40
24–25 Jun. 2015216.6830.742.70.1
22 Sep. 201519.1192.21.41.3
R226–28 Jul. 2010321.8520.140.88.2
13–16 Aug. 2011429.2948.729.61.6
3–4 Aug. 2012212.4818.853.20.3
15–17 Jun. 2013326.496522.90.5
3–5 Sep. 2014327.376.212.70.8
10–11 Jul. 2015214.6342.823.80.9
1–5 Aug. 2015530.7919.345.64.3
22–23 Sep. 2015219.0678.58.31.9
28–30 Jun. 2017319.1166.319.40.2
22–23 Aug. 2018219.3135.231.61.1
R325 Jul.–1 Aug. 2010748.1416.937.15.3
15 Jul. 201118.918.215.34.9
13–16 Aug. 2011427.0549.219.93.4
16–17 Jun. 2013223.1178.89.90.4
16–20 Jul. 2014534.6433.827.43.3
15–16 Jul. 2016218.0826.921.50.6
1 Aug. 201619.4310.833.81.8
8–9 Aug. 2016217.497.9323.9
20–21 Aug. 2016215.1930.829.66.3
28–30 Jun. 2017319.9637.824.61.4
R47 Jun. 201118.974.733.711.2
16 Aug. 201118.2426.515.425.5
19 Jul. 201219.873.621.416.7
16–18 Jun. 2013323.1452.417.27.1
25 Aug. 201318.3172.117
25–26 Jun. 2015214.54111.85.4
30 Jun.–1 Jul. 2015215.9720.635.87.9
22 Jul. 201617.963.817.58.3
9 Aug. 201619.712.835.917.4
13 Aug. 201818.824.913.712.5
R56 Jun. 2010110.140.93.225.5
26–29 Jun. 2010429.3424.7167.3
19–20 Jun. 2011214.6415.411.87.9
15 Jun. 201119.932717.89.2
4 Jun. 201219.6110.819.720.8
26 Aug. 201318.9218.315.26.8
23–25 Jul. 2013322.01171.416.2
23–26 Jun. 2014427.8323.110.920.4
1–3 Jul. 201532316.617.826.7
30 Jun.–2 Jul. 2018322.929.714.516.9
R620–21 Jun. 2011227.3716.99.733.9
7 Jul. 2013118.3518.23.625.1
6 Aug. 2013114.655.276.4
27 Jun. 2014114.0710.33.958.9
13 Sep. 2014114.1917.24.139.1
19 Jun. 2015114.9441.562.6
17 Jul. 2016114.1817.35.719.3
24 Aug. 2016114.561.10.155.3
6 Aug. 2017115.174.14.934.7
1 Jul. 2018120.8115.35.735.3
Disclaimer/Publisher’s Note: The statements, opinions and data contained in all publications are solely those of the individual author(s) and contributor(s) and not of MDPI and/or the editor(s). MDPI and/or the editor(s) disclaim responsibility for any injury to people or property resulting from any ideas, methods, instructions or products referred to in the content.

