Article

Cross-Radiometric Calibration and NDVI Application Comparison of FY-4A/AGRI Based on Aqua-MODIS

1
School of Earth Sciences and Technology, Zhengzhou University, Zhengzhou 450001, China
2
State Key Laboratory of Severe Weather, Chinese Academy of Meteorological Sciences, Beijing 100081, China
*
Author to whom correspondence should be addressed.
Remote Sens. 2023, 15(23), 5454; https://doi.org/10.3390/rs15235454
Submission received: 2 October 2023 / Revised: 18 November 2023 / Accepted: 20 November 2023 / Published: 22 November 2023
(This article belongs to the Special Issue Remote Sensing Satellites Calibration and Validation)

Abstract

:
To enhance the accuracy and stability of FY-4A/AGRI detection data, the MODIS, with highly accurate onboard calibration, is selected as the reference sensor for cross-radiation calibration calculations. The following are the data selection conditions: full considered time, observation geometries, field angles, cloud cover, etc. FY-4A/AGRI and Aqua-MODIS image data are selected as matching sample region locations, where the time difference between the observations for the same ground object is less than 15 min, the satellite zenith angle is less than 30°, and the field angle difference is less than 0.01. The 245 collected reflectance spectral curves are convolved with the spectral response functions of the two sensors, and the spectral band adjustment factors of the corresponding bands are calculated for spectral correction purposes. The cross-calibration coefficients for the red and near-infrared bands are calculated by linearly fitting the simulated top of the atmosphere reflectance values and digital number values from the AGRI sensor in a homogeneous area. In this paper, 16 cross-calibration calculations are performed on FY-4A/AGRI image data from August 2018 to September 2020, and the results are compared with the original calibration coefficients to test the feasibility of the proposed method. Additionally, 31 cross-calibration calculations are performed on image data from October 2020 to December 2022 to study the resulting AGRI sensor quality and performance changes. The NDVI of the FY-4A/AGRI image data was calculated before and after the cross-radiometric calibration using the maximum synthesis method. Additionally, the NDVI of the MODIS image data was compared and analyzed from three aspects: time, space, and the change trend. The results show that the spectral band adjustment factor calculated using the reflectance spectral curves of the ground objects in this paper can effectively correct for the spectral differences between the two sensors. Sixteen cross-calibration coefficients are less than 5.2% different from the original calibration coefficients, which fully proves the feasibility of the method used in this paper. All of the cross-calibration results show that the AGRI sensors have a certain degree of attenuation in the red and near-infrared bands, and the annual attenuation rates are approximately 1.37% and 2.55%, respectively. Cross-radiometric calibration has further improved the quality of the NDVI in FY-4A/AGRI imagery, enhancing the precision of its data application.

1. Introduction

The accuracy and stability of satellite sensing data are the foundation for quantitative applications of satellite remote sensing data. However, during the long-term operation of satellites in orbit, they are susceptible to factors such as platform vibration, component aging, and drastic operating environment changes, resulting in radiometric performance changes [1]. To study the quality and performance changes exhibited by sensors mounted on satellites with an increasing running time and realize long-term accurate quantitative applications of satellite data, it is necessary to carry out radiometric calibration for the sensors [2]. AGRI, a sensor mounted on China’s second-generation FY-4A geostationary satellite, is a key instrument in the history of China’s geostationary meteorological satellites, providing greater opportunities to observe rapid land, ocean, and atmospheric changes, but its calibration frequency is low. Since 9 September 2020, the National Satellite Meteorological Center has not updated the calibration coefficient of the FY-4A/AGRI solar reflection band, so it is of great significance to study the possible changes in its on-orbit radiative calibration process to promote deep and accurate applications of the FY-4A satellite.
Many radiometric calibration methods are available for sensors, among which cross-radiometric calibration refers to the comparison and analysis of the results obtained from the observation of the same target at the same time and using the reference instrument and the instrument to calibrate them from the same perspective. The calibration coefficient of the sensor to be calibrated is obtained, and the original calibration results of the calibrated sensor are corrected. Compared with site calibration, cross-radiation calibration has a lower calibration cost, no synchronous observation condition limitations, and it can effectively achieve improved calibration frequency [3]. In recent years, with the development of cross-radiation calibration technology, this technology has been widely used [4]. The observation geometry obtained based on FY-4A geostationary satellite image data is only related to the locations of ground objects, making these data different from the MODIS data and other image data. Furthermore, compared with the MODIS data and other image data, the observation geometry of FY-4A/AGRI has a wider band. It is necessary to solve the problems of geometric matching and spectral difference correction when using cross-radiation calibration for FY-4A/AGRI image data.
Observational geometry matching is an important factor that affects the accuracy of cross-radiation calibration [5]. The ideal conditions for sensor cross calibration are the same as those of pupil observation. A so-called “same” pupil observation means that two satellites observe the same target from the same perspective at the same time, which requires time matching, geometric matching, and viewing angle matching to be performed on the satellite observation data to eliminate the uncertainties related to the atmospheric path, observation geometry, and observation time differences [6,7]. With the support of the Dunhuang radiometric calibration field, the GF series [4,8], FY series [9,10,11], and HJ series [12,13] all use the calibration field to calibrate and correct the observed geometric differences between two sensors based on the bidirectional reflectance distribution function (BRDF) model. FY-4A image data are approximately 54.7° apart from the Dunhuang satellite zenith angle, far exceeding the 30° range that is generally required for site radiometric calibration. Although the BRDF model can reduce the influence of perspective differences, its correction amplitude change is relatively large, which will lead to new errors, limiting the ability of the model to correct the observation geometry difference between the two sensors of interest [14].
The spectral difference is another important factor that affects the accuracy of cross calibration. Observations acquired from the same pupil ensure that they possess the same spatial radiation source, but for the same radiation input, spectral response function (SRF) differences lead to different output response signals, requiring the correction of the spectral difference between the corresponding bands of the reference sensor and the sensor to be calibrated [15]. In many cases, the spectral band adjustment factor (SBAF) is calculated using the atmospheric radiative transfer model for spectral correction purposes. Chen Y. et al. [16] used the 6S radiation transfer model to calculate the SBAF for the spectral correction task [17]. Liu Q. et al. [18] used the MODTRAN radiative transfer model to simulate hyperspectral curves and calculated the SBAF with RSF convolution for spectral correction. Their method relies too much on the atmospheric radiative transmission model, and the model itself has some uncertainty, which leads to high uncertainty in the cross-calibration coefficient.
The MODIS has a perfect onboard calibration system, and the accuracy of the solar band reflectance calibration is ±2% [19,20]. Aqua-MODIS optics degradation is smaller than Terra-MODIS [21], and it is often used as a reference sensor for the cross-radiation calibration of other satellite sensors. Sentinel 2A/2B MSI [22], GF-1 PMS [23], HJ-1A CCD1 [24], and others have used the Aqua-MODIS for cross-radiation calibration, and the results show that the calibration coefficient obtained using this method has high accuracy and satisfies the quantitative requirements of applications. In view of the influence of traditional methods on the accuracy of geometric matching and spectral correction, the MODIS is used as the reference sensor [23,25] in this paper to achieve cross-radiation calibration for the FY-4A/AGRI sensor and obtain the cross-calibration coefficients of the red band and near-infrared (NIR) band. FY-4A/AGRI image data were utilized for the NDVI calculations, and the NDVI values computed before and after the cross-radiometric calibration were compared with the MODIS. In this study, spectral correction was carried out through spectral ground object reflectance curves, and the region where different sensors satisfy the conditions of time matching and geometric matching was selected for sensor cross-calibration, which is conducive to reducing the influences of the radiation transmission model, solar angle, and observation angle on the cross-radiation calibration results, further improving the accuracy of FY-4A/AGRI radiative calibration and improving the radiation performance of the FY-4A/AGRI sensor. The NDVI values calculated from the FY-4A/AGRI image data before and after the cross-radiometric calibration were compared with the MODIS image data in terms of time, space, and change trends. This analysis aims to evaluate the feasibility and accuracy of the cross-radiometric calibration method for NDVI calculations using FY-4A/AGRI data.

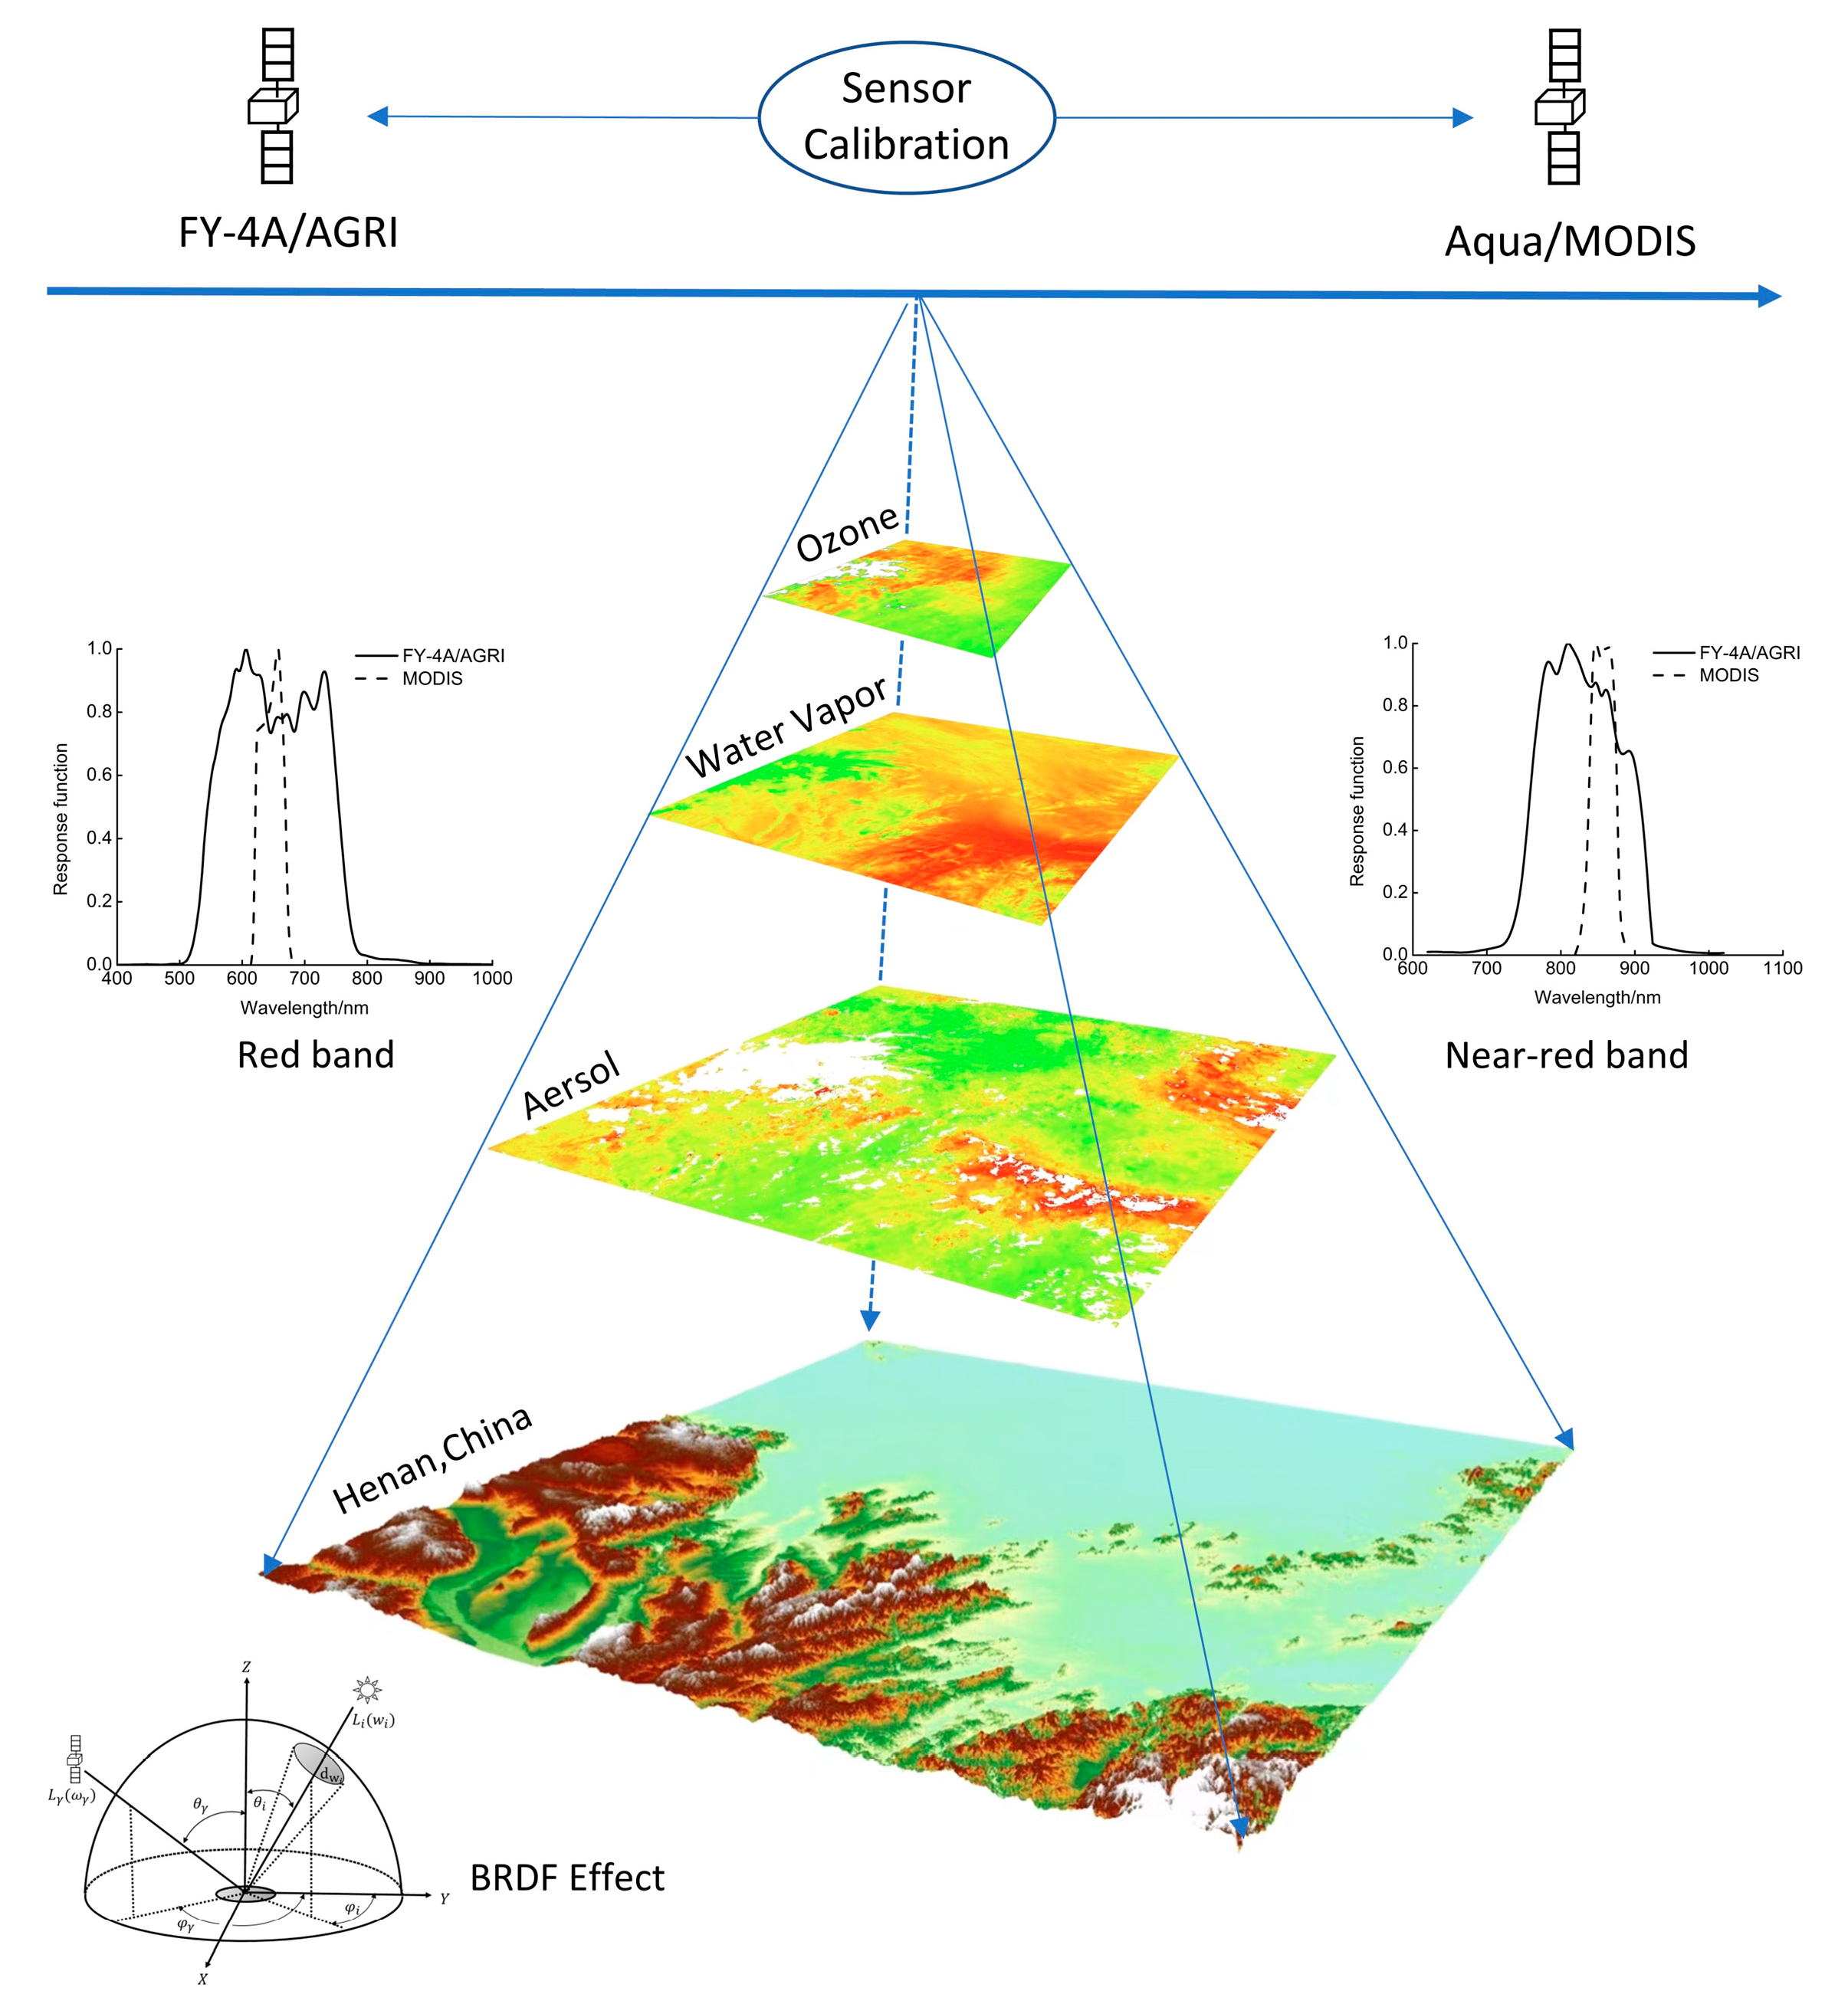
2. Introduction to Sensors and Data

2.1. FY-4A/AGRI

FY-4A was launched on 11 December 2016, and it is currently positioned above the equator at 104.7°E [26]. Its successful launch opened a new era for China’s geostationary meteorological satellite [27]. Compared to the FY-2 satellite [28], FY-4A has improved spectral, spatial, and temporal resolution characteristics, providing greater opportunities to observe rapid land, ocean, and atmospheric changes, and further enhancing the applications and service capabilities of geostationary meteorological satellites. FY-4A adopts three-axis stabilization technology and new image registration technology [29], which can achieve significantly improved observation efficiency and image registration accuracy in comparison with that yielded using the spin stabilization technology of FY-2. AGRI is one of the main loads of FY-4A, and it possesses a total of 14 spectral channels, a spectral range of 0.45~13.8 μm, a spatial resolution range of visible and NIR bands of 0.5~1 km, and infrared bands of 2~4 km.
The enhanced spatial resolution of FY-4A/AGRI greatly improves its detection and parameter retrieval capabilities. FY-4A/AGRI also further achieves improved dynamic monitoring. FY-4A/AGRI scans the ground every 15 min, and the regional observation model can provide a regional scan every minute. Through multitemporal synthesis, more cloud-free observations can be obtained, thus overcoming the low time resolutions of traditional low earth orbit (LEO) satellites [29].
FY-4A/AGRI has been comprehensively improved, producing clearer image details and more realistic colors, and its data are not limited to traditional meteorological applications; they also exhibit great potential in non-meteorological fields. This satellite provides near-global observations and more accurate, more frequent, and more detailed monitoring data for the ecological environment on a global scale. After the satellite is in orbit, the radiometric performance of the instrument may be attenuated due to changes in the on-orbit environment and the aging of photoelectric devices. Thus, accurately assessing the radiation level of the AGRI sensor is of great significance for the high-precision quantitative applications of the sensor and the study of weather and resource environment changes.

2.2. Aqua-MODIS

The Moderate Resolution Imaging Spectroradiometer (MODIS) is one of the key instruments in NASA’s Earth Observing System (EOS), and it is currently operating on the Terra and Aqua satellites, with the goal of producing integrated observations of solar radiation, the atmosphere, the ocean, and the land [30,31]. The MODIS sensor has a wide spectral range of 0.4~14.4 µm with 36 bands, including bands 1~2 with spatial resolutions of 250 m, bands 3–7 with spatial resolutions of 500 m, and bands 8–36 with spatial resolutions of 1000 m. The MODIS is a cross-orbit scanning radiometer with a wide field of view that obtains 2330 km wide observation data through the rotation of the scanning mirror. The MODIS revisiting period is short, and it provides a comprehensive global view of Earth’s land, oceans, and atmosphere every two days in visible to infrared wavelengths. The MODIS has carried out extensive pre-launch calibration at all levels, with in-orbit radiometric calibration conducted about once every three weeks. The MODIS has reached high levels of radiometric sensitivity, geometric registration precision, and calibration accuracy, satisfying the observation requirements. Since its launch in 2002, the MODIS has been providing high-precision radiation observation data concerning earth–atmosphere systems. It is often used as a reference sensor to participate in cross-radiation calibration calculations.
Table 1 shows a comparison between the orbit and sensor parameters of the FY-4A/AGRI and MODIS satellites. The spatial resolutions of the two sensors are similar, the MODIS revisiting period is short, and the time resolution of FY-4A is high, ensuring that the two sensors produce synchronous observation image data every day. The MODIS red band and NIR band (with central wavelengths of 0.65 μm and 0.86 μm, respectively) are selected for performing cross-radiometric calibration on the red band and NIR band (with central wavelengths of 0.60 μm and 0.83 μm, respectively) of the AGRI sensor. The SRF curves of the FY-4A/AGRI sensor and MODIS sensor in the red band and NIR band are shown in Figure 1. It can be seen from the figure that the SRFs of the detection bands of the two sensors exhibit good consistency, and the difference between their spectral responses can be corrected using the SBAF.

2.3. DATA

The data used for different purposes are shown in Table 2. The L1 product data of Aqua-MODIS (MYD021KM) are the cross-calibration reference data, and the L1 product data of FY-4A/AGRI (FY-4A/AGRI L1) are the pending calibration data [26]. The synchronous observation geometry data of the two sensors (MYD03 and FY-4A/AGRI L1 GEO) are used to screen the regions that satisfy the observation geometry and field angle conditions. The aerosol data (MCD19A2), water vapor data (MYD05), and ozone data (MYD07) are used for the atmospheric correction of the FY-4A/AGRI satellite image data. The surface reflectance product of Aqua-MODIS (MYD09GA) is used to obtain daily NDVI data from the MODIS.
The MCD19A2, MYD05, MYD07, and MYD09GA datasets are products of the MODIS. These datasets can be processed using tools such as Python and the MODIS Reprojection Tool (MRT) [32]. The processing is carried out in the WGS84 geographic coordinate system. AGRI L1 data are preprocessed data obtained after performing quality inspection, geolocation, and radiometric calibration. The original image storage format is HDF5, and the projection transformation is carried out according to the number of columns and the latitude and longitude of the lookup table (LUT). The MODIS L1 class data are onboard radiometric calibration data and are converted into reflectivity products after performing geometric calibration and pixel resampling. The original image storage format is EOS-HDF, and the projection conversion process is performed according to the longitude and latitude of the MYD03 data. The AGRI and MODIS observational geometry data consist of the positioning information obtained after conducting geographical positioning, including the satellite zenith angle, view azimuth angle, solar zenith angle, and solar azimuth angle information. The observational geometry product data are resampled to the same pixel resolution as that of the L1 data products.
It should be noted that the following data from FY-4A/AGRI, including the cross-radiance calibration calculations, the comparison with the MODIS reflectance data, and the data used for daily NDVI calculations, are ensured to meet the time matching condition. This means that the time difference between the observation of the same target with the FY-4A/AGRI and MODIS image data is less than 15 min.

3. Method Introduction

Figure 2 illustrates the primary factors contributing to the variations in the NDVI values obtained from different sensors. These factors primarily include the temporal, spatial, spectral, radiometric, and observational geometries that differ between sensors. The combined effect of these factors can impact the consistency of multi-source NDVI data. Notably, sensor aging occurs over time, which can introduce radiometric differences between sensors if proper or sufficient correction is not applied. In this paper, we employ the cross-radiometric calibration method to correct for sensor radiometric differences and analyze their influences on the NDVI.

3.1. Cross-Calibration Process

Based on the theoretical basis that the remote sensing image data obtained using different sensors at the same time, angle, and location and with the same spectral response curve have the same apparent reflectivity, this paper cross-calibrates FY-4A/AGRI sensors based on the MODIS. The observation geometries and SRFs of the two sensors are different. In this paper, the data of FY4A/AGRI and the MODIS are matched to obtain the region that approximately meets the same time and same angle conditions when observing the same ground object. After conducting spectral correction on the image data that satisfy data matching, the red band and NIR band calibration coefficients of the AGRI sensors are obtained via filtering and cross calibration. Furthermore, a comparison is made between the NDVI calculated using FY-4A/AGRI before and after cross calibration and the NDVI data from the MODIS. This procedure mainly consists of five steps.
  • Data matching: In the reference image and unmarked image, the region that maximally satisfies the imposed conditions is found as the location of the matching sample region.
  • Spectral matching is used to convert the MODIS top-of-atmosphere reflectance (TOA reflectance) value to a simulated FY-4A/AGRI TOA reflectance value.
  • Outlier elimination: A uniformity test and an outlier elimination process are carried out on the position of the matched sample region after performing spectral correction to achieve improved calibration accuracy.
  • A cross-calibration calculation and linear fitting are performed on the apparent simulated FY-4A/AGRI reflectivity value and pixel value to obtain the cross-calibration coefficient.
  • The NDVI calculation and comparative analysis are conducted, the FY-4A/AGRI and MODIS image data bands before and after the cross-radiometric calibration are operated to calculate the daily NDVI, and then the monthly NDVI is calculated using the maximum synthesis method, which is compared and analyzed at three levels, namely, time, space, and change trend. The specific flow of the cross-calibration of the MODIS-based FY-4A/AGRI cross-radiometric calibration and the comparative analysis of the NDVI application are shown in Figure 3.

3.2. Cross-Calibration Methods

3.2.1. Observational Geometric Matching

Data matching is the core step of the cross-radiation sensor calibration method adopted in this paper; it involves selecting the region from the observation data of the two sensors that satisfies the time, space, and observation geometry consistency requirements as much as possible. This process determines the accuracy of the matching sample region and the cross-calibration coefficient. This paper mainly carries out data matching through three steps: orbit matching, time matching, and observation geometry matching [33].
  • Orbit Matching
To minimize the influence of BRDF correction on the calibration results, the appropriate observation area is determined in advance, and samples satisfying the time, space, and observation geometry thresholds are selected in the observation area, which can greatly reduce the image processing time and improve the efficiency of data processing. The calculation diagram of the zenith angle observed using the image data of the stationary FY-4A/AGRI satellite is shown in Figure 4, where P is a point on the ground, its coordinates are ( λ , ϕ ), and the connection between the satellite, S, and the core, O, passes through the ground point, E, where the coordinates of E are ( λ e , 0 ).
At this time, the satellite zenith angle of the ground point, P, can be calculated using Formula (1) [34].
cos γ = cos ϕ cos λ e λ d = r 1 + ( R / r ) 2 2 ( R / r ) cos γ 1 / 2 r / sin z = d / sin γ z = arcsin [ ( r / d ) sin γ ]
where λ and ϕ are the latitude and longitude of P, respectively; λ e is the longitude of point E; γ is the angle between OS and OP; d is the distance from the ground point to the satellite; r is the length of OS, which can be calculated from the orbital altitude of the FY-4A satellite (35,755 km) and the radius of the Earth (6371 km); and z is the zenith angle observed at the ground point.
The subsatellite of the geostationary FY-4A satellite is located over the equator at 104.7 degrees east longitude. According to the running track and scanning characteristics of the two satellites, the area within ±20 degrees of its subsatellite is taken as the target area. With ϕ = ±20° and λ e = 84.7° or 124.7°, the target area has the largest satellite zenith angle and is less than 32.5°. At the same time, combined with the observation geometry matching condition, the image participating in cross calibration has a small observation angle.
2.
Time Matching
Although orbit matching can preliminarily limit the observation time difference between the two sensors, to avoid the difference between the observation targets and atmospheric parameters caused by time differences, it is necessary to perform time matching on the remote sensing image data of the two sensors in the target region. Based on the characteristics of the AGRI scanning speed and the abundance of image data, which include ground scans obtained every 15 min, we select the FY-4A/AGRI image data with time differences of no more than 15 min according to the transit time of the Aqua satellite in the target area on the same day to ensure that the image data used for cross-radiative calibration are approximately the same. The time of the selected FY-4A/AGRI and Aqua-MODIS image data satisfy Formula (2).
T A G R I T M O D I S 15
where T M O D I S is the acquisition time of the MODIS image data, and T A G R I is the acquisition time of the FY-4A/AGRI image data.
3.
Observational Geometry Matching
When the reference sensor and the sensor to be calibrated observe the same feature target with different imaging geometries, some differences between their radiation values are observed. To ensure that the two sensors observe the ground with approximately the same angle and atmospheric path conditions, firstly, remote sensing images that satisfy the time matching condition are selected, and ground control points are chosen for geometric fine correction. Then, under the condition of fully guaranteeing the pixel matching between the FY-4A/AGRI and MODIS image data, the corresponding observation zenith angle data are utilized. Each pair of pixel points is then tested based on the observation geometric matching thresholds using the corresponding satellite zenith angle data. Under the condition that sufficient sample points are guaranteed to participate in the cross-calibration process, the uncertainty of the calibration result caused by the difference between the zenith angles of the two sensors should be reduced to the greatest extent possible. The matching sample region is finally selected as the region satisfying Formula (3).
cos θ A G R I cos θ M O D I S 1 < p
where θ A G R I is the satellite zenith angle of the FY-4A/AGRI sensor, θ M O D I S is the satellite zenith angle of the MODIS sensor, and p is the difference threshold of the satellite zenith angle, which is set as 0.01 in this paper.

3.2.2. Spectral Matching

To reduce the impact of the RSF difference between the two sensors on the resulting cross-calibration accuracy, the deviation caused by the RSF difference is eliminated by the SBAF [35,36]. In this paper, 245 spectral curves of surface objects, including vegetation, soil, rocks, water, ice and snow, etc., acquired from the spectral library of the USGS and the Advanced Spaceborne Thermal Emission and Reflection Radiometer (ASTER), are used [37]. When the reflectance of the two sensors is simulated using the spectral curves produced for the same ground object, the simulated reflectance is only related to the SRFs of the sensors, and the SRF difference between the two sensors is corrected accordingly. Formula (4) is used to convolve the spectral curve of the ground object reflectance with the SRF.
ρ = a b f ( λ ) Γ ( λ ) d λ a b Γ ( λ ) d λ
where ρ is the simulated reflectivity of the ground object, λ is the wavelength, Γ(λ) is the SRF of a certain sensor band, a and b form the coverage range of the band, and f(λ) is the reflectivity spectrum of a certain ground object. Formula (5) is used to calculate the SBAFs of the corresponding bands of FY-4A/AGRI and the MODIS by linearly fitting the ground object reflectance values of the two sensors based on the simulation, and these factors can correct the SRF difference between the two sensors.
S B A F i = ρ i , a ρ i , m
where S B A F i represents the spectral matching factor of the matching response channel i (i = 1 indicates the red band, and i = 2 indicates the near infrared band; these notations are the same below) of the two sensors, and ρ i , a and ρ i , m are the simulated reflectance values of the corresponding waveband features of the sensor to be calibrated and the reference sensor, respectively.
The simulated value of the TOA reflectance of the sensor to be calibrated is calculated according to the spectral matching factor and the TOA reflectance of the reference sensor, which is used as the true value of FY-4A/AGRI for the cross-radiation calibration calculation to reduce the difference between the radiation values of the reference sensor and the sensor to be calibrated due to the difference between their RSFs. The cross-radiometric calibration uncertainty caused by the RSF difference is reduced. The MODIS TOA reflectivity is calculated using Formula (6), and the simulated value of the TOA reflectance of the sensor to be calibrated is calculated using Formula (7).
ρ i , M = A i × D N i , M + B i
ρ i , A = ρ i , M S B A F i
where ρ i , M represents the TOA reflectance of the MODIS sensor, and A i and B i are the gain and offset calculated using cross calibration of band i , respectively. ρ i , A represents the simulated value of the TOA reflectance of the sensor to be calibrated after correcting for the spectral response difference.

3.2.3. Filter

To minimize the uniformity of the object and the influence of outliers on the calibration results, the pixels involved in the cross-calibration calculation need to go through a uniformity test and an outlier elimination process.
  • Uniformity test
The accuracy of cross calibration is also affected by whether the given object is uniform or not. The uncertainty caused by temporal and spatial differences can be reduced by selecting the pixel in the uniform scenario for the cross-calibration calculation. In this paper, an area with a size of n × n pixels is defined as an environmental region, and the environmental region that satisfies the uniformity condition of the MODIS and FY-4A/AGRI image data is a uniform region; large uniform regions and a sufficient number of uniform regions are ensured to participate in the cross-radiometric calibration calculation. Formula (8) is used as the judgement basis for the uniformity test of the environmental region.
RSTD = S T D MEAN < q
where STD represents the standard deviation of the environmental area, MEAN represents the average value of the pixels in the environment area, RSTD represents the relative standard deviation, and q is the maximum allowed relative standard deviation of a uniform area, which is set as 0.03 in this paper.
2.
Outlier elimination
The inclusion of outliers in a series of measurements distorts the experimental results, and the elimination of outliers conforms to the objective reality, but it also distorts the experimental results if the suspicious data are discarded within the permissible range of error. Therefore, it is first necessary to master the statistical judgement criteria and accurately judge whether suspicious data points are outliers to obtain a more reasonable fitting line [38].
For a normally distributed sample with a sample size of N, a mean of M, and a standard deviation of S, the difference between any sample and the mean M is approximately 68% less than S, approximately 95% less than 2S, approximately 99% less than 3S, etc. Similarly, the difference between the simulated TOA reflectance and the real TOA reflectance of the unscaled sensor conforms to a normal distribution function with a sample size of n, a mean of µ, and a standard deviation of σ. This property is used in this paper to test whether a uniform region is an outlier:
A D N i , A ¯ + B ρ i , A ¯ < 3 σ
where A and B are the linear regression coefficients that are preliminarily obtained by linearly fitting the sample points through the least-squares method, and D N i , A ¯ is the mean value of the digital number (DN) in the uniform region of the image band i to be calibrated. ρ i , A ¯ is the average simulated value of the TOA reflectance in the uniform region of the unscaled image band i . In this case, the difference between any sample and the mean µ is less than σ with approximately 68% probability, less than 2 σ with approximately 95% probability, and less than 3 σ with approximately 99% probability. In this paper, 3 σ is taken as the condition to eliminate outliers.

3.2.4. Cross-Calibration Calculation

The matched radiation values are calculated using least-squares linear regression. Based on the simulated value of the TOA reflectance of each uniform region and the DN value of the corresponding region after correcting the SBAF of the sensor to be calibrated, the cross-calibration coefficient is obtained via linear fitting through Formula (10).
ρ i , A ¯ = A i × D N i , A ¯ + B i
where A i and B i are the gain and offset calculated using the cross-calibration of the sensor band i , respectively, and D N i , A ¯ is the average DN value of the uniform region of the image band i to be calibrated. ρ i , A ¯ is the mean of the simulated TOA reflectance values in the uniform region of the image band i to be calibrated.
Based on the ratio between the cross-calibration coefficient A i and the original scaling coefficient A i , the relative difference R i of the cross-calibration coefficient is obtained, and R i is calculated using Formula (11).
R i = A i A i A i 100 %
The feasibility of the cross-calibration method is tested by comparing the relative differences R i obtained from the cross-calibration coefficient and the original calibration coefficient. The smaller R i is, the better the calculation quality of the cross-calibration method.

3.3. Atmospheric Correction

When calculating the NDVI from the FY-4A/AGRI image data, the data in the visible and NIR bands are more significantly affected by the atmosphere. Therefore, the interference of the atmospheric effects needs to be eliminated before obtaining the true reflectance of the surface. In this paper, an LUT of the atmospheric correction coefficients is constructed using the 6S radiative transfer model, and the LUT is invoked using Python to perform atmospheric correction on each image element of the FY-4A/AGRI image data. This atmospheric correction method takes into account the effects of the atmospheric water vapor, ozone, and aerosols on vegetation indices and can obtain their true surface reflectance.

3.4. NDVI Consistency Assessment

  • NDVI calculation
Equation (12) was used to calculate the NDVI before and after FY-4A/AGRI cross-calibration as well as for the MODIS data, respectively, and the monthly NDVI was calculated using the maximum synthesis method.
N D V I = ρ nir ρ red ρ nir + ρ red
where ρ nir is the surface reflectance in the NIR band and ρ red is the surface reflectance in the red band.
2.
Related Analysis
The Pearson correlation coefficient was used to characterize the correlation between the NDVI datasets from different sources. A positive and larger value of the correlation coefficient, r, indicates that the trends of the two datasets are more similar in the selected time period, while a negative and smaller value of the correlation coefficient, r, indicates that the two datasets have opposite trends in the selected time period.
3.
Trend analysis of NDVI
In this study, we modeled the trend of the MODIS and FY-4A/AGRI mean NDVI data over a 5-year period in Henan, China using univariate linear regression analysis. The formula for the trend analysis is as follows [39]:
Slope = x i = 1 x     i × N D V I i i = 1 x     i i = 1 x     N D V I i x i = 1 x     i 2 i = 1 x     i 2
where Slope indicates the trend slope of linear regression, variable x is the year number from 1 to 5, N D V I i indicates the NDVI calculated using the maximum synthesis method in the i t h year, and the trend graph reflects the trend of the NDVI change in the Henan region in the 5-year time series. Slope > 0 indicates that the change trend of the NDVI is increasing during the 5-year period, and vice versa.

4. Results

4.1. Analysis of Cross-Calibration Results

4.1.1. Geometric Matching

After performing data matching, the matching sample region that simultaneously satisfies the time, space, observation geometry, and field angle conditions is selected, as shown in Figure 5. The sample region is similar to an X shape and presents an approximately symmetric distribution near the equator. The image data of the reference sensor and the unmarked sensor ensure that the same ground object is observed at approximately the same time and observation angle in the matching sample region [40], effectively eliminating the uncertainties related to the atmospheric path, observation geometry, and observation time differences, laying a foundation to ensure the accuracy of the cross-calibration process.

4.1.2. Spectral Correction

In this paper, the reflectance of the ground objects is calculated based on 245 spectral reflectance curves and RSF integrals, and the SBAF is calculated via the linear fitting approach in Formula (5). The results are shown in Table 3. The SBAF of the red band is 0.965, and the SBAF of the NIR band is 0.988. The effect of the atmosphere on radiation is mainly caused by scattering. For the same radiation input, when the wavelength is longer, the effect of scattering on radiation is reduced, and the effect of atmospheric absorption on radiation is increased. Due to the large difference between the band ranges of the red bands of the two sensors, the TOA reflectance values of the red bands of the two sensors are very different, and the spectral matching factors of the two sensors are small.
To test the reliability of the SBAFs, the FY-4A/AGRI TOA reflectance is compared with the MODIS TOA reflectance before and after performing SBAF correction based on the uniform region calculated with 16 cross-calibration instances from August 2018 to September 2020. The red band and NIR band contain 16,120 and 11,249 uniform regions, respectively. The approximate subsatellite point region of the geostationary satellite is used as the matching sample region, which is rich in ground objects, and the matching samples of each band calibration process can cover different reflectance intervals. As shown in Figure 6, the horizontal axis represents the TOA reflectance of the FY-4A/AGRI sensor, and the vertical axis represents the TOA reflectance before and after performing MODIS spectral correction, with the red band and NIR band shown from left to right [41]. The R 2 values of the two bands exceed 0.97, and the ratios of the MODIS red band and NIR band to the FY-4A/AGRI TOA reflectance values are 1.137 and 1.012, respectively; after SBAF correction, the FY-4A/AGRI TOA reflectance values are 1.063 and 1.0, respectively. The results show that the correlation between the FY-4A/AGRI and MODIS TOA reflectance values is strong, and the TOA reflectance values of the two sensors become closer after performing SBAF correction, indicating that the method of calculating the SBAF by simulating the reflectance of ground objects measured using spectral curves can effectively correct the spectral differences between the corresponding channels of the two sensors. By utilizing the spectrally corrected MODIS TOA reflectance as the simulation value of the FY-4A/AGRI TOA reflectance, the cross-calibration coefficient of the FY-4A/AGRI image data can be calculated more accurately.

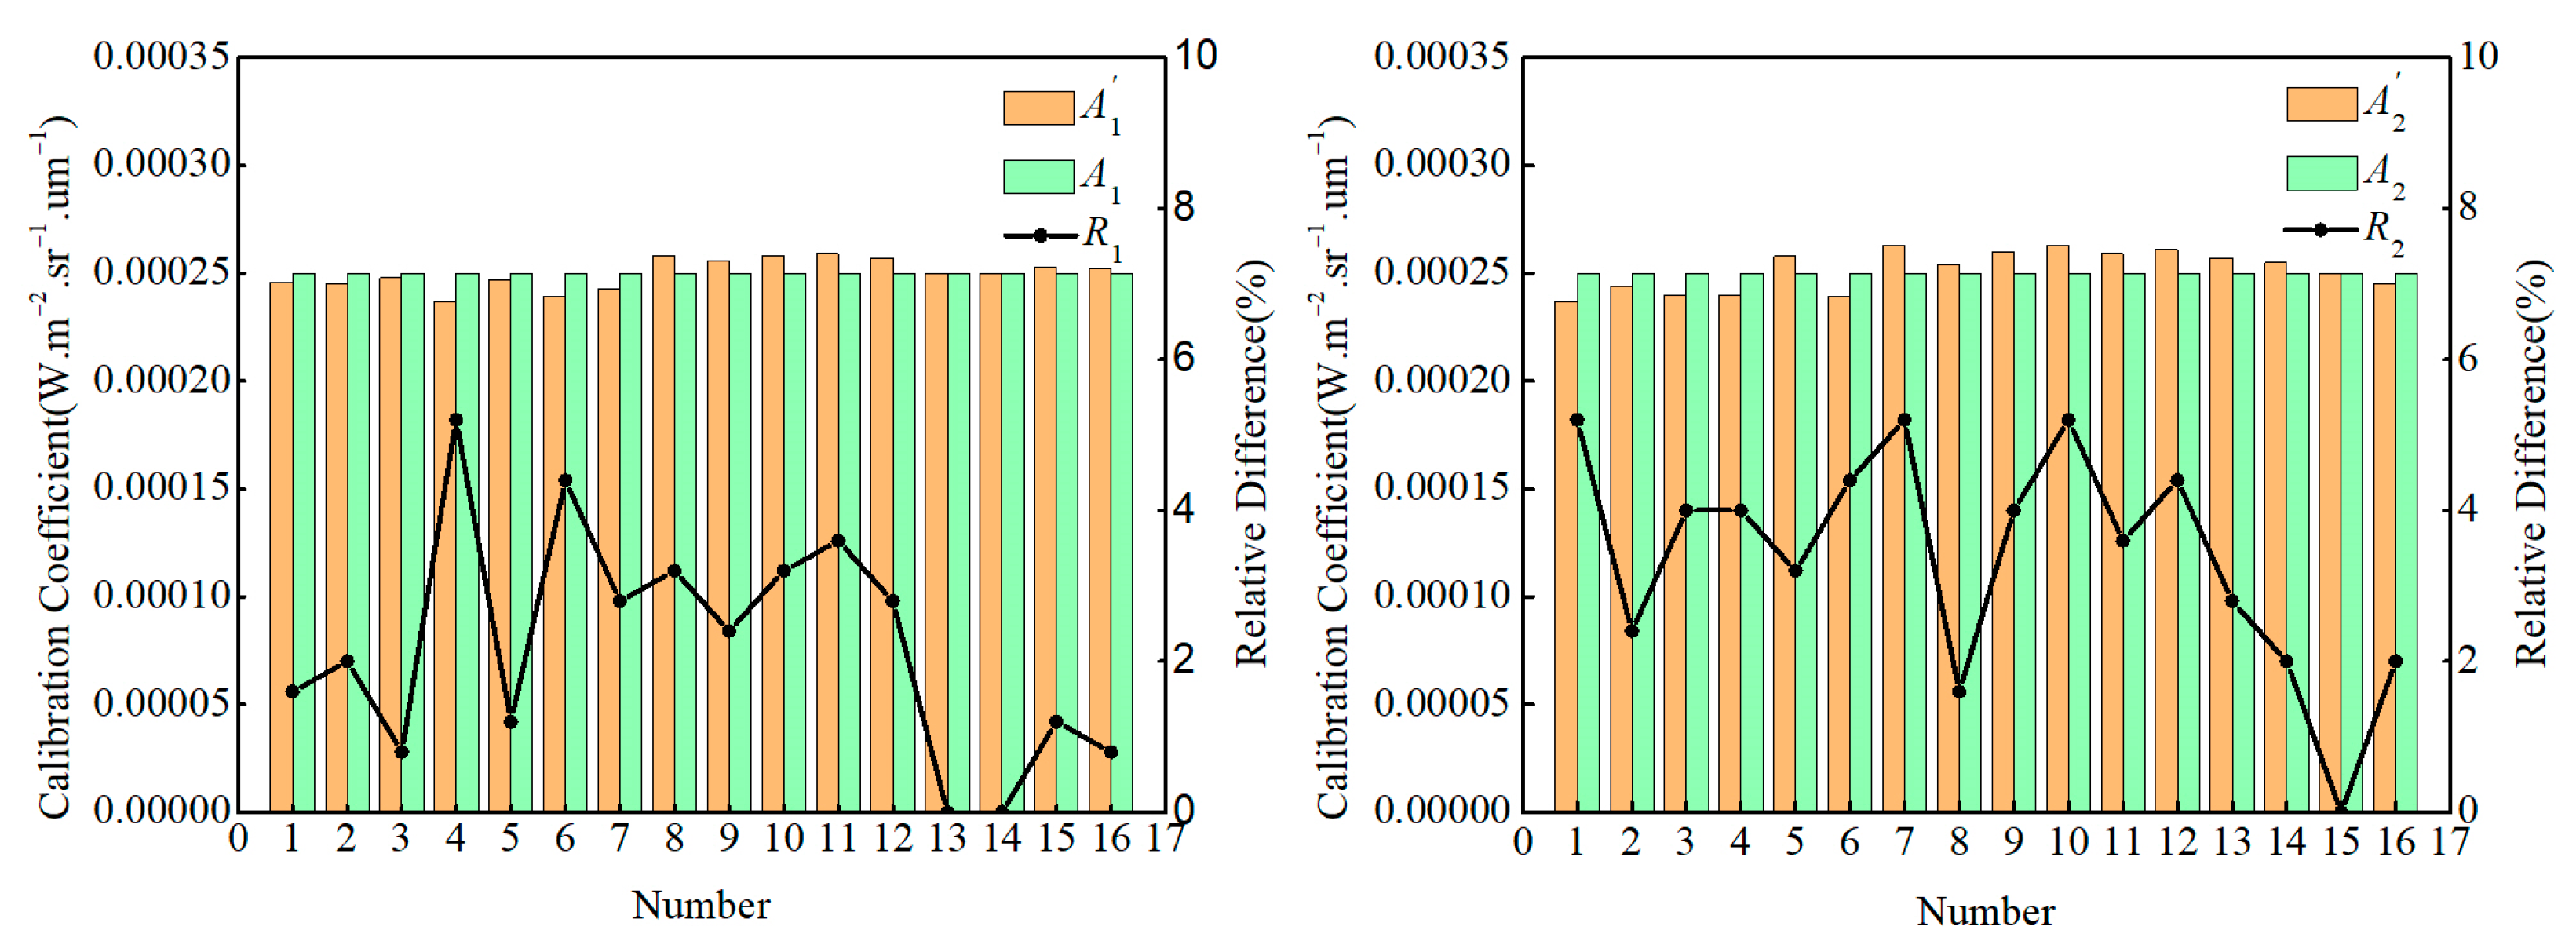
4.1.3. Cross-Radiation Calibration Results

When a uniform region is selected based on the relative standard deviation threshold, the size of n does not affect the cross-calibration calculation results. To ensure that the number of cross-matching points is kept between 700 and 1200 as much as possible, the value of n is 5, 6, or 7. After removing the error points from the uniform region, the calibration coefficient is calculated via linear fitting with the least-squares method. The cross-calibration results of the two bands are shown in Figure 7, with the red band and NIR band prevented from left to right. The cross-calibration coefficient gain of the red band is between 0.000237 and 0.000252,and the NIR band cross-calibration coefficient gain is between approximately 0.000239 and 0.000263. The original calibration coefficient is 0.00025, so the relative difference between the cross-calibration coefficient and the original cross-calibration coefficient of the two bands is less than 5.2%, satisfying the imposed accuracy requirements. The results show that the cross-radiometric calibration method for FY-4A/AGRI and the MODIS based on geometric matching and spectral correction has high accuracy and reliable calibration results.
To study the quality and performance changes of the AGRI sensor mounted on the FY-4A geostationary satellite, 31 cross-radiation sensor calibration calculations are performed on the two-year historical data from October 2020 to December 2022. Figure 8 shows the cross-calibration results in the red band and NIR band. From October 2020 to December 2022, the cross-calibration coefficient is relatively stable, and the overall trend is increasing. The cross-calibration coefficient of the red band ranges from 0.000244 to 0.000251, and the annual attenuation rate is approximately 1.37%; the cross-calibration coefficient of the NIR band ranges from 0.000243 to 0.000256, and the annual attenuation rate is approximately 2.55%. The results show that the AGRI sensor exhibits a certain degree of attenuation during long-term orbits.

4.2. Validation of Cross-Calibration Results

4.2.1. TOA Reflectance Comparison

Based on the above evaluation results, to further test the effectiveness of the cross-calibration coefficient, 90-day image data acquired using FY-4A/AGRI from August 2018 to December 2020 are selected to compare the relationship between the FY-4A/AGRI and MODIS TOA reflectance values before and after performing radiation normalization. Since the image data used to calculate the cross-radiative calibration coefficient and the image data used to test the cross-radiative calibration coefficient do not exhibit a one-to-one correspondence, the required cross-radiative calibration coefficient is selected based on the closest time principle during the radiative calibration process performed on the FY-4A/AGRI image, and the apparent reflectance is calculated after implementing cross-calibration, and thus, radiometric calibration correction is realized. Henan is located in the central region of China and has diverse land cover types. Taking the Henan region as the test area to verify the TOA reflectance changes before and after performing cross calibration can better prove the universality of the cross-calibration results compared with those obtained by taking the radiative calibration field area as the test area [42].
Figure 9 shows the FY-4A/AGRI and MODIS TOA reflectance curves produced before and after performing cross calibration in the red band and NIR band. Among them, the apricot, grey, and cyan curves are the TOA reflectance curves of the FY-4A/AGRI image data from the MODIS, those obtained before performing cross calibration, and the FY-4A/AGRI image data obtained after performing cross calibration, respectively. According to the figure, the FY-4A/AGRI and MODIS both show relatively low TOA values in the red band, generally below 0.2. The FY-4A/AGRI has a higher TOA value compared to the MODIS, but after cross calibration, the TOA value of FY-4A/AGRI decreases, becoming more consistent with the MODIS. In the NIR band, there is significant variability in the TOA. When the TOA is low, FY-4A/AGRI has a higher TOA than the MODIS, but after cross calibration, the TOA of FY-4A/AGRI decreases, becoming more consistent with the MODIS. Conversely, when the TOA is high, the MODIS has a higher TOA than FY-4A/AGRI, but after cross calibration, the TOA of FY-4A/AGRI increases, becoming more consistent with the MODIS. In conclusion, compared with the MODIS TOA reflectance, that of the red band of the FY-4A/AGRI sensor is relatively high; that of the NIR band is relatively high when the reflectance is low; and that of the MODIS sensor is relatively high when the TOA reflectance is high. However, the reflectance of FY-4A/AGRI is closer to the MODIS TOA reflectance after cross calibration, and the deviation between the FY-4A/AGRI and the MODIS TOA reflectance values is smaller. The results fully show that the method used in this paper can effectively improve the radiation performance of the FY-4A/AGRI sensor and further improve its radiometric calibration accuracy.
To further verify that cross-calibration coefficients can improve the radiation performance of FY-4A/AGRI, the mean relative error (RMS) and root mean square error (RMSE) of the TOA reflectance and the MODIS TOA reflectance values before and after performing FY-4A/AGRI cross-calibration for 90 days in Henan Province are calculated. The RMS and RMSE are used as statistical indices to evaluate the accuracy of the cross-calibration results, and they are calculated using Formulas (14) and (15), respectively.
RMS = 100 % n i = 1 n ρ ρ m ρ m
R M S E = i = 1 n ρ ρ m 2 n
where ρ is the FY-4A/AGRI TOA reflectance calculated using the original calibration coefficient and the cross-calibration coefficient, ρ i , m is the MODIS TOA reflectance, n is the number of samples, and i is the pixel index.
Table 4 records the average RMS and RMSE of the FY-4A/AGRI and MODIS TOA reflectance values obtained before and after performing cross calibration in the red band and NIR band. It can be seen from the table that both the MRE and RMSE of the MODIS TOA reflectance values obtained after performing cross calibration are relatively reduced. The RMS values of the red band and NIR band before performing cross calibration are approximately 0.43 and 0.25, respectively, and the RMS of the NIR band is smaller. After implementing cross-radiation calibration, the RMS decreases by 0.12 and 0.03, respectively. Before performing cross calibration, the RMSE of the red band and NIR band are approximately 0.085 and 0.082, respectively, and the RMSE of the NIR band is smaller. After performing cross-radiation calibration, the RMSE decreases by 0.06 and 0.04, respectively. By comparing the RMS and RMSE of the FY-4A/AGRI and MODIS TOA reflectance values before and after performing cross-radiometric calibration, the results show that the error of the FY-4A/AGRI radiation normalization process is smaller than that of the MODIS TOA reflectance, which fully proves the effectiveness of the method used in this paper for cross-radiometric FY-4A/AGRI calibration. At the same time, the improvement exhibited by the red band consistency is more obvious, indicating that cross-calibration has greater significance for improving the reflectivity and consistency of the red band.

4.2.2. NDVI Comparison of Typical Features

To further investigate the influence of the TOA changes in the red and NIR bands on the NDVIs of the features obtained before and after performing cross calibration, we take the image data from 18 September 2020 as an example, and the NDVI distributions of buildings and forest vegetation are analyzed, as shown in Figure 10. Figure 10(a1–c1) are the NDVI distributions of urban buildings before and after performing cross calibration and the MODIS image data, respectively. Figure 10(a2–c2) are the NDVI distributions of forest vegetation before and after performing cross calibration and the MODIS image data, respectively. By comparing Figure 10(a1,a2) and Figure 10(b1,b2), and according to the distribution range of the NDVI of different typical features, it can be seen that the NDVI before and after FY-4A/AGRI image data cross calibration can distinguish typical features well. By comparing Figure 10(a1–c2), and according to the distribution range of the NDVI of the FY-4A/AGRI image before and after cross calibration and the MODIS image data, it can be seen that after the FY-4A/AGRI cross calibration, the NDVI of FY-4A/AGRI typical ground objects increases relatively, which is closer to the NDVI of the corresponding MODIS typical ground objects. Thus, it can replace the missing NDVI data for MODIS images and is conducive to promoting the spatial integrity and time continuity of the NDVI. It plays an important role in phenological monitoring [43] and further expands the capabilities of FY-4A/AGRI in non-meteorological applications.
Overall, even though the reference image data of FY-4A/AGRI in the Henan region differ from those of the MODIS in terms of their solar incidence satellite observation angles, the average TOA reflectance obtained after cross calibration is closer to that of the MODIS. At the same time, the NDVIs of typical ground features and the MODIS are also closer, fully demonstrating that the method used in this paper achieves good cross-radiometric calibration results, which is conducive to improving the data quality and quantitative applications of the FY-4A/AGRI remote sensing satellite.

4.3. NDVI Comparison of FY-4A/AGRI and MODIS

In order to further analyze the influence of the cross-radiative calibration method on the quality of the FY-4A/AGRI data, we take the NDVI application as the starting point to analyze the influence of cross-radiative calibration on the NDVI quality of the FY-4A/AGRI remote sensing image data. In this paper, the surface reflectance obtained from the MODIS surface reflectance data (MYD09GA) and atmospheric corrected L1-level image data (FY-4A/AGRI L1) are used to calculate the daily NDVI of Aqua-MODIS and FY-4A/AGRI. At the same time, the NDVI calculated using MYD09GA is compared with that calculated using FY-4A/AGRI image data before and after cross-radiative calibration from the three dimensions of time, space, and changing trend. The feasibility of the cross-calibration method for improving the FY-4A/AGRI data quality is further tested, and it is proven that the cross-radiation calibration method could effectively improve the accuracy of FY-4A/AGRI data application and further improve the quantitative application accuracy of the FY-4A/AGRI image data.

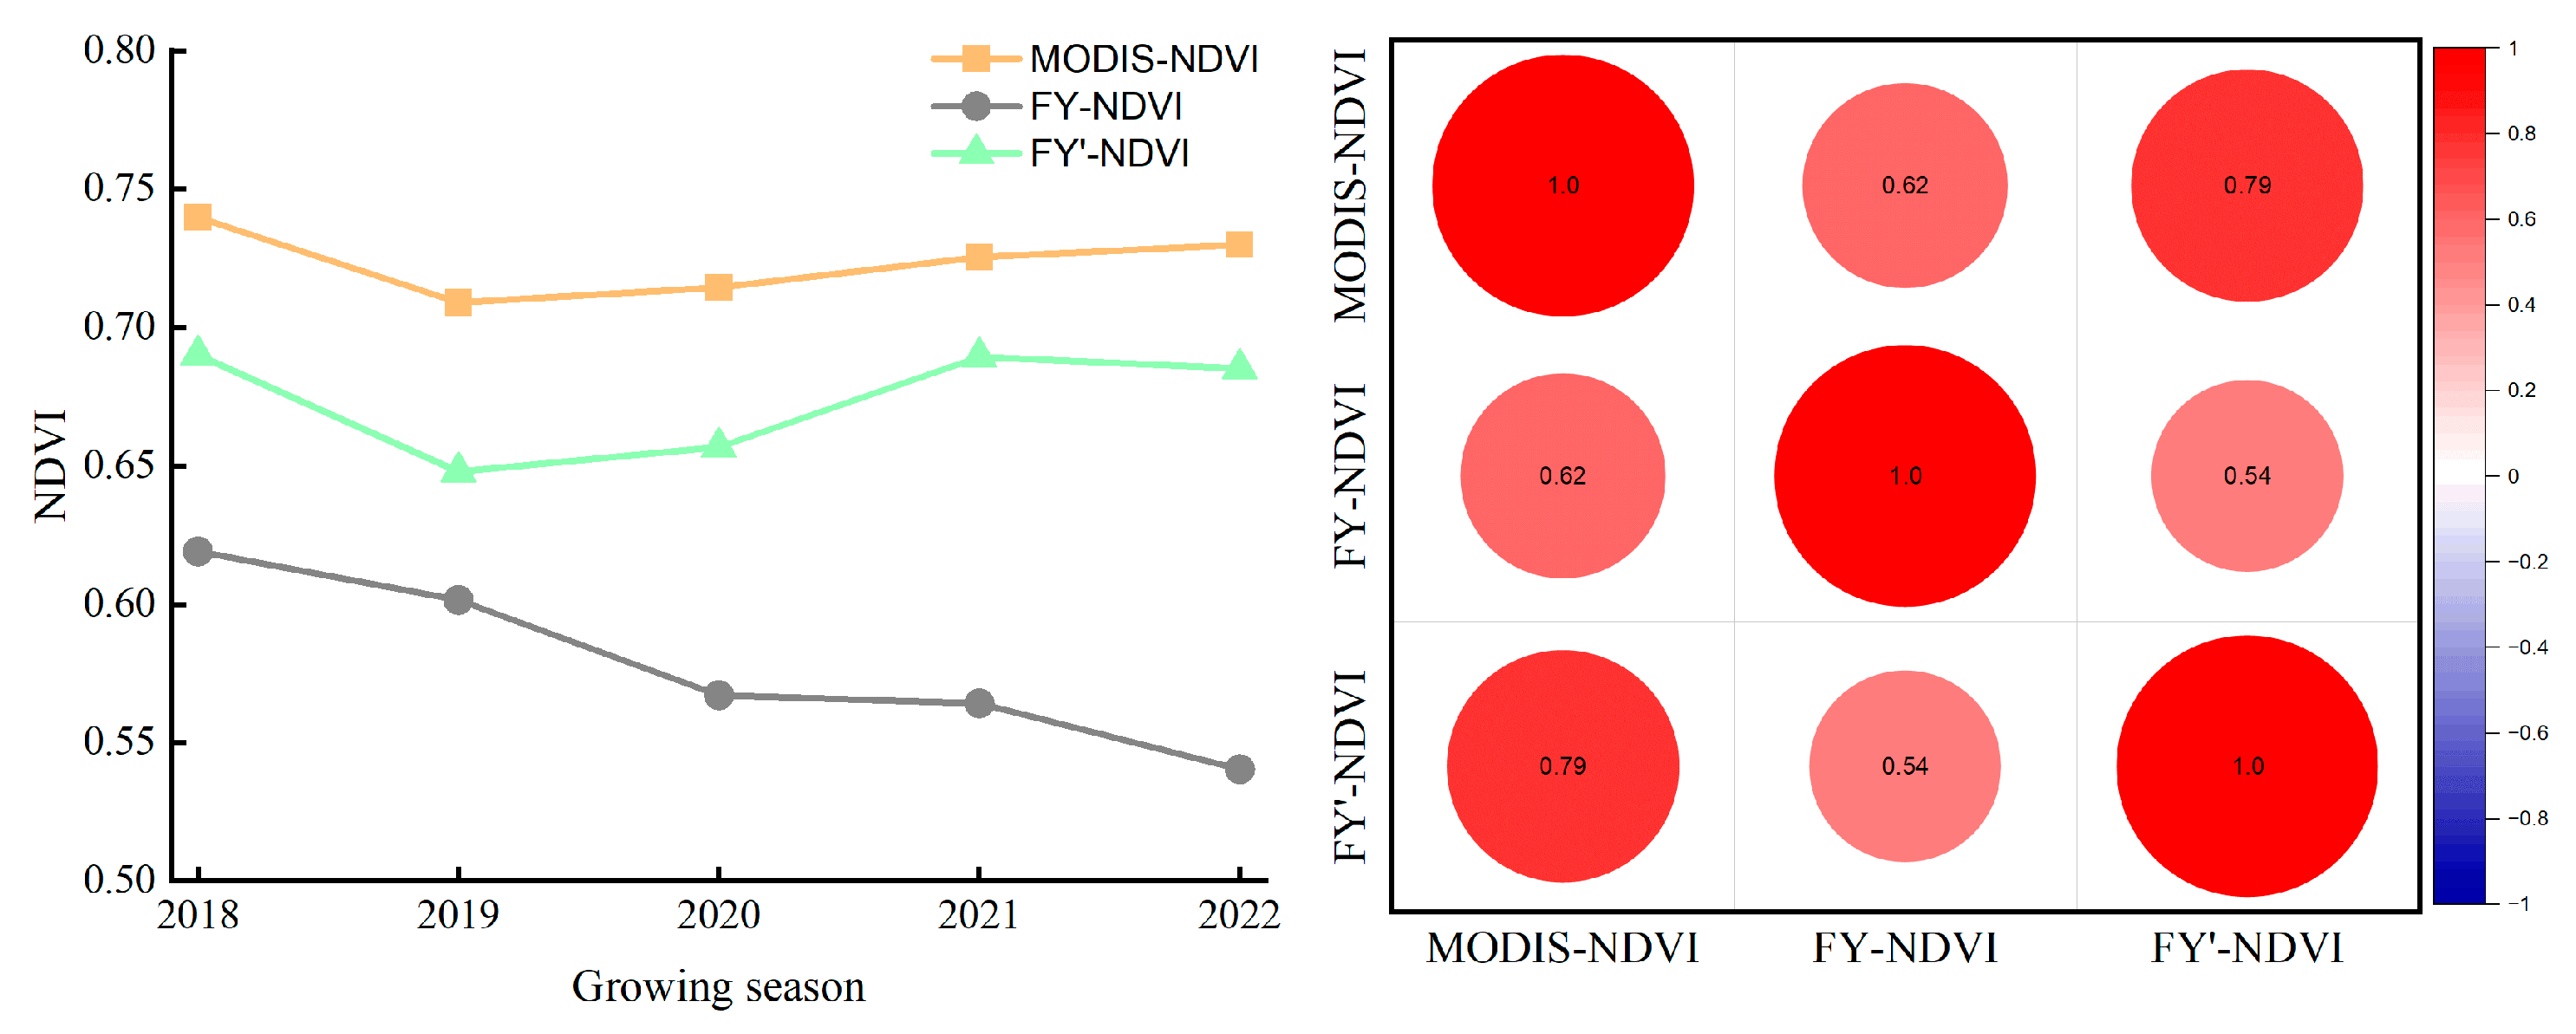
4.3.1. Time Difference Analysis of NDVI

According to the phenological patterns in the Henan region, it is determined that the growth season occurs from April to September each year. As shown in Figure 11, the comparison of three sets of NDVI data, including the MODIS NDVI (MODIS-NDVI), the FY-4A/AGRI NDVI before cross calibration (FY-NDVI), and the FY-4A/AGRI NDVI after cross calibration (FY’-NDVI), reveals consistent trends during the growth season over the 5-year study period. There are no significant fluctuations observed. Additionally, the MODIS-NDVI consistently remains higher than the FY-NDVI. The FY’-NDVI increases after cross calibration, reducing the disparity with the MODIS-NDVI. By analyzing the correlation between different NDVI datasets, it is evident that the MODIS-NDVI has a strong correlation of 0.79 with FY’-NDVI after cross-radiometric calibration. In contrast, the correlation between the MODIS-NDVI and FY-NDVI before cross calibration is weaker, with a correlation coefficient of 0.62. Based on the analysis of trends and correlations, it is apparent that the FY’-NDVI shows better consistency with the MODIS-NDVI compared to FY-NDVI. Therefore, the results suggest that cross-radiometric calibration enhances the consistency between the FY-4A/AGRI and MODIS NDVI datasets, indicating improved data quality and better alignment for quantitative analysis.
According to Figure 12, the comparison of the FY-NDVI, FY’-NDVI I, and MODIS-NDVI datasets reveals consistent trends in the average values across the four seasons during the study period. The NDVI is highest during the summer season and the lowest during the winter season. Additionally, the MODIS-NDVI consistently remains higher than the FY-NDVI, and the FY’-NDVI increases after cross calibration, reducing the disparity with MODIS-NDVI. By analyzing the correlation between different NDVI datasets, it is observed that the MODIS-NDVI has a strong correlation is above 0.98 with both the FY-NDVI and FY’-NDVI. This indicates a high degree of correlation between the datasets. Based on the analysis of trends and correlations, it is evident that the FY’-NDVI shows better consistency with the MODIS-NDVI compared to FY-NDVI. Therefore, the findings suggest that FY’-NDVI exhibits improved consistency with MODIS-NDVI, supported by both the trends and high correlation between these datasets.
According to Figure 13, the comparison of the FY-NDVI, FY’-NDVI, and MODIS-NDVI datasets reveals consistent trends in the average values across the 12 months during the study period. Additionally, the MODIS-NDVI consistently remains higher than the FY-NDVI, and the FY’-NDVI increases after cross calibration, reducing the disparity with MODIS-NDVI. By analyzing the correlation between different NDVI datasets, it is observed that the MODIS-NDVI has a strong correlation is above 0.96 with both the FY-NDVI and FY’-NDVI. This indicates a high degree of correlation between these datasets. Based on the analysis of trends and correlations, it is evident that the FY’-NDVI exhibits better consistency with the MODIS-NDVI compared to FY-NDVI. Therefore, the findings suggest that the FY’-NDVI shows improved consistency with MODIS-NDVI, as supported by both the trends and high correlation between these datasets.
Through the analysis of the trend and correlation on the three time scales of the growing season, season, and month, the same conclusion is drawn: after cross-radiation calibration, FY’-NDVI and MODIS-NDVI exhibit better consistency. This conclusion fully demonstrates that cross-radiometric calibration can reduce the difference between the FY-4A/AGRI remote sensing image data NDVI and the MODIS data NDVI, which is conducive to improving the data quality. There are no apparent grammar errors in the given text.

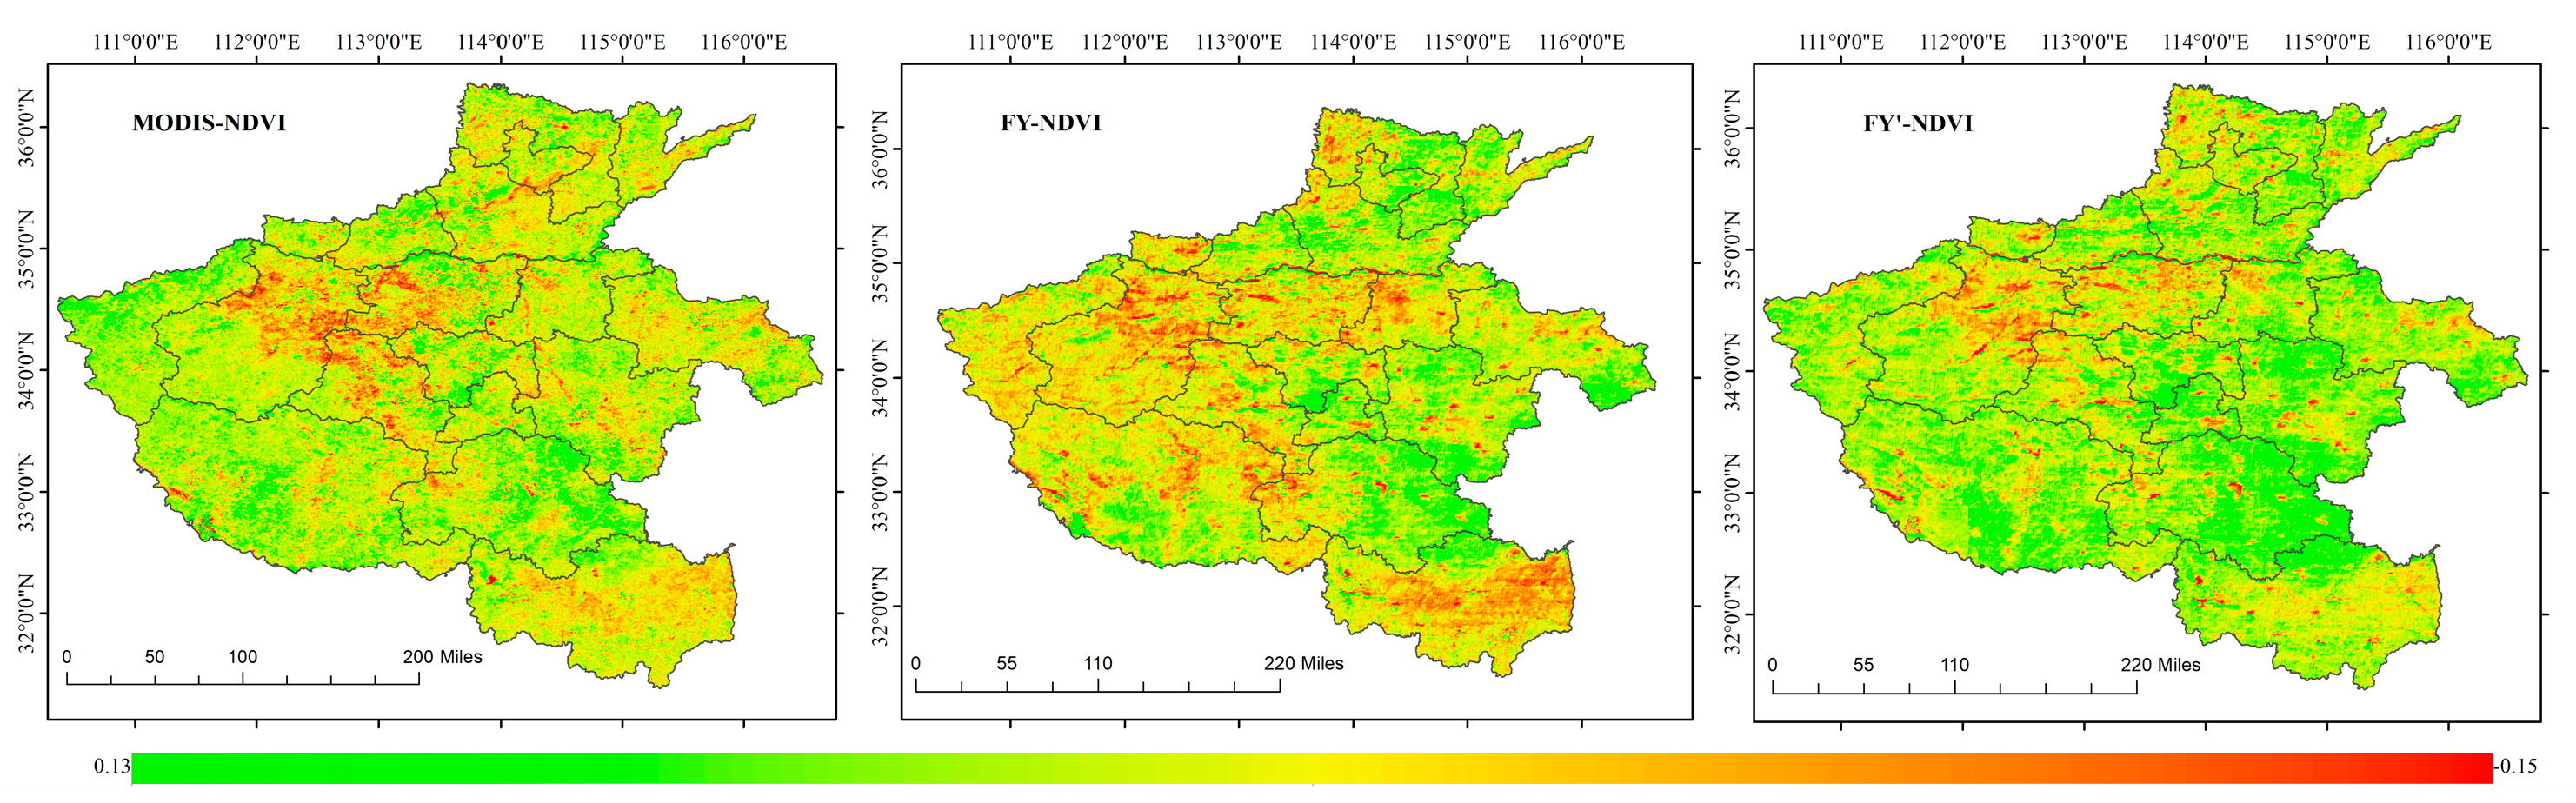
4.3.2. Spatial Difference Analysis of NDVI

At the inter-annual scale, the spatial distribution pattern of the NDVI across the entire province of Henan is analyzed. Figure 14 presents the spatial distribution maps of the NDVI vegetation index in Henan Province from 2018 to 2022, spanning 5 years. The first column represents the annual average values of the MODIS-NDVI, the second column represents the annual average values of the FY-NDVI, and the third column represents the annual average values of the FY’-NDVI. It can be observed that the spatial distribution of the multi-year average values of FY-4A/AGRI and MODIS NDVI exhibits a highly pronounced consistency. The distribution characteristics primarily indicate that FY-NDVI effectively demonstrates the vegetation distribution, while FY’-NDVI, after undergoing cross-radiometric calibration, demonstrates an even greater alignment with the MODIS-NDVI.

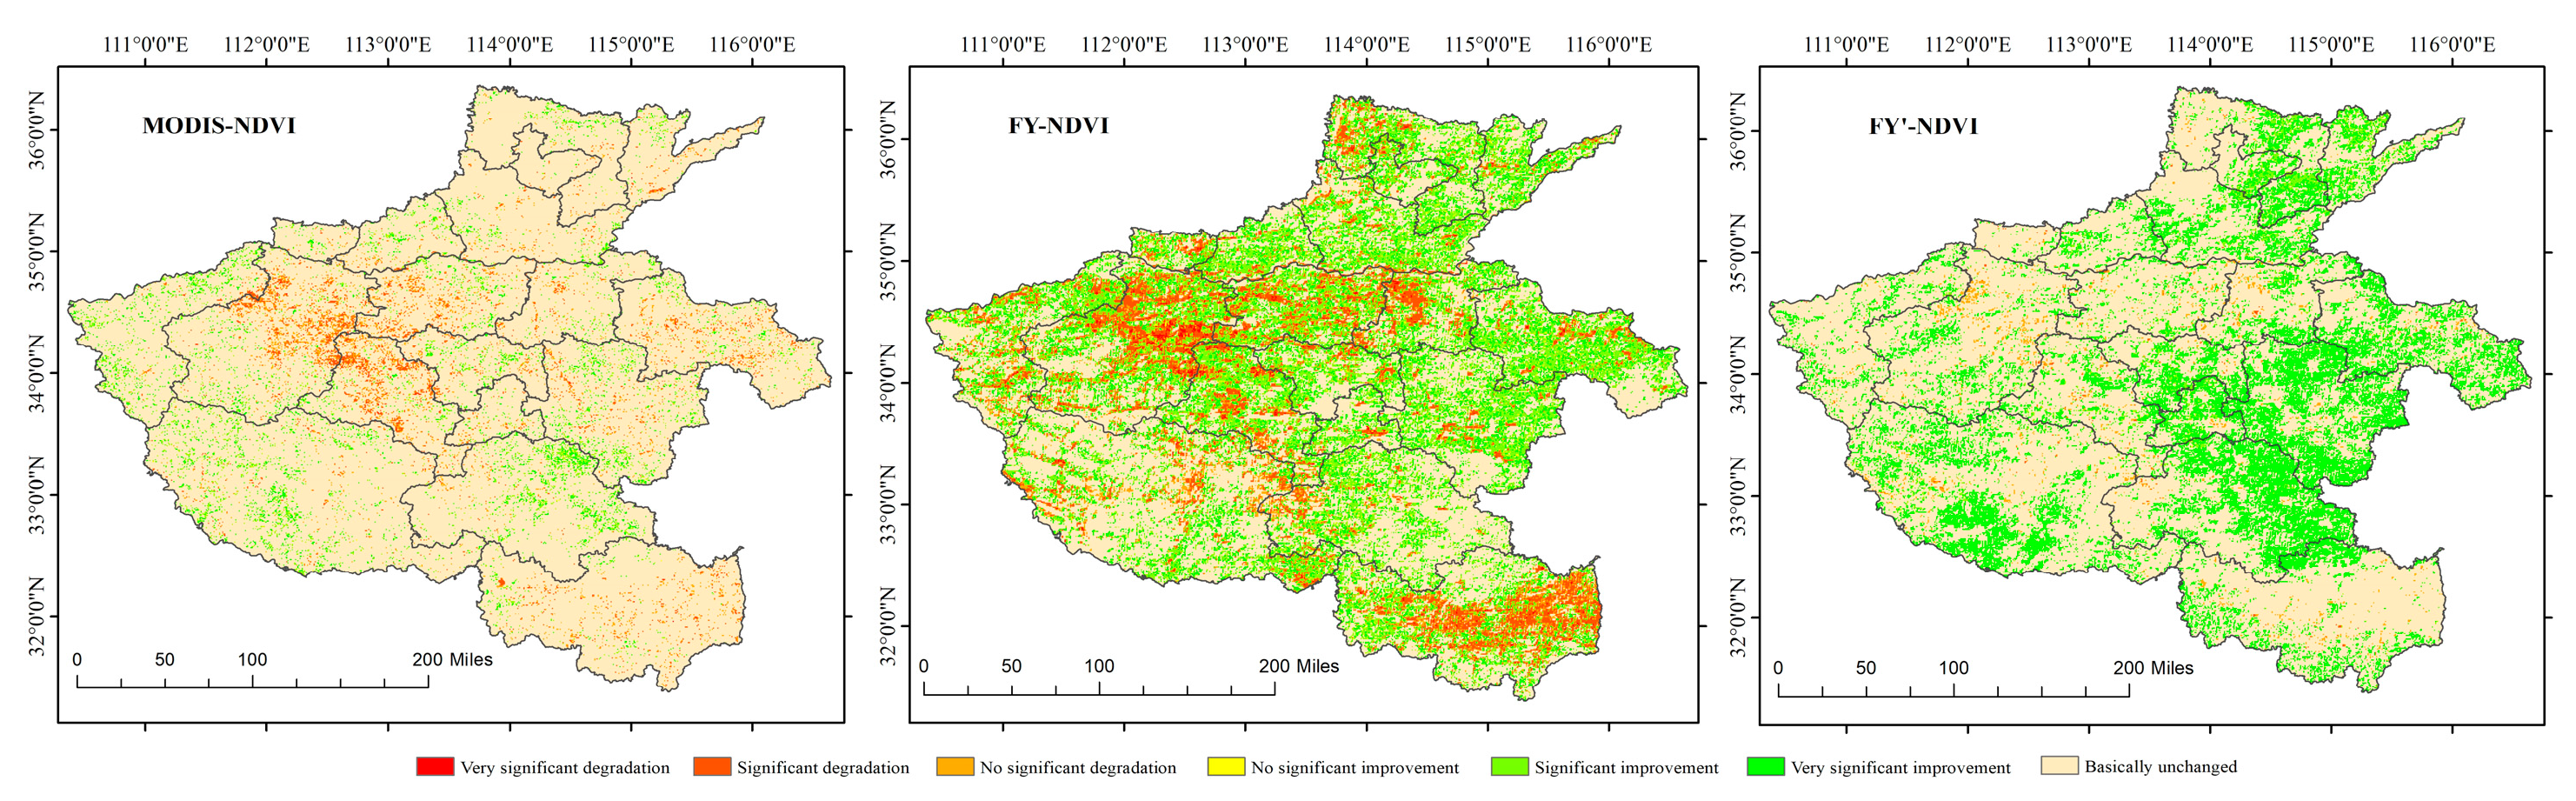
4.3.3. Analysis of Variation Trend of NDVI

After conducting a univariate linear regression, the trends in the three NDVI datasets over a 5-year period are shown in Figure 15. The yellow trend in the FY-NDVI has a larger coverage area compared to the MODIS-NDVI. After cross-radiometric calibration, the FY’-NDVI exhibits a clear spatial consistency with the MODIS-NDVI in terms of trend changes. Additionally, there is minimal overall variation in the NDVI across Henan Province. All three NDVI datasets indicate a predominant decrease in the NDVI concentration in areas such as Luoyang city, Zhengzhou city, Pingdingshan city, and Xinyang city. On the other hand, the MODIS-NDVI and FY’-NDVI display a greening trend in regions such as Sanmenxia city, Nanyang city, and the western part of Zhumadian city.
In this paper, Slope and t-test were used to superimpose the NDVI change slope and the results of the significance test [44], as shown in Table 5, which were divided into the following categories: basically unchanged, extremely significant increase (p < 0.001), significant increase (p < 0.05), and weakly significant increase (p < 0.1). There were seven levels of extremely significant decrease (p < 0.001), significant decrease (p < 0.05), and weak significant decrease (p < 0.1), and the proportion of trend types in the three sets of NDVI datasets was statistically analyzed.
According to the spatial distribution of the change trend in Figure 16, neither the MODIS-NDVI nor FY’-NDVI show significant changing trends, while FY-NDVI, without cross-radiometric calibration, exhibits both no significant changing trend and an improvement trend. At the pixel scale, the statistical results indicate that 90.35% of the MODIS-NDVI pixels do not show a significant changing trend, 0.04% exhibit extremely significant degradation, 2.09% show significant degradation, 2.23% show slightly significant degradation, 0.51% exhibit an extremely significant improvement trend, 2.67% show a significant improvement trend, and 2.26% do not show a significant improvement trend. For the FY-NDVI, 46.69% of the pixels do not show a significant changing trend, 0.71% exhibit extremely significant degradation, 10.32% show significant degradation, 2.97% show slightly significant degradation, 0.07% exhibit an extremely significant improvement trend, 24.18% show a significant improvement trend, and 14.32% do not show a significant improvement trend. In the FY’-NDVI, 70.11% of the pixels do not show a significant changing trend, 0.18% exhibit significant degradation, 1.44% show slightly significant degradation, 2.70% exhibit a significant improvement trend, and 25.57% do not show a significant improvement trend.
Based on the spatial distribution of the trend changes in Figure 16 and the pixel-scale statistical analysis in Table 6, it becomes apparent that the FY’-NDVI, after undergoing cross-radiometric calibration, exhibits better consistency with the MODIS-NDVI compared to FY-NDVI. This conclusion effectively demonstrates that through cross-radiometric calibration, we can mitigate sensor differences and achieve higher consistency between the FY’-NDVI and MODIS-NDVI. This indicates that after cross-radiometric calibration, the FY-4A/AGRI remote sensing image data can be employed as a replacement for the MODIS-NDVI in vegetation index analysis and monitoring, thereby reducing errors arising from sensor disparities.

5. Discussion

Various factors such as spatial differences [45], temporal differences [46], radiometric calibration [47], spectral differences [48], and observational geometry can introduce discrepancies in the NDVI values across different sensors. In this paper, we leveraged the high temporal resolution advantage of FY-4A/AGRI to ensure the approximate simultaneous observation of this sensor with the MODIS image data. This allowed us to analyze the accuracy of the cross-radiometric calibration method employed in this study to calculate calibration coefficients and assess the impact of the cross-radiometric calibration method on the quality of the NDVI obtained from the FY-4A/AGRI data.

5.1. Cross-Calibration Coefficient Analysis

To further study the attenuation phenomena of AGRI sensors with the time spent in orbit, the cross-calibration coefficient curves of the red band and NIR band time series are drawn, as shown in Figure 17, where the dotted red line represents the date of 9 September 2020. The cross-calibration coefficients of the red band and NIR band exhibit an attenuation phenomenon from August 2018 to September 2020. Among them, the gain coefficient of the red band increases from 0.000246 to 0.000252, and the annual decay rate is approximately 1.16%; the gain coefficient of the NIR band increases from 0.000237 to 0.000245, and the annual decay rate is approximately 1.61%. Compared with the annual attenuation rates of the red band and NIR band from October 2020 to December 2022, the attenuation phenomenon is not obvious. The results show that the sensor attenuation problem can be corrected to some extent and that the sensor accuracy can be improved by regularly updating the cross-calibration coefficient.
To further study the stability of the AGRI sensor with the time spent in orbit, the error curves of the cross-calibration coefficients and the original calibration coefficients of the red band and NIR band time series are plotted. As shown in Figure 18, the cross-calibration coefficients of the red band and NIR band from August 2018 to September 2020 have small errors relative to the original calibration coefficients, both of which are less than 5.6%. From October 2020 to December 2022, the fluctuation phenomena of the red band and NIR band are more obvious, the maximum error between the red band cross-calibration coefficient and the original calibration coefficient reaches 12.1%, and the maximum error between the NIR band cross-calibration coefficient and the original calibration coefficient reaches 7.1%. The results show that the stability and accuracy of the sensor can be improved by regularly updating its cross-calibration coefficients.
Since this study mainly focuses on analyzing the impact of cross-radiometric calibration on NDVI calculation, only the cross-calibration coefficients of the red band and NIR band were analyzed. However, theoretically, this method can be applied to other bands as well. In future research, we will further explore the application of this method to other bands of FY-4A/AGRI, aiming to improve the overall data quality.

5.2. TOA Reflectance Difference Analysis

In Section 4.2.1, we learned that even after cross-radiometric calibration, there are still some differences in the apparent reflectance between FY-4A/AGRI and the MODIS in the red band and NIR band. To further discuss the reasons for the differences between the TOA reflectance values of FY-4A/AGRI and the MODIS, it is found that when using the Henan region as the test area, the image data obtained using the two sensors are similar in time, which ensures that the solar zenith angle and the solar azimuth angle are consistent [49]. However, the zenith angles observed using the two sensors are significantly different [50]. The zenith angle observed using FY-4A/AGRI in the Henan region is approximately 32.5° in the regional observation mode, while the zenith angle observed using the MODIS image data used for the cross-calibration test is approximately 21.5°.
The relationship between the TOA reflectance values of the FY-4A/AGRI sensor in the red band and NIR band and the satellite zenith angle is simulated based on the 6S model. According to the satellite zenith angle of the remote sensing image data used, it is determined that the satellite zenith angle for the 6S model simulation ranges from 20 ° to 35°. As shown in Figure 19, (a) shows the variation curve of the TOA reflectance of the red band with the satellite zenith angle when it is lower than 0.2. The results show that the TOA reflectance of the red band increases with the increase in the satellite zenith angle. (b,c) show the variation curves of the NIR band TOA reflectance with the satellite zenith angle when it is lower than 0.2 and 0.4, respectively. The results show that the TOA reflectance decreases with the increasing satellite zenith angle when the TOA reflectance is lower than 0.2; when the TOA reflectance is lower than 0.4, the TOA reflectance increases with the increasing satellite zenith angle. Since the satellite zenith angle of the FY-4A/AGRI sensor is relatively larger than that of the MODIS, the TOA reflectance of the FY-4A/AGRI sensor in the red band is relatively high, the TOA reflectance of the FY-4A/AGRI sensor in the NIR band is relatively high when the reflectivity is low, and the TOA reflectance of the MODIS sensor is higher when the TOA reflectance is higher.
This study ensures the temporal and spatial consistency of the image data from both sensors. Besides the errors introduced by the cross-radiometric calibration coefficients, a further analysis revealed that differences in the observation zenith angle also contribute to the disparities in NDVI between FY-4A/AGRI and the MODIS. To further enhance the accuracy of the data, the next step will involve BRDF (Bidirectional Reflectance Distribution Function) correction to eliminate the influence of the observational geometric differences on the disparities in the NDVI between the two sensors.

5.3. NDVI Quality Analysis of FY-4A/AGRI

By comparing the MODIS-NDVI, FY-NDVI, and cross-calibrated FY’-NDVI datasets from the temporal, spatial, and trend change perspectives, it is evident that the FY-NDVI and MODIS-NDVI are highly correlated to a large extent. However, the FY’-NDVI, after undergoing cross-radiometric calibration, exhibits even higher consistency with the MODIS-NDVI. Analyses indicate that cross-radiometric calibration can further enhance the quality of the NDVI data from FY-4A/AGRI.
Cross-radiometric calibration helps in the quantitative development of Chinese satellite remote sensing data. This study utilizes the cross-radiometric calibration method to mitigate data biases caused by radiometric calibration differences between the FY-4A/AGRI and MODIS sensors. This calibration process is crucial for ensuring data consistency, especially when comparing and analyzing data from different sensors. Through cross-radiometric calibration, we can obtain more accurate and comparable data, thereby providing a more reliable foundation for remote sensing applications. Improving the quality of FY-4A/AGRI satellite remote sensing image data through cross-calibration contributes to the transition of Chinese satellite remote sensing data from qualitative analysis to quantitative application.
Cross-radiometric calibration further expands the application range of the FY-4A/AGRI image data. After cross-calibration, the average apparent reflectance is closer to the MODIS, with smaller average errors, indicating the effectiveness of the method employed in achieving cross-radiometric calibration. Cross-calibration leads to a relative increase in the FY-4A/AGRI’s NDVI, bringing it closer to the MODIS NDVI. This enables FY-4A/AGRI to substitute for missing NDVI data in the MODIS imagery, thus promoting NDVI spatial completeness and temporal continuity, and playing a significant role in phenological monitoring and other applications [31]. This further enhances FY-4A/AGRI’s capabilities in non-meteorological applications. In the future, efforts will be made to carry out high-frequency in-orbit calibration throughout the entire lifecycle of Chinese geostationary satellites, elevating the level of quantitative satellite data application and improving the utilization of satellite data.

6. Conclusions

In this paper, the principles and process of performing cross-radiometric calibration on the red and NIR bands of stationary meteorological satellites with the MODIS sensor are introduced in detail. Through strict spatiotemporal matching and spectral difference correction, the matching cross-radiation calibration samples of the two utilized sensors can satisfy the time, observation geometry, and spectrum consistency constraints as much as possible. The MODIS sensor with high calibration accuracy and stable onboard service operations is used for the cross-radiometric calibration of the red band and NIR band of the AGRI sensor. The following conclusions can be drawn.
  • The method used to calculate the SBAFs in this paper can effectively correct the difference between the TOA reflectance values of the two sensors. After performing SBAF correction, the TOA reflectance ratios of the red and NIR bands of the MODIS and FY-4A/AGRI sensors in uniform regions reach 1.063 and 1.0, respectively, which are significant improvements over the values produced before performing spectral correction.
  • Based on an analysis of 16 cross-radiometric calibration calculations performed on historical data from August 2018 to September 2020, the calibration results and stability of the MODIS as the radiation benchmark are relatively good, and the cross-radiometric calibration coefficient error is less than 5.2%. The results show that this method can be effectively applied to FY-4A/AGRI sensor radiation calibration.
  • Based on an analysis of 31 cross-radiometric calibration calculation results obtained from historical data from October 2020 to December 2022, the sensor has good stability, but a certain degree of attenuation occurs during long-term orbit operation, and the annual attenuation rates of the red band and NIR band are 1.37% and 2.55%, respectively. The attenuation phenomenon of the NIR band is obvious.
  • Through a comparative analysis of the TOA reflectance values of the FY-4A/AGRI and MODIS in the red band and NIR band, the results show that the two sensors have a strong correlation after performing cross calibration. Based on the fast scanning frequency of FY-4A/AGRI, more cloud-free observation images can be obtained. Overcoming the low time resolutions of traditional polar-orbiting satellites makes it possible to produce high-time-resolution NDVI.
  • Through a comparative analysis of the FY-4A/AGRI NDVI and MODIS NDVI before and after cross-radiometric calibration from temporal, spatial, and trend change perspectives, the results indicate a strong correlation between the FY’-NDVI and MODIS-NDVI after cross-radiometric calibration. This analysis demonstrates the effectiveness of the cross-radiometric calibration method employed in reducing radiometric differences between the two sensors and improving the accuracy of FY-4A/AGRI’s NDVI product calculations.
The cross-radiometric calibration method of the FY-4A/AGRI sensor in the red band and NIR band based on the MODIS sensor introduced in this paper is stable and reliable and can perform high-frequency and high-precision cross-radiometric calibration on in-orbit satellites. This improves the radiation accuracy of satellite image data, and the calibration results can effectively reflect the statuses and changes of the instruments onboard the satellites. The proposed approach provides theoretical methods for the absolute calibration and calibration testing of FY-4A and other stationary satellite sensors, promotes the improvement of the data quality produced using remote sensing satellites, and will enhance the quantitative applications of satellite data in the future. The comparative analysis of cross-radiometric calibration between FY-4A/AGRI and the MODIS, as well as the comparison of NDVI applications, provides significant insights into the sensing performance and data quality of FY-4A/AGRI. It also offers valuable guidance for vegetation monitoring and environmental research using FY-4A/AGRI data.

Author Contributions

Conceptualization, X.H. and Z.T.; methodology, H.L.; software, H.L.; validation, X.H., G.Z., L.W. and Z.T.; formal analysis, X.H., G.Z., L.W. and Z.T.; investigation, H.L.; data curation, H.L., X.H., G.Z., L.W. and Z.T.; writing—original draft preparation, H.L.; writing—review and editing, X.H., G.Z., L.W. and Z.T.; visualization, H.L.; supervision, X.H., G.Z., L.W. and Z.T. All authors have read and agreed to the published version of the manuscript.

Funding

This work is supported by the research on the key technologies of constructing and servicing the Yellow River simulator for supercomputing (grant number 201400210900); and the research and development of the contribution rate evaluation system of meteorological conditions for the construction of Beautiful Qinghai–Tibet, the second comprehensive scientific investigation on the Qinghai–Tibet Plateau to study the sub-topic of the project “Westerly—Monsoon Synergism and its environmental Effects” (grant number 2019QZKK0106).

Data Availability Statement

Restrictions apply to the availability of these data.

Acknowledgments

Thanks to the national meteorological center for providing the FY-4A/AGRI image data (http://data.nsmc.org.cn/, accessed on 1 July 2023) and NASA’s official website for providing the MODIS image data (https://ladsweb.modaps.eosdis.nasa.gov/, accessed on 1 July 2023).

Conflicts of Interest

The authors declare no conflict of interest.

Abbreviations

The following abbreviations are used in this manuscript:
BRDFBidirectional reflectance distribution function
SBAFSpectral band adjustment factor
NDVINormalized difference vegetation index
NIRNear infrared
TOATop-of-atmosphere
SRFSpectral response functions
DNDigital number
LUTLookup table

References

  1. Zhu, S.F.; Qie, L.L.; Xu, H.; Xie, Y.Q.; Li, Z.Q.; Xie, Y.S.; Ge, B.Y.; Li, K.T. In-flight cross radiometric calibration of DPC/GaoFen-5 and MODIS/Aqua. Acta Opt. Sin. 2022, 42, 1828008. [Google Scholar]
  2. Tan, K.; Wang, X.; Niu, C.; Wang, F.; Du, P.J.; Sun, D.X.; Yuan, J.; Zhang, J. Vicarious calibration for the AHSI instrument of Gaofen-5 with reference to the CRCS Dunhuang test site. IEEE Trans. Geosci. Remote Sens. 2021, 59, 3409–3419. [Google Scholar] [CrossRef]
  3. Huang, F.; Shen, X.; Liu, J.; Li, G.; Ying, J. Research on radiometric calibration for super wide-angle staring infrared imaging system. Infrared Phys. Technol. 2013, 61, 9–13. [Google Scholar] [CrossRef]
  4. Zhao, Y.G.; Ma, L.L.; Li, C.R.; Gao, C.X.; Wang, N.; Tang, L.L. Radiometric cross-calibration of Landsat-8/OLI and GF-1/PMS sensors using an instrumented sand site. IEEE J. Sel. Top. Appl. Earth Obs. Remote Sens. 2018, 11, 3822–3829. [Google Scholar] [CrossRef]
  5. Guo, H.; Fu, W.; Liu, G. Scientific Satellite and Moon-Based Earth Observation for Global Change; Springer: Singapore, 2019. [Google Scholar]
  6. Cao, C.; Weinreb, M.; Xu, H. Predicting simultaneous nadir overpasses among polar-orbiting meteorological satellites for the intersatellite calibration of radiometers. J. Atmos. Oceanic Technol. 2004, 21, 537–542. [Google Scholar] [CrossRef]
  7. Wang, L.; Goldberg, M.; Wu, X.; Cao, C.; Robert, A.; Iacovazzi, J.; Yu, F.; Li, Y. Consistency assessment of atmospheric infrared sounder and infrared atmospheric sounding interferometer radiances: Double differences versus simultaneous nadir overpasses. J. Geophys. Res. Atmos. 2011, 116. [Google Scholar] [CrossRef]
  8. Han, J.; Tao, Z.; Xie, Y.; Li, H.N.; Liu, Q.Y.; Guan, X.G. A Novel Radiometric Cross-Calibration of GF-6/WFV with MODIS at the Dunhuang Radiometric Calibration Site. IEEE J. Sel. Top. Appl. Earth Obs. Remote Sens. 2021, 14, 1645–1653. [Google Scholar] [CrossRef]
  9. Liu, J.J.; Li, Z.; Qiao, Y.L.; Liu, Y.J.; Zhang, Y.X. A new method for cross-calibration of two satellite sensors. Int. J. Remote Sens. 2004, 25, 5267–5281. [Google Scholar] [CrossRef]
  10. Li, Y.; Zhang, Y.X.; Liu, J.J.; Rong, Z.G.; Zhang, L.J.; Zhang, Y.H. Calibration of the visible and NIR channels of the FY-2C/FY-2D GEO meteorological satellite at radiometric site. Acta Opt. Sin. 2009, 29, 41–46. [Google Scholar]
  11. Hu, X.Q.; Zhang, Y.X.; Qiu, K.M. In-flight radiometric calibration for VIR channels of FY-1C satellite sensor by using irradiance-based method. J. Remote Sens. 2003, 7, 458–464. [Google Scholar]
  12. Chen, C.; Zhang, B.; Zhang, H.; Zhang, W.; Zhang, Y. HJ-1A multispectral imagers radiometric performance in the first year. In Proceedings of the 2010 IEEE International Geoscience and Remote Sensing Symposium (IGARSS), Honolulu, HI, USA, 25–30 July 2010; pp. 4264–4267. [Google Scholar]
  13. Gao, H.L.; Gu, X.F.; Yu, T.; Gong, H.; Li, J.G.; Li, X.Y. HJ-1A HSI on-orbit radiometric calibration and validation research. Sci. China Technol. Sci. 2010, 53, 3119–3128. [Google Scholar] [CrossRef]
  14. Chen, L.; Xu, N.; Hu, X.Q.; Lu, F.; Zhang, P. Study on orbit radiometric calibration for FY-2 visible band based on deep convective cloud. Spectrosc. Spect. Anal. 2016, 36, 2639–2645. [Google Scholar]
  15. Yang, T.H.; Zhang, C.M.; Zuo, F.H.; Hu, Y.; GU, M.J. Uncertainty analysis of inter-calibration collocation based on FY-3E spaceborne infrared observations. Infrared Laser Eng. 2023, 52, 17–28. [Google Scholar]
  16. Han, J.; Tao, Z.; Xie, Y.; Liu, Q.Y.; Huang, Y.J. Radiometric Cross-Calibration of GF-4/PMS Based on Radiometric Block Adjustment. IEEE Trans. Geosci. Remote Sens. 2021, 59, 4522–4534. [Google Scholar] [CrossRef]
  17. Niu, C.; Tan, K.; Wang, X.; Han, B.; Ge, S.; Du, P.; Wang, F. Radiometric cross-calibration of the ZY1-02D hyperspectral imager using the GF-5 AHSI imager. IEEE Trans. Geosci. Remote Sens. 2021, 60, 1–12. [Google Scholar] [CrossRef]
  18. Li, C.; Xue, Y.; Liu, Q.; Guang, J.; He, X.; Zhang, J.; Wang, T.; Liu, X. Post calibration of channels 1 and 2 of long-term AVHRR data record based on SeaWiFS data and pseudo-invariant targets. Remote Sens. Environ. 2014, 150, 104–119. [Google Scholar] [CrossRef]
  19. Wu, A.; Xiong, X.; Doelling, D.; Morstad, D.; Angal, A.; Bhatt, R. Characterization of Terra and Aqua MODIS VIS, NIR, and SWIR Spectral Bands’ Calibration Stability. IEEE Trans. Geosci. Remote Sens. 2012, 51, 4330–4338. [Google Scholar] [CrossRef]
  20. Xiong, X.; Angal, A.; Twedt, K.A.; Chen, H.; Link, D.; Geng, X.; Aldoretta, E.; Mu, Q. MODIS reflective solar bands on-orbit calibration and performance. IEEE Trans. Geosci. Rem. Sens. 2019, 57, 6355–6371. [Google Scholar] [CrossRef]
  21. Xiong, X.; Sun, J.; Xie, X.; Barnes, W.L.; Salomonson, V.V. On-Orbit Calibration and Performance of Aqua MODIS Reflective Solar Bands. IEEE Trans. Geosci. Remote Sens. 2010, 48, 535–546. [Google Scholar] [CrossRef]
  22. Angal, A.; Xiong, X.; Shrestha, A. Cross-Calibration of MODIS reflective solar bands with Sentinel 2A/2B MSI instruments. IEEE Trans. Geosci. Remote Sens. 2020, 58, 5000–5007. [Google Scholar] [CrossRef]
  23. Gao, H.; Gu, X.; Yu, T.; Sun, Y.; Liu, Q. Cross-Calibration of GF-1 PMS sensor with Landsat 8 OLI and Terra MODIS. IEEE Trans. Geosci. Remote Sens. 2016, 54, 4847–4854. [Google Scholar] [CrossRef]
  24. Liu, L.; Shi, T.; Gao, H.; Zhang, X.; Han, Q.; Hu, X. Long-term cross calibration of HJ-1A CCD1 and Terra MODIS reflective solar bands. Sci. Rep. 2021, 11, 7386. [Google Scholar] [CrossRef] [PubMed]
  25. Xiong, X.; Angal, A.; Butler, J.; Cao, C.; Doelling, D.; Wu, A.; Wu, X. Global space-based inter-calibration system reflective solar calibration reference: From Aqua MODIS to S-NPP VIIRS. Proc. SPIE 2016, 9881, 275–286. [Google Scholar]
  26. Luo, J.; Huang, F.; Gao, S.; Liu, S.; Liu, R.; Devasthale, A. Satellite Monitoring of the Dust Storm over Northern China on 15 March 2021. Atmosphere 2022, 13, 157. [Google Scholar] [CrossRef]
  27. Yang, J.; Zhang, Z.; Wei, C.; Lu, F.; Guo, Q. Introducing the new generation of chinese geostationary weather satellites, Fengyun-4. Bull. Am. Meteorol. Soc. 2017, 98, 1637–1658. [Google Scholar] [CrossRef]
  28. Long, Y.P.; Chen, G.Y.; Ma, Q.M.; Chen, J. Ground validation of Fengyun-4A and Global Precipitation Measurement satellite observations over an alpine and canyon basin of the southeastern Tibetan Plateau. J. Mt. Sci. 2022, 19, 3568–3581. [Google Scholar] [CrossRef]
  29. Zhang, P.; Zhu, L.; Tang, S.; Gao, L.; Chen, L.; Zheng, W.; Han, X.; Chen, J.; Shao, J. General comparison of FY-4A/AGRI with other GEO/LEO instruments and its potential and challenges in non-meteorological applications. Front. Earth Sci. 2019, 6, 224. [Google Scholar] [CrossRef]
  30. Xiong, X.; Barnes, W. An overview of MODIS radiometric calibration and characterization. Adv. Atmos. Sci. 2006, 23, 69–79. [Google Scholar] [CrossRef]
  31. Meyer, K.; Platnick, S.; Holz, R.; Dutcher, S.; Quinn, G.; Nagle, F. Derivation of shortwave radiometric adjustments for SNPP and NOAA-20 VIIRS for the NASA MODIS-VIIRS continuity cloud products. Remote Sens. 2020, 98, 4096. [Google Scholar] [CrossRef]
  32. Dwyer, J.; Schmidt, G. The MODIS Reprojection Tool. In Earth Science Satellite Remote Sensing; Qu, J.J., Gao, W., Kaftos, M., Murphy, R.E., Salmonson, V.V., Eds.; Springer: Berlin/Heidelberg, Germany, 2006; pp. 162–177. [Google Scholar]
  33. Xu, N.; Hu, X.Q.; Chen, L. Inter-calibration of infrared channels of FY-2/VISSR using high-spectral resolution sensors IASI and AIRS. J.Remote Sens. 2012, 16, 939–952. [Google Scholar]
  34. Soler, T.; Eisemann, D.W. Determination of look angles to geostationary communication satellites. J. Surv. Eng. 1994, 120, 115–127. [Google Scholar] [CrossRef]
  35. Pinto, C.T.; Ponzoni, F.J.; Castro, R.M.; Leigh, L.; Kaewmanee, M.; Aaron, D.; Helder, D. Evaluation of the uncertainty in the spectral band adjustment factor (SBAF) for cross-calibration using Monte Carlo simulation. Remote Sens. Lett. 2016, 7, 837–846. [Google Scholar] [CrossRef]
  36. Chander, G.; Markham, B. Revised Landsat-5 TM radiometric calibration procedures and postcalibration dynamic ranges. IEEE Trans. Geosci. Remote Sens. 2003, 41, 2674–2677. [Google Scholar] [CrossRef]
  37. He, T.; Liang, S.; Wang, D.; Shi, Q.; Goulden, M.L. Estimation of high-resolution land surface net shortwave radiation from AVIRIS data: Algorithm development and preliminary results. Remote Sens. Environ. 2015, 167, 20–30. [Google Scholar] [CrossRef]
  38. Lv, Y.; Cong, M.Y.; Zhao, Y.N.; Niu, K.Q.; Lu, Z.W. Research on real-time absolute radiometric calibration technology of infrared cameras. Infrared Laser Eng. 2022, 51, 106–119. [Google Scholar]
  39. Tian, F.; Fensholt, R.; Verbesselt, J.; Grogan, K.; Horion, S.; Wang, Y. Evaluating temporal consistency of long-term global NDVI datasets for trend analysis. Remote Sens. Environ. 2015, 163, 326–340. [Google Scholar] [CrossRef]
  40. Li, J.; Chen, X.; Tian, L.; Ding, J.; Song, Q.; Yu, Z. On the consistency of HJ-1A CCD1 and Terra/MODIS measurements for improved spatio-temporal monitoring of inland water: A case in Poyang Lake. Remote Sens. Lett. 2015, 6, 351–359. [Google Scholar] [CrossRef]
  41. Qiao, H.; Zhang, P.; Li, Z.; Liu, C. A New Geostationary Satellite-Based Snow Cover Recognition Method for FY-4A AGRI. IEEE J. Sel. Top. Appl. Earth Obs. Remote Sens. 2021, 14, 11372–11385. [Google Scholar] [CrossRef]
  42. Mishra, N.; Helder, D.; Angal, A.; Choi, J.; Xiong, X. Absolute Calibration of Optical Satellite Sensors Using Libya 4 Pseudo Invariant Calibration Site. Remote Sens. 2014, 6, 1327–1346. [Google Scholar] [CrossRef]
  43. Fawcett, D.; Bennie, J.; Anderson, K. Monitoring spring phenology of individual tree crowns using drone-acquired NDVI data. Remote Sens. Ecol. Conserv. 2021, 7, 227–244. [Google Scholar] [CrossRef]
  44. Weiss, E.; Marsh, S.E.; Pfirman, E.S. Application of NOAA-AVHRR NDVI time-series data to assess changes in Saudi Arabia’s rangelands. Int. J. Remote Sens. 2010, 22, 1005–1027. [Google Scholar] [CrossRef]
  45. Goodin, D.G.; Henebry, G.M. The effect of rescaling on fine spatial resolution NDVI data: A test using multi-resolution aircraft sensor data. Int. J. Remote Sens. 2002, 23, 3865–3871. [Google Scholar] [CrossRef]
  46. Fensholt, R.; Sandholt, I.; Proud, S.R.; Stisen, S.; Rasmussen, M.O. Assessment of MODIS sun-sensor geometry variations effect on observed NDVI using MSG SEVIRI geostationary data. Int. J. Remote Sens. 2010, 31, 6163–6187. [Google Scholar] [CrossRef]
  47. Fan, X.; Liu, Y. Multisensor Normalized Difference Vegetation Index Intercalibration: A comprehensive overview of the causes of and solutions for multisensor differences. IEEE Geosci. Remote Sens. Mag. 2018, 6, 23–45. [Google Scholar] [CrossRef]
  48. Teillet, P.; Staenz, K.; William, D. Effects of spectral, spatial, and radiometric characteristics on remote sensing vegetation indices of forested regions. Remote Sens. Environ. 1997, 61, 139–149. [Google Scholar] [CrossRef]
  49. Wang, Y.; Sun, X.; Huang, H.; Ti, R.; Liu, X.; Fan, Y. Study on Influencing Factors of the Information Content of Satellite Remote-Sensing Aerosol Vertical Profiles Using Oxygen A-Band. Remote Sens. 2023, 15, 948. [Google Scholar] [CrossRef]
  50. Cui, Z.; Ma, C.; Zhang, H.; Hu, Y.; Yan, L.; Dou, C.; Li, X.M. Vicarious Radiometric Calibration of the Multispectral Imager Onboard SDGSAT-1 over the Dunhuang Calibration Site, China. Remote Sens. 2023, 15, 2578. [Google Scholar] [CrossRef]
Figure 1. Spectral response function of FY-4A/AGRI and Aqua-MODIS in red band and near infrared band.
Remotesensing 15 05454 g001
Figure 2. Main factors for differences in NDVI of different sensors.
Remotesensing 15 05454 g002
Figure 3. Comparative analysis process of MODIS-based FY-4A/AGRI cross-radiometric calibration and its NDVI application.
Remotesensing 15 05454 g003
Figure 4. Zenith angle calculation diagram for the geostationary FY-4A/AGRI satellite image data.
Remotesensing 15 05454 g004
Figure 5. Sample locations of FY-4A/AGRI and MODIS cross-radiometric calibration matching (August 2018–September 2020).
Remotesensing 15 05454 g005
Figure 6. The linear relationship between the TOA reflectance of FY-4A/AGRI and the TOA reflectance of the MODIS before and after performing SBAF correction.
Remotesensing 15 05454 g006
Figure 7. FY-4A/AGRI red band and NIR band cross calibration coefficients and their relative differences from the original calibration coefficients (August 2018 to September 2020).
Remotesensing 15 05454 g007
Figure 8. FY-4A/AGRI red band and NIR band cross-calibration coefficients and trends (October 2020~December 2022).
Remotesensing 15 05454 g008
Figure 9. The TOA reflectance before performing FY-4A/AGRI cross calibration, the TOA reflectance after performing FY-4A/AGRI cross calibration, and the MODIS TOA reflectance.
Remotesensing 15 05454 g009
Figure 10. NDVI distributions of typical ground objects before and after performing FY-4A/AGRI cross calibration and MODIS cross calibration. (a1,a2) represent the NDVI of buildings and forest vegetation before FY-4A/AGRI cross calibration, respectively. (b1,b2) represent the NDVI of buildings and forest vegetation after FY-4A/AGRI cross calibration, respectively. (c1,c2) represent the NDVI of MODIS buildings and forest vegetation, respectively.
Remotesensing 15 05454 g010
Figure 11. Trend and correlation of growth season average in three NDVI datasets during the study period.
Remotesensing 15 05454 g011
Figure 12. Trend and correlation of seasonal mean in the three NDVI datasets during the study period.
Remotesensing 15 05454 g012
Figure 13. Variation trend and correlation of monthly mean value in three NDVI datasets during the study period.
Remotesensing 15 05454 g013
Figure 14. Spatial distribution of three NDVI datasets in Henan Province from 2018 to 2022.
Remotesensing 15 05454 g014
Figure 15. Trend chart of three NDVI datasets in Henan Province from 2018 to 2022.
Remotesensing 15 05454 g015
Figure 16. Classification chart of change trend of three NDVI datasets in Henan Province from 2018 to 2022.
Remotesensing 15 05454 g016
Figure 17. FY-4A/AGRI cross-calibration coefficients for the red band and NIR band (August 2018–December 2022).
Remotesensing 15 05454 g017
Figure 18. Relative errors of the FY-4A/AGRI red band and NIR band cross-calibration coefficients (August 2018–December 2022).
Remotesensing 15 05454 g018
Figure 19. Effect of the satellite zenith angle on the TOA reflectance values in the red band and NIR band. (a) shows the variation curve of the TOA reflectance of the red band with the satellite zenith angle when it is lower than 0.2. (b) shows the variation curve of the TOA reflectance of the NIR band with the satellite zenith angle when it is lower than 0.2. (c) shows the variation curve of the TOA reflectance of the NIR band with the satellite zenith angle when it is below 0.4.
Remotesensing 15 05454 g019
Table 1. Descriptions of the FY-4A/AGRI and Aqua-MODIS sensors.
Aqua-MODISFY-4A/AGRI
OrbitSun-synchronousGeo-synchronization
Scanning modeWhisk broomFull-disc scanning
Area2330 × 2330 (km2)Whole Earth
Spectral range/μm0.4~15.00.45~13.8
RegressionAlmost 1~2 d15 min
Spatial resolution/m250 m/500 m/1000 m500~4000
Table 2. Introduction to data used by FY-4A/AGRI and MODIS.
DataAqua-MODISFY-4A/AGRI
Cross calibrationMYD021KM
MYD03
FY-4A/AGRI L1
FY-4A/AGRI L1 GEO
Cross-calibration coefficient verificationMYD021KMFY-4A/AGRI L1
Atmospheric correctionMCD19A2
MYD05
MYD07
FY-4A/AGRI L1
NDVI applicationMYD09GAAtmospheric corrected FY-4A/AGRI L1
Table 3. SBAFs of the FY-4A/AGRI red band and NIR band.
BandSBAF
Red0.965
NIR0.988
Table 4. RMS and RMSE of the TOA reflectance values before and after performing cross calibration on the red band and NIR band.
RedNear Infrared
BeforeAfterBeforeAfter
RMS0.430.120.250.03
RMSE0.0850.0790.0820.078
Table 5. Classification of NDVI trend.
Slopet-TestDegree of Change
<0p < 0.001Very significant degradation
p < 0.05Significant degradation
p < 0.1No significant degradation
>0p < 0.001Very significant improvement
p < 0.05Significant improvement
p < 0.1No significant improvement
p > 0.1Basically unchanged
Table 6. Proportion of trend area of each of the three NDVI datasets in Henan Province from 2018 to 2022.
Degree of ChangeMODIS-NDVI (%)FY-NDVI (%)FY’-NDVI (%)
Very significant degradation0.040.710
Significant degradation2.0910.320.18
No significant degradation2.232.971.44
Very significant improvement0.510.070
Significant improvement2.6724.182.70
No significant improvement2.2614.3225.57
Basically unchanged90.3546.6970.11
Disclaimer/Publisher’s Note: The statements, opinions and data contained in all publications are solely those of the individual author(s) and contributor(s) and not of MDPI and/or the editor(s). MDPI and/or the editor(s) disclaim responsibility for any injury to people or property resulting from any ideas, methods, instructions or products referred to in the content.

