Article

Assessment of Active Ground Subsidence in the Dibrugarh and Digboi Areas of Assam, Northeast India, Using the PSInSAR Technique

by
Abhishek Lakhote
1,
Girish Ch Kothyari
2,*,
Atul Kumar Patidar
2,*,
Jayshree Changmai
2,
Rashmi Borgohain
3,
Tanupriya Choudhury
4,* and
Jung-Sup Um
5,*
1
Institute of Earth Sciences, Academia Sinica, Taipei 11529, Taiwan
2
Department of Petroleum Engineering and Earth Sciences, University of Petroleum and Energy Studies, Dehradun 248007, Uttarakhand, India
3
Department of Earth and Environmental Science, KSKV Kachchh University, Bhuj 370001, Gujarat, India
4
CSE Department, Symbiosis Institute of Technology, Symbiosis International University, Lavale Campus, Pune 412115, Maharashtra, India
5
Department of Geography, College of Social Sciences, Kyungpook National University, Buk-gu, Daegu 37224, Republic of Korea
*
Authors to whom correspondence should be addressed.
Remote Sens. 2023, 15(20), 4963; https://doi.org/10.3390/rs15204963
Submission received: 18 May 2023 / Revised: 23 July 2023 / Accepted: 25 July 2023 / Published: 14 October 2023
(This article belongs to the Topic UAV Remote Sensing of Cyber-Physical System)

Abstract

:
Ground deformation on a regional to local scale is the consequence of a wide range of natural processes such as tectonic and anthropogenic activities. Globally, the over-extraction of groundwater and hydrocarbon exploitation are the primary causes of ground subsidence. The current study demonstrates regional scale ground subsidence analysis of the Dibrugarh and Digboi regions of Brahmaputra alluvial plain, Assam, Northeast India. To understand the ongoing surface deformation satellite base, the RADAR technique has been applied using SENTINEL-1A data, which were acquired between 15 October 2015 to 25 January 2022. The assessment carried out via the time series analysis of the radar data suggests that the Dibrugarh area is subsiding at a rate of ~5 mm/yr, whereas the Digboi is deforming at a much faster rate (±22 mm/yr) than Dibrugarh. The presence of active faults in the subsurface and associated deformation is another reason for active ground subsidence. The outcomes of the current study validate that the study area is currently undergoing active subsurface deformation caused by both endogenic as well as exogenic processes. Furthermore, our Persistent Scatterer Interferometric Synthetic Aperture Radar (PSInSAR) and satellite-based analysis suggest that the over-exploitation of the natural resources is enhancing the rate of deformation in the Brahmaputra alluvial plain in the northeast of India.

1. Introduction

Ground subsidence occurs due to the removal or compaction of subsurface substances as a consequence of an overburden load and deteriorating underlying geological conditions. It poses a severe threat to human civilization as well as the environment [1,2,3,4,5,6]. It is also visible at the surface because of shallow/deep deformation brought on by a variety of geological or anthropogenic causes [1]. Ground subsidence is genetically linked to endogenic geological processes, such as faulting, folding, volcanism, erosion by underground water, underground mining, infrastructure building, drilling, and fracking, and the over-extraction of natural resources. However, exogenic subsidence is primarily associated with anthropogenic and surficial geomorphic processes, which include the displacement of ground through the formation of voids and the selective removal of material from the subsurface [7]. Subsidence caused by a large volume of fluid or gas extraction can be rapid and cause substantial damage to the environment and infrastructure. It is well known that oil and gas extraction can cause significant land subsidence. Ground subsidence is the broad term employed to characterize the vertical downward displacement in the Earth’s surface caused via the weathering and erosion of soil and rock, an increase in overburden load, and fragile subsurface conditions, while the term “collapse” is preferred when subsidence occurs suddenly as a consequence of a natural catastrophe. Settlement is a term used to describe surface down-warping that occurs at a relatively slow rate as a response to load adjustment. Overall, the risk of ground subsidence in highly populated areas may result in catastrophic risks, damage to civil infrastructure, and associated financial losses. The unplanned exploration and exploitation of natural resources (groundwater, minerals, and hydrocarbons) have adverse effects on the ecosystem by upsetting the geodynamic equilibrium of the upper crust [7,8,9].
In terms of the seismo-tectonics, geology, and geomorphology of the Himalayas, several studies have been carried out in NE India to develop earthquake-resistant civil structures for geohazard risk assessment and mitigation planning [10,11,12,13,14,15,16,17,18]. Except for flood-mapping investigations, only a few attempts have been made to comprehend ground subsidence-based studies employing remote sensing techniques [3,18,19]. Generally, time-reliant subsidence observations have relied on time-series approaches like Persistent Scatterer Interferometric Synthetic Aperture Radar (PSInSAR) [2,20] and small baseline (SB) interferometry [2,21,22,23,24,25]. Through time-series analysis, the PSInSAR approach is capable of measuring the millimeter-scale surface deformation of the Earth’s surface. To accurately estimate a terrain’s vertical displacement at a local to regional scale, this method can be extremely useful [2,26,27]. Infrastructure and the environment may be negatively impacted by the ground deformation and subsidence caused by drilling and fracking-induced seismicity during conventional and unconventional hydrocarbon exploration [3,4,9,28,29,30,31,32]. Thus, remote sensing-based active monitoring is crucial in identifying possible hazards posed by industrial activities before it is too late to implement corrective measures [9].
The time-dependent monitoring of groundwater and hydrocarbon extraction in the northeast region with geospatial radar-based techniques is critical for hazard mitigation and management. In this context, the “Interferometric Synthetic Aperture Radar” (InSAR) is conventionally employed to evaluate the millimeters scale of ground movement relative to the sensor’s line of sight (LoS) [33,34,35]. The fundamental advantage of using InSAR over conventional geodetic measurement techniques is that displacement estimates may be obtained for a given site without requiring a physical visit. In addition, because of the sensor’s wide swath, it also has the advantage of covering a large area of ground [31,32]. As a result, the most notable InSAR approaches include “Differential Interferometry (DInSAR)” and “Persistent Scatterer Interferometric Synthetic Aperture Radar (PSInSAR)” techniques [4]. In the present study, we have implemented PSInSAR analysis to monitor the morphological change and land subsidence analysis.
An attempt has been made to analyze ground subsidence in and around the Digboi and Dibrugarh region of the Brahmaputra alluvial plains (Figure 1) using remote sensing and GIS techniques, particularly PSInSAR. The objective was to measure the surface deformation and rate of sinking in the study area brought on through the excessive utilization of natural resources and related anthropogenic processes.

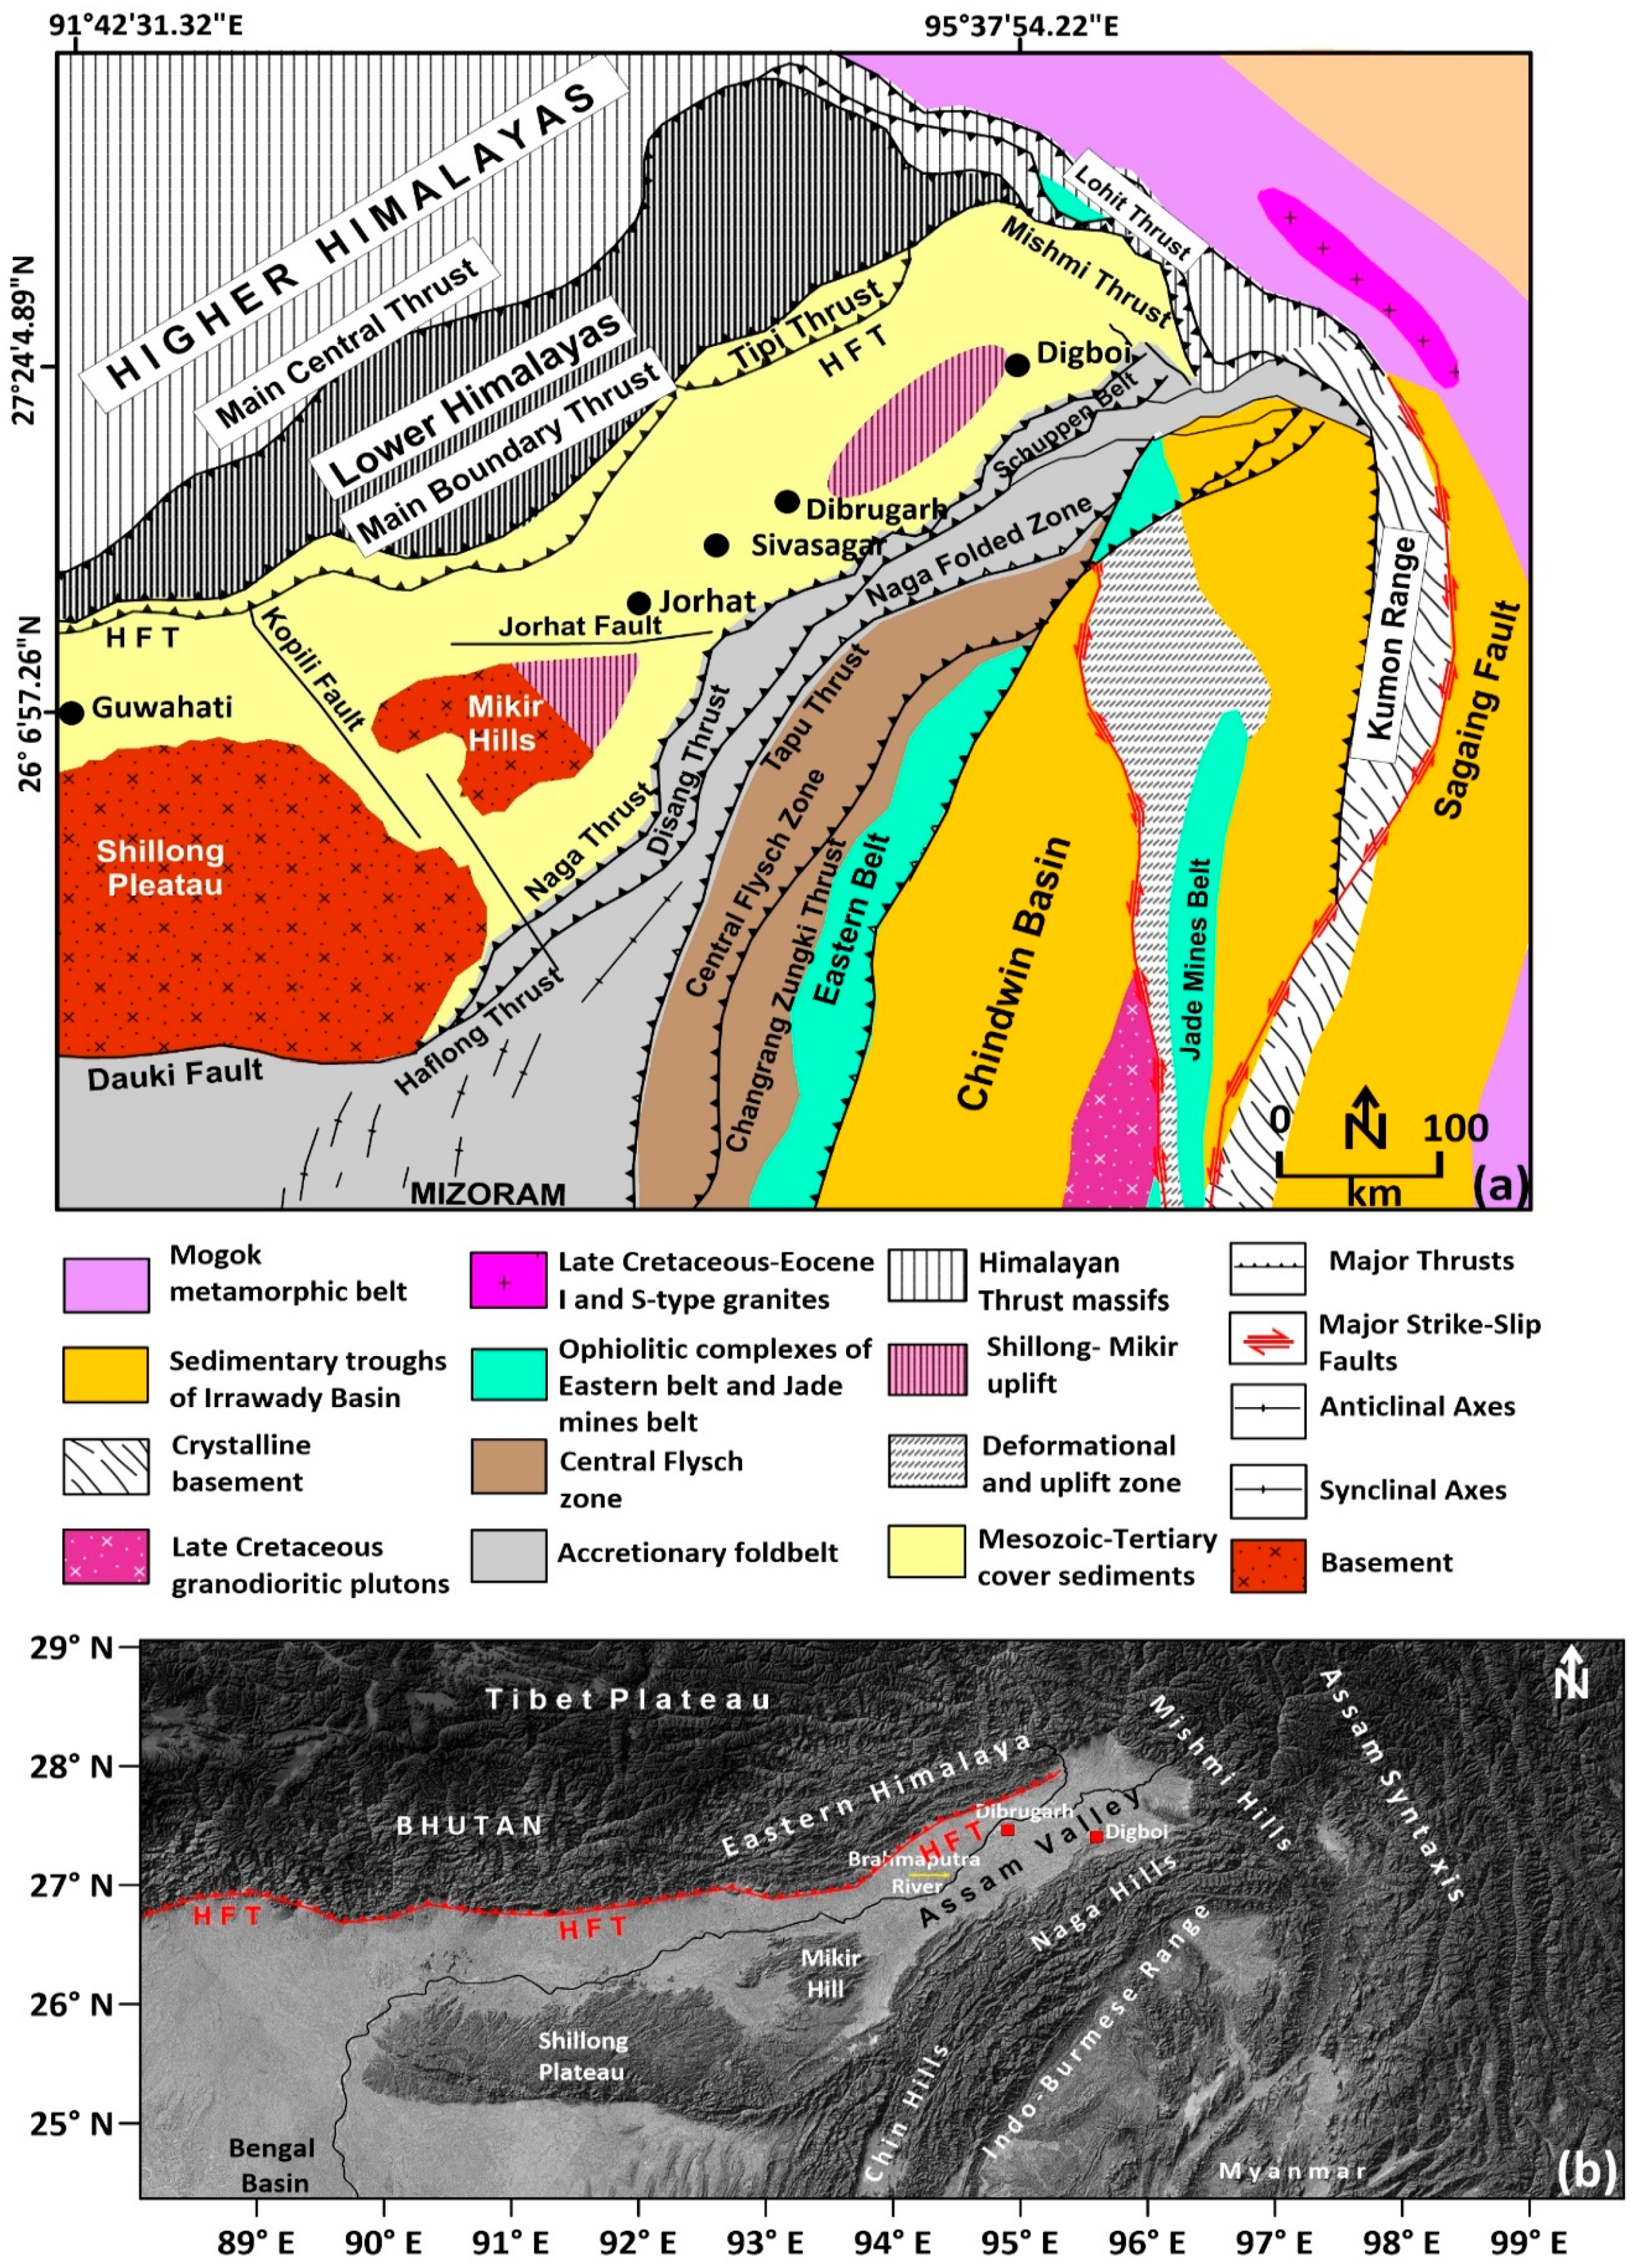
2. Tectonic Setting of the NE Himalayan Region

Tectonically, the Brahmaputra alluvial plain is surrounded by the Himalayan arc to the north and the Indo-Burmese arc to the south (Figure 1) [36,37,38]. The complexities of the tectonic framework of the northeastern part of India are a result of north–south and east–west convergence along the Himalayan and Indo-Burmese arc (Figure 1b) [14]. The entire area is impacted by the north–south convergence of the Indian plate, which extends from the “eastern Himalayas to the Bengal basin via the Shillong-Mikir Massif and the Upper Assam Valley” (Figure 1a). From north to south, the northeastern Himalayas is separated into four, geographically well-distributed, morpho-structural domains [12]. The outer sub-Himalaya is predominantly made up of Neogene and Quaternary molasse sediments to the south of the main boundary thrust (MBT), which represents the north Brahmaputra sub-Himalayan basin. The metasediments of the lesser Himalayas terminate towards the north of MBT [12]. The upper Assam Tertiary shelf is separated from the sub-Himalayan sedimentary basin [39]. The complex tectonic zone of the Indo-Burma ranges is structurally bounded by the dextral transform fault of the Andaman Spreading Ridge (ASR) and Mishmi thrust and is made up of Tertiary rocks. [12,40] (Figure 1). The Indo-Burma mountains comprise the Arakan-Yoma Hill, the Chin Hill, and the Naga Hill, which run northeast to finally connect with the Himalayan arc. However, the Mishmi range is located close to the Indo-Burma ranges, where lesser and higher Himalayan rocks are displaced along the Lohit, Tidding, and Mishmi thrusts in the Mishmi highlands. Further, high-grade metamorphosed Archean rocks are well exposed in the Shillong region and are overlain with the semi-deformed Proterozoic sediments [12]. The contact zone of Archean and Tertiary rocks are located around the Shillong region and are structurally separated by the E–W-trending Dauki fault, whereas the boundary of the Mikir hill is demarcated by the NNW–SSE-oriented Kopili fault (Figure 1a) [3]. The reactivation of these two faults causes a regional-scale ground uplift and subsidence in the region [41]. The ground subsidence in this region is responsible for the generation of accommodation space for sedimentation in the Brahmaputra alluvial plain and Bengal basin (Figure 1b).

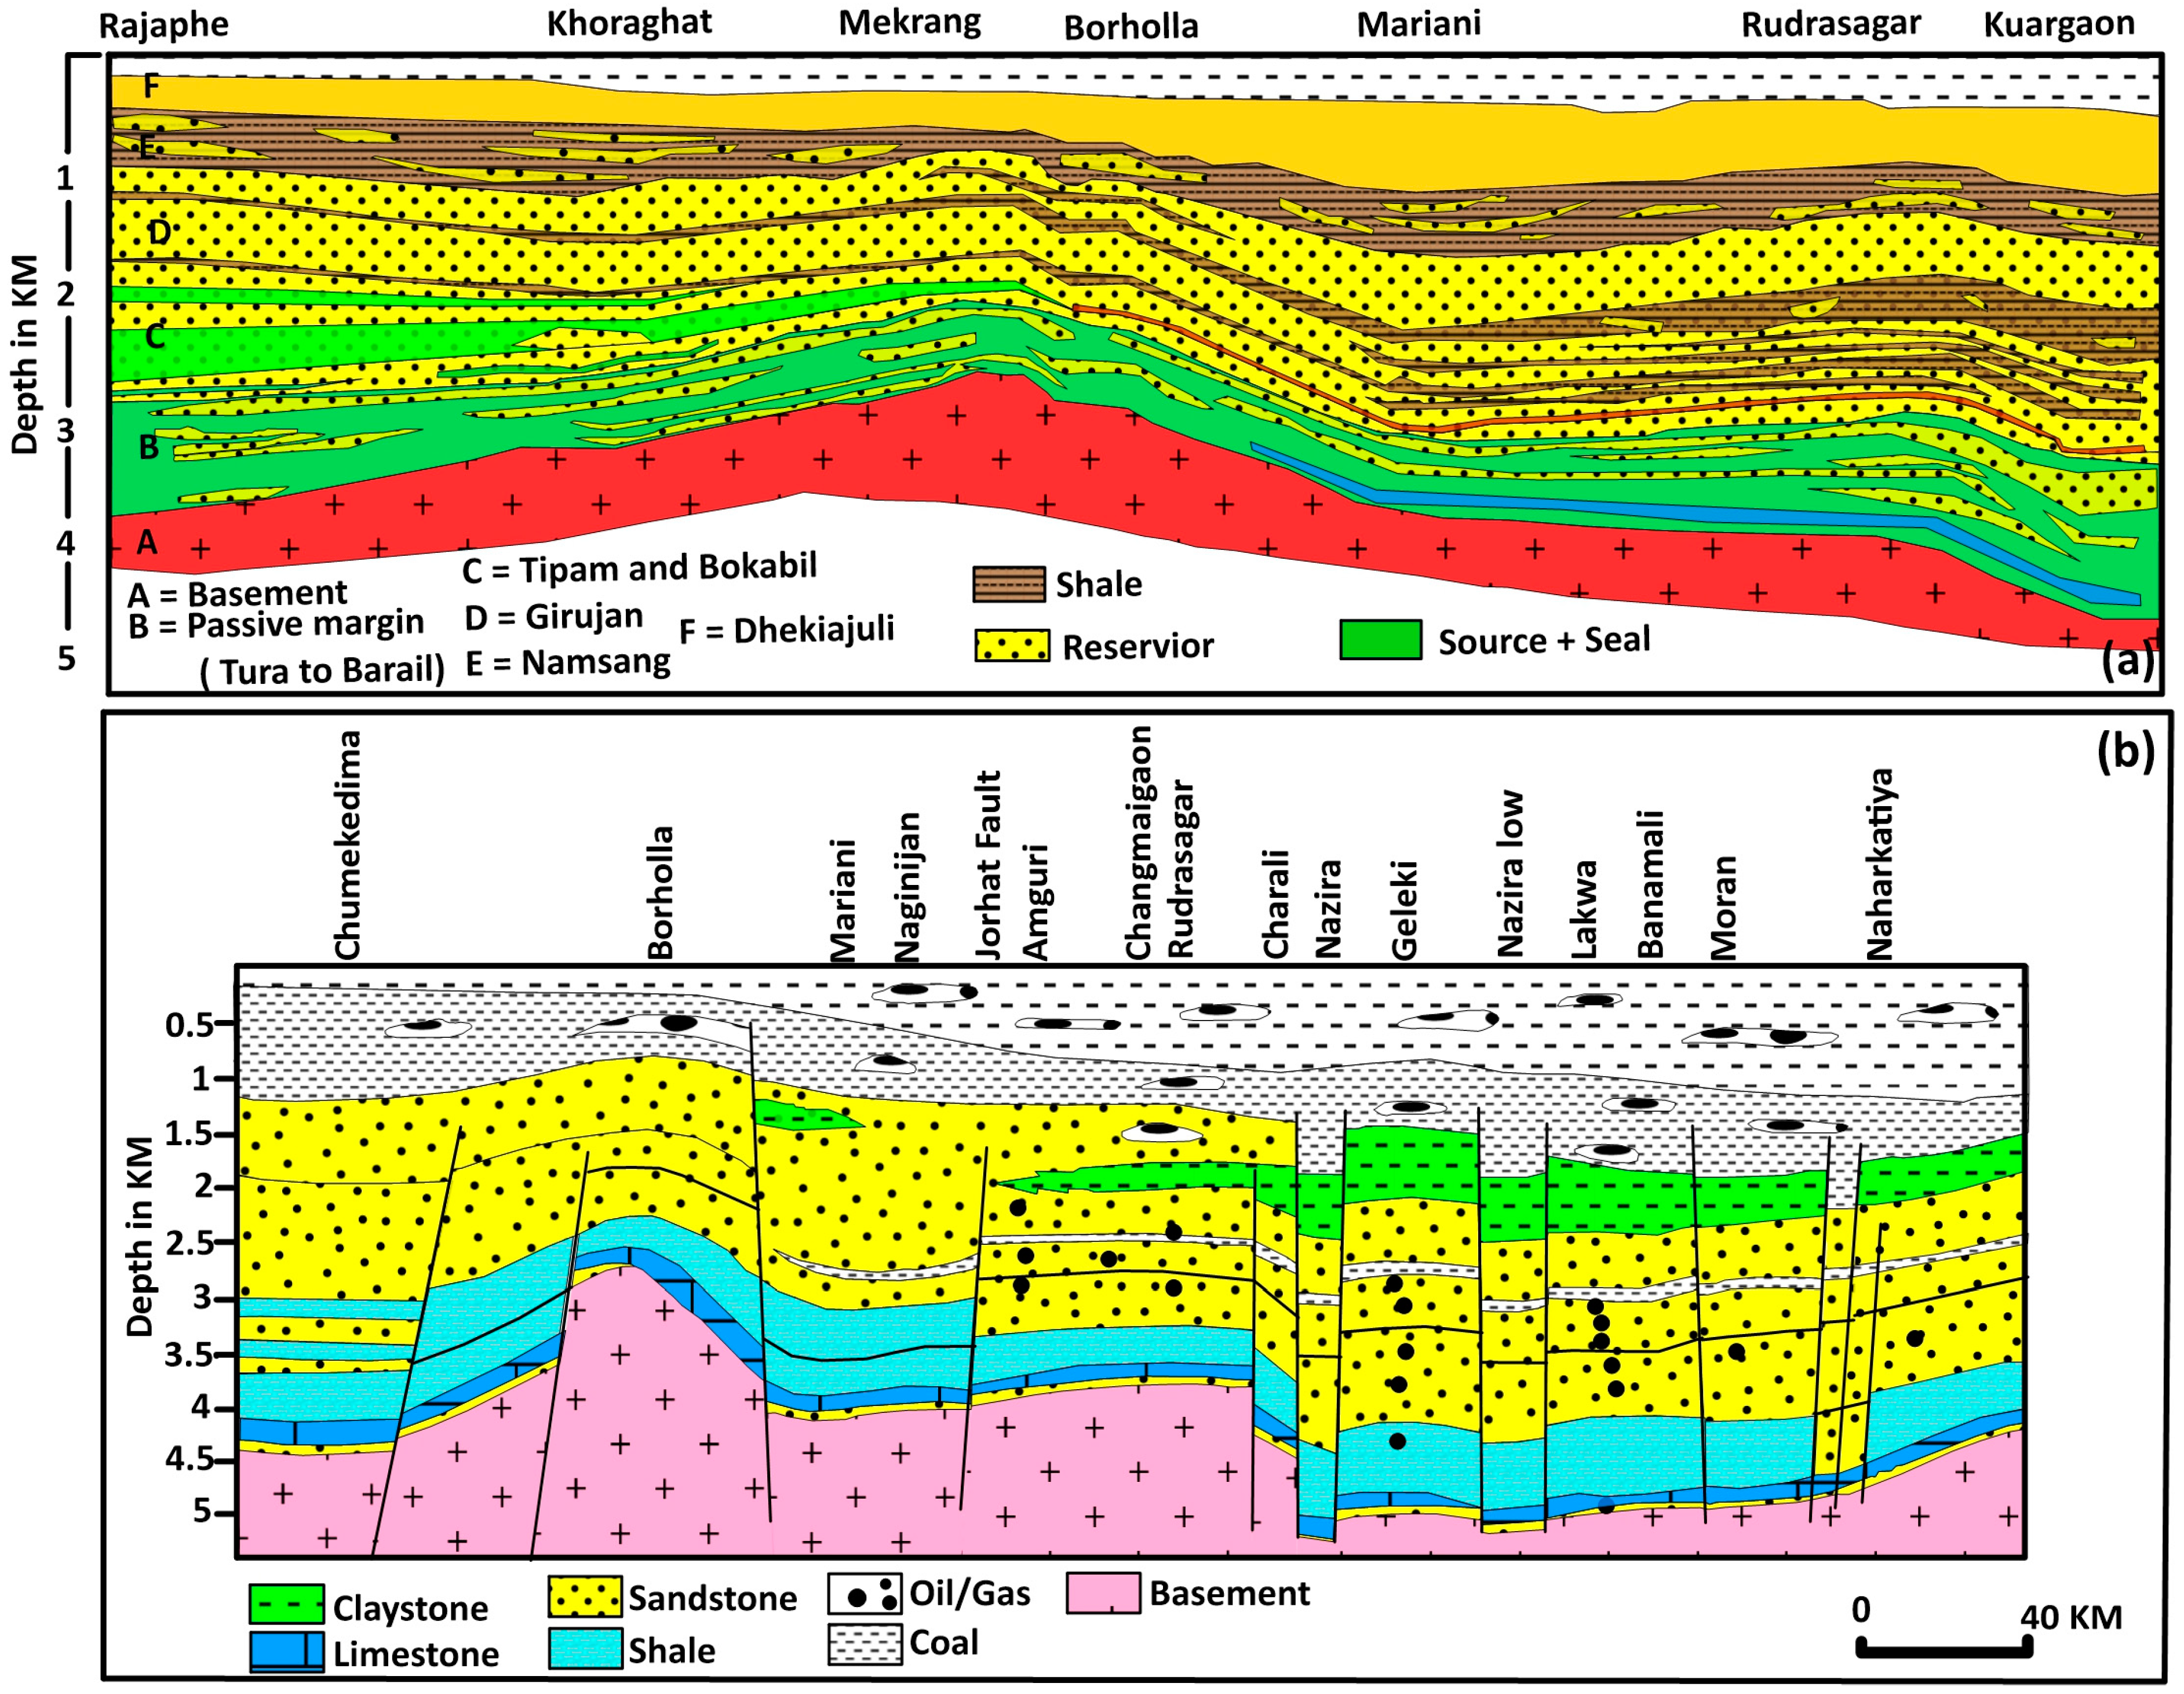
3. Geological Background

The current study area dominantly comprises sediment from the Brahmaputra alluvial plain, where a higher rate of sediment supply and discharge has been noticed [42,43,44]. The Brahmaputra alluvial floodplain is tectonically bound by the “Himalayan orogenic belt” (N and NE), including the “trans-Himalaya and Indo-Burmese range” in the SE direction [12]. Sediments within these basins are mainly derived from source rocks belonging to these two orogenic belts [45] (Figure 1a). The Trans-Himalayan plutonic and volcanic rocks, as well as Paleozoic to Eocene sedimentary strata, are all eroded by the Brahmaputra River and its tributaries. The Trans-Himalayan Plutonic Belt (TPB) contains highly deformed metamorphic and calc–alkaline plutonic rocks, which are located along the eastern syntaxis. This belt also has two units: the Lohit plutonic complex, which mostly consists of granite, diorite, tonalite, and leucogranite, and tidding suture zones, which includes meta-volcanic rock [15,45] (Table 1).
The Lohit and Dibang Rivers, two eastern tributaries, erode sediments from the calc-alkaline complexes and meta-volcanic Mishmi hills. The region located towards the west of the Indo-Burmese range is characterized by the presence of pelagic and volcanic arc sediments associated with ophiolites (Cretaceous to Oligocene age) (Table 1). These ranges of ophiolite suites are mostly made up of dolerite dykes, gabbroic complexes, and ultramafic rocks, which span a wide spectrum of high grades of plutonic rocks [10,15,45] (Figure 1). Two new mountain belts surround the Assam Valley, which has an ENE–WSW trend [36]. According to Dasgupta [10], the bottom of the Assam Valley gently slopes both in the northeast and southeast, flanking the Shillong-Mikir massif (Figure 1b). The Paleocene–Eocene Jaintia Group is widely distributed in the Assam Valley and the Mikir hills (Table 1). Between the Himalayas and the Naga Hills, the upper Assam valley is flat and runs NE–SW. The exposed oldest rocks of the Mikir hills and the Shillong plateau are of Precambrian age and are underlain by thick Tertiary rocks (Figure 1b; Table 1).
The town of Digboi is situated in Assam’s NE Tinsukia district. The first oil well in Asia was dug in this town, known as the Oil City of Assam, in the year 1866. Oil fields in the region are situated on an anticlinal fault line, which just so happens to be the hanging wall of the Naga thrust, south of India’s oldest active oil field. Large fields were later found in the Assam-Arakan foreland basin and along the Brahmaputra arch after the use of numerous seismic investigation methods. According to Barooah et al. [48], the middle Miocene Tipam series of rocks make up the extended anticlinal trap known as the Digboi anticline, which is where the Digboi oil field is located. The lower Tipam and upper Girujan formations (Table 1) are stratigraphically well-exposed in the Digboi anticline. To the south of the Naga Thrust, the rocks of the Tipam Group are stratigraphically underlain by the Barail Group.

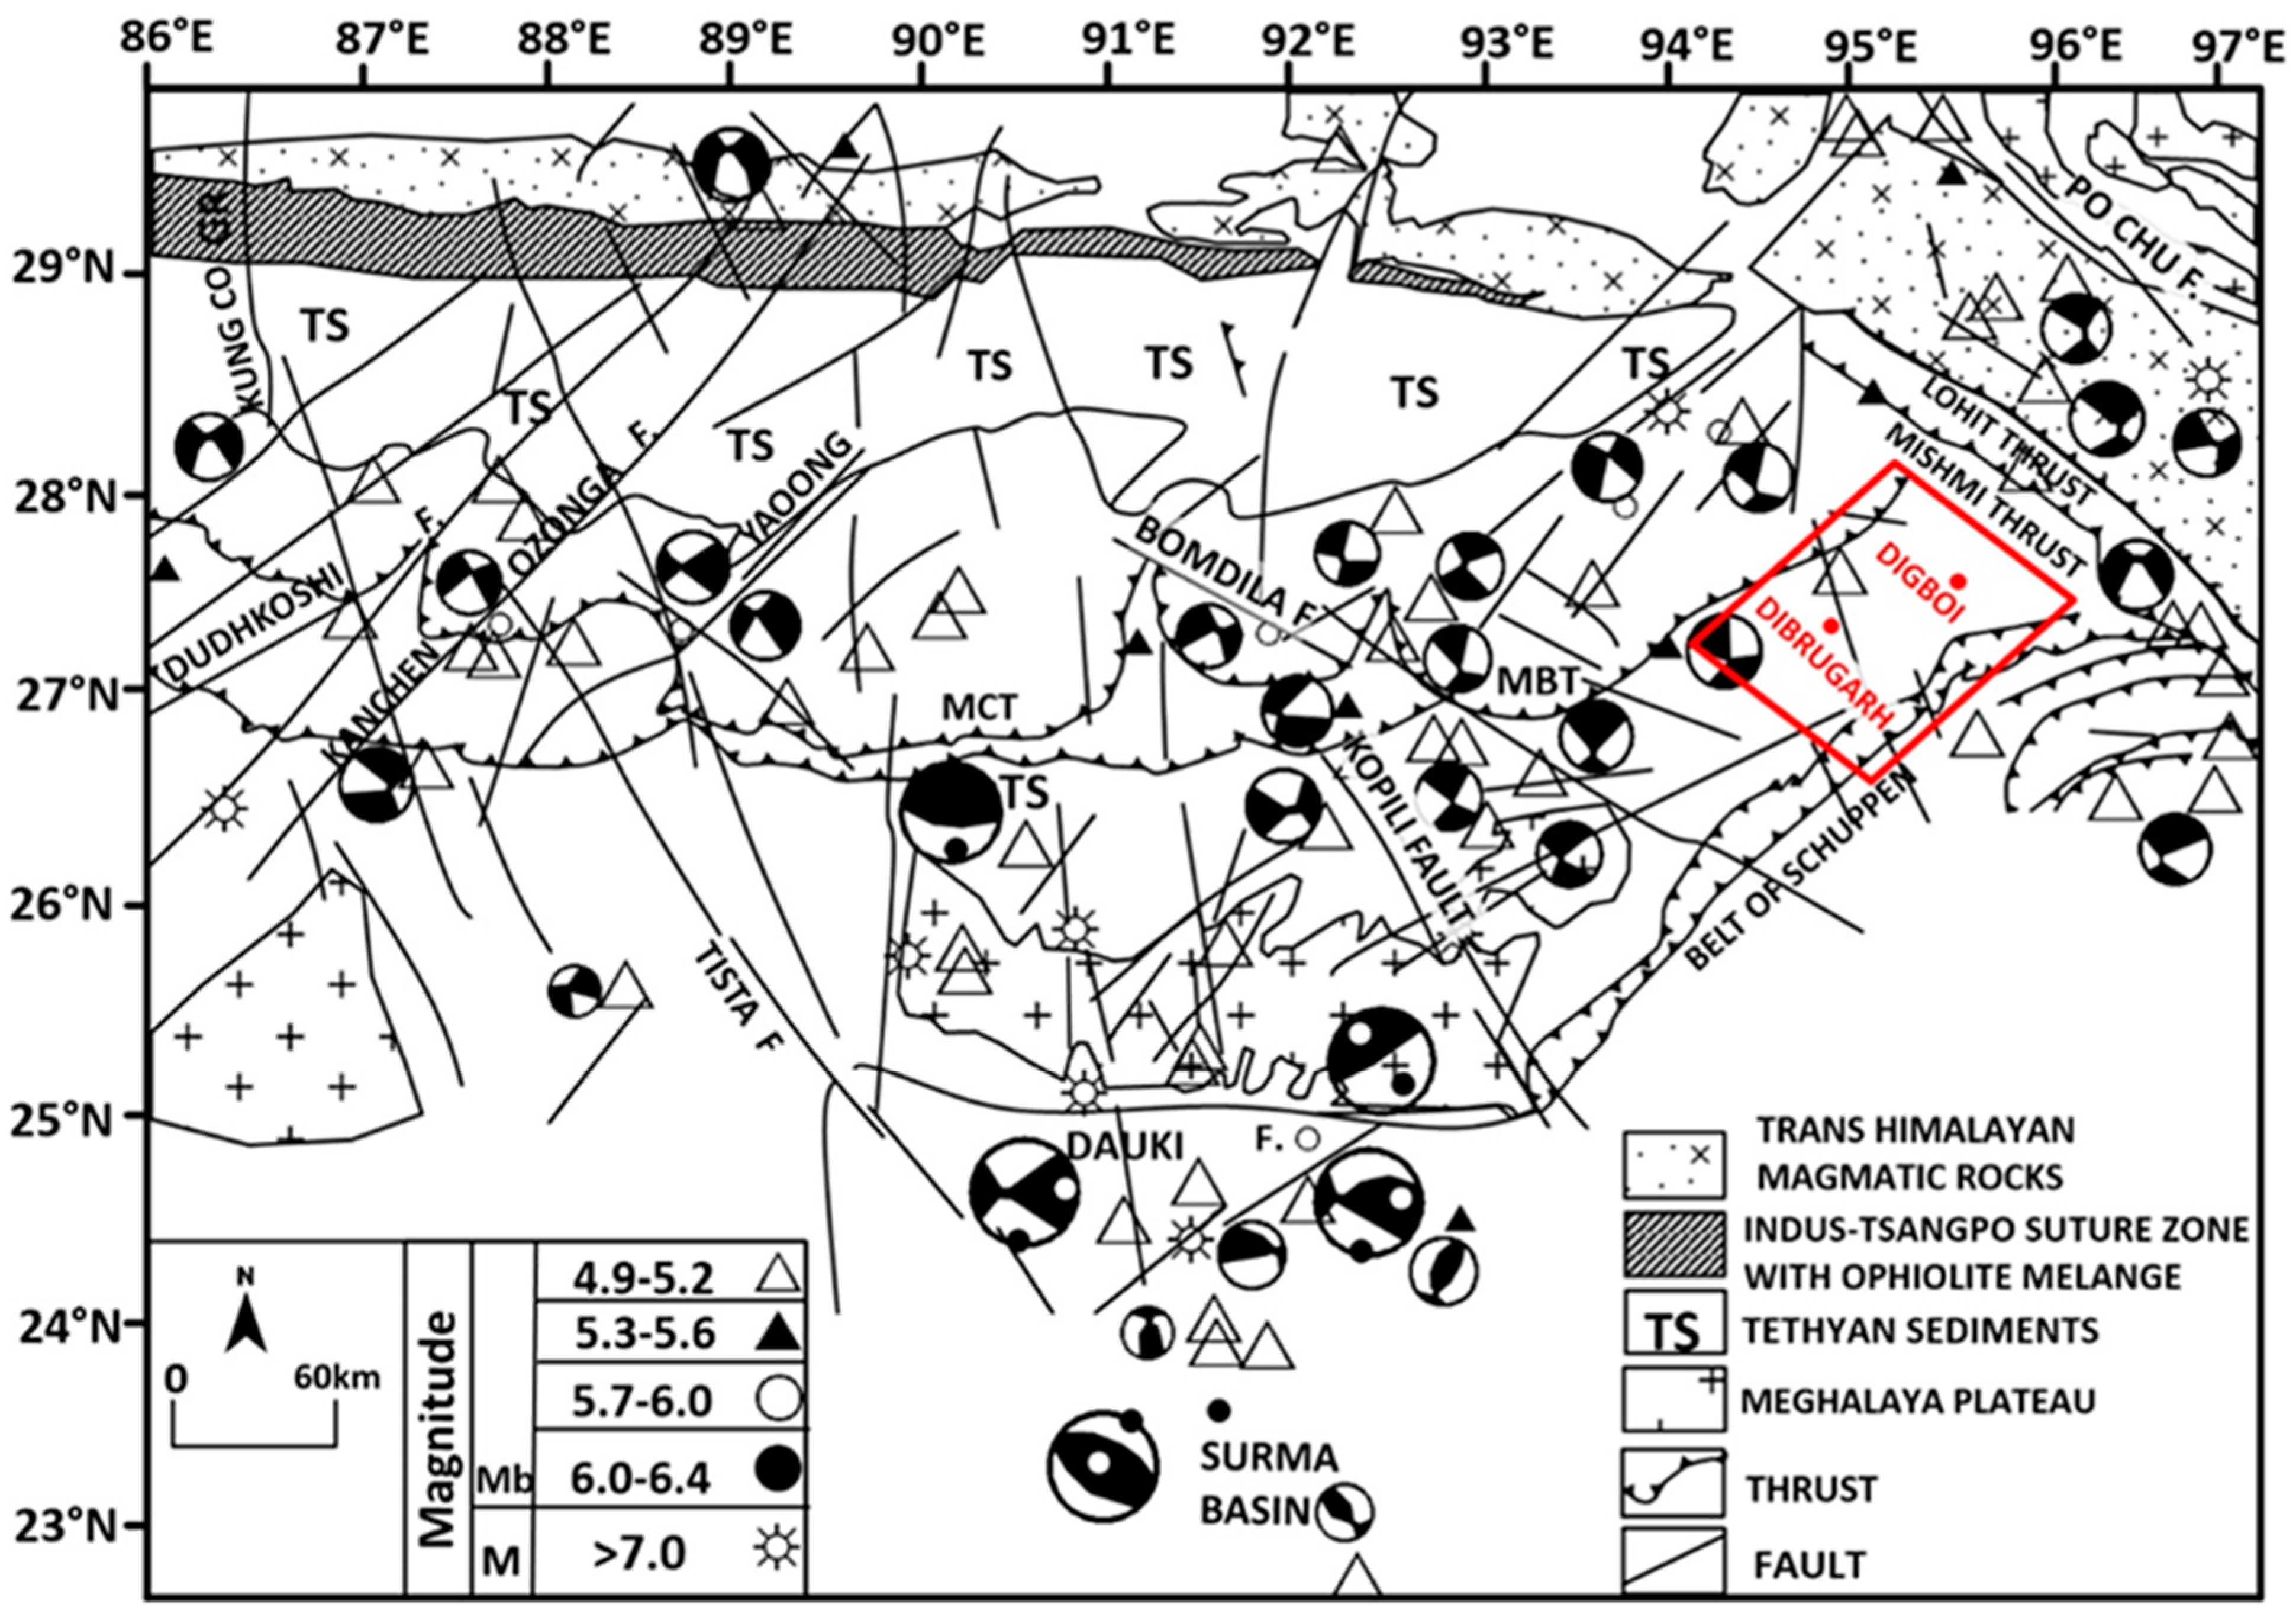
4. Past Earthquake Records

Dibrugarh is the third largest city of Assam, located between the Himalayan orogenic belt to the north and the Indo-Burma orogenic belt to the southeast. It witnessed earthquake-induced damage during the devastating 1950 Assam earthquake (Mw 8.6) [49] (Figure 2). This earthquake is considered one out of five great earthquakes in human history and severely affected areas of the Upper Assam [3,50,51]. During the 1950 earthquake liquefaction, damming the river, landslides, land subsidence, river bursts, and floods has been reported in Upper Assam [36]. The recent intraplate earthquakes of moderate magnitude in the northeastern states of Indiashow widespread co-seismic ground failures, like lateral spreading and liquefaction [52], including the Mann earthquake (Mw 5.6), the Tripura earthquake (Mw 5.6) [53], and the Sonitpur earthquake (Mw 6.0). The Himalayan foothills, i.e., the Arunachal Himalayas, are barely 20 km north of the area, where many perennial and ephemeral streams debouch into the plains and join the Brahmaputra River (Figure 1b), which flows through the imbricate thrust known as the Schuppen Belt. The area comprises Paleogene rocks of the Disang and Barail groups, lies SW of Dibrugarh The area is bounded by the NE–SW Disang–Haflong thrust in the east and the Naga thrust in the west [12] (Figure 1a; Table 1). The Po-Chu fault was responsible for the 1950 Great Assam earthquake and is located in the NE of Dibrugarh city along the Mishmi block (Figure 2).

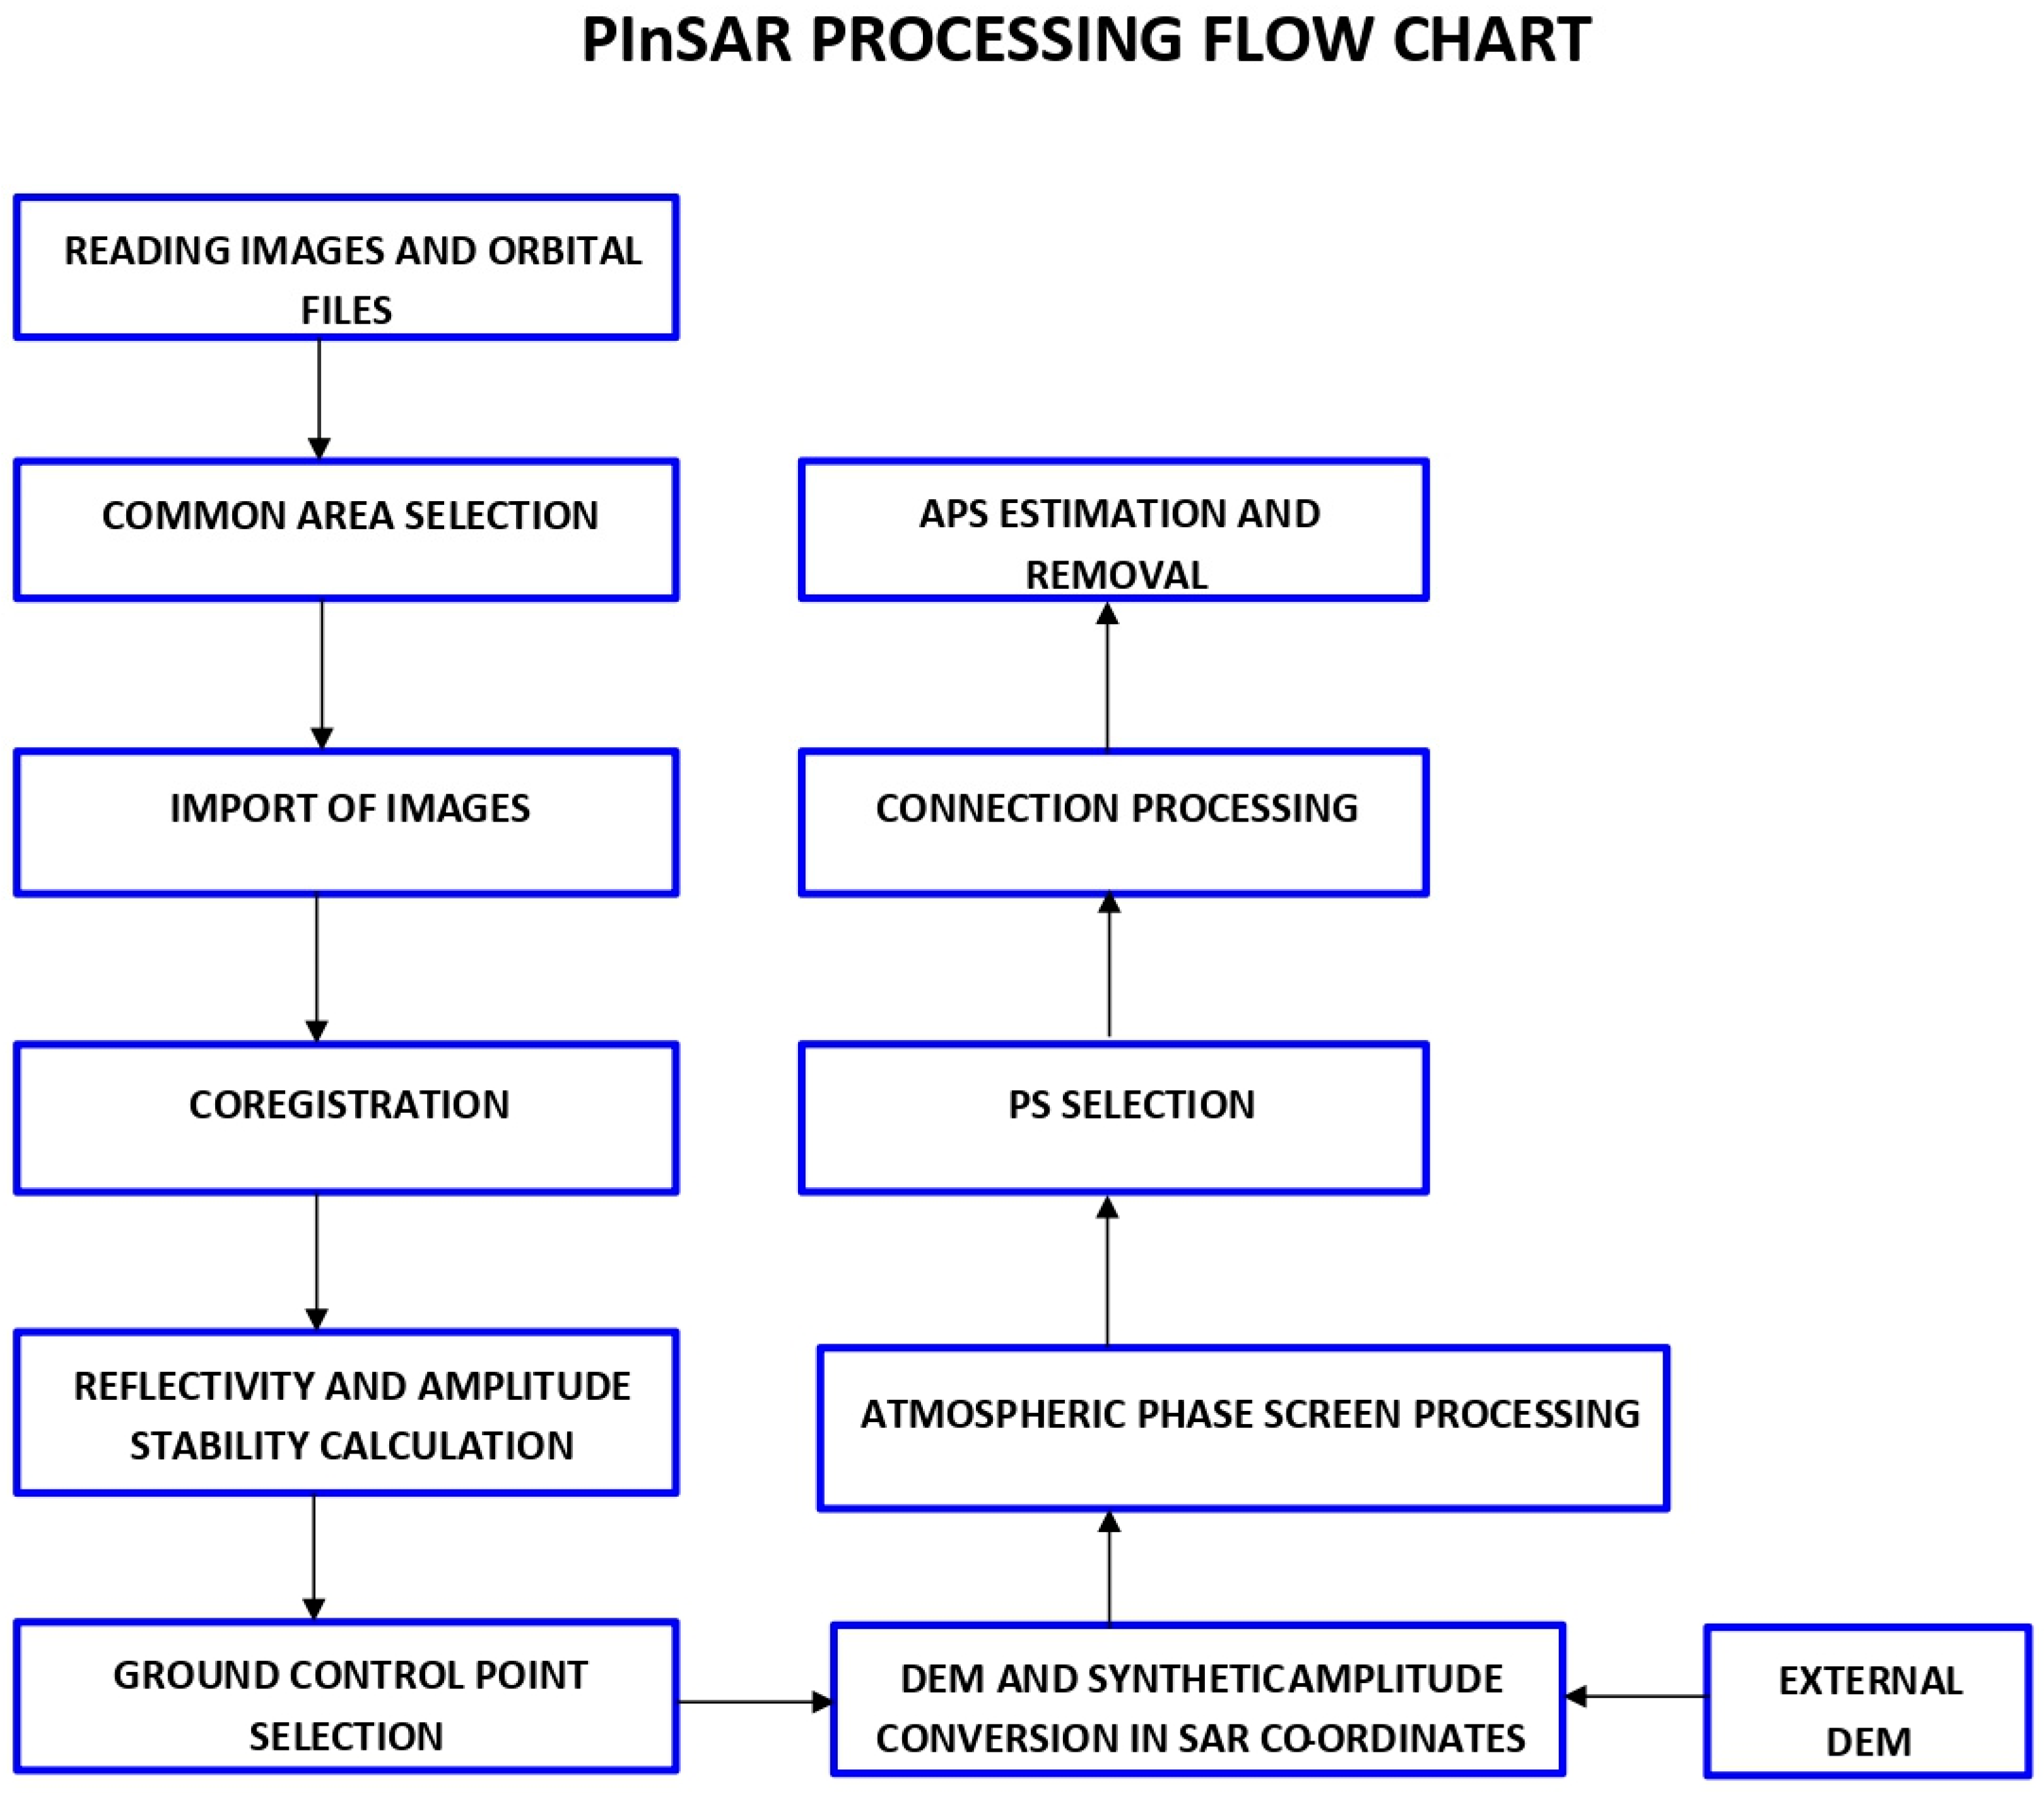
5. Materials and Methods

We applied the PSInSAR technique to measure subsidence around the Dibrugarh and Digboi areas. To achieve millimeter-level accuracy in the deformation rates with respect to height differences and correlation with the external USGS SRTM 1-arc second (30 m) resolution Digital Elevation Model (DEM), it becomes necessary through the PSInSAR approach to analyze radar data sets of longer timeframes in a continuous mode [31,54,55] (Figure 3).
Data from SENTINEL-1A C-band “Interferometric Wide (IW) swath”, with single and dual polarization VV and VV+VH, respectively, obtained in an ascending direction, were used to track ground subsidence between 2015 and 2022. The time series deformation was established using about 69 images with a repeat cycle of 12 days between 17 October 2015 to 6 February 2022 (Figure 4, Table 2). Different SAR sensors were chosen for various periods as they were the only sources of SAR data that were, at the time, accessible for the study area.
This study presents the results from the exploitation of a relevant new cloud platform, namely the Hybrid Pluggable Processing Pipeline (HyP3) system that integrates GAMMA software for the detection of ground displacement (f). HyP3 is a cloud-based system provided by the ASF of the Distributed Active Archive Centers (DAACs), which archives and distributes SAR data available to researchers of a variety of disciplines worldwide. It provides custom on-demand, higher-level SAR processing for users (g). ASF DAAC HyP3 2022 processes the acquired SENTINEL-1A data set using the hyp3_gamma plugin 5.1.4 running GAMMA online versions. Files were 40 m apart, with a projection to the WGS 84/UTM zone 46 N. To process and determine precise deformation rates, the PSInSAR approach necessitates the capture of several images. The master image was selected using ASF DAAC HyP3 2022, following the import of all the SAR images and considering the lack of severe weather (such as moisture or air turbulence) throughout the data acquisition (Figure 3).
To choose the ideal pair for interferometry, “the baseline estimation and coherence for the SENTINEL-1A” data set was developed. For the phase information analysis, only the pairings with coherence values greater than 0.6 were kept, as these are better for PSInSAR applications and ideal baselines. Figure 4 shows the baseline graph for the SENTINEL-1A data set. Using the 1900 tie point, all of the images that correspond to the master photos have been co-registered [54]. The images do not show very good coherence because these data sets are C-band. The “Atmospheric phase screening (APS)” is estimated and corrected to increase coherence and provide precise deformation rates (Figure 3).
In the current study, we examined radar data from the year 2015 to 2022. To maintain the coherence of the data set, the “Single Look Complexes (SLC)” images were used after carefully examining the distribution of the temporal baseline [7,55,56]. The one arc–second DEM was used for the production of interferogram and to eliminate the topographic phase correction (Figure 3). The tool hyp3_ gamma, plugin version, as described in [2,22,23], was used to process the SLC data set (Figure 3). The detailed method related to the PSInSAR technique was adopted from Dumka et al. [6] and is given in the supplementary document.

6. Result and Interpretation

The fringes in the interferogram are represented by a progression of color cycles, reflecting shifts in the earth’s surface throughout the period through a 3600 or 2π cycle. According to interferometry, the positive and negative values for SENTINEL 1A data represent, respectively, positive LOS values that represent deformation towards the satellite, while respective negative LOS values represent a deformation away from the satellite. The reducing trend (+ve value) of baseline length between the sensor and the ground control point indicates terrain uplift, whereas the increasing values between the same points reflect the subsidence (−ve value). Based on a total of 24,820 PS points, the PSInSAR results show a cumulative LoS displacement of up to 8 mm with one sigma uncertainty. The research area’s projected annual cumulative subsidence is 5 mm. The Digboi region in the research area demonstrates the most subsidence because of the overexploitation of oil wells and hydrocarbon in the area. While a mean surface deformation of less than 24 mm/yr has been recorded in the Dibrugarh region during the 2015 calendar year. A trend of increasing velocities (from 16 to 24 mm/yr) has been observed toward the southern portion of the study area. Our results suggest that ~75% of the total area is deforming at a rate of ~5 mm/yr (Figure 5, Figure 6, Figure 7 and Figure 8). A detailed interpretation of the computed velocity anomalies is provided in the proceeding sections.

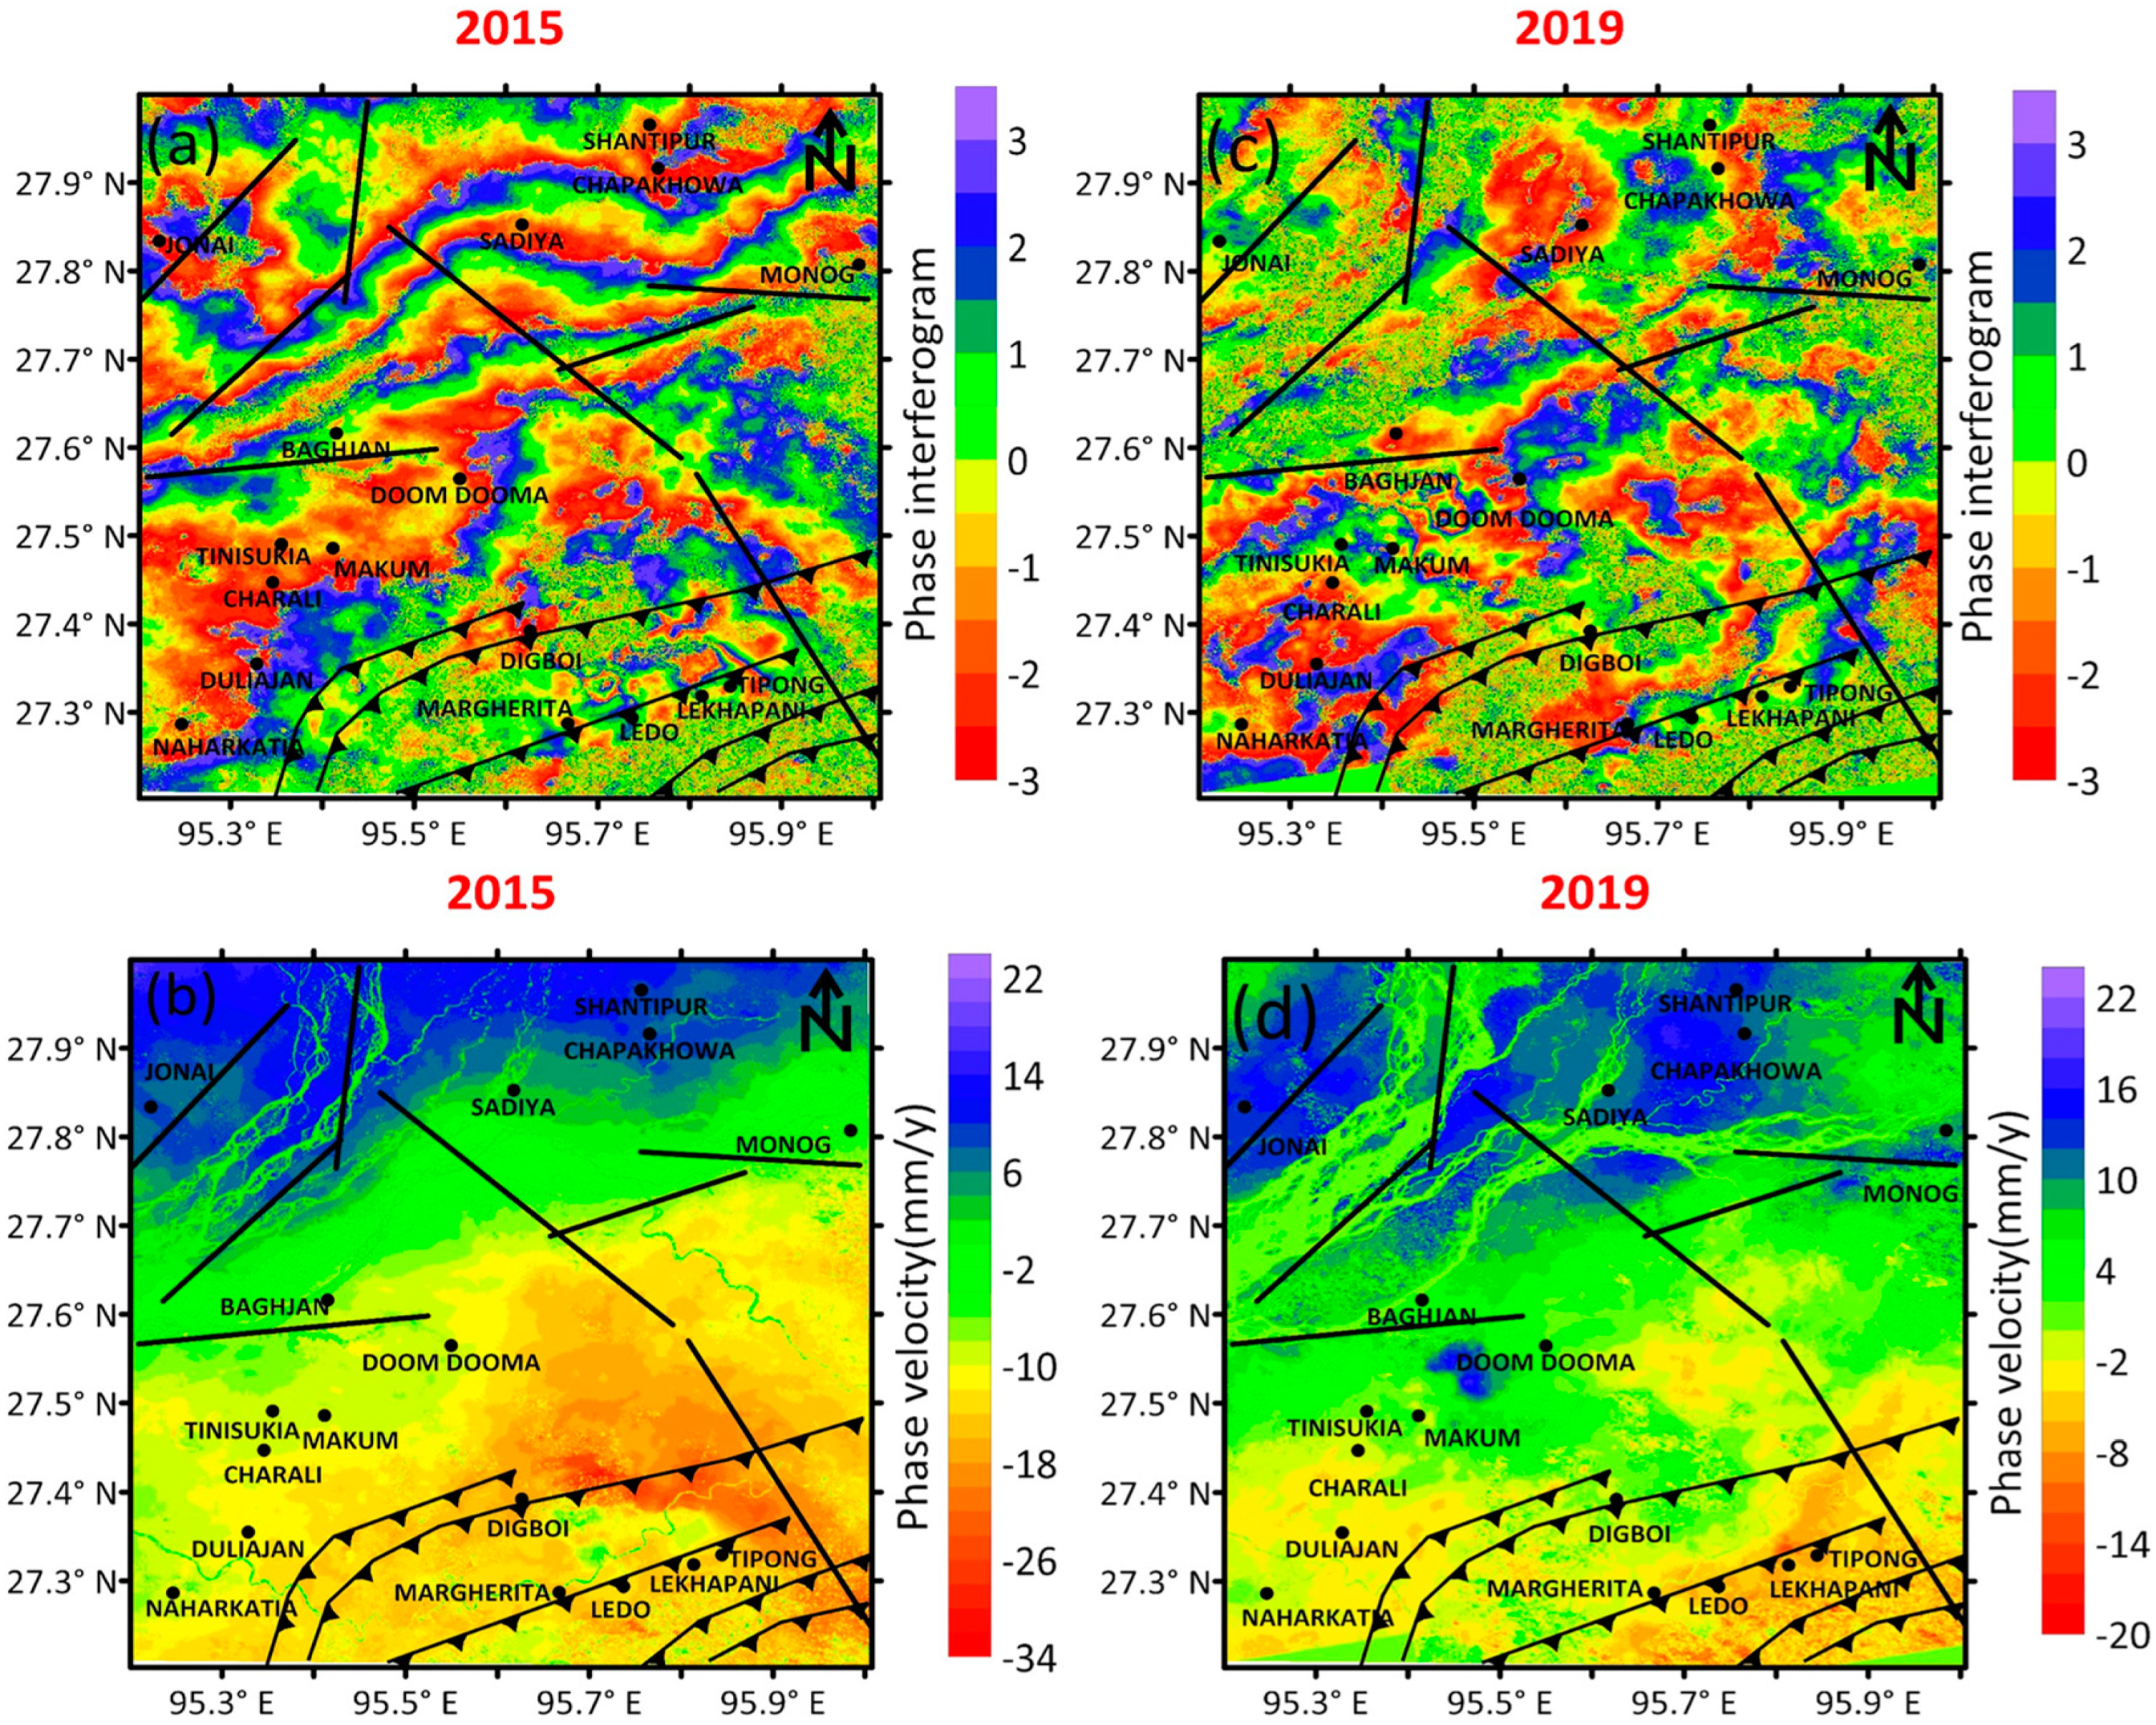
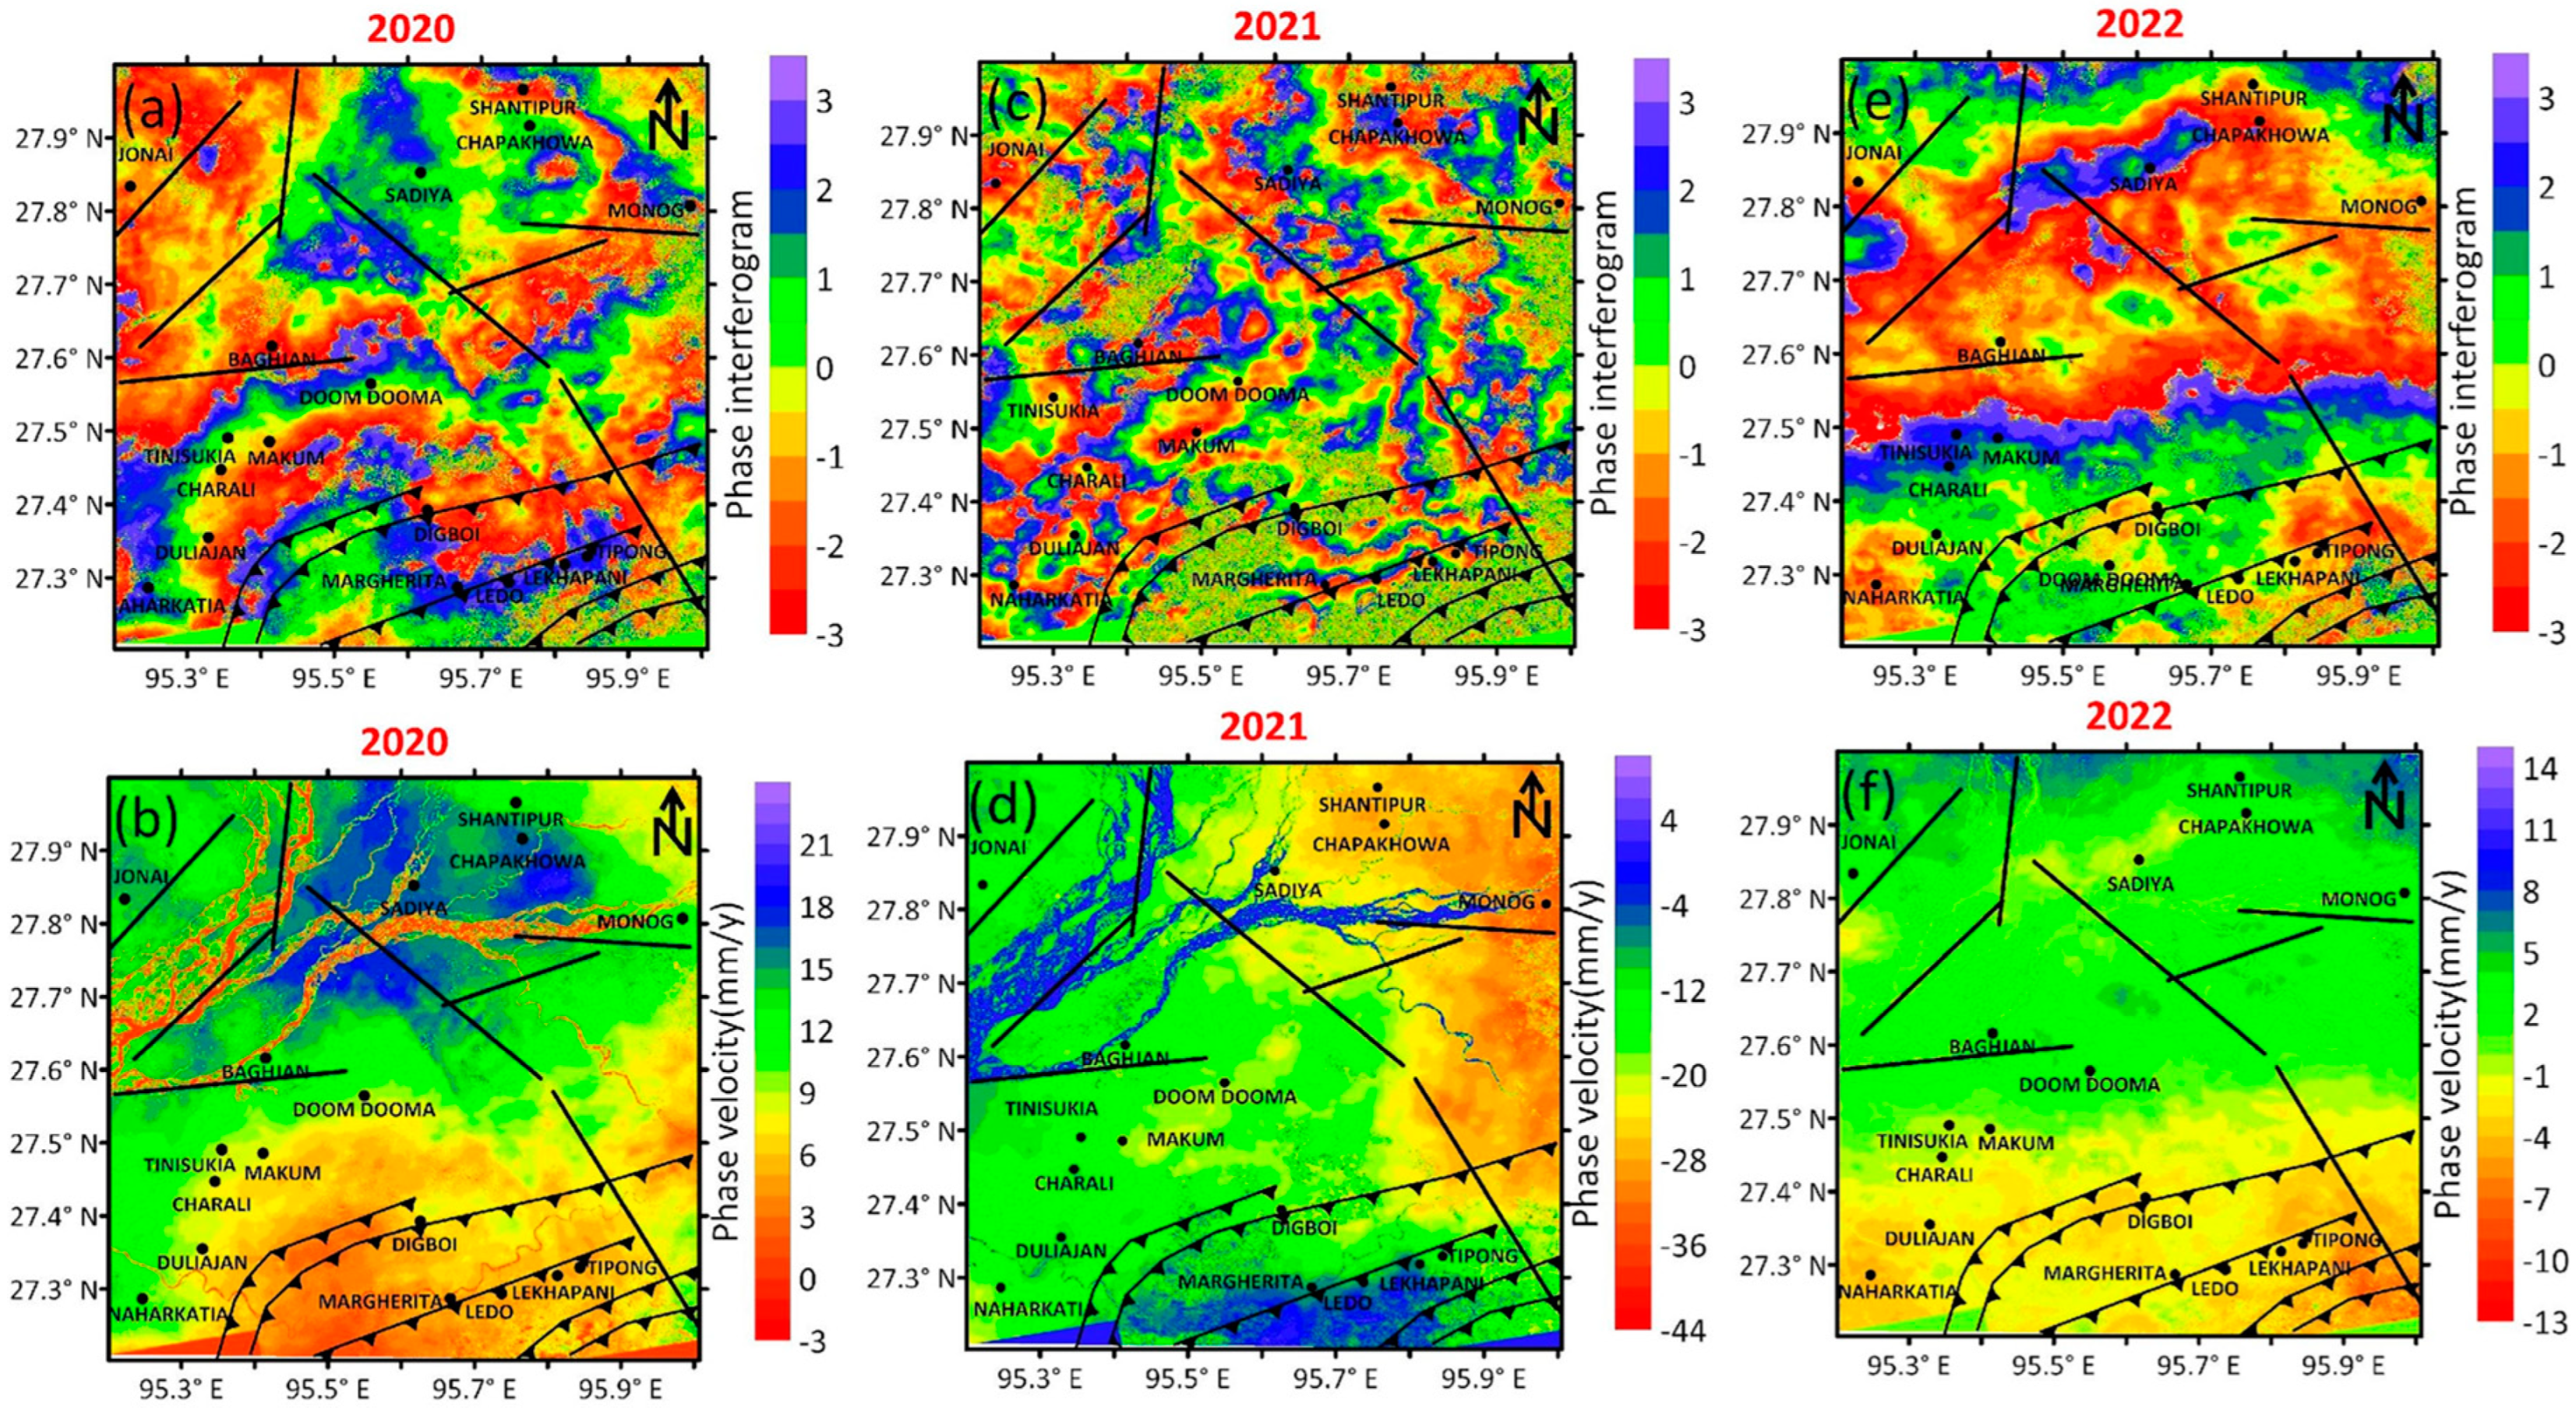
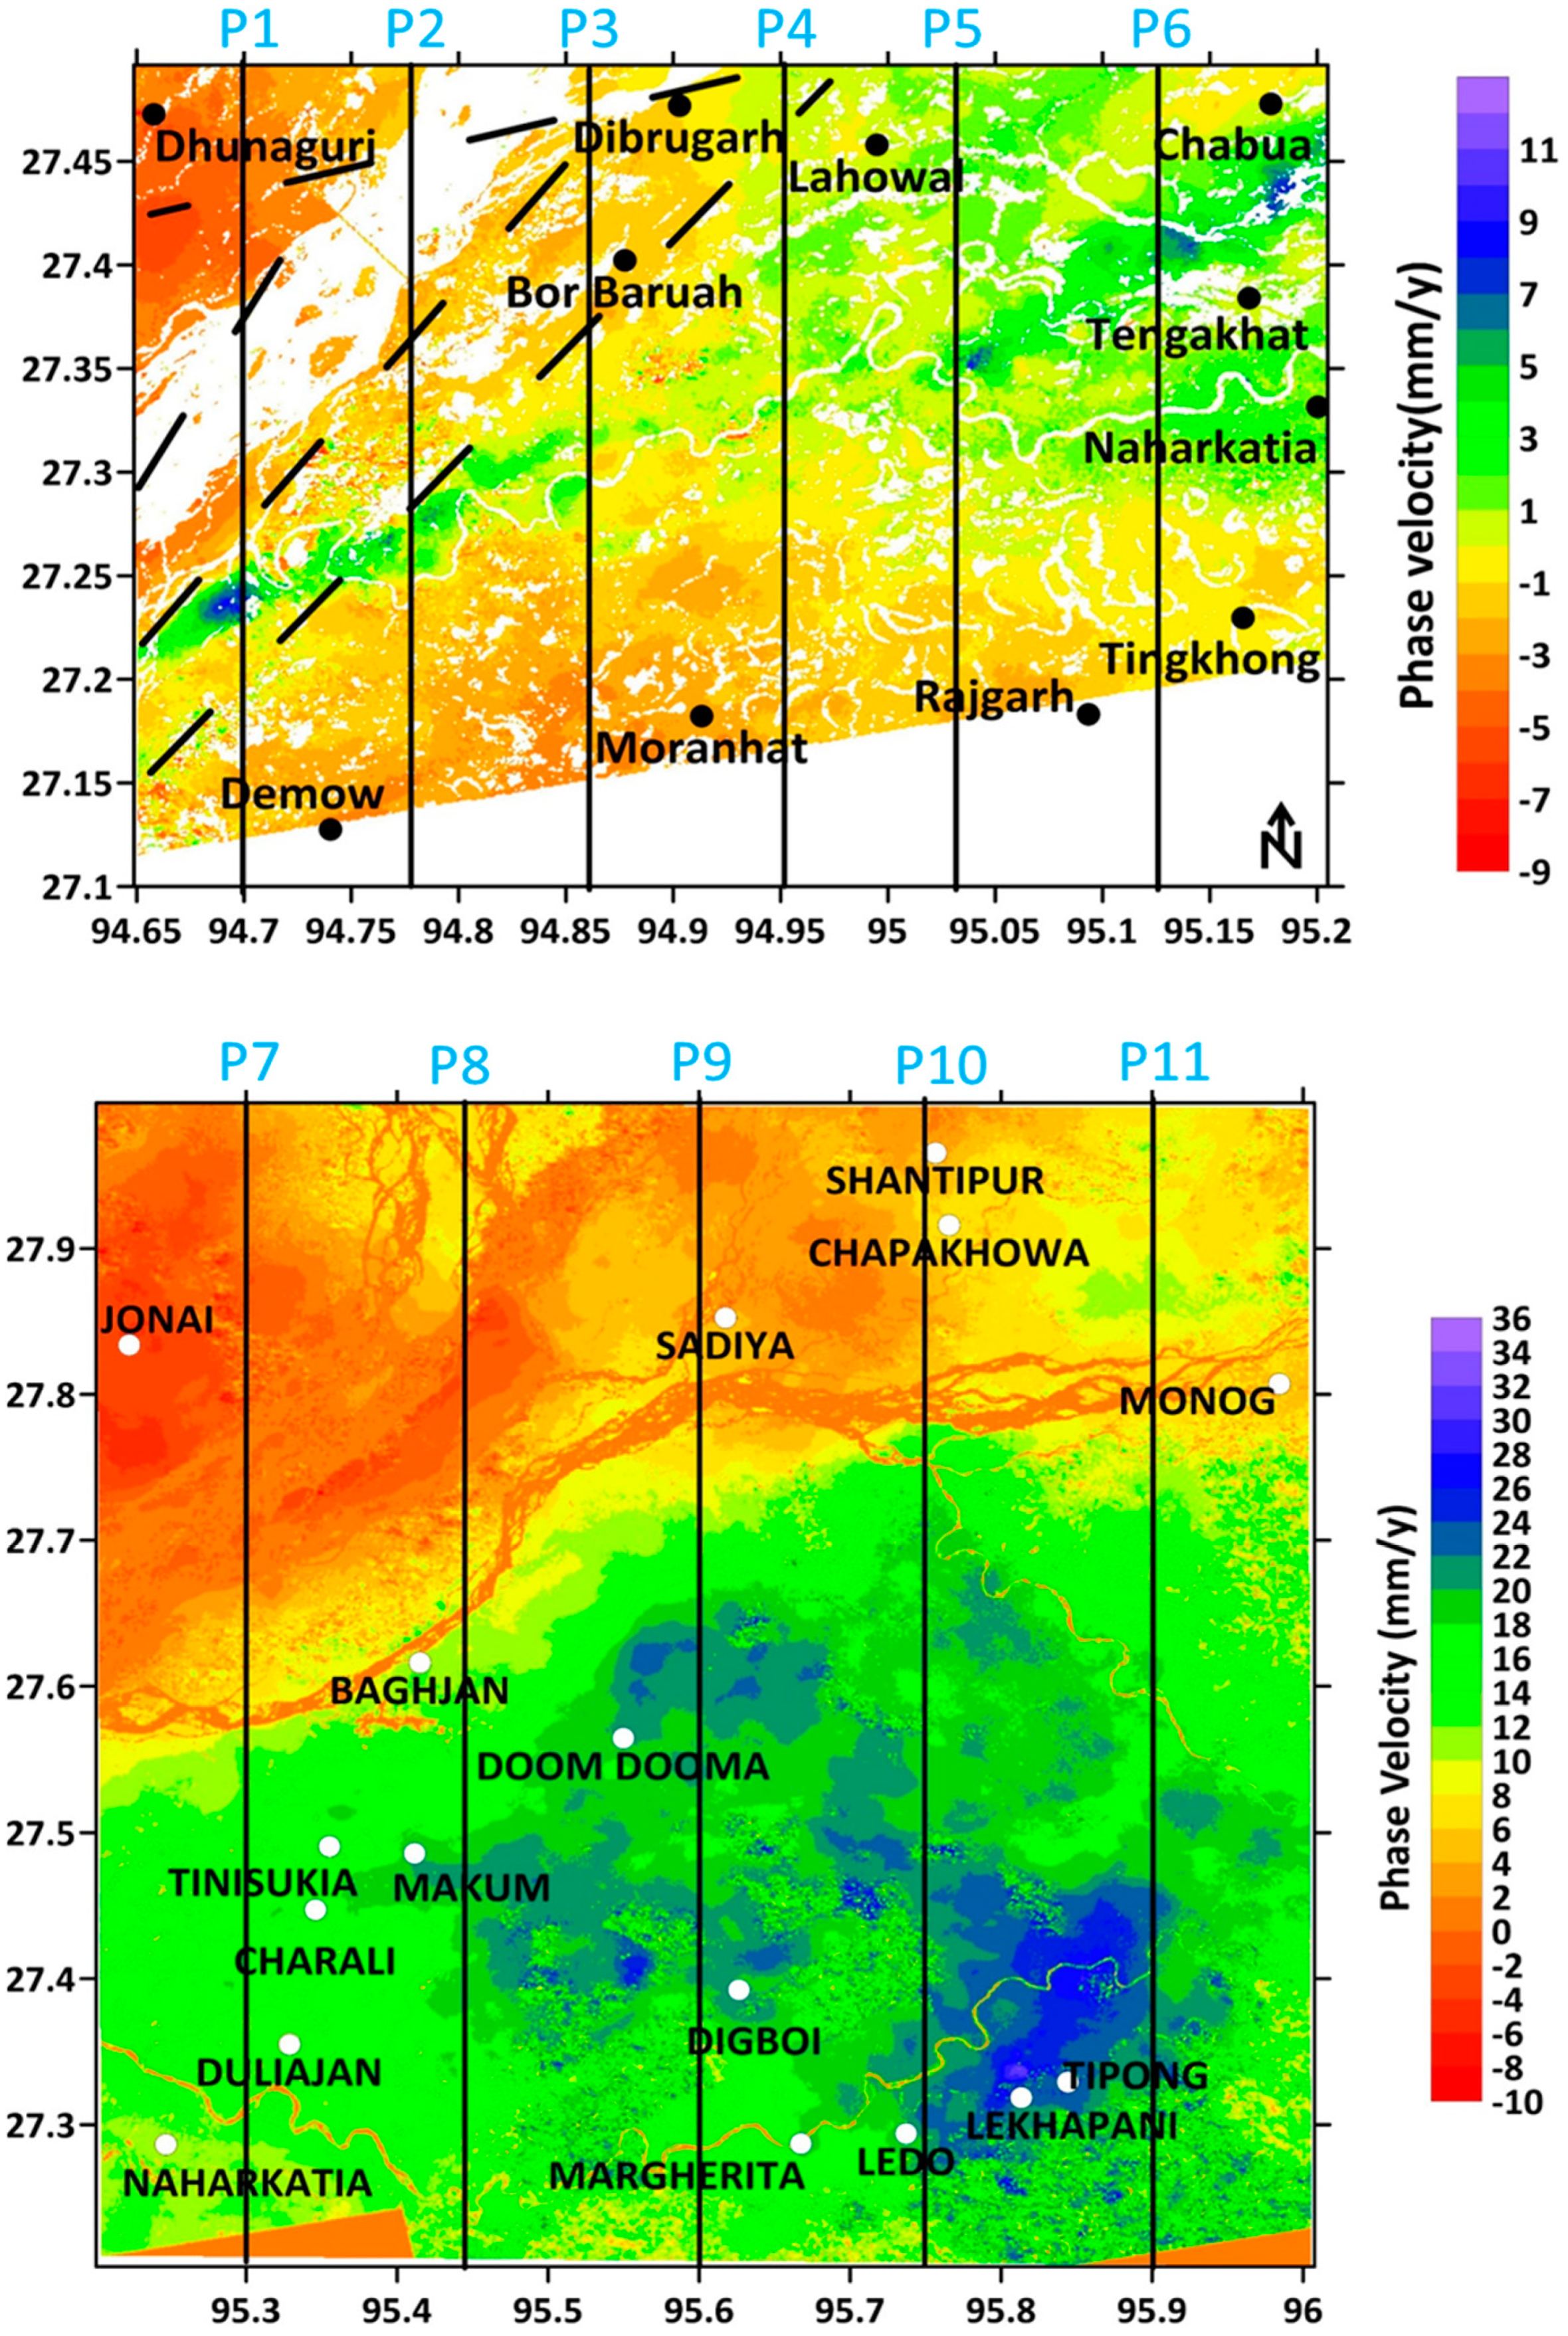
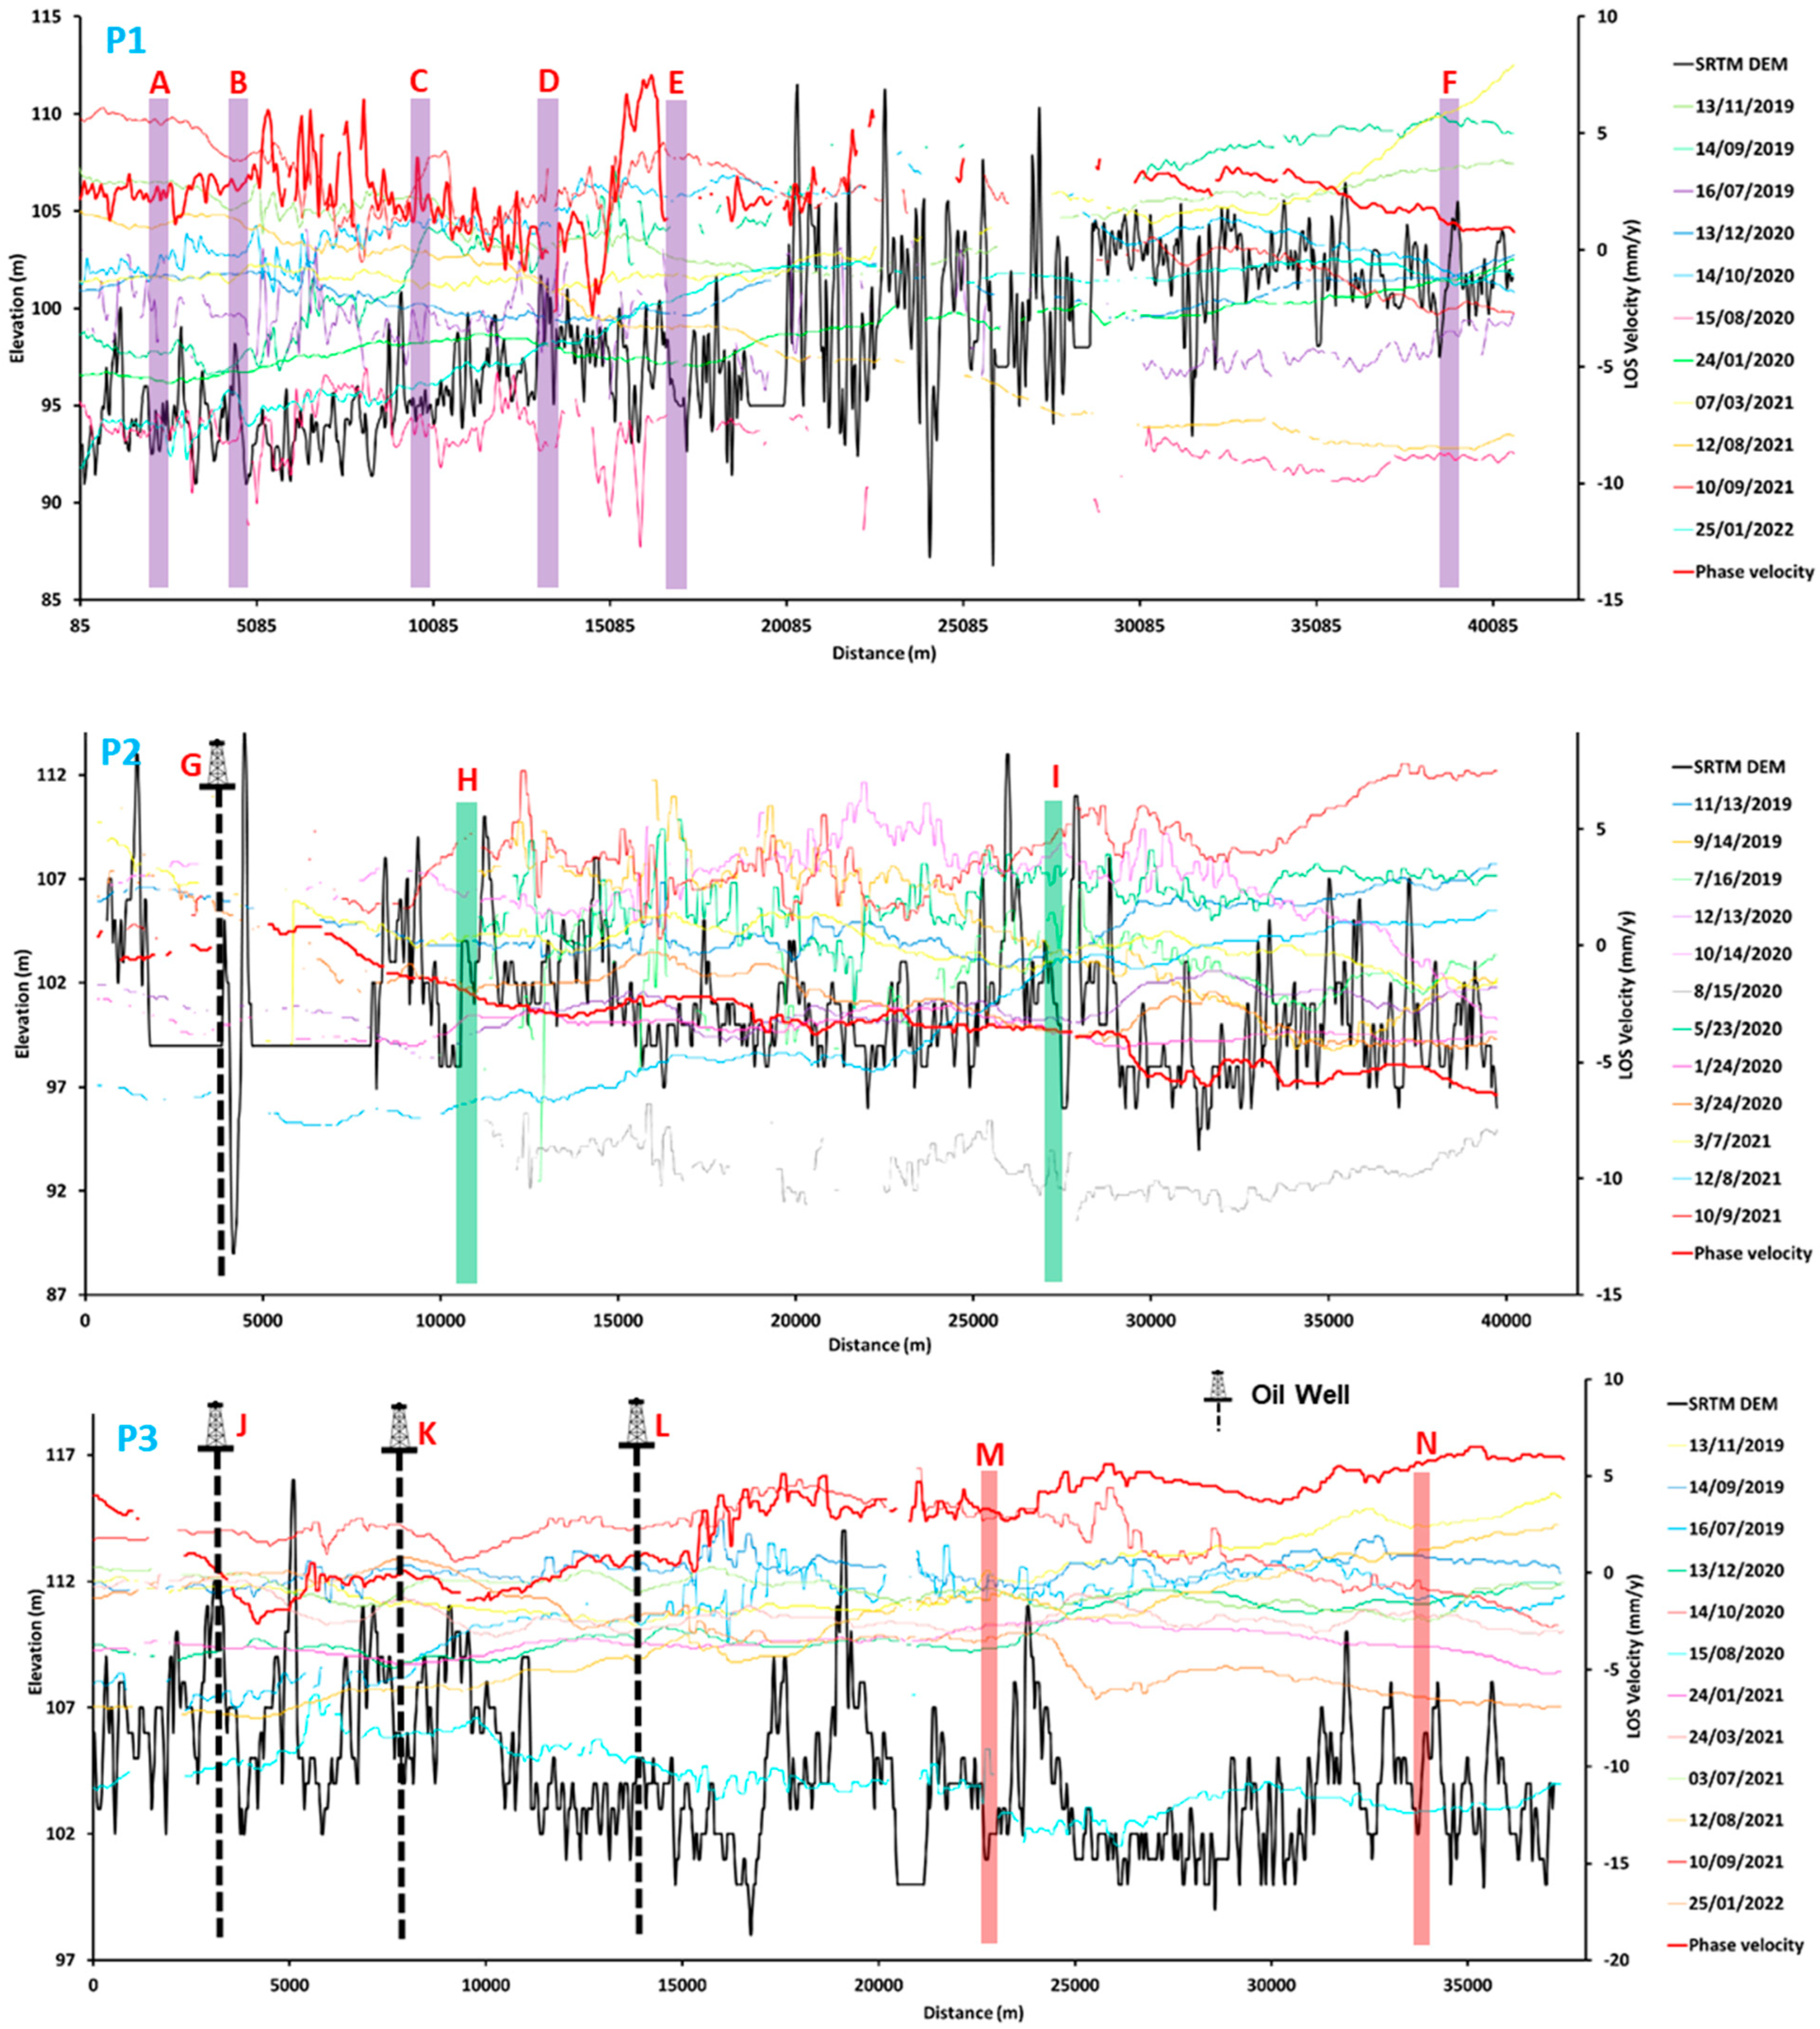
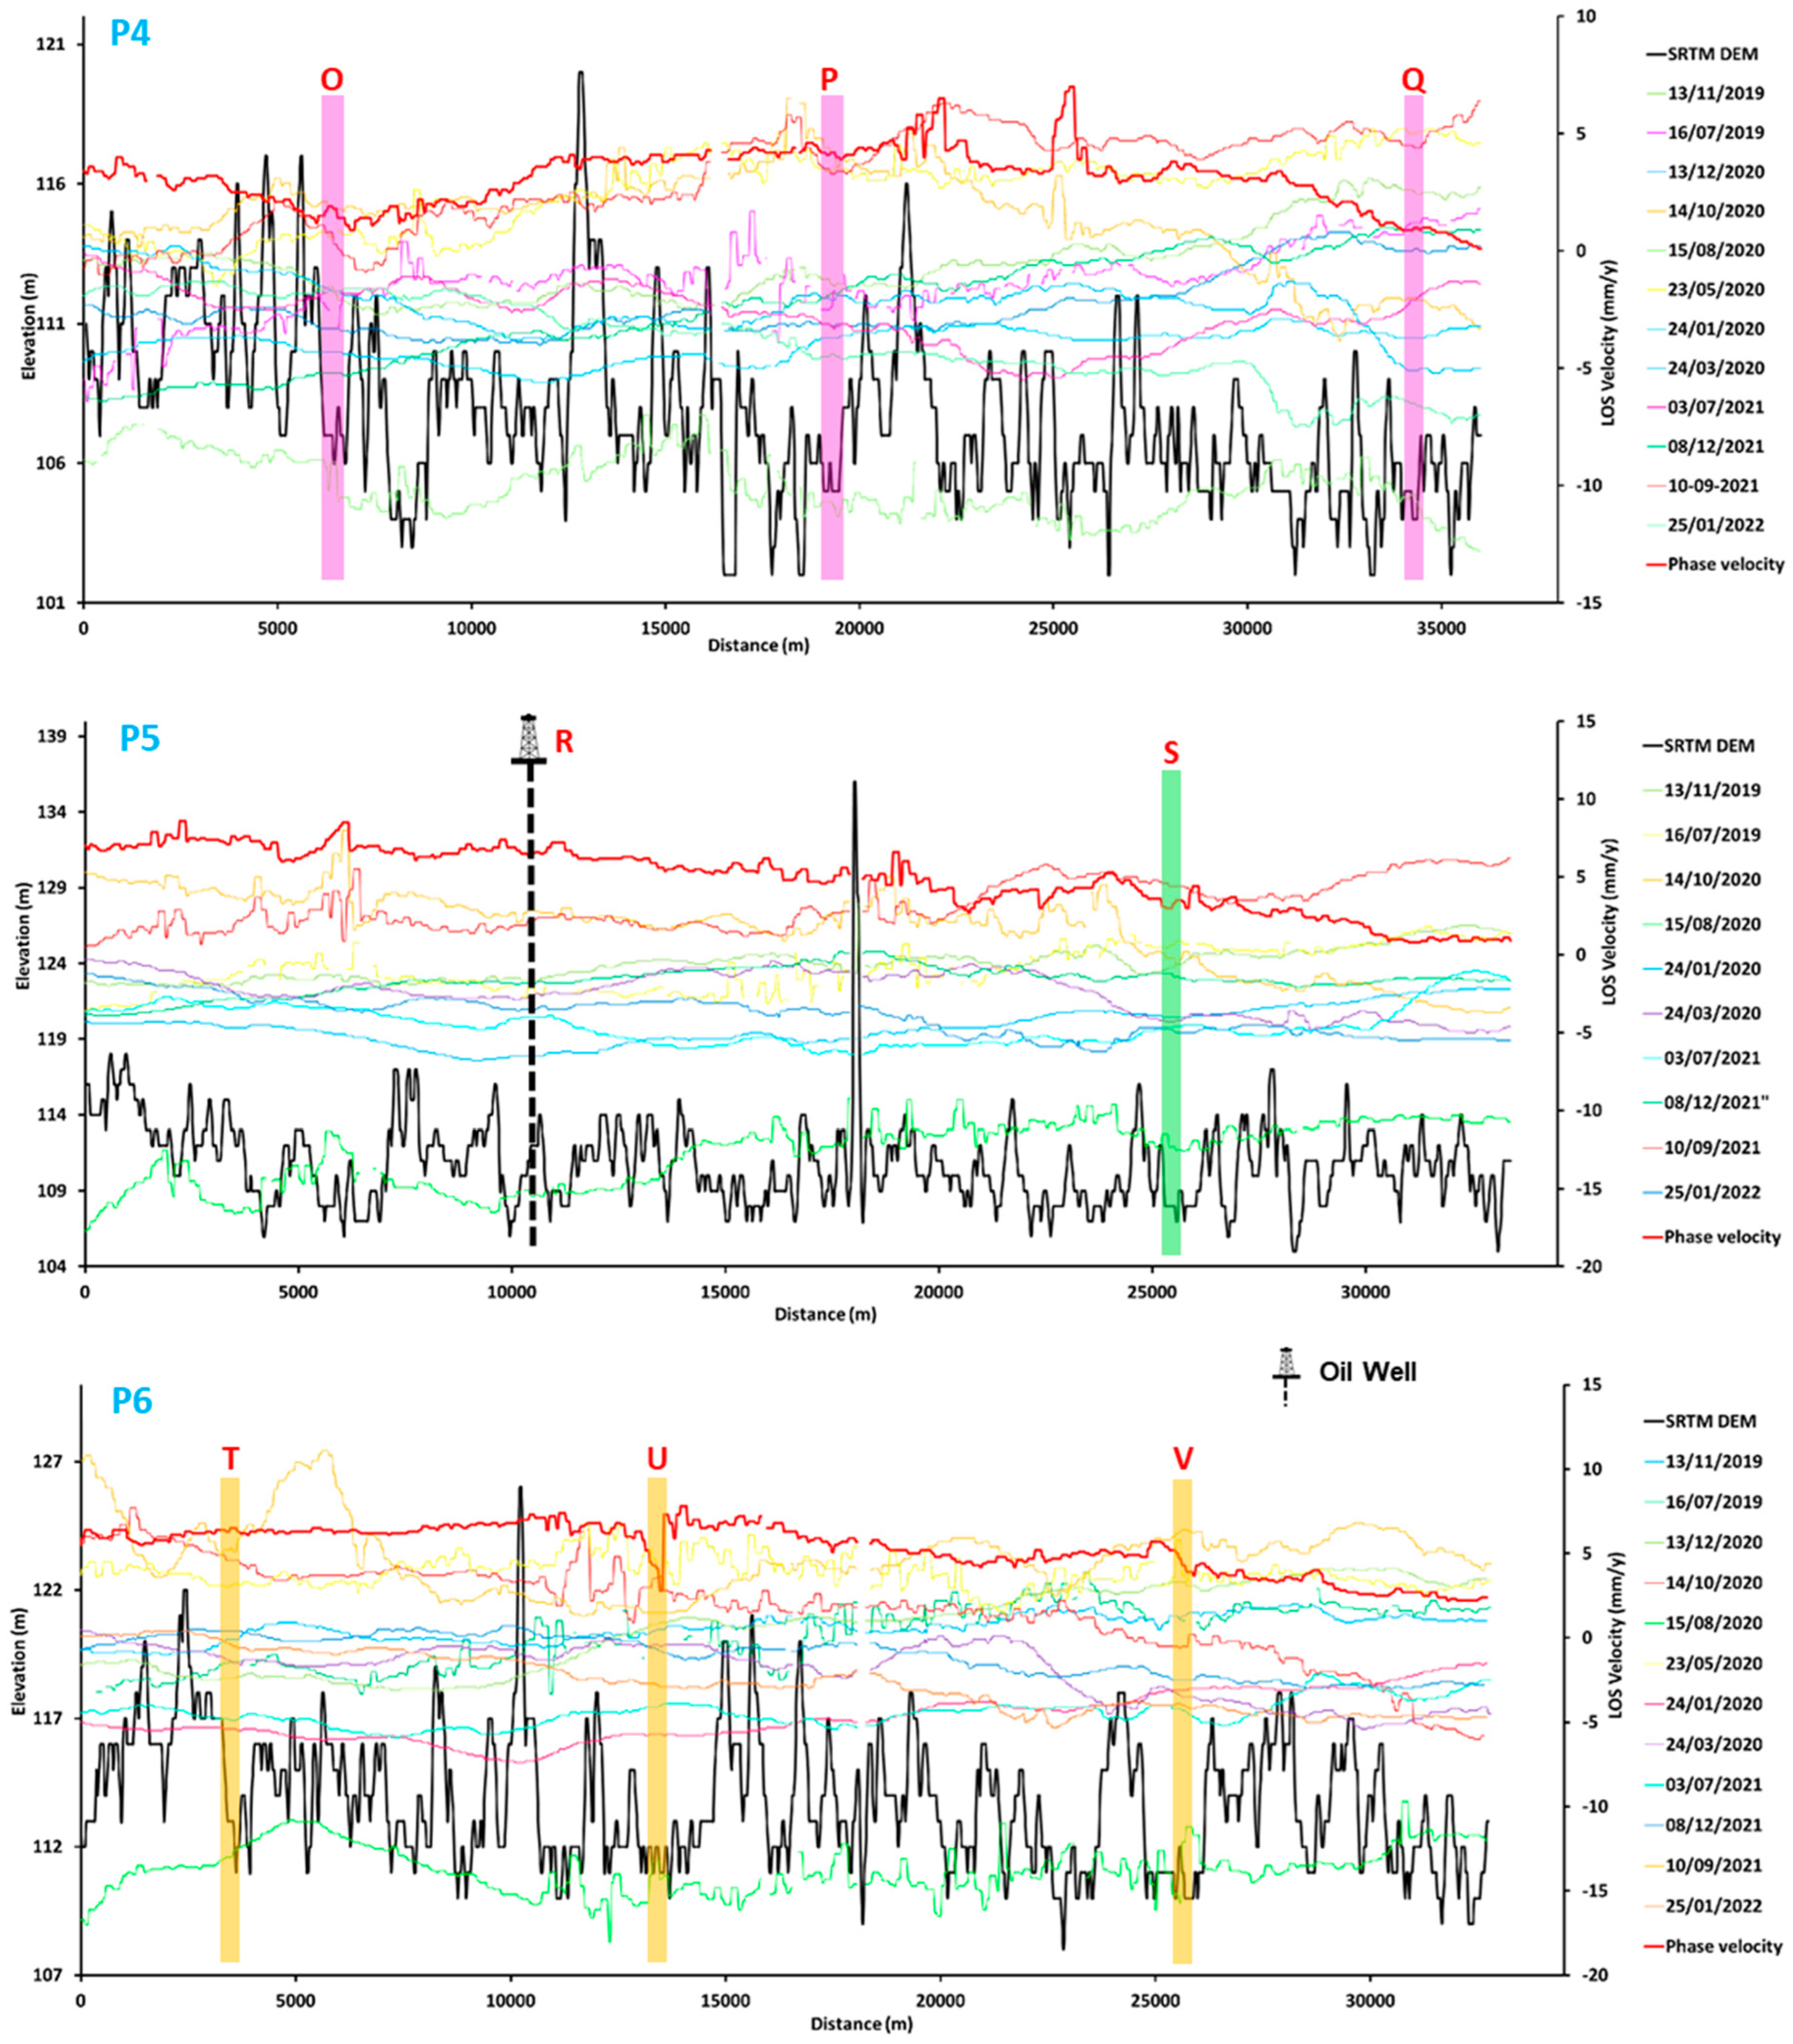
6.1. PSInSAR Velocities of the Digboi Area

For the time frame of 17 October 2015 to 25 January 2022, the cumulative displacement time series (TS) was established. The results of PSInSAR are shown in Figure 5 and Figure 6 as collective dislodgment in LoS over a period of more than a month. The maximum mean upliftment and subsidence are observed at around 25 mm and −44 mm, respectively, during the aforementioned period (Figure 5 and Figure 6).
It can also be observed that the PSInSAR velocities and displacement gradually increase with time. Different types of movements on the ground can be observed and identified as unique patterns such as (a) upliftment to the north of the Digboi region, Doom-Dooma, Sadiya, and Chapakhowa regions; (b) subsidence observed in and around the Digboi, Margherita, Duliajan, Naharkatia regions; and (c) a notable amount of ground sinking observed toward the southern portion of the study area that may be caused by the depletion of groundwater as well as the extraction of hydrocarbon from drilled wells. Furthermore, the amount of ground deformation is also enhanced by the hidden subsurface fault pattern. Additionally, several NE–SW, E–W, and NW–SE oriented velocity zones are also identified. These linearly oriented velocity trends are likened to the prevailing fault pattern. The computed results of PSInSAR for the period between 2015 and 2019 show a deformation of ~±22 mm/yr over a period of 4 years (Figure 5a–d). Similarly, the mean surface deformation of ~±17 mm/yr is calculated for 2020 and of ~±20 mm/yr for 2021 (Figure 6a–d). However, the mean surface deformation gradually was reduced by ~±13 mm/yr during 2022 (Figure 6e,f). Our estimates suggest that approximately 75% of the total area is deforming at a mean velocity of 5 mm/yr, only 25% of the area is deforming at a rate of ±10 mm to ±22 mm/yr.

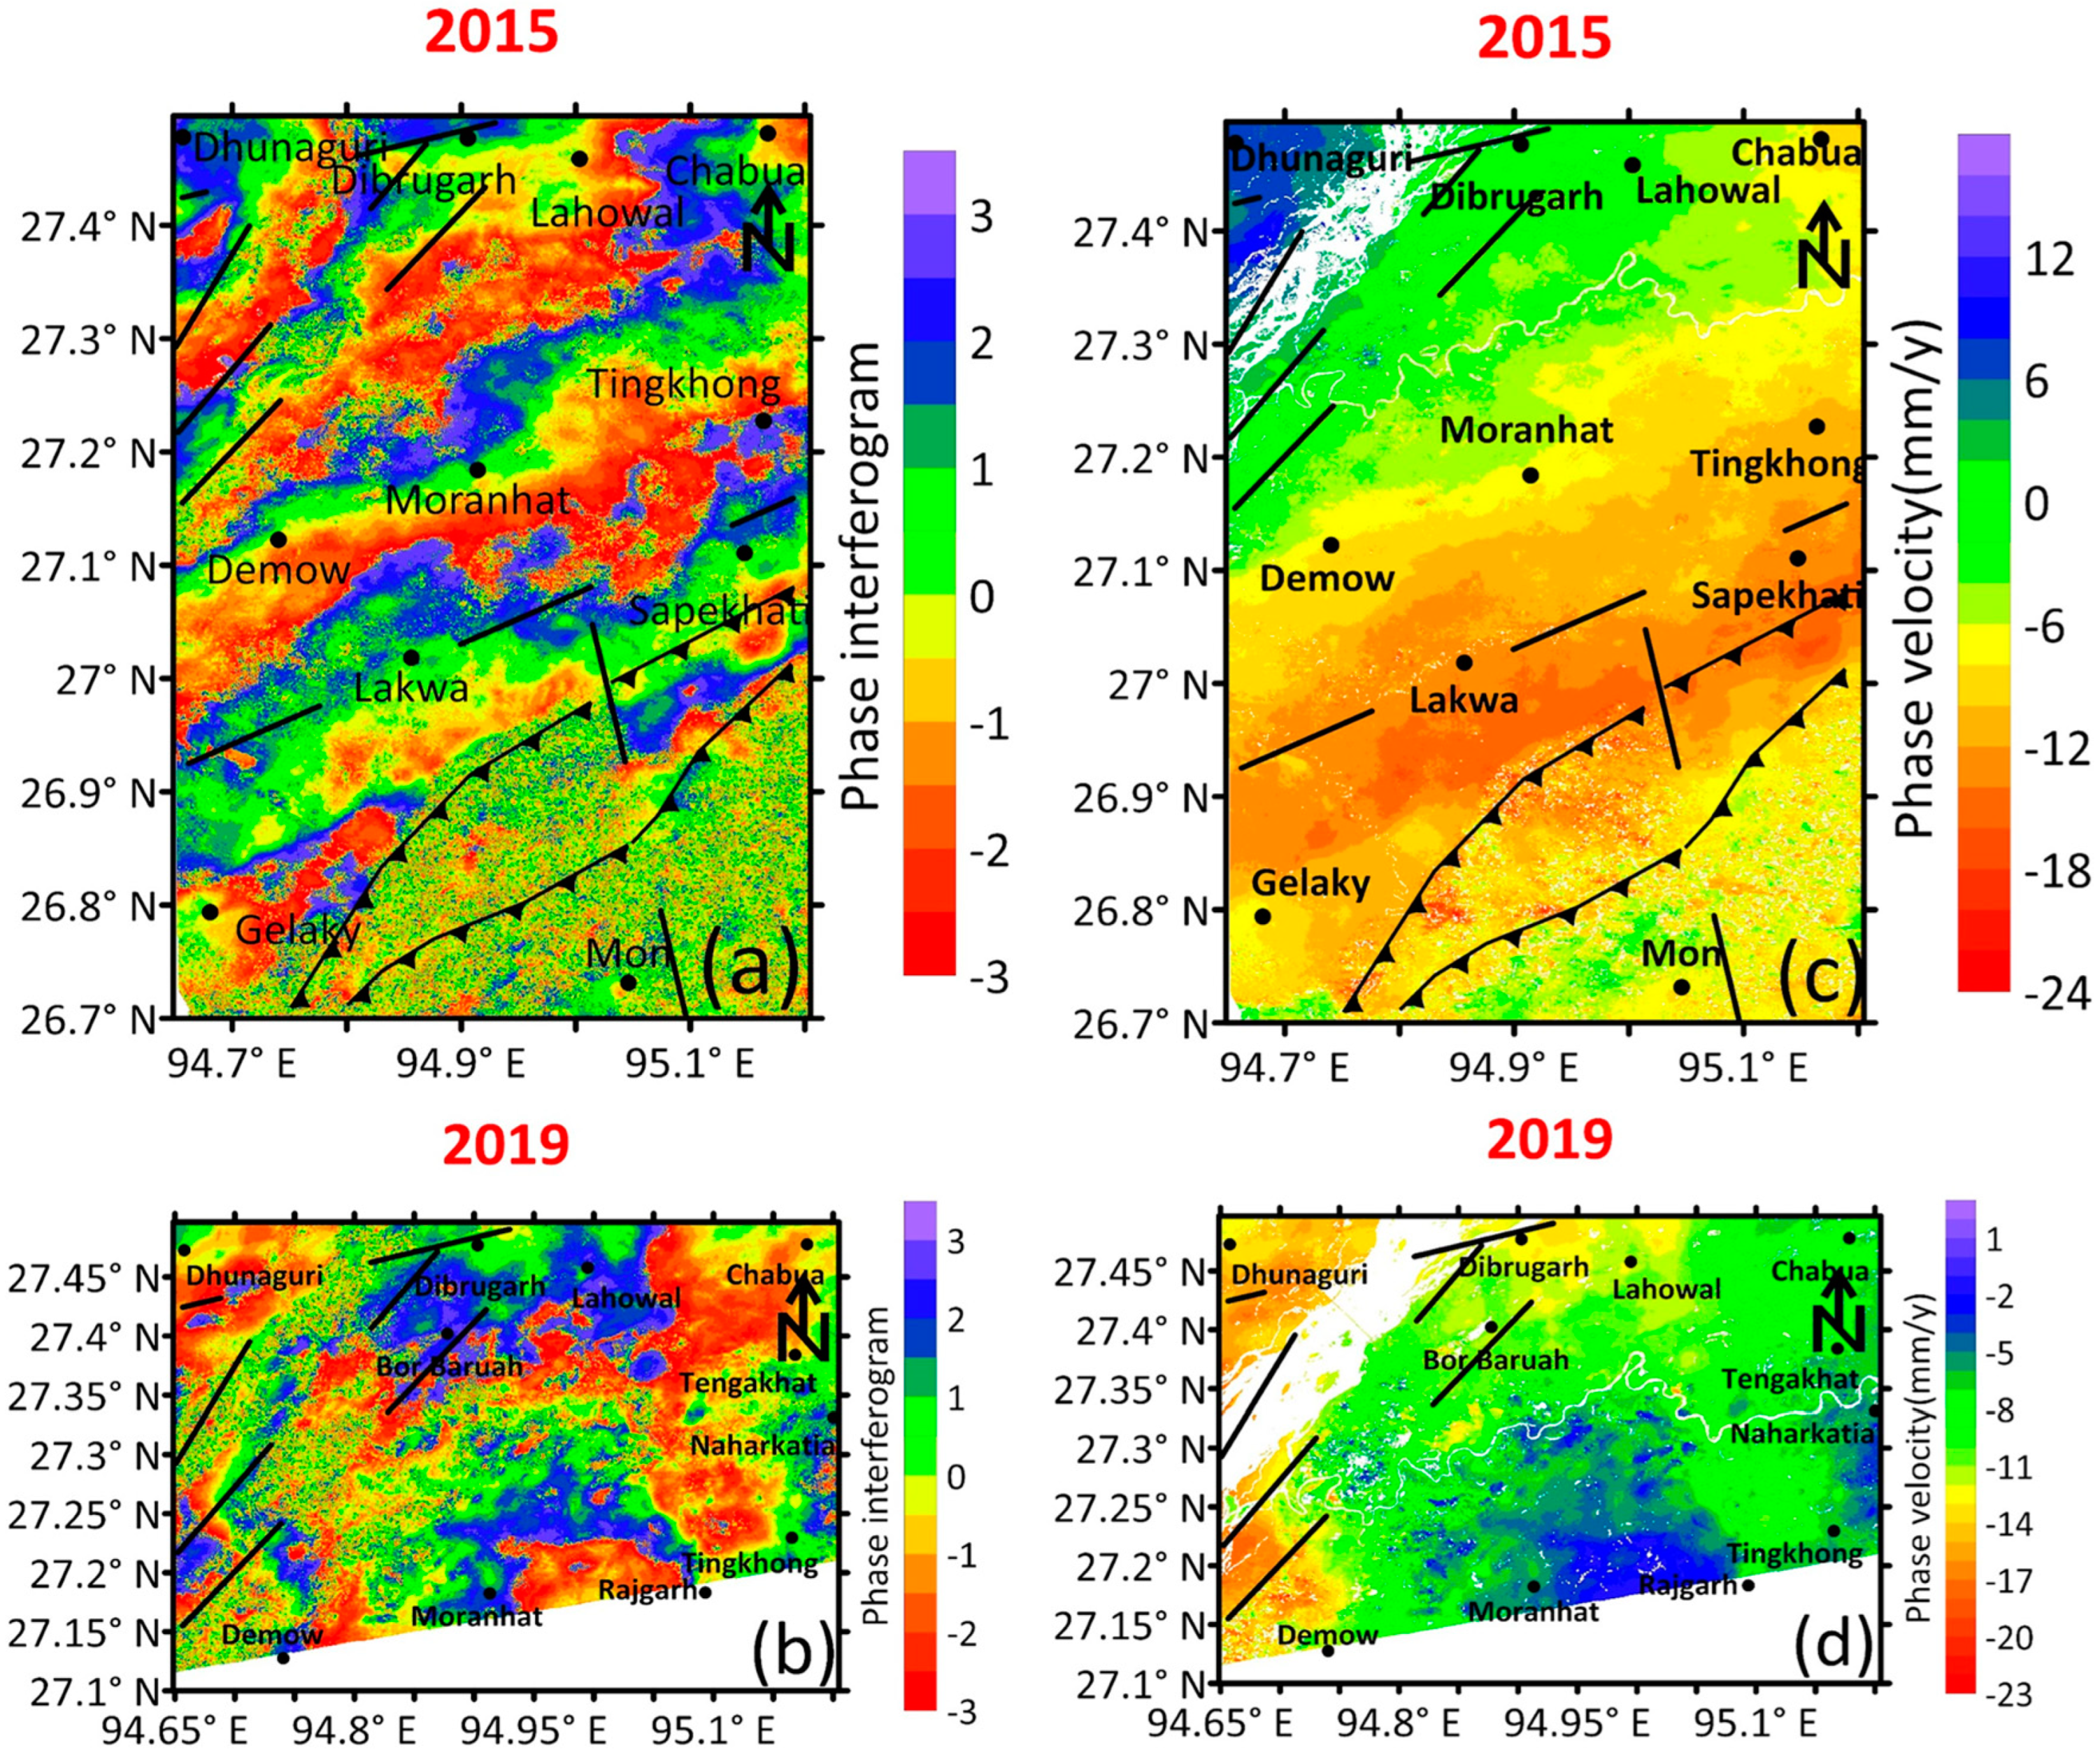
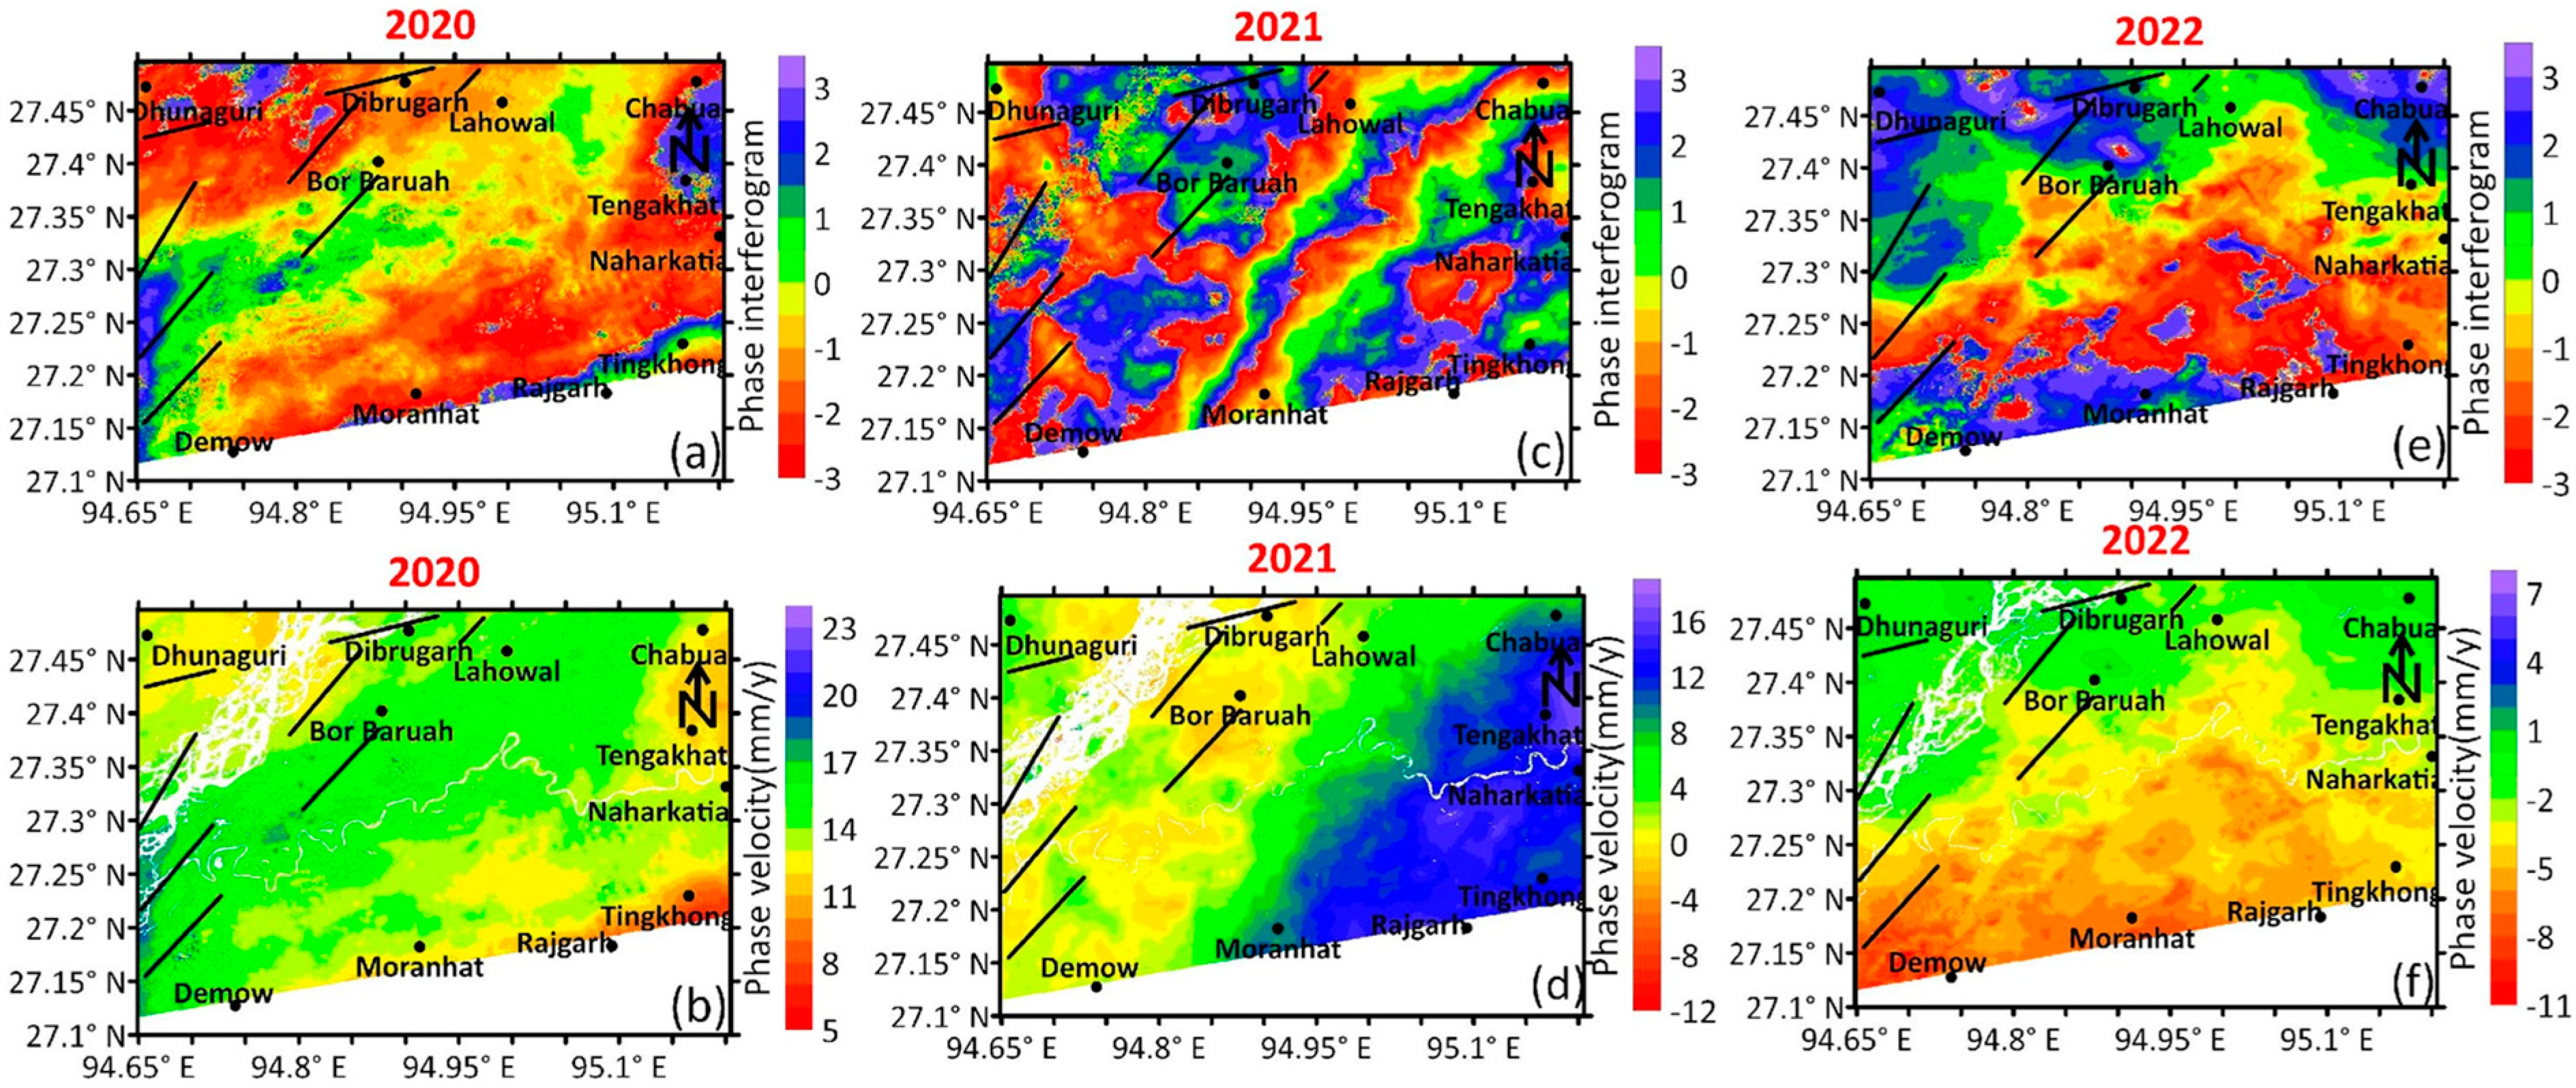
6.2. PSInSAR Velocities of the Dibrugarh Area

The mean displacement TS measurements were carried out for the period between 17 October 2015, and 7 November 2022 (Figure 7a) for the Dibrugarh area. According to the calculated data, there was a 15 mm uplift and 24 mm of ground subsidence in the year 2015, which decreased somewhat by 2 mm in 2019. (Figure 7b). In and around the Dibrugarh area, the velocities rise by 7mm between the years 2019 and 2020 (Figure 8a,b). Between 2020 and 2022, a very small amount of uplift was seen, although a rate of ground subsidence increased by 4 to 5 mm (Figure 8e,f).
More specifically, three different variations in deformation patterns have been identified in the surrounding regions of Dibrugarh: (a) uplift towards the north of the Dibrugarh region in Sapekhati and Lakwa regions, (b) subsidence in and around the Dibrugarh region and maximum subsidence in the NE direction of Dibrugarh region, and (c) a significant amount of subsidence towards the southern part of the study area caused by the sequential reactivation of faults and the depletion of the water table in the area. For the year of 2015, a mean surface deformation of 24 mm/yr was noted. The deformation pattern increases (from 16 to 24 mm/yr) towards the southern half of the studied region. Additionally, for the year 2019, a mean surface deformation of 23 mm/yr was detected (Figure 7). However, the rate of deformation significantly decreased to 10 mm/yr for the period between 2020 to 2022 (Figure 8a,b). An average ground deformation of 12mm/yr for 2021 (Figure 8c,d) and of approximately ~±11 mm/yr for 2022 (Figure 8e,f) was detected. These abnormal variations in rates could be caused by anthropogenic activities in the area.

7. Discussion

Between the Assam-Arakan thrust belt and the eastern Himalayan foothills is the upper Assam, a composite foreland basin. The Mishimi Hills block terminates the basin in the northeast, while the Shillong plateau basement uplift partially disrupts it to the southwest [57]. Geophysical surveys carried out to explore oil and gas have revealed the regional structure of the upper Assam foreland basin. The generalized stratigraphy of the Bhramputra alluvial plain and subsurface active structures of the area has been inferred from seismic surveys. It is further assumed that the current Brahmaputra River runs and slopes towards the Himalayan foothills in the north and Naga Hills to the south, which has been inferred based on stratigraphic and structural setup (Figure 9).
The faults that cut through this arch generally strike NE–SW or ENE–WSW, parallel to the NT and the fault pattern seen in the Mikir Hills metamorphic complex. The differential movement along these faults and the anomalies in the basement surfaces, which are determined through gravity surveys, determine the structural pattern in the sedimentary layer [57,58]. Studies suggest that ground deformation (subsidence) is a major factor in rapidly growing cities developed within the alluvial plains [20,59]. The consequences of the over-extraction of groundwater have previously been reported in Mexico, Jakarta, Tehran, China, and India [60]. In the current study, we report a similar pattern of ground deformation in the Brahmaputra alluvial plain. The authors of [20,59,60] implemented SENTINEL 1A to estimate the ground subsidence associated with the depletion of groundwater in the metropolitan cities of the Sabarmati and Ganga alluvial plains.
The Digboi and adjoining regions of eastern India show maximum ground subsidence that can be linked with several factors, such as (a) deformation caused by a series of normal faults; (b) the over-extraction of groundwater and natural resources; and (c) several forms of anthropogenic activities, leading to an increase in the subsidence in and around the Digboi region. This scenario is also well supported by the presence of the subsurface faults and the previous seismotectonic studies. The movement along hidden subsurface faults can also alter the ground surface and enhance ground subsidence/deformation, that may lead to several catastrophic disasters in the near future.
Five velocity profiles (P7–P11) in the Digboi region and six velocity profiles (P1–P6) in the Dibrugarh region were constructed to illustrate perpendicular strike variations in deformation and displacement in order to observe site-specific subsidence (Figure 10). Figure 10 depicts these profile lines, and Figure 11, Figure 12 and Figure 13 illustrates them visually. The profiles clearly show the gradual subsidence in those areas, where the over-extraction of groundwater primarily took place, and secondly, the vertical subsidence is caused by gravity collapse within the zone of vertical to near vertical faults, which are shown in Figure 9. In the Dibrugarh region, several N–S- and NE–SW-trending transverse faults are present, which causes subsidence as well as uplift in and around the region.
The N–S profiles P1, P2, and P3 in the Dibrugarh region clearly show that the maximum subsidence is ~10 mm/yr during the period between 2015 to 2022 data sets (Figure 11). The subsidence is caused by the uneven, faulted, and disturbed sub-surface lithology, which is well explained in velocity sections. However, profiles P4 and P5 show a subsidence of ~15 mm/yr due to the depletion of subsurface water level in and around the Naharkatia region. There are more anthropogenic activities causing the increase in the subsidence of the site-specific area. Based on the phase velocity changes in the Dibrugarh region the average uplift +11 mm/yr and average subsidence −9 mm/yr is estimated. In profiles P1 and P2, the maximum subsidence of ~5 mm/yr is observed in the Dhunaguri, Konwar, Chakla Pathar, Dhemchi Gaon, and Silputa Gaon regions. Similarly, profiles P3 and P5 show that the Lengeri gaon area is subsiding at a rate of ~10 mm/yr (Figure 11 and Figure 12).
The N–S profiles P7 to P11 in the Digboi region clearly show that the subsidence is ~15 to 20 mm/y between the years 2015 and 2022 (Figure 13). However, the maximum subsidence observed along the profiles P10 and P11 is ~25 mm/yr (Figure 14). This trend of increasing ground subsidence in Digboi, Ledo, Lekhapani, and Tipong is linked with the depletion of the groundwater table (Figure 13).
Where the average velocity displacement in the Digboi region is observed (+28 mm/yr to −11 mm/yr). Similarly, profile P7 shows a higher rate (10 mm/yr) of ground subsidence in and around Naharkatia, Tinsukia. However, profiles P8 and P9 show that LOS velocity up to −15 mm/yr is caused by the over-extraction of groundwater (Figure 13). In profiles P10 and P11, a maximum subsidence of −20 to −25 mm/yr has been observed. However, Kakoni, Sunpura, Gargaon, and Bodo Gaon show maximum subsidence due to the presence of the subsurface faults and supplementary oil wells and coal seams (Figure 14). The SAR base velocities are well corroborated by the GPS studies carried out by Panda et al. [61] and Kothyari et al. [4]. These studies suggest the presence of oblique convergence in the NE part of the Indian plate [62,63]. The results of GPS convergence suggest that the Bhutan Himalayas are deforming at a rate of 15–16 mm/yr and 19–20 mm/yr in the eastern syntaxial belt [64,65].

8. Conclusions

The current study reveals that the ground subsidence in a part of the Brahmaputra alluvial plains is primarily caused by the over-exploitation of hydrocarbon and shallow groundwater. However, based on the observed results and their interpretation, the following conclusions can be drawn:
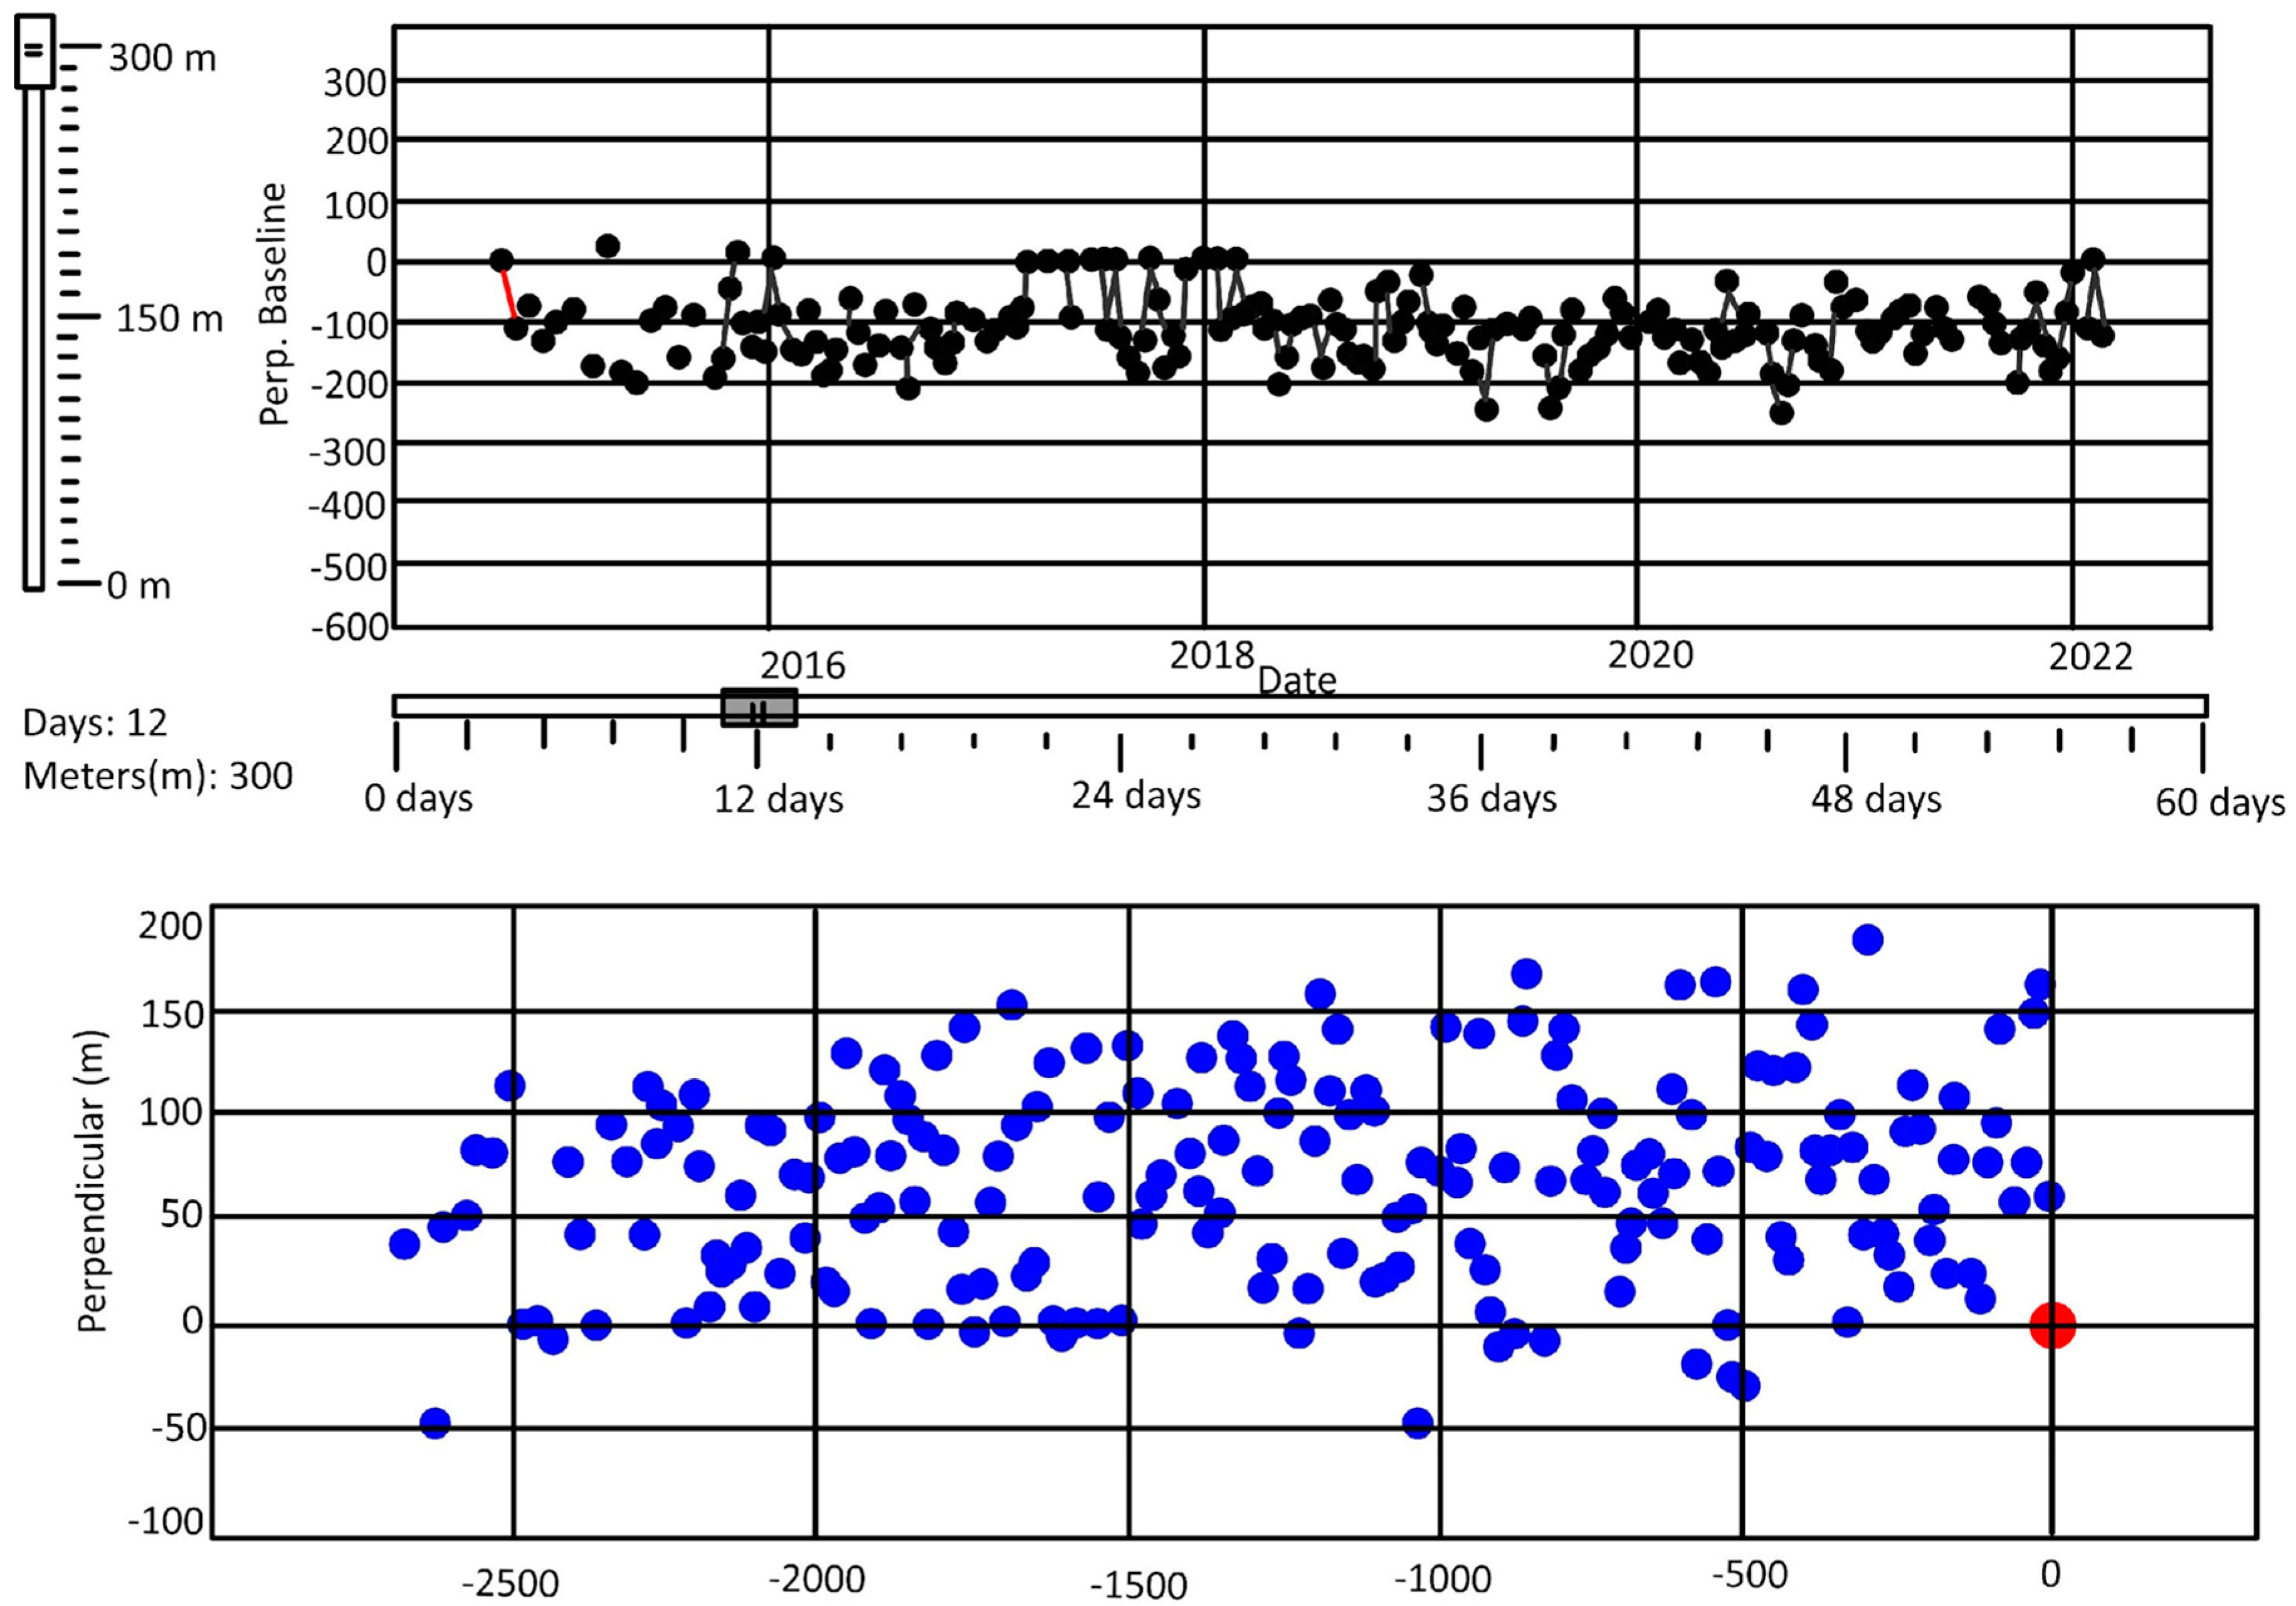
  • We analyzed a total of 69 SENTINEL 1A images in the Digboi and Dibrugarh regions. The overall result is that the active ground subsidence that occurred between 2015 to 2022 is ~5 mm/yr,
  • The Digboi region shows maximum subsidence due to the depletion of subsurface resources (groundwater and hydrocarbon) in the region. The active deformation caused by hidden subsurface faults is also an important factor responsible for ground subsidence.
  • Our analysis suggests that ~22 mm/yr surface deformation occurred over the course of four years. The contour pattern makes it evident that while ~75% of the study region exhibits a mean ground deformation of ~5 mm/yr, the southern portion of the study area experiences an increase in deformation of 10 mm to 22 mm/yr.
  • For the year 2020, a mean surface deformation of around 17 mm/yr was observed. The contour pattern makes it evident that while 75% of the study region exhibits a mean surface deformation of 5 mm/yr, the southern portion of the study area experiences an increase in deformation of 10 mm to 17 mm/yr.
  • For a portion of the year 2015, the Dibrugarh region saw a mean surface deformation of 24 mm/yr, with an increasing deformation tendency at a rate of 16 mm to 24 mm/yr towards the southern half of the research area.
  • For the years 2019 and 2020, an average deformation rate of 23 mm/yr was observed. While in the year 2021 and 2022average deformation of 12 mm/yr and 11 mm/yr was observed.
  • Several vertical or nearly vertical faults are causing the subsidence to gradually increase. There are a number of N–S- and NE–SW-trending transverse faults in the Dibrugarh region, which are to blame for the region’s continuous sinking.

Supplementary Materials

The following supporting information can be downloaded at: https://www.mdpi.com/article/10.3390/rs15204963/s1.

Author Contributions

Project conceptualization, supervision, data validation, interpretation, writing, and review by G.C.K. Data curation, methodology, software, data visualization, and manuscript preparation by A.L., A.K.P., J.C., and R.B. Data interpretation and writing, review, and editing by T.C. and J.-S.U. All authors have read and agreed to the published version of the manuscript.

Funding

This research was supported from RSF (Research Support Fund) Grant from Symbiosis International University, Pune, India by Tanupriya Choudhury (T.C.) and also from Institute of Earth Sciences- Academia Sinica- Taipei- Taiwan by Abhishek Lakhote (A.L.) and also from Kyungpook National University-South Korea by Jung-Sup Um (J-S.U.) and also joint review vouchers from Tanupriya Choudhury (T.C.) and Jung-Sup Um (J-S.U.) were used as a APC.

Data Availability Statement

We analyzed globally available sentinel-1A SLC images to carry out this research work, and the data are available at https://search.asf.alaska.edu/#/ (accessed on 7 December 2022).

Acknowledgments

G.C.K., A.K.P. and J.C. are thankful to UPES, Dehradun. Funding has been jointly received from Symbiosis Institute of Technology- Symbiosis International University- Lavele-Pune-India, by T.C. and Institute of Earth Sciences-Academia Sinica- Taipei-Taiwan by A.L. and Kyungpook National University-South Korea by J.-S.U. The Authors are also thankful to “ASF DAAC HyP3 2022 using the hyp3_gamma plugin version 5.1.4 running GAMMA release 20,210,701” online versions for processing SENTINEL-1A data set. Authors thankfully acknowledged anonymous reviewers for their constructive suggestions. All authors are grateful to all Institutes and Universities for successful joint collaboration.

Conflicts of Interest

There is no conflict of interest in publishing this work.

References

  1. Chen, J.; Li, J.; Zhang, Z.; Ni, S. Long-term groundwater variations in Northwest India from satellite gravity measurements. Glob. Planet. Change 2014, 116, 130–138. [Google Scholar] [CrossRef]
  2. Malik, K.; Kumar, D.; Perissin, D. Assessment of subsidence in Delhi NCR due to groundwater depletion using TerraSAR-X and persistent scatterers interferometry. Imaging Sci. J. 2019, 67, 1–7. [Google Scholar] [CrossRef]
  3. Kothyari, G.C.; Kandregula, R.S.; Kotlia, B.S.; Lakhote, A.; Swamy, K.V.; Pathak, V.; Chauhan, G.; Thakkar, M.G. Palaeoseismic investigations along the Kachchh Mainland Fault: A comprehensive review and new insights of the past earthquakes in the Kachchh basin, Western India. Quat. Int. 2021, 599, 184–209. [Google Scholar] [CrossRef]
  4. Kothyari, G.C.; Joshi, N.; Taloor, A.K.; Malik, K.; Dumka, R.; Sati, S.P.; Sundriyal, Y.P. Reconstruction of active surface deformation in the Rishi Ganga basin, Central Himalaya using PSInSAR: A feedback towards understanding the 7th February 2021 Flash Flood. Adv. Space Res. 2022, 69, 1894–1914. [Google Scholar] [CrossRef]
  5. Dumka, R.K.; SuriBabu, D.; Kotlia, B.S.; Kothyari, G.C.; Prajapati, S. Crustal deformation measurements by global positioning system (GPS) along NSL, western India. Geod. Geodyn. 2022, 13, 254–260. [Google Scholar] [CrossRef]
  6. Dumka, R.K.; Prajapati, S.; SuriBabu, D.; Swamy, K.V.; Kothyari, G.C.; Malik, K. GPS and InSAR Derived Evidences of Intra-Basin Stress and Strike-Slip Tectonics in the Vicinity of 2001 (M7. 7) earthquake, Kachchh, western India. Geol. J. 2023, 58, 683–699. [Google Scholar] [CrossRef]
  7. Dumka, R.K.; Suribabu, D.; Narain, P.; Kothyari, G.C.; Taloor, A.K.; Prajapati, S. PSInSAR and GNSS derived deformation study in the west part of Narmada Son Lineament (NSL), western India. Quat. Sci. Adv. 2021, 4, 100035. [Google Scholar] [CrossRef]
  8. Chen, F.; Lin, H.; Zhang, Y.; Lu, Z. Ground subsidence geo-hazards induced by rapid urbanization: Implications from InSAR observation and geological analysis. Nat. Hazards Earth Syst. Sci. 2012, 12, 935–942. [Google Scholar] [CrossRef]
  9. Grebby, S.; Orynbassarova, E.; Sowter, A.; Gee, D.; Athab, A. Delineating ground deformation over the Tengiz oil field, Kazakhstan, using the Intermittent SBAS (ISBAS) DInSAR algorithm. Int. J. Appl. Earth Obs. Geoinf. 2019, 81, 37–46. [Google Scholar] [CrossRef]
  10. Das, G. Geology of Assam-Arakan Region. QJ Geol. Min. Metall. Soc. India 1977, 49, 1–54. [Google Scholar]
  11. Dasgupta, S.; Mukhopadhyay, M.; Nandy, D.R. Active transverse features in the central portion of the Himalaya. Tectonophysics 1987, 136, 255–264. [Google Scholar] [CrossRef]
  12. Nandi, D.R. Geodynamics of Northeastern India and the Adjoining Regions; ABC Publication: Kolkata, India, 2001. [Google Scholar]
  13. Kayal, J.R. Microearthquake Seismology and Seismotectonics of South Asia; Springer Science & Business Media: Berlin/Heidelberg, Germany, 2008. [Google Scholar]
  14. Kayal, J.R.; Arefiev, S.S.; Baruah, S.; Hazarika, D.; Gogoi, N.; Gautam, J.L.; Tatevossian, R. Large and great earthquakes in the Shillong plateau–Assam valley area of Northeast India Region: Pop-up and transverse tectonics. Tectonophysics 2012, 532, 186–192. [Google Scholar] [CrossRef]
  15. Lahiri, S.K.; Sinha, R. Tectonic controls on the morphodynamics of the Brahmaputra River system in the upper Assam valley, India. Geomorphology 2012, 169, 74–85. [Google Scholar] [CrossRef]
  16. Sharma, S.; Baruah, S. Modelling of the Kopili fault based on slip rate, moment rate and seismic activity in Mikir hills plateau of northeastern India. Geomat. Nat. Hazards Risk 2017, 8, 1157–1172. [Google Scholar] [CrossRef]
  17. Bhadran, A.; Girishbai, D.; Mero, A. Liquefaction susceptibility of dibrugarh master plan area, assam—A case study. In Proceedings of the International Conference EGCON, Virtual, 9–11 December 2021. [Google Scholar]
  18. Devrani, R.; Singh, V.; Mehta, M.; Ramanathan, A.L. Assessing sediment pulse during an extreme hydrological event in the Alaknanda Basin, Northwestern Himalaya, India. J. Geol. Soc. India 2021, 97, 48–54. [Google Scholar] [CrossRef]
  19. Bhatt, U.S.; Walker, D.A.; Raynolds, M.K.; Bieniek, P.A.; Epstein, H.E.; Comiso, J.C.; Polyakov, I.V. Recent declines in warming and vegetation greening trends over pan-Arctic tundra. Remote Sens. 2013, 5, 4229–4254. [Google Scholar] [CrossRef]
  20. Malik, K.; Kumar, D.; Perissin, D.; Pradhan, B. Estimation of ground subsidence of New Delhi, India using PS-InSAR technique and Multi-sensor Radar data. Adv. Space Res. 2022, 69, 1863–1882. [Google Scholar] [CrossRef]
  21. Usai, S. A least squares database approach for SAR interferometric data. IEEE Trans. Geosci. Remote Sens. 2003, 41, 753–760. [Google Scholar] [CrossRef]
  22. Perissin, D.; Wang, T. Repeat-pass SAR interferometry with partially coherent targets. IEEE Trans. Geosci. Remote Sens. 2011, 50, 271–280. [Google Scholar] [CrossRef]
  23. Perissin, D.; Wang, Z.; Lin, H. Shanghai subway tunnels and highways monitoring through Cosmo-SkyMed Persistent Scatterers. ISPRS J. Photogramm. Remote Sens. 2012, 73, 58–67. [Google Scholar] [CrossRef]
  24. Berardino, P.; Fornaro, G.; Lanari, R.; Sansosti, E. A new algorithm for surface deformation monitoring based on small baseline differential SAR interferograms. IEEE Trans. Geosci. Remote Sens. 2002, 40, 2375–2383. [Google Scholar] [CrossRef]
  25. Ferretti, A.; Fumagalli, A.; Novali, F.; Prati, C.; Rocca, F.; Rucci, A. A new algorithm for processing interferometric data-stacks: SqueeSAR. IEEE Trans. Geosci. Remote Sens. 2011, 49, 3460–3470. [Google Scholar] [CrossRef]
  26. Colesanti, C.; Ferretti, A.; Novali, F.; Prati, C.; Rocca, F. SAR monitoring of progressive and seasonal ground deformation using the permanent scatterers technique. IEEE Trans. Geosci. Remote Sens. 2003, 41, 1685–1701. [Google Scholar] [CrossRef]
  27. Bürgmann, R.; Hilley, G.; Ferretti, A.; Novali, F. Resolving vertical tectonics in the San Francisco Bay Area from permanent scatterer InSAR and GPS analysis. Geology 2006, 34, 221–224. [Google Scholar] [CrossRef]
  28. Nagel, N.B. Compaction and subsidence issues within the petroleum industry: From Wilmington to Ekofisk and beyond. Phys. Chem. Earth Part A Solid Earth Geod. 2001, 26, 3–14. [Google Scholar] [CrossRef]
  29. Yerkes, R.F.; Castle, R.O. Seismicity and faulting attributable to fluid extraction. Eng. Geol. 1976, 10, 151–167. [Google Scholar] [CrossRef]
  30. Fielding, E.J.; Blom, R.G.; Goldstein, R.M. Rapid subsidence over oil fields measured by SAR interferometry. Geophys. Res. Lett. 1998, 25, 3215–3218. [Google Scholar] [CrossRef]
  31. Kandregula, R.S.; Kothyari, G.C.; Swamy, K.V.; Kumar Taloor, A.; Lakhote, A.; Chauhan, G.; Malik, K. Estimation of regional surface deformation post the 2001 Bhuj earthquake in the Kachchh region, Western India using RADAR interferometry. Geocarto Int. 2022, 37, 5249–5277. [Google Scholar] [CrossRef]
  32. Lakhote, A.; Thakkar, M.G.; Kandregula, R.S.; Jani, C.; Kothyari, G.C.; Chauhan, G.; Bhandari, S. Estimation of active surface deformation in the eastern Kachchh region, western India: Application of multi-sensor DInSAR technique. Quat. Int. 2021, 575, 130–140. [Google Scholar] [CrossRef]
  33. Chang, C.P.; Wang, C.T.; Chang, T.Y.; Chen, K.S.; Liang, L.S.; Pathier, E.; Angelier, J. Application of SAR interferometry to a large thrust deformation: The 1999 M w = 7.6 Chichi earthquake in central Taiwan. Geophys. J. Int. 2004, 159, 9–16. [Google Scholar] [CrossRef]
  34. Oštir, K.; Komac, M. PSInSAR and DInSAR methodology comparison and their applicability in the field of surface deformations-A case of NW Slovenia. Geologija 2007, 50, 77–96. [Google Scholar] [CrossRef]
  35. Castañeda, C.; Gutiérrez, F.; Manunta, M.; Galve, J.P. DInSAR measurements of ground deformation by sinkholes, mining subsidence, and landslides, Ebro River, Spain. Earth Surf. Process. Landf. 2009, 34, 1562–1574. [Google Scholar] [CrossRef]
  36. Angelier, J.; Baruah, S. Seismotectonics in Northeast India: A stress analysis of focal mechanism solutions of earthquakes and its kinematic implications. Geophys. J. Int. 2009, 178, 303–326. [Google Scholar] [CrossRef]
  37. Murthy, M.V.N.; Talukdar, S.C.; Bhattacharya, A.C.; Chakrabarty, C. The Dauki Fault of Assam. Bull. ONGC 1969, 6, 57–64. [Google Scholar]
  38. Baruah, S.; Hazarika, D. A GIS based tectonic map of Northeastern India. Curr. Sci. 2008, 95, 176–177. [Google Scholar]
  39. Sarma, J.N.; Sharma, S. Neotectonic activity of the Bomdila Fault in northeastern India from geomorphological evidences using remote sensing and GIS. J. Earth Syst. Sci. 2018, 127, 113. [Google Scholar] [CrossRef]
  40. Sarma, J.N. Fluvial process and morphology of the Brahmaputra River in Assam, India. Geomorphology 2005, 70, 226–256. [Google Scholar] [CrossRef]
  41. Evans, P. The tectonic framework of Assam. Geol. Soc. India 1964, 5, 80–96. [Google Scholar]
  42. Milliman, J.D.; Meade, R.H. World-wide delivery of river sediment to the oceans. J. Geol. 1983, 91, 1–21. [Google Scholar] [CrossRef]
  43. Milliman, J.D.; Syvitski, J.P. Geomorphic/tectonic control of sediment discharge to the ocean: The importance of small mountainous rivers. J. Geol. 1992, 100, 525–544. [Google Scholar] [CrossRef]
  44. Ludwig, W.; Probst, J.L. River sediment discharge to the oceans; present-day controls and global budgets. Am. J. Sci. 1998, 298, 265–295. [Google Scholar] [CrossRef]
  45. Verma, S.; Mukherjee, A.; Mahanta, C.; Choudhury, R.; Mitra, K. Influence of geology on groundwater–sediment interactions in arsenic enriched tectono-morphic aquifers of the Himalayan Brahmaputra river basin. J. Hydrol. 2016, 540, 176–195. [Google Scholar] [CrossRef]
  46. Corps, E.V. Digboi oil field, Assam. AAPG Bull. 1949, 33, 1–21. [Google Scholar]
  47. Bhandari, L.L.; Fuloria, R.C.; Sastri, V.V. Stratigraphy of Assam Valley, India. AAPG Bull. 1973, 57, 642–654. [Google Scholar]
  48. Barooah, D.; Barman, S.; Phukan, S. Simultaneous measurements of radon and thoron, and their progeny levels in dwellings on anticlinal structures of Assam, India. Environ. Monit. Assess. 2014, 186, 3581–3594. [Google Scholar] [CrossRef] [PubMed]
  49. Sen, T.K.; Pande, L.M.; Sehgal, J.L.; Maji, A.K.; Chamuah, G.S. Satellite remote sensing in soil resource inventory of Dibrugarh district (part), Assam. J. Indian Soc. Remote Sens. 1992, 20, 95–104. [Google Scholar] [CrossRef]
  50. Rajendran, K.; Parameswaran, R.M.; Rajendran, C.P. Seismotectonic perspectives on the Himalayan arc and contiguous areas: Inferences from past and recent earthquakes. Earth-Sci. Rev. 2017, 173, 1–30. [Google Scholar] [CrossRef]
  51. Rajendran, C.P.; Rajendran, K. Earthquakes of the Indian Subcontinent; Springer: Singapore, 2022. [Google Scholar]
  52. Debbarma, J.; Martin, S.S.; Suresh, G.; Ahsan, A.; Gahalaut, V.K. Preliminary observations from the 3 January 2017, MW 5.6 Manu, Tripura (India) earthquake. J. Asian Earth Sci. 2017, 148, 173–180. [Google Scholar] [CrossRef]
  53. Bhadran, A.; Sreejith, K.M.; Girishbai, D.; Duarah, B.P.; Agrawal, R.; Gopinath, G. An Appraisal of Ground Failure and Hydrogeological Changes Associated with the 28 April 2021 M w 6 Sonitpur Earthquake, Assam, India, Using Field Evidences and InSAR Measurements. Seismol. Soc. Am. 2022, 93, 1440–1451. [Google Scholar] [CrossRef]
  54. Virk, A.S.; Singh, A.; Mittal, S.K. Monitoring and analysis of displacement using InSAR techniques for Gulaba landslide site. J. Eng. Sci. Technol. 2019, 14, 1558–1571. [Google Scholar]
  55. Luirei, K.; Kothyari, G.C.; Mehta, M. Active tectonics in the Main Boundary Thrust zone, Garhwal Himalaya, as evident from palaeoseismic signatures, morphotectonic features and PSI base ground deformation. Geol. J. 2023, 58, 195–208. [Google Scholar] [CrossRef]
  56. Joshi, M.; Kothyari, G.C.; Malik, K.; Taloor, A.K. Response of drainage to tectonics and PS-InSAR derived deformation study in Bilaspur, northwestern Himalaya, India. Geod. Geodyn. 2022, 13, 205–218. [Google Scholar] [CrossRef]
  57. Sahoo, M.; Gogoi, K.D. Structural and sedimentary evolution of Upper Assam Basin, India and implications on hydrocarbon prospectivity. In Proceedings of the 2nd South Asian Geoscience Conference and Exhibition, GEO India, Gearter Noida, New Delhi, India, 12–14 January 2011; pp. 1–6. [Google Scholar]
  58. Sahoo, M.; Gogoi, K.D. Depositional history, processes and mechanism of early Miocene sediments of Upper Assam Basin. J. Geol. Soc. India 2009, 73, 575–585. [Google Scholar] [CrossRef]
  59. Dumka, R.K.; SuriBabu, D.; Malik, K.; Prajapati, S.; Narain, P. PS-InSAR derived deformation study in the Kachchh, Western India. Appl. Comput. Geosci. 2020, 8, 100041. [Google Scholar] [CrossRef]
  60. Garg, K.K.; Anantha, K.H.; Nune, R.; Akuraju, V.R.; Singh, P.; Gumma, M.K.; Ragab, R. Impact of land use changes and management practices on groundwater resources in Kolar district, Southern India. J. Hydrol. Reg. Stud. 2020, 31, 100732. [Google Scholar] [CrossRef]
  61. Panda, D.; Kundu, B.; Santosh, M. Oblique convergence and strain partitioning in the outer deformation front of NE Himalaya. Sci. Rep. 2018, 8, 10564. [Google Scholar] [CrossRef]
  62. Ader, T.; Avouac, J.-P.; Liu-Zeng, J.; Lyon-Caen, H.; Bollinger, L.; Galetzka, J.; Genrich, J.; Thomas, M.; Chanard, K.; Sapkota, S.N.; et al. Convergence rate across the Nepal Himalaya and Interseismic coupling on the Main Himalayan Thrust: Implication for seismic Hazard. J. Geophys. Res. 2012, 117, B04403. [Google Scholar] [CrossRef]
  63. Stevens, V.L.; Avouac, J.P. Interseismic coupling on the main Himalayan thrust. Geophys. Res. Lett. 2015, 42, 5828–5837. [Google Scholar] [CrossRef]
  64. Vernat, P.; Bihlam, R.; Szeliga, W.; Drupka, D.; Kalita, S.; Bhattacharyya, A.K.; Gaur, V.K.; Pelgay, P.; Cattin, R.; Berthet, T. Clockwise rotation of the Brahmputra valley relative to India: Tectonic convergences in the eastern Himalaya, Naga Hills, and Shillong Plateau. J. Geophys. Res. 2014, 119, 6558–6571. [Google Scholar] [CrossRef]
  65. Devachandra, M.; Kundu, B.; Catherine, J.; Kumar, A.; Gahalaut, V.K. Global positioning system (GPS) measurements of crustal deformation across the frontal eastern Himalayan syntaxis and seismic-hazard assessmnent. Bull. Seism. Soc. Am. 2014, 104, 1518–1524. [Google Scholar] [CrossRef]
Figure 1. (a) Regional geological map of the northeastern part of India after [12]. (b) Satellite data bird’s eye view shows the morphological expression of Assam valley, India.
Remotesensing 15 04963 g001
Figure 2. Seismo-tectonic map of the northeastern part of India [3,12]. Various faults and thrusts are shown. The study area is shown by a red box.
Remotesensing 15 04963 g002
Figure 3. Flow chart depicting processing methodology via the ASF DAAC HyP3 2022, using the hyp3_gamma plugin version 5.1.4 and running the GAMMA release 20210701 online version.
Remotesensing 15 04963 g003
Figure 4. Temporal and perpendicular baseline graphs of the SENTINEL-1A data sets used in the present study.
Remotesensing 15 04963 g004
Figure 5. (a,b) Phase interferogram and velocity of 2015 data sets. (c,d) Phase interferogram velocity of 2019 data sets of the Digboi region.
Remotesensing 15 04963 g005
Figure 6. (a,b) Mean phase interferogram and phase velocity of 2020 data sets. (c,d) Phase interferogram and phase velocity of 2021. (e,f) Phase interferogram and phase velocity of 2022 data sets of the Digboi area.
Remotesensing 15 04963 g006
Figure 7. (a,b) Phase interferogram and velocity of 2015 data sets. (c,d) Phase interferogram and velocity of 2019 data sets of the Dibrugarh region.
Remotesensing 15 04963 g007
Figure 8. (a,b) Phase interferogram and velocity for the year 2020, (c,d) for 2021, and (e,f) for 2022, observed from the SENTINEL 1A data set of the Dibrugarh region.
Remotesensing 15 04963 g008
Figure 9. (a,b) Subsurface geology of the study area indicating source rock, seal, and reservoir. Modified after [57].
Remotesensing 15 04963 g009
Figure 10. PS-InSAR velocity estimated from the SENTINEL-1A data from 2015 to 2022. The velocity profile direction is provided by P1 to P6 for the Dibrugarh region and P7 to P11 for the Digboi region.
Remotesensing 15 04963 g010
Figure 11. N–S velocity profiles P1, P2, and P3 of the Dibrugarh region (profile locations are shown in Figure 10). The solid black line represents the topographic elevation profile prepared from the SRTM DEM data for reference. The left axis shows the scale of the elevation in meters. The axis to the right shows the LOS velocity in mm/y. The presence of oil wells is shown by a vertical dashed line. Highlighted boxes indicate key locations along the profile line. A—Konwar; B—Chakla Pathar; C—Panukhor Doloni; D—Dihing River; E—Brahmaputra River; F—Sitalmari; G—Dhemechi Gaon; H—Silputa Gaon; I—Bogibil Eco Resort; J—Moranhat; K—Tiloi Nagar; L—Khowang; M—Lepetkata; N—Dibrugarh.
Remotesensing 15 04963 g011
Figure 12. N–S velocity profiles P4, P5, and P6 of the Dibrugarh region (profile locations are shown in Figure 10). The solid black line represents the topographic elevation profile prepared from the SRTM DEM data for reference. The left axis shows the scale of the elevation in meters. The axis to the right shows LOS velocity in mm/y. The presence of oil wells is shown by a vertical dashed line. Highlighted boxes indicate key locations along the profile line. O—Tiloijan Gaon; P—Dihing Khamti Ghat; Q—Saguni Bari Ghat; R—Lengeri Gaon; S—Tamulbari Tea Estate; T—Tingkhong; U—Disang; V—Tengakhat.
Remotesensing 15 04963 g012
Figure 13. N–S velocity profiles P7, P8, and P9 of the Digboi region (profile locations are shown in Figure 10). The solid black line represents the topographic elevation profile prepared from the SRTM DEM data for reference. The left axis shows the scale of the elevation in meters. The axis to the right shows LOS velocity in mm/y. The presence of oil wells is shown by a vertical dashed line, and a dashed square box shows the location of a coalfield. Highlighted boxes indicate key locations along the profile line. a—Naharkatia; b—Hukuta; c—Mahkhuli Gaon; d—TSK CM College; e—Brahmaputra River; f—Rani Village; g—Nagajan Gaon; h—Tingrai Bongali Gaon; i—Baghjan Gaon; j—Godum; k—Margherita; l—Digboi; m—Makum; n—Bordubi; o—Sadiya.
Remotesensing 15 04963 g013
Figure 14. N–S velocity profiles P10 and P11 of the Digboi region (profile location is shown in Figure 10). The solid black line represents the topographic elevation profile prepared from the SRTM DEM data for reference. The left axis shows the scale of the elevation in meters. The axis to the right shows LOS velocity in mm/y. The presence of a coalfield is shown as a dashed box. Highlighted boxes indicate key locations along the profile line. p—Ledo; r—Naga Pathar; s—Khatang Pani T.E.; t—Holong Guri; u—Bordirak; v—Telikola Gaon; w—Jagun; x—Kakoni; y—Sunpura; z—Bood Gaon.
Remotesensing 15 04963 g014
Table 1. Lithostratigraphic succession of eastern syntaxis, including Assam and Naga Schuppen Belt (modified after) [41,46,47].
AgeGroupFormation and Member
Shelf sedimentsGeosynclinal sediments
Upper AssamNaga Schuppen Belt
Recent-Pleistocene AlluviumAlluvium
Unconformity
Pliocene Dhekiajuli (1800)Dihing (900)
Unconformity
Mio-Pliocene Namsang (600)Namsang (800)
Unconformity
MioceneTipamGirujan Clay (600)Girujan ClayGirujan Clay Member (1700)
Arenaceous Alternations member (150)
Tipam Sandstone (900)Tipam SandstoneUpper Tipam
Sandstone
Members
Hansapung Sandstone (260)
Bappapung Clay (90)
Bappapung Sandstone (170)
Middle Tipam
Sandstone
Members
Upper Digboi Mottled Clay (75)
Nahor Oilsand (75)
Lower Mottled Clay (75)
Lower Tipam
Sandstone
Members
Upper Digboi Oilsand Group (75)
Cover clay (75)
Middle Digboi Oilsand Group (210)
Basal Digboi Oilsand Group (60)
SurmaUndivided (200)Undivided (200)
Unconformity
OligoceneBarailRudrasagar (530)Tikak Parbat (600)
Baragolai (3300)
Nagaon (670)Nagaon (2200)
Eocene-CretaceousDisang/JaintiaJaintia (1100)Disang (~3000)
Table 2. Parameters used for the processing of the SENTINEL-1A data set.
SatelliteOrbitPathFrameDateTimePolarizationBandDirectionNormal Baseline (m)Normal Baseline from the
Master Image (m)
SENTINEL 1A8192708517 October 201511:40:26VVCAscending 110.542412
SENTINEL 1A27,79270127122 June 201911:40:56VV + VHCAscending31.281324
SENTINEL 1A30,76770127112 January 202011:40:59VV + VHCAscending6.756336
SENTINEL 1A36,0177012716 January 202111:41:05VV + VHCAscending−43.091248
SENTINEL 1A41,61770127125 January 202211:41:10VV + VHCAscending−18.589660
Disclaimer/Publisher’s Note: The statements, opinions and data contained in all publications are solely those of the individual author(s) and contributor(s) and not of MDPI and/or the editor(s). MDPI and/or the editor(s) disclaim responsibility for any injury to people or property resulting from any ideas, methods, instructions or products referred to in the content.

