Article

Evaluation of the Spatial Distribution of Predictors of Fire Regimes in China from 2003 to 2016

1
Institute of Applied Ecology, Chinese Academy of Sciences, Shenyang 110016, China
2
State Key Laboratory of Earth Surface Processes and Resource Ecology, Faculty of Geographical Science, Beijing Normal University, Beijing 100091, China
3
Northeast Institute of Geography and Agroecology, Chinese Academy of Sciences, Changchun 130028, China
*
Author to whom correspondence should be addressed.
Remote Sens. 2023, 15(20), 4946; https://doi.org/10.3390/rs15204946
Submission received: 25 August 2023 / Revised: 27 September 2023 / Accepted: 10 October 2023 / Published: 13 October 2023

Abstract

:
Wildfire has extensive and profound impacts on forest structure and function. Therefore, it is important to study the spatial and temporal patterns of forest fire regimes and their drivers in order to better understand the feedbacks between climate change, fire disturbance, and forest ecosystems. Based on the Global Fire Atlas dataset, three forest fire regime components (fire occurrence density, burned rate, and median fire size) were extracted for China from 2003 to 2016. Three statistical models (Boosted Regression Tree, Random Forest, and Support Vector Machine) were used to systematically analyze the relationships between patterns of forest fire disturbance and climate, human activities, vegetation, and topography in China, as well as their spatial heterogeneity in different climatic regions. The results indicate that the spatial distribution of forest fires is heterogeneous, and different forest fire regime components are predicted by different factors. At the national level, the distribution of forest fire regimes mainly corresponds to climatic factors, although the relationship between median fire size and predictors is obscure. At the scale of each ecoregion, the main climate predictors of forest fire occurrence density and burned rate change from temperature in the north to temperature and precipitation in the south. Median fire size varies with elevation and temperature in the south. These results demonstrate that the spatial heterogeneity of predictors and scaling effects must be fully considered in the study of forest fire disturbance.

Graphical Abstract

1. Introduction

Forest fire is a ubiquitous disturbance in forest ecosystems and profoundly changes the species composition, ecological succession, and functions of the biome [1,2]. Earth observational data have shown that forest fires burned about 1% of the global forests and emitted 1.9–2.5 Pg of carbon © per year during the 1990s and 2000s, equivalent to 4% of global terrestrial net primary productivity (approximately 58 Pg C year−1, 1997–2004) [3]. Recent climate warming has increased the frequency, size, and severity of forest fires in many parts of the world, and such trends are expected to continue under a warmer climate in the future. It is expected that an intensified forest fire regime will significantly change the planet’s demography, carbon cycles, and forest ecosystems. Therefore, understanding spatial controls of forest fire regimes is important for predicting future changes in fire regimes and their consequences for ecological services [4]. Forest fires are expected to intensify under future warmer climates, although human management may decrease fires in other ecosystem types [5]. The Intergovernmental Panel on Climate Change (IPCC) has shown that we have already experienced a full 1 °C of temperature rise above pre-industrial levels [6]. It is predicted that the climate in China will be warmer and drier in the future, which could lead to increasing intensity and frequency of fire disturbance [7,8], with profound impacts on the carbon sink potential of forest ecosystems.
The spatial controls on forest fire regimes are often depicted as a fire triangle, including climate conditions, vegetation, and ignition agents (natural or anthropogenic). At large spatial and temporal scales, climate is the dominant control of the interannual variability of forest fires. Numerous studies have found a strong coupling between climate factors and forest fires [9]. For example, Abatzoglou et al. [10] indicated that an increase in air temperature and water deficit accounted for an approximately 75% increase in forest flammability for the Western USA during the fire season from 2000 to 2015. In addition, teleconnections, such as El Niño and drought, are also associated with forest fires in Northeast China and California [11,12,13]. The climate also controls the fire regime indirectly through its influences on regional forest species composition. Rogers et al. [14] found differences in forest species from two distinct fire regime types in Siberia and North America. For example, Siberian boreal forests are mainly occupied by fire resisters (Pinus sylvestris), and therefore fire regimes are dominated by relatively frequent low-intensity fires. In contrast, North American boreal forests are mainly occupied by fire embracers (Picea mariana and Pinus banksiana); therefore, fire regimes are dominated by relatively infrequent, high-intensity fires. Climate and vegetation also interact with landscape-scale controls (e.g., terrain) to determine the spatial patterns of forest fires. For example, Su et al. [15] used a negative binomial model and a geographically weighted negative binomial regression model to find that forest fire in the Greater Khingan Range in China corresponds to environmental factors. In contrast, they found that in Yunnan Province, forest fire relates to both environmental and anthropogenic factors. Hence, the driving factors of forest fire appear to vary with ecological region.
Research on the causes of forest fires in China has mainly focused on the relationship between one specific forest fire parameter, often forest fire frequency, and its driving factors. For example, Wu et al. [16] used the Boosted Regression Tree method to study forest fire in China, and found that forest fire frequency was mainly affected by climate and human factors. Liu et al. [17] used the point pattern analysis method to study the Huzhong forest region in the Greater Khingan Range, and showed that human activities, terrain, and vegetation all played an important role in forest fire frequency. Ke et al. [18] analyzed the correlation between forest fire burned area and climate in China, and showed that forest fire-burned area is highly correlated with temperature and precipitation. Finally, Fu et al. [19] analyzed forest fire intensity in the Greater Khingan Range through a Random Forest Model, and concluded that altitude plays an important role. Forest burned area accounts for 23.4–27.7% of the total annual burned area in China [3]. The large area affected makes it important to strengthen research into the factors that drive forest fire in China. Research on this topic is mostly regional and concentrated in the northeastern forests [19,20,21], while research across a large geographic scale is still relatively scarce, and the differences between the variables that influence forest fire in different climate regions are not clear.
To study the spatial distribution of forest fire and its potential driving factors, we extracted three components of fire regimes (forest fire occurrence density, burned rate, and median fire size) from the fire dataset for China (Global Fire Atlas: GFA, 2003–2016). Through analysis of these regimes, we investigate the importance of the size of the region studied according to the variables that influence forest fire and the differences between climate regions. A better understanding of regionality in fire regimes will contribute to the scientific basis for forest fire control and management and forest protection and management.

2. Data and Methods

2.1. Data Sources

Forest fire regime data were extracted from the GFA data product (https://www.globalfiredata.org/fireatlas.html, accessed on 31 December 2016). The GFA dataset is based on the MODIS fire area product (spatial resolution is slightly below 500 m), and the size, time, location, fire type, and spread speed of a single fire patch are extracted by the threshold relationship of fire pixels in time and space. The minimum fire patch area extracted by GFA is 21 hectares (1 pixel). For data verification, government records of fire in China were obtained from the Fire Prevention Office of the China Forestry and Grass Bureau (CFPO). The independent variables tested for their impact on fire include climate, anthropogenic effects, topography, and vegetation. The definition, source, resolution, and unit of each independent variable are shown in Table 1.

2.2. Processing Method

2.2.1. Extraction of Forest Fire Predictive Factors

Many studies show that climate, anthropogenic effects, vegetation, and topography all impact fire regimes, e.g., [16,17,20]. Therefore, we extracted factors from these four categories—a total of 37 factors—as independent variables (see Table 1). We then calculated their average values across the 14 years, with all data scaled to the same resolution—a 0.5° grid.
Climate and NDVI were calculated as the average of 14-year seasonality (spring: Mar-May; summer: June-August; autumn: September-November; winter: December-February) and annual mean values during the study period, 2003–2016. The percentage of five vegetation types, classed by the International Geosphere-Biosphere Programme (IGBP), within each grid cell was calculated. Excluding PopDen, RdDen, and Dem, which can be directly downloaded, other factors were statistically derived. The slope was calculated in ArcGIS through the “slope” function via DEM. Poten_rad was derived by calculating the aspect from DEM in ArcGIS through the “aspect” function; then, the aspect was converted into potential solar radiation, where Poten_rad = cos((θ − 225)/180 × π). Dist2Rd was calculated using the “Euclidean distance” function in ArcGIS using the RdDen variable to represent the distance to the nearest major road.

2.2.2. Extraction of Forest Fire Parameters

Based on the size, time, location, type, and other information for single fire patches in the GFA data product, each forest fire regime component was calculated for the 2003 to 2016 period with a 0.5° grid as the spatial unit (Figure 1). The selected statistical forest fire regime components in each 0.5° grid are as follows: (1) forest fire occurrence density—the number of forest fires per 1000 km2 forest per year (fires/1000 km2 per year); (2) burned rate—the burned area of fires per 1000 km2 forest per year (km2/1000 km2 per year); and (3) median fire size—the median area of all forest fire patches in the 0.5° grid over the whole time-span (km2). All fire regime components were masked by land cover to exclude fires in non-forest areas, and the study area was divided into eight ecoregions according to climate zone: (I) cold temperate deciduous coniferous forest area; (II) temperate coniferous and broad-leaved mixed forest area; (III) warm temperate deciduous broad-leaved forest area; (IV) subtropical evergreen broad-leaved forest area; (V) tropical seasonal rainforest and rainforest area; (VI) temperate grassland area; (VII) temperate desert area; and (VIII) alpine vegetation area of the Qinghai–Tibetan Plateau. The ecoregions with minimal forest are (V, VI, VII, and VIII, in which only 4.2% of grid cells include forest) were not individually studied but were included in the national analysis.

2.2.3. Fire Models

At present, many models are used to study the factors that drive fire, but the simulation results have high uncertainty, e.g., [22,23]. In this paper, three commonly applied models were fitted in R version 3.5.1 [24], namely Boosted Regression Tree (BRT), Random Forest (RF), and Support Vector Machine (SVM), using the “gbm v2.1.5” [16,25], “random forest v4.6-14” [26], and “kernlab v0.9-29” packages [27,28], respectively, in addition to custom code written by J.S. These three models were separately used to simulate the four ecoregions in China that experience significant forest fire, and forest fire across the whole country, for each fire regime component (3 × (4 + 1) × 3 = 45).
BRT [29] has its origin in machine learning but has been developed as a method of regression [16,30]. Boosting algorithms in BRT can combine many simple models to give improved predictive performance [29,31]. To minimize predictive error, we tested several combinations of key BRT fitting parameters (learning rate, lr, tree complexity, tc, and the number of trees, nt). Considering the trade-off between computational time and robustness of the model, the complexity of the tree was set at 1–3, and a Gaussian model was used. The best combination of parameters was determined by 10-fold cross-validation [32], and the best parameters were selected by maximizing the variance (mv) explained by the model. The “bag fraction”, which specifies the proportion of data to be selected at each step, was set to 75% for model training to reduce stochastic errors. The resulting BRT parameters were as follows: for occurrence density (mv = 0.74), tc = 2, nt = 30, lr = 0.05; for burned rate (mv = 0.79), tc = 2, nt = 30, lr = 0.05; for median fire size (mv = 0.53), tc = 2, nt = 5, lr = 0.001. The relative importance of each predictor variable in BRT is calculated based on the number of times the variable is selected, and expressed as a percentage.
RF [19,33] uses a bootstrap sampling method to randomly extract 2/3 of the data from the sample for modeling, with the remaining data, termed “out-of-bag” (OOB) data, used for self-verification of the model. It is powerful for handling nonlinearity and interactions among variables [34]. RF is different from the classical decision tree in that its “tree” does not need pruning. Primarily, it aims to identify the appropriate model of the relationship between the response variable and independent variables, but it can also be used in unsupervised mode for assessing proximities among data points. Random Forest is widely used in ecology for studying relationships between fire and their potential drivers [34,35,36]. Random Forest models determine the relationship between independent and dependent variables over numerous iterations of decision trees, each using different combinations of the variables, to assess the contribution of each independent variable. To maximize accuracy, the number of trees (ntree) was set to 300, and the number of predictors sampled for splitting at each node (mtry) was 2; these are the two main parameters to run RF. The minimum size of terminal nodes in RF, which determines the length of the trees to be grown, was set to 5. The data are sampled with replacement to construct the tree. A variable’s importance is defined as the increase in the mean of squared OOB residuals (IncMSE) when the variable is permuted [33,34]; i.e., the variable of greatest importance gives the largest IncMSE.
SVM [37], also known as Support Vector Network, is a supervised learning model that uses classification and regression methods to analyze data. SVM is a nonlinear binary classification process. It can solve nonlinear classification problems arising from limited prior knowledge of the modeling conditions, and is commonly used in ecology [38,39]. SVM finds an optimal hyper-plane separating the two classes, and optimizes the margin among the classes. Within the kernlab package, we set ‘kpar’ to automatic to heuristically derive a suitable sigma value for the Gaussian Radial Basis kernel function (RBF). Three-fold cross-validation was then performed on the data. The number of support vectors (nSV) of occurrence density is 781, and the hyper-parameter (HP) is sigma = 0.050. For burned rate, nSV is 459 and HP is sigma = 0.043; for median fire size, nSV is 146 and HP is sigma = 0.047. The relative importance in SVM is based on the “vip v0.2.2” package [40] in R 3.2.1; this package constructs variable importance (VI) scores/plots for many types of supervised learning algorithms, using model-specific and novel model-agnostic approaches. “vi” was implemented in this study to calculate relative importance.
BRT, RF, and SVM do not require the removal of collinear variables [29,33,37]; all variables were used despite the increased computation time, in contrast with Potter S [41]. The outputs include the relative contribution of each independent variable to the dependent variable, and the relationship between the independent and dependent variable—namely, the marginal effect or partial dependence. We calculated the coefficient of determination (R2) of a linear model between observed and predicted values [36,41] for each fire regime component in the three models. The marginal effect is based on the “pdp v0.7.0” package [42] in R 3.5.1, which adds a trend line based on LOESS smoothing. To evaluate spatial differences in the forest fire predictors, we analyzed them at national and regional scales.

3. Results and Discussion

3.1. Validation of Fire Data

To verify the data available in the GFA, this paper compares the GFA data with government records from the CFPO for fire sizes >21 ha, as that is the minimum spatial resolution of the GFA. CFPO data included information about the forest fire, such as fire area, locations, fire dates, and affected area. The original data are in CSV format, which were transformed into a shapefile. In the CFPO records, fire patches with areas less than 21 ha accounted for 7.5% of the total number, and their area accounted for 0.02% of the total burned area. Since the values from the CFPO are only available from 2003 to 2009, they were compared with the GFA data of the same period.
The occurrence density, burned rate, and median fire size of the GFA from 2003 to 2016 for China (Figure 2) were 3.04 ± 140.6 fires/1000 km2 year−1, 3.67 ± 114.2 km2/1000 km2 year−1, and 0.43 ± 21.42 km2 (median ± standard deviation), respectively. There was a consistent distribution of the fire regimes between the GFA and CFPO fire data (Figure S1), which indicates that GFA data can represent the characteristics of forest fire disturbance with adequate skill. This is in keeping with the findings of Wu et al. [13] that the CFPO and MODIS data agree sufficiently that GFA represents patterns of fire across China. The spatial and temporal benefits and free availability of the satellite data recommend it as a tool for investigating fire regimes.

3.2. Predictors of Disturbance by Forest Fire

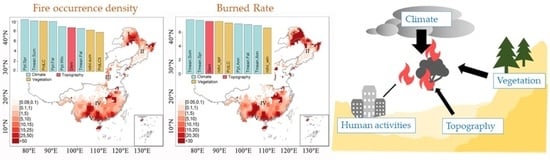
3.2.1. Predictors of Forest Fire Occurrence Density

The accuracy of predicting forest fire occurrence density for China nationally was high using RF (R2 = 0.91; p < 0.001; Figure 3a). Three of the ecoregions’ (Zones I, II, IV) best models had very high coefficients of determination (BRT and RF R2 ≥ 0.90, p < 0.001; Figure 4 and Figure 5), and the RF model’s performance for predicting forest fire in Zone III was still high (R2 = 0.58; p < 0.001; Figure 5a). On a national scale, the patterns of forest fire regimes correspond strongly to those of climate variables as well as the percentage covered by forests (Figure 3b). Within each region, there are differences in which variables are most important. In the northern-most ecoregions, temperature appears to have a stronger effect than precipitation (Figure 4b,d,f,h), while in the south, precipitation contributes more to the models (Figure 5b,d).
On the national scale, spring and fall precipitation were important predictors of fire occurrence density in the two best models, RF and BRT (R2 = 0.91), with increasing spring precipitation and decreasing autumn precipitation correlated to higher occurrence density (Figure S2). High spring rainfall may be associated with higher growth of fuels in the forest. Regions with low fall precipitation, on the other hand, may experience an extended summer fire season, or begin a dry-season fire regime earlier due to an earlier end to the monsoon. The influence of mean summer temperature appears to have a threshold at about 16 °C, with higher local temperatures relating to increased occurrence density. A similar threshold (13.5 °C) has been found to predict fire in Alaska [30]. Comparison to the mean summer temperature partial dependence plots for each zone suggests that this strong increase in the national model is influenced by Zone I. Zone I is boreal, similar to Alaska, but with a dominance of deciduous gymnosperms (Larix) rather than evergreens (e.g., Picea, Pinus, or Thuja); this may influence the position of the threshold, though a study across a greater geographic range of Larix-dominated forests, accounting for interannual variation in temperature, should be conducted to confirm if it is a true signal. Outside the range of mean summer temperatures of Zone I, there is a stepwise decrease at approximately 25 °C. This end of the pattern of dependence is very similar to that for the mean summer temperature partial dependence plot for the burned area in Zone IV (discussed below). Areas with low forest cover are less likely to have high occurrence density in a given period. Elevation-related incidence is complex; the higher incidence at lower elevations seems to be inflated by the signal of the northeast, with the relation otherwise following the Zone IV trend.
In the models for Zone I (BRT and RF), a spring and fall mean temperature threshold at approximately freezing increased fire occurrence density and may represent the importance of an extended fire season (Figure S3). Elevation has a greater influence on RF than BRT. Higher occurrence at lower elevations in RF may be related to human ignitions [20], and, indeed, high occurrence densities are concentrated on the eastern side of the Greater Khingan Mountains in this zone (Figure 2), where they descend to the more densely inhabited plains. In the BRT model, road density is the next strongest influence on the models, and elevation shows a step-decrease in response below ~400 m; this may be explained by the interaction effects between these two factors, with distance to road explaining much of the fire occurrence below 400 m. To further understand the impact of human activities on forest fire, future studies could test the effect of distance to cropland or pasture because burning crop residue is common [18] and may contribute to wildland fires more directly than distance to roads or population density.
Zone II covers a greater latitudinal gradient than Zone I. The models (BRT and RF) suggest that in Zone II’s colder northern regions, away from the population centers, fire is more frequent in the deciduous broadleaf forests (Figure S4). There is a negative correlation between winter temperature/population density and occurrence density in BRT and RF; population density and extreme winter cold may be covarying. Greater occurrence is also associated with lower slope and elevation; similar to Zone I, this may be due to distance to agricultural land or burning forestry residue rather than a direct, mechanistic cause.
The lower sample of fire in Zone III seems to have contributed to less skillful models. However, as this is also a highly populous region of China, unmeasured human impacts on fire (active fire suppression, pre-emptive fire risk reduction, etc.) may have also increased the noise in the data. Population density and summer precipitation were influential variables common to all Zone III models. In general, locations with decreasing population density and decreasing precipitation had increased fire frequency (Figure S5). Low winter NDVI may be linked with vegetation/fuel drying and forests more prone to ignition.
Finally, in Zone IV, warmer temperatures and higher precipitation in spring may lead to increased fuel growth, contributing to higher fire occurrence (Figure S6). Low precipitation in fall is also conducive to fire, possibly due to earlier initiation of the dry season in those areas. Where there is a higher percentage of cover by broad-leafed evergreens, there is a higher occurrence density of fires in Zone IV.

3.2.2. Predictors of Burned Rate

The accuracy of predicting forest fire burned rate for China nationally was high (RF R2 = 0.81; p < 0.001; Figure 6a). This is within the skill range of the models for the individual climate zones (R2 = 0.52–0.97; p < 0.001; Figure 7a,c,e,g). Nationally, the burned rate and occurrence density of forest fire had many top predictive factors in common, which is consistent with the correlation between these fire regime components (R2 = 0.60, p < 0.001, Pearson test).
The models for predicting the burned rate at the national scale suggest that how the variables influence the burned rate is complex and non-linear (Figure S7). This may indicate interaction at regional and/or local levels. Despite this, some of the patterns were clear and intuitive. For example, an increasing percentage of forest led to an increasing burned area, with a rapid effect of up to about 20%. As seen in the occurrence density results, the mean summer temperature seems to show a ~16 °C threshold for increased burned rate, and a 25 °C dip that appears to primarily follow the mean summer temperature patterns of Zones I and IV.
Within Zone I, all mean temperature variables showed a strong influence, particularly mean spring temperatures, with threshold or step-wise patterns common in both the best and second-best correlated models (BRT and RF; Figure S8). Increasing temperatures corresponded to an increased burned rate. Although the impact of slope on the model was apparently relatively high (Figure 7d), the range over which it influenced the model was 1–3°, and may reflect interactions or covariations rather than a causative mechanism.
Within Zone II, areas with low population density and low elevation had higher burned rates (Figure S9). The association between higher burned rate and low winter temperature may suggest there is a covariance between low winter temperatures and population density. Higher precipitation and higher NDVI (stepwise) in summer were also correlated with burned rate, and we posit these variables may reflect long-term fuel loads, as this region tends towards spring and fall fires, rather than summer fire [16]. Dry spring conditions were also associated with increased burned rate, due to the percentage of deciduous broad-leafed trees, which could both be related to dry and abundant fuels that carry low-severity, early-season fires in the north. Many relationships were complex and non-linear, again suggesting interactions with other variables.
As with occurrence density, the models were less skillful in predicting the burned rate in Zone III (RF R2 = 0.52; p < 0.001; Figure 7e). RF and the next best model (BRT R2 = 0.29; p < 0.001) shared the influence of low precipitation in summer and winter and spring and annual NDVI values, overall suggesting that a drier climate increases burned rate (Figure S10). In addition, areas with lower population density had higher burned rates, which could be due to the lower forest connectivity in more populated regions or a higher likelihood of fire prevention and suppression strategies that limit fire spread. Notably, the magnitudes of burned rates were much lower in this zone than in others; this narrower range (and hence the statistical effect size) may substantially impair the training of the models.
In Zone IV, localities with higher winter and fall temperatures, as well as lower fall precipitation, exhibited a higher burned rate (Figure S11). Greater slope corresponded to a higher burned rate, and when associated with the mountainous regions to the west, a greater slope may interact with the mean summer temperatures, causing a higher burned rate. This may have caused the unexpected and non-linear response with a dip at ~25 °C and, similarly, a dip in annual precipitation.

3.2.3. Predictors of Median Fire Size

The accuracy of predicting forest fire mean area for China nationally was much lower than for occurrence density and burned rate (RF R2 = 0.38; p < 0.001; Figure 8a). The models each showed a lower coefficients of determination for predicting forest fire in Zones I–III, with the Zone II models’ p-value indicating no significant relationship between the observed and predicted data (Zone I SVM R2 = 0.21; Zone III RF R2 = 0.40; p < 0.001; Figure 8c,e). Zone IV, however, was well predicted (R2 = 0.81; p < 0.001; Figure 8g). Why the models appear so poor at predicting median fire size in Northeastern China is uncertain, but potential contributing factors are discussed below.
Median fire size on the national level is predicted by a combination of terrain, distance to human features, and temperature variables. All display strong step or threshold behaviors (Figure S12). In general, colder temperatures are related to the high median area burned and may align with the high median fire sizes in the northernmost north-east, and apparently in the mountainous southwestern Zone IV, which is also an area of low population density. Seemingly counter to the population trend, large median fire sizes appear close to roads and in areas of high road density. Nearness to roads could be an artifact of large fires eventually becoming adjacent to roads, but the correlation between high road density and median fire size is difficult to explain. In the northeast, distance to the nearest road was associated with increased fire [20], but in that study, it was also associated with increased population density and human-caused fires. It is noteworthy that fire size is poorly predicted in the northern regions as well as nationally. It is possible that the skill of the models in the north is poor and the result of the national model thus merely indicates that the models are better at predicting median fire size in the south, where road density is generally higher.
For Zone I, although the p-values suggest the models are predicting median fire size non-randomly, all models had poor performance. This may indicate that median fire size is primarily driven by factors not studied in this model (such as forest connectivity or fire prevention and response efforts), is driven by interannual variability in the factors studied, or that the impact of the factors is heterogeneous across the study area. The importance of population and road density, along with the elevation, are in keeping with previous studies in the region [43] and are suggestive of median fire size being either more likely in terrain unsuited to human habitation or strongly affected by human intervention, such as active fire suppression (Figure S13). For Zone III, the models performed better than in Zones I and II, but there was still a generally low performance of the models and variation between models as to which variables are important. Investigation of the relationships between median fire size and each variable individually does not show a likely causal link (Figure S14). Again, median fire size in Zone III may be determined by factors not investigated in this study, driven by the interannual variability in those factors or complex interactions between variables. The RF model predicted fire in Zone IV with much higher skill than for any other zones or the national models. In this region, elevated areas, which are perhaps associated with lower moisture due to their higher slope, tended to have larger median fire size (Figure S15).
A striking feature of the models to simulate median fire size is it’s the higher coefficients of determination of the models in Zone IV, while the lower coefficients of determination of the models to simulate median fire size from the national and Zone I–III. In general, although the ability of the models to predict median fire size will be affected by the resolution of the input data [44]; this impact is likely to affect all zones. One aspect that could lead to additional noise and a lower ability to model the northernmost zones compared to Zone IV is the changing scale of the grid square. A 0.5° grid square in northernmost China may be ~7400 km2, while in southernmost China, it is ~11,400 km2: 1.5× the area. This may introduce bias in multiple ways, for example, by increasing the chance that any one fire’s area will be split across multiple grid squares in the north. Additionally, decreasing the number of fires per grid square for which median fire size is calculated may result in higher variability between grid squares in the north compared to the south, compounding the existing tendency for fewer, larger fires in the north [16]. A future study to investigate this scale-dependent effect of changing grid size with latitude could test either even-area grids or calculate whole-fire areas with independent variables taken as the mean over each fire area. The median area also more heavily weights in influencing more spatially and temporally frequent fires, which are likely to be smaller. Again, this could result in a “cleaner” measure of fire area in Zone IV than in the north. Temporal heterogeneity in fire sizes within each grid square could contribute further noise to the data, with the potential to vary between regions. Median fire size may also be more sensitive to variation in climate factors temporally than the other fire regime components studied, for example, being more responsive to a single dry season than may be captured by climate averages of multiple years. Another possible explanation is that threshold effects in the influence of different factors on fire spread, and thus median fire size, vary between ecoregions. In a study on boreal forest of the northeast, Liu et al. [43] found that the most important factors changed from fuel and topography to weather as fire size increased. It may be that Zones I–III have strong threshold effects that affect the ability to model median fire size in these regions, without implementing a sampling technique specific to the issue.

3.3. Comparison to Previous Studies

In agreement with previous studies [20,45,46], the models suggest that the factors influencing forest fire vary between different metrics for modeling forest fire regimes. For occurrence density, climate factors were the biggest overall influence on fire distribution, in agreement with Wu et al. [16]. When comparing the order of importance for the categories of variables, however, both our RF and BRT models subsequently ranked vegetation, topography, and human factors, whereas Wu et al., ranked their importance as human factors, vegetation, then topography. Differences in the topography and vegetation factors between the two studies may have influenced this outcome, as well as the addition of Zone V in Wu et al. [16]. The climate factors included in the studies also varied, making direct comparison difficult. However, it is notable that temperatures were more commonly important factors for predicting occurrence density in this study, especially in Zone I.
Investigating burned area (comparable to burned rate), Ke et al. [18] contrasted regions that roughly correlate with Zones I and II combined vs. Zone III, but used interannual variability data, not averages across all years. They found a strong positive correlation between spring temperature and burned area in Zones I/II, where burning primarily occurs in the spring and fall. In Zone III, where the burned area is largest in the summer, the strongest correlations were still with spring and fall climate factors: a negative correlation with both temperature and precipitation in spring, and a negative correlation with precipitation in the fall [18].
Forest fires in Zone I are more likely to occur with increasing temperature, and are more likely larger and less frequent [15,47]. In spring, if the temperature is high, the phenological period starts earlier, increasing the fuel load and leading to drier and more combustible fuel [15,48]; this was reflected in our results. Zone II was less clear, but the negative relationship between precipitation and fire was among the top predictors of the burned rate. The fire regime components in Zone III were generally difficult for the models to predict, perhaps due to the low sample size with only 0.5% of national fire occurrence found in this zone [16]. Human population density is an important driving factor of fire in this region [3,16,44,49,50]. The general pattern of low precipitation being associated with high burned area held, but for different seasons than found by Ke et al. [18], with annual, summer, and winter precipitation instead of spring and autumn precipitation being most important. The difference in studying 14-year averages rather than interannual data may have affected this outcome.
In contrast to the northern region, the southern regions of Zone IV generally have high mean annual precipitation and high temperatures all year round [51], along with complex terrain and low wind speed. The climate conditions in southern China are affected by the southwest monsoon of the Indian Ocean and southeast monsoon of the Pacific Ocean. When dry periods occur in zone IV, it is more likely that forest fires will occur [15], and they are generally smaller and more frequent than before [52]. Therefore, the southern region of China represents a system that is moisture-dominated [53,54], that is, driven by interactions between temperature and precipitation on fuel dryness. Both temperature and precipitation variables were important in our models for Zone IV. The burned rate sensitivity to high fall temperatures and low fall precipitation in our models may be consistent with sensitivity to dry conditions in the form of locally weaker monsoon conditions or an earlier end to the monsoon rains. However, for occurrence, their influence was more consistent with spring fuel growth rather than subsequent dryness. This is seemingly in contrast to Wu et al.’s [16] finding that maximum summer temperature was a key factor, although we note that maximum summer temperature was not a variable in this study, instead using mean summer temperature. The difference in the relative importance of these two related variables for their predictive capacity in fire models is an interesting area for future study. Wu et al. [16] did, however, find that winter and fall (dry season) precipitation were also important factors.
Finally, we emphasize that our approach reveals patterns of susceptibility correlated with spatial variations in average climate, rather than causation. Atypical conditions, e.g., a failed monsoon, will be necessarily attenuated in terms of both fire regime and predictive variables. If an area is usually wet and warm, it may sustain high vegetation loads such that, in a drought, there is more fuel to burn. The predictors revealed in our models therefore represent associations between fire regime components and the average conditions for each locality. To tease apart the importance of long-term averages vs. variability and transient departures from mean conditions, future studies should investigate the effect of variability in the climate factors on the components of fire regimes in China and also determine the fundamental reasons why the model performance is different between three fire regime components.

4. Conclusions

There is large spatial heterogeneity in forest fire disturbance in China, and this study shows that there is, likewise, spatial variation in which predictors most influence forest fire between ecoregions. At the national level, climate factors are the main variables that influence the spatial heterogeneity of disturbance in terms of fire occurrence density and burned rate, while the relationship with median fire size is less clear. On the regional scale, the patterns of occurrence density and burned rate of forest fires are mainly predicted by temperature variations between cells in the north, with precipitation patterns having a larger role in the south, as well as population density effects in the highly populous Zone III. The median fire size is not well simulated in Zones I–III. Potential scale effects are one avenue of future study to investigate this; another is to investigate whether median fire size is more sensitive to interannual variability in climate variables than to averages. Burned rate may be a better metric for the spatial extent of fire in this kind of study than median fire size. In Zone IV, elevation and temperature variables were associated with greater median fire size.
In order to improve the accuracy of simulation results, future research must account for both regional variation in the influence of the variables predicting forest fire patterns and also variation in which variables impact each of the components of forest fire regimes. The high correlation between climate and forest fire disturbance, in spite of human impacts on the fire regimes, suggests that climate change will influence the frequency and affected area of fire disturbance in China. Due to the heterogeneous impacts of variables between ecoregions and the regional differences in how the climate is predicted to change between regions, the response of China’s forested areas to climate change will be complex. The most valuable scale on which to study the factors that influence fire in China should be further investigated to best predict how climate change will influence future fire regimes.

Supplementary Materials

The following are available online at https://www.mdpi.com/article/10.3390/rs15204946/s1, Figure S1 Comparison between GFA dataset and documentary dataset, Figure S2: The partial dependence plots for national scale occurrence density (RF), Figure S3: The partial dependence plots for Zone I (a) BRT and (b) RF occurrence density, Figure S4: The partial dependence plots for Zone II (a) BRT and (b) RF occurrence density, Figure S5: The partial dependence plots for Zone III occurrence density (RF), Figure S6: The partial dependence plots for Zone IV occurrence density (RF), Figure S7: The partial dependence plots for national scale burned rate(RF), Figure S8: The partial dependence plots for Zone I burned rate (RF), Figure S9: The partial dependence plots for Zone II burned rate (BRT), Figure S10: The partial dependence plots for Zone III burned rate (RF), Figure S11: The partial dependence plots for Zone IV burned rate (RF), Figure S12: The partial dependence plots for national scale median fire size (RF), Figure S13: The partial dependence plots for Zone I median fire size (SVM), Figure S14: The partial dependence plots for Zone III median fire size (RF), Figure S15: The partial dependence plots for Zone IV median fire size (RF).

Author Contributions

Conceptualization, Z.L.; Data curation, Z.L.; Formal analysis, J.S.; Methodology, T.L.F.; Software, J.S.; Supervision, Z.L., W.W., K.J., Y.Y. and T.L.F.; Visualization, K.L. and Q.L.; Writing—original draft, J.S.; Writing—review and editing, Z.L. and T.L.F. All authors have read and agreed to the published version of the manuscript.

Funding

This research was funded by the National Key Research and Development Program of China (funder: Zhihua Liu, No. 2022YFC3003101), the National Natural Science Foundation of China (funder: Lei Fang, NO. 32071583, funder: Yue Yu, NO. 32101328), and the President’s International Fellowship (funder: Tamara L. Fletcher, No. 2019PC0035).

Data Availability Statement

All the data used in this study are publicly available. The Global Fire Atlas is available at the Global Fire Emissions Database (https://www.globalfiredata.org/, accessed on 31 December 2016). The source for all other data is provided in Table 1. Codes to process these data are available upon request.

Acknowledgments

The authors would like to thank Cameron Wilson for assistance with editing.

Conflicts of Interest

The authors declare no conflict of interest.

References

  1. Yang, Y. Changes in Carbon Storage, Plant Diversity and Community Structure of Forests in Daxing’an Mts under Different Fire Rehabilitation Years. Master’s Thesis, Northeast Forestry University, Harbin, China, 2019. [Google Scholar]
  2. Girardin, M.P.; Ali, A.A.; Carcaillet, C.; Blarquez, O.; Hely, C.; Terrier, A.; Genries, A.; Bergeron, Y. Vegetation limits the impact of a warm climate on boreal wildfires. New Phytol. 2013, 199, 1001–1011. [Google Scholar] [CrossRef] [PubMed]
  3. Chen, A.; Tang, R.Y.; Mao, J.F.; Yue, C.; Li, X.R.; Gao, M.D.; Shi, X.Y.; Jin, M.Z.; Ricciuto, D.; Rabin, S.; et al. Spatiotemporal dynamics of ecosystem fires and biomass burning-induced carbon emissions in China over the past two decades. Geogr. Sustain. 2020, 1, 47–58. [Google Scholar] [CrossRef]
  4. McDowell, N.G.; Allen, C.D.; Anderson-Teixeira, K.; Aukema, B.H.; Bond-Lamberty, B.; Chini, L.; Clark, J.S.; Dietze, M.; Grossiord, C.; Hanbury-Brown, A.; et al. Pervasive shifts in forest dynamics in a changing world. Science 2020, 368, eaaz9463. [Google Scholar] [CrossRef] [PubMed]
  5. Andela, N.; Morton, D.C.; Giglio, L.; Chen, Y.; Werf, G.R.V.; Kasibhatla, P.S.; Defries, R.S.; Collatz, G.J.; Hantson, S.; Kloster, S.; et al. A human-driven decline in global burned area. Science 2017, 356, 1356–1362. [Google Scholar] [CrossRef] [PubMed]
  6. IPCC. Special Report on the Ocean and Cryosphere in a Changing Climate; Cambridge University Press: Cambridge, UK; New York, NY, USA, 2019; p. 755. [Google Scholar] [CrossRef]
  7. Burgan, R.; Klaver, R.; Klaver, J. Fuel Models and Fire Potential from Satellite and Surface Observations. Int. J. Wildland Fire 1998, 8, 159–170. [Google Scholar] [CrossRef]
  8. Flannigan, M.D.; Krawchuk, M.A.; Groot, W.J.D.; Wotton, J.D.G.; Gowman, L.M. Implications of changing climate for global wildland fire. Int. J. Wildland Fire 2009, 18, 483–507. [Google Scholar] [CrossRef]
  9. Xu, X.Y.; Jia, G.S.; Zhang, X.Y.; Riley, W.J.; Xue, Y. Climate regime shift and forest loss amplify fire in Amazonian forests. Global Change Biol. 2020, 26, 5874–5885. [Google Scholar] [CrossRef]
  10. Abatzoglou, J.T.; Williams, A.P. Impact of anthropogenic climate change on wildfire across western US forests. Proc. Natl. Acad. Sci. USA 2016, 113, 11770–11775. [Google Scholar] [CrossRef]
  11. Zhang, H.L. Effects of El Nino on forest fires in Northeast China. For. Fire Prev. 2012, 2, 35–38. [Google Scholar]
  12. Ren, J.X.; Xiao, H.J.; Zhang, C. Reviewing on Effects of Continuous Drought on Forest Fire. Inn. Mong. For. Investig. Des. 2013, 140–143. [Google Scholar]
  13. Hurteau, M.D.; Westerling, A.L.; Wiedinmyer, C.; Bryant, B.P. Projected Effects of Climate and Development on California Wildfire Emissions through 2100. Environ. Sci. Technol. 2014, 48, 140203132416003. [Google Scholar] [CrossRef] [PubMed]
  14. Rogers, B.M.; Soja, A.J.; Goulden, M.L.; Randerson, J.T. Influence of tree species on continental differences in boreal fires and climate feedbacks. Nat. Geosci. 2015, 8, 228–234. [Google Scholar] [CrossRef]
  15. Su, Z.W.; Tigabu, M.; Cao, Q.Q.; Wang, G.Y.; Hu, H.Q.; Guo, F.T. Comparative analysis of spatial variation in forest fire drivers between boreal and subtropical ecosystems in China. For. Ecol. Manag. 2019, 454, 117669. [Google Scholar] [CrossRef]
  16. Wu, Z.W.; He, H.S.; Keane, R.E.; Zhu, Z.L.; Wang, Y.Q.; Shan, Y.L. Current and future patterns of forest fire occurrence in China. Int. J. Wildland Fire 2020, 29, 104–119. [Google Scholar] [CrossRef]
  17. Liu, Z.H.; Yang, J.; He, H.S.; Chang, Y. Spatial point analysis of fire occurrence and its influence factor in Huzhong forest area of the Great Xing′an Mountains in Heilongjiang Province, China. Acta Ecol. Sin. 2011, 31, 1669–1677. [Google Scholar]
  18. Ke, H.B.; Gong, S.L.; He, J.J.; Zhou, C.H.; Zhang, L.; Zhou, Y.K. Spatial and temporal distribution of open bio-mass burning in China from 2013 to 2017. Atmos. Environ. 2019, 210, 156–165. [Google Scholar] [CrossRef]
  19. Fu, J.J.; Wu, Z.W.; Yan, S.J.; Zhang, Y.J.; Gu, X.L.; Du, L.H. Effects of climate, vegetation, and topography on spatial patterns of burn severity in the Great Xing’an Mountains. Acta Ecol. Sin. 2020, 40, 1672–1682. [Google Scholar]
  20. Liu, Z.H.; Yang, J.; Chang, Y.; Weisberg, P.J.; He, H.S. Spatial patterns and drivers of fire occurrence and its future trend under climate change in a boreal forest of Northeast China. Global Change Biol. 2012, 18, 2041–2056. [Google Scholar] [CrossRef]
  21. Chao, H.; He, H.S.; Yu, L.; Wu, Z.W.; Hawbaker, T.J.; Gong, P.; Zhu, Z.L. Long-term effects of fire and harvest on carbon stocks of boreal forests in northeastern China. Ann. Sci. 2018, 75, 42. [Google Scholar]
  22. R Core Team. R: A Language and Environment for Statistical Computing; R Foundation for Statistical Computing: Vienna, Austria, 2018. [Google Scholar]
  23. Lan, Z.G.; Su, Z.W.; Guo, M.; Alvarado, E.C.; Guo, F.T.; Hu, H.Q.; Wang, G.Y. Are Climate Factors Driving the Contemporary Wildfire Occurrence in China? Forests 2021, 12, 392. [Google Scholar] [CrossRef]
  24. Wang, X.X.; Di, Z.H.; Li, M.; Yao, Y.J. Satellite-Derived Variation in Burned Area in China from 2001 to 2018 and Its Response to Climatic Factors. Remote Sens. 2021, 13, 1287. [Google Scholar] [CrossRef]
  25. Liu, Z.; Jian, Y. Quantifying ecological drivers of ecosystem productivity of the early-successional boreal Larix gmelinii forest. Ecosphere 2014, 5, 84. [Google Scholar] [CrossRef]
  26. Cooper, L.A.; Ballantyne, A.P.; Holden, Z.A.; Landguth, E.L. Disturbance impacts on land surface temperature and gross primary productivity in the western United States. J. Geophys. Res. Biogeosciences 2017, 122, 930–946. [Google Scholar] [CrossRef]
  27. Karatzoglou, A.; Smola, A.; Hornik, K.; Zeileis, A. kernlab—An S4 Package for Kernel Methods in R. J. Stat. Softw. 2004, 11, 1–20. [Google Scholar] [CrossRef]
  28. Alexandros, K.; Smola, A.; Hornik, K. Kernlab: Kernel-Based Machine Learning Lab. 2018. Available online: https://CRAN.R-project.org/package=kernlab (accessed on 31 January 2023).
  29. Elith, J.; Leathwick, J.R.; Hastie, T. A working guide to boosted regression trees. J. Anim. Ecol. 2008, 77, 802–813. [Google Scholar] [CrossRef] [PubMed]
  30. Young, A.M.; Higuera, P.E.; Duffy, P.A.; Hu, F.S. Climatic thresholds shape northern high-latitude fire regimes and imply vulnerability to future climate change. Ecography 2016, 40, 606–617. [Google Scholar] [CrossRef]
  31. Liu, Z. Effects of climate and fire on short-term vegetation recovery in the boreal larch forests of Northeastern China. Sci. Rep. 2016, 6, 37572. [Google Scholar] [CrossRef]
  32. Liu, Z.H.; Wimberly, M.C. Climatic and Landscape Influences on Fire Regimes from 1984 to 2010 in the Western United States. PLoS ONE 2015, 10, e0140839. [Google Scholar] [CrossRef]
  33. Breiman, L. Random forests. Mach. Learn. 2001, 45, 5–32. [Google Scholar] [CrossRef]
  34. Ying, L.X.; Han, J.; Du, Y.S.; Shen, Z.H. Forest fire characteristics in China: Spatial patterns and determinants with thresholds. For. Ecol. Manag. 2018, 424, 345–354. [Google Scholar] [CrossRef]
  35. Guo, F.; Zhang, L.; Jin, S.; Tigabu, M.; Su, Z.; Wang, W. Modeling Anthropogenic Fire Occurrence in the Boreal Forest of China Using Logistic Regression and Random Forests. Forests 2016, 7, 250. [Google Scholar] [CrossRef]
  36. Parks, S.A.; Holsinger, L.M.; Koontz, M.J.; Collins, L.; Whitman, E.; Parisien, M.A.; Loehman, R.A.; Barnes, J.L.; Bourdon, J.F.; Boucher, J.; et al. Giving Ecological Meaning to Satellite-Derived Fire Severity Metrics across North American Forests. Remote Sens. 2019, 11, 1735. [Google Scholar] [CrossRef]
  37. Vapnik, V.N. The Nature of Statistical Learning Theory; Springer: Berlin/Heidelberg, Germany, 1995. [Google Scholar]
  38. Mustafa, A.; Rienow, A.; Saadi, I.; Cools, M.; Teller, J. Comparing support vector machines with logistic regression for calibrating cellular automata land use change models. Eur. J. Remote Sens. 2018, 51, 391–401. [Google Scholar] [CrossRef]
  39. Eskandari, S.; Pourghasemi, H.R.; Tiefenbacher, J.P. Relations of land cover, topography, and climate to fire occurrence in natural regions of Iran: Applying new data mining techniques for modeling and mapping fire danger. For. Ecol. Manag. 2020, 473, 118338. [Google Scholar] [CrossRef]
  40. Greenwell, B.M.; Boehmke, B.C.; Mccarthy, A.J. A Simple and Effective Model-Based Variable Importance Measure. arXiv 2018, arXiv:2018:1805.04755. [Google Scholar]
  41. Potter, S.; Solvik, K.; Erb, A.; Goetz, S.J.; Johnstone, J.F.; Mack, M.C.; Randerson, J.T.; Roman, M.O.; Schaaf, C.L.; Turetsky, M.R.; et al. Climate change decreases the cooling effect from postfire albedo in boreal North America. Global Change Biol. 2020, 26, 1592–1607. [Google Scholar] [CrossRef]
  42. Greenwell, B. pdp: Partial Dependence Plots. R J. 2017, 9, 421–436. Available online: https://journal.r-project.org/archive/2017/RJ-2017-016/index.html (accessed on 19 October 2021). [CrossRef]
  43. Liu, Z.; Yang, J.; He, H.S. Identifying the Threshold of Dominant Controls on Fire Spread in a Boreal Forest Landscape of Northeast China. PLoS ONE 2013, 8, e55618. [Google Scholar] [CrossRef]
  44. Hantson, S.; Lasslop, G.; Kloster, S.; Chuvieco, E. Anthropogenic effects on global mean fire size. Int. J. Wildland Fire 2015, 5, 589–596. [Google Scholar] [CrossRef]
  45. Ganteaume, A.; Camia, A.; Jappiot, M.; Ayanz, J.S.M.; Fournel, M.L.; Lampin, C. A Review of the Main Driving Factors of Forest Fire Ignition Over Europe. Environ. Manag. 2013, 51, 651–662. [Google Scholar] [CrossRef]
  46. Hu, T.; Zhou, G.S. Drivers of lightning- and human-caused fire regimes in the Great Xing’an Mountains. For. Ecol. Manag. 2014, 329, 49–58. [Google Scholar] [CrossRef]
  47. Chang, Y.; He, H.S.; Bishop, I.; Hu, Y.M.; Bu, R.C.; XU, C.G.; Li, X.Z. Long-term forest landscape responses to fire exclusion in the Great Xing’an Mountains, China. Int. J. Wildland Fire 2007, 16, 34–44. [Google Scholar] [CrossRef]
  48. Jiao, L.L.; Chang, Y.; Shen, D.; Hu, Y.M.; Li, C.L.; Ma, J. Using boosted regression trees to analyze the factors affecting the spatial distribution pattern of wildfire in China. Chin. J. Ecol. 2015, 34, 2288–2296. [Google Scholar]
  49. Guo, F.T.; Su, Z.W.; Wang, G.Y.; Sun, L.; Tigabu, M.; Yang, X.J.; Hu, H.Q. Understanding fire drivers and relative impacts in different Chinese forest ecosystems. Sci. Total Environ. 2017, 605, 411–425. [Google Scholar] [CrossRef]
  50. Abatzoglou, J.T.; Williams, A.P.; Boschetti, L.; Zubkova, M.; Kolden, C.A. Global patterns of interannual climate–fire relationships. Global Change Biol. 2018, 24, 5164–5175. [Google Scholar] [CrossRef]
  51. Li, D.-H. A study of class division of meteorological forest fire risk at Xishuangbanna. J. Yunnan Univ. (Nat. Sci. Ed.) 2011, 33, 49–54. [Google Scholar]
  52. Andela, N.; Morton, D.C.; Giglio, L.; Paugam, R.; Chen, Y.; Hantson, S.; Werf, G.R.V.D.; Randerson, J.T. The Global Fire Atlas of individual fire size, duration, speed, and direction. Earth Syst. Sci. Data 2018, 11, 529–552. [Google Scholar] [CrossRef]
  53. Zubkova, M.; Boschetti, L.; Abatzoglou, J.T.; Giglio, L. Changes in Fire Activity in Africa from 2002 to 2016 and Their Potential Drivers. Geophys. Res. Lett. 2019, 46, 7643–7653. [Google Scholar] [CrossRef]
  54. Jiao, L.L.; Chang, Y.; Hu, Y.M.; Wang, X.L. Spatial and temporal distribution patterns of wildfires in China based on MODIS data. Chin. J. Ecol. 2014, 33, 1351–1358. [Google Scholar]
Figure 1. Spatial distribution of forest fire in China by year. The roman letters in the map indicate the eight ecoregions according to climate zone (see method): (I) cold temperate deciduous coniferous forest area; (II) temperate coniferous and broad-leaved mixed forest area; (III) warm temperate deciduous broad-leaved forest area; (IV) subtropical evergreen broad-leaved forest area; (V) tropical seasonal rainforest and rainforest area; (VI) temperate grassland area; (VII) temperate desert area; (VIII) alpine vegetation area of the Qinghai Tibetan Plateau.
Remotesensing 15 04946 g001
Figure 2. Spatial distribution of forest fire regime components in China (GFA): (a) geographic distribution of occurrence density of fire across China (see bottom right for color scale; fires/1000 km2 year−1) and density plot by ecozone (top right); (b) geographic distribution of burned rate across China (details of panel as above; km2/1000 km2 year−1); (c) geographic distribution of median fire size across China (details of panel as above; km2).
Remotesensing 15 04946 g002
Figure 3. (a) The observed vs. predicted values for the model that best predicted occurrence density for all of China (RF), as determined by the highest R2 and p < 0.05; (b) the relative influence of the most important independent variables in the RF model.
Remotesensing 15 04946 g003
Figure 4. The observed vs. predicted values for the models that best predicted occurrence density, as determined by highest R2 and p < 0.05, for (a) Zone I (BRT); (c) Zone I (RF); (e) Zone II (BRT); (g) Zone II (RF). These are paired with the relative influence of the most important variables in the model for (b) Zone I (BRT); (d) Zone I (RF); (f) Zone II (BRT); (h) Zone II (RF).
Remotesensing 15 04946 g004
Figure 5. The observed vs. predicted values for the models that best predicted occurrence density, as determined by the highest R2 and p < 0.05, for (a) Zone III (RF); (c) Zone IV (RF). These are paired with the relative influence of the most important independent variables in the model for (b) Zone III (RF); (d) Zone IV (RF).
Remotesensing 15 04946 g005
Figure 6. (a) The observed vs. predicted values for the model that best predicted burned rate for all of China (RF), as determined by the highest R2 and p < 0.05; (b) the relative influence of the most important independent variables in the RF model for all of China (RF).
Remotesensing 15 04946 g006
Figure 7. The observed vs. predicted values for the model that best predicted burned rate, as determined by the highest R2 and p < 0.05, for (a) Zone I (RF); (c) Zone II (BRT); (e) Zone III (RF); (g) Zone IV (RF). These are paired with the relative influence of the most important independent variables in the model for (b) Zone I (RF); (d) Zone II (BRT); (f) Zone III (RF); (h) Zone IV (RF).
Remotesensing 15 04946 g007
Figure 8. The observed vs. predicted values for the model that best predicted median fire area, as determined by the highest R2 and p ≤ 0.05, for (a) all of China (RF); (c) Zone I (SVM); (e) Zone III (RF); (g) Zone IV (RF). These are paired with the relative influence of the most important independent variables in the model for (b) all of China (RF); (d) Zone I (SVM); (f) Zone III (RF); (h) Zone IV (RF). Note: no model was able to skillfully (adequate p-value and R2) predict median fire size in Zone II.
Remotesensing 15 04946 g008
Table 1. Independent variables and sources.
Variable GroupVariablesAbbreviationResolutionUnits
Climate 1Annual Palmer Drought Severity Index (PDSI)PDSIAnnMonthly temporal and 4 km spatialIndex (−4–+4)
Mean PDSI in spring, summer, fall, and winterPDSISpr, PDSISum, PDSIFal, PDSIWin
Annual precipitation accumulation (PPT)PptAnnmm
Mean PPT in spring, summer, fall, and winterPptSpr, PptSum, PptFal, PptWin
Annual soil moistureSoilAnnm3/m3
Mean soil moisture in spring, summer, fall, and winterSoilSpr, SoilSum, SoilFal, SoilWin
Annual temperature (average of maximum and minimum temperatures)TmeanAnn°C
Mean temperature in spring, summer, fall, and winterTmeanSpr, TmeanSum, TmeanFal, TmeanWin
AnthropogenicPopulation density 2PopDen30 arc-seconds (year 2010)Persons/km2
Road density 3RdDen5 arc-minm/km2
Distance to nearest road 3Dist2Rd1 kmkm
Topography 4Digital elevation modelDem1 kmm
SlopeSlope°
Potential solar radiationRadIndex (0–1)
Vegetation 5Annual integrated Normalized Difference Vegetation Index (NDVI)ndvi_ANNMonthly temporal and 0.05° spatialIndex (0–1)
Mean NDVI in spring, summer, fall, winterndvi_spr, ndvi_sum, ndvi_fal, ndvi_Win
Percent evergreen needleleaf forests, percent evergreen broadleaf forests, percent deciduous needleleaf forests, percent deciduous broadleaf forests, percent mixed forestsPctLC1, PctLC2, PctLC3, PctLC4, PctLC5%
Percent forestsPctLC
1 Terra climate: http://www.climatologylab.org/terraclimate.html, accessed on 31 December 2020; 2 https://sedac.ciesin.columbia.edu/data/set/gpw-v4-population-density-rev11, accessed on 31 December 2020; 3 https://www.globio.info/download-grip-dataset, accessed on 12 November 2010; 4 Global Land One-kilometer Base Elevation (GLOBE) Digital Elevation Model: https://www.ngdc.noaa.gov/mgg/topo/gltiles.html, accessed on 12 November 2020; 5 MOD13C2.V006: https://lpdaac.usgs.gov/data/, accessed on 31 January 2023.
Disclaimer/Publisher’s Note: The statements, opinions and data contained in all publications are solely those of the individual author(s) and contributor(s) and not of MDPI and/or the editor(s). MDPI and/or the editor(s) disclaim responsibility for any injury to people or property resulting from any ideas, methods, instructions or products referred to in the content.

