

Utilizing Ground-Penetrating Radar for Water Leak Detection and Pipe Material Characterization in Environmental Studies: A Case Study
 , ,
, ,  , ,
, , 
Abstract
: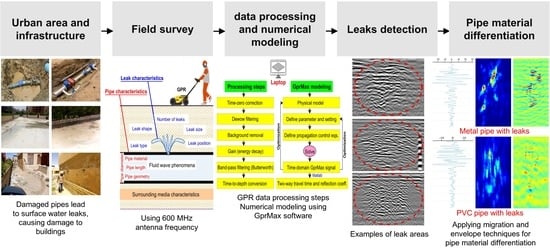
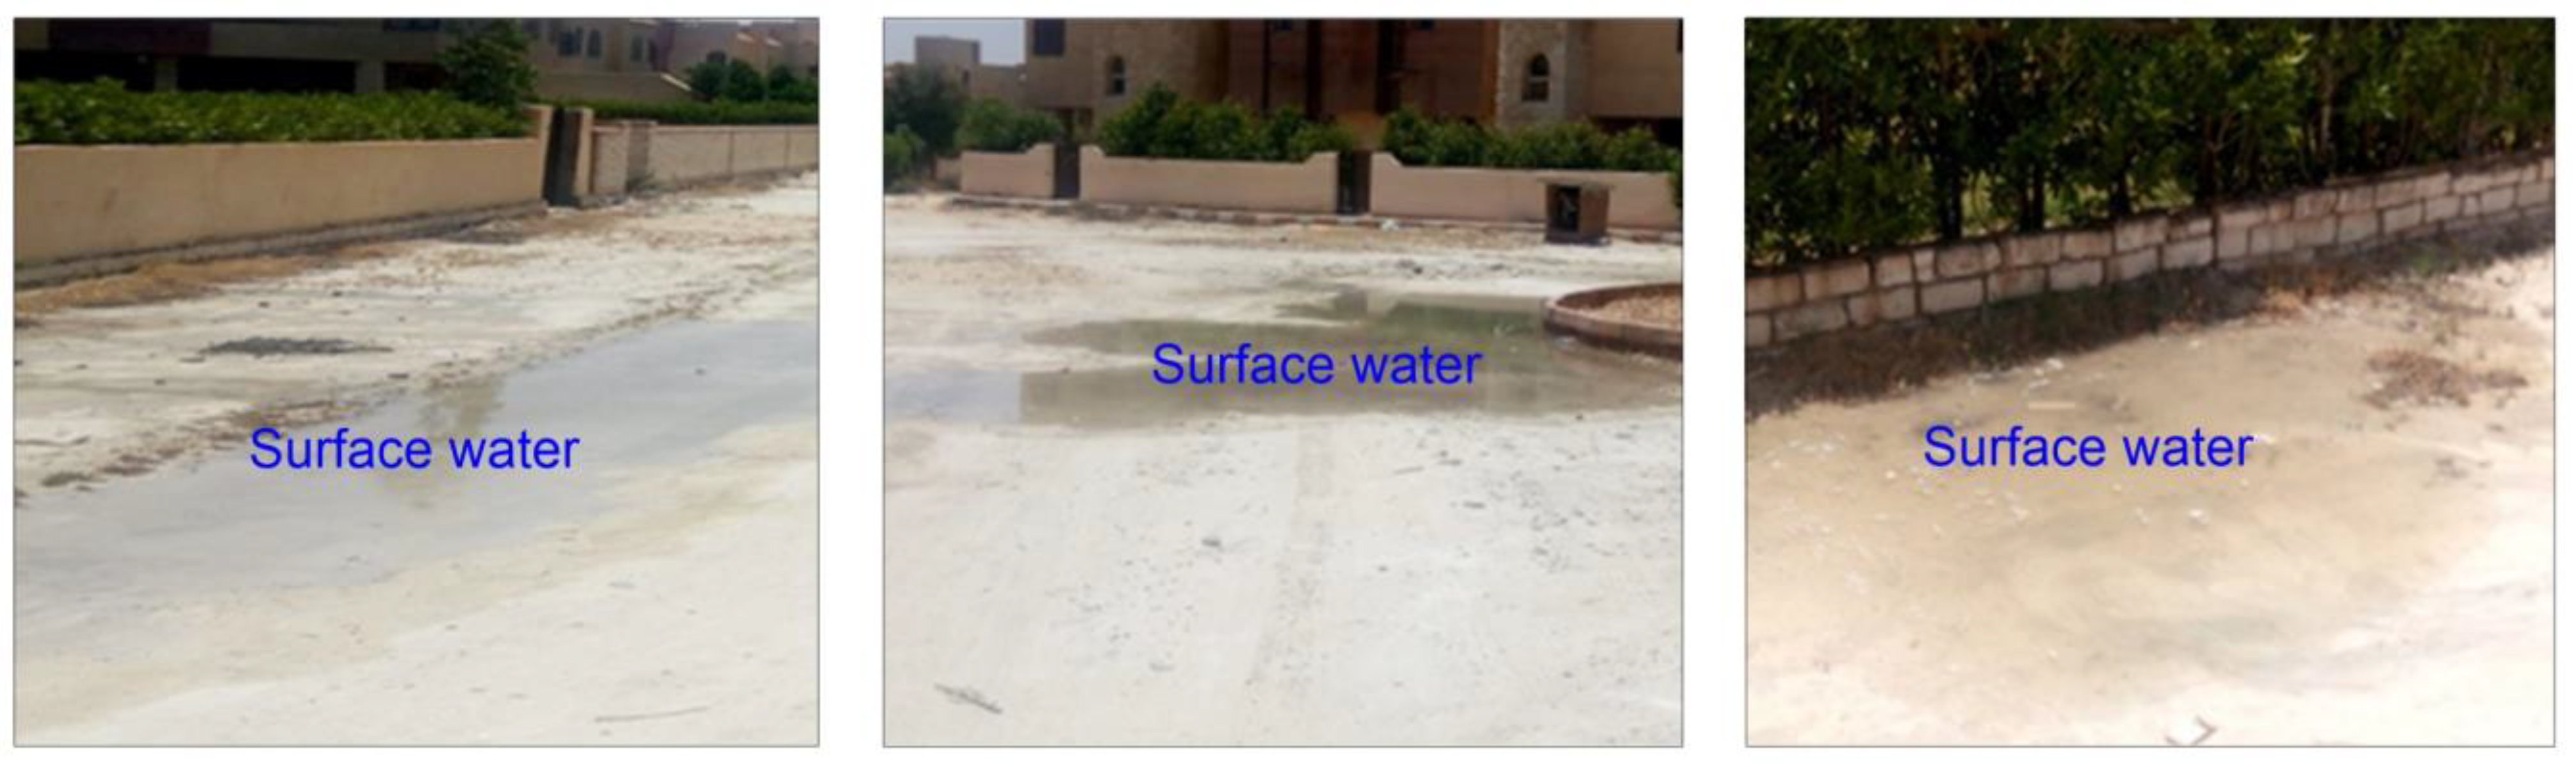
1. Introduction
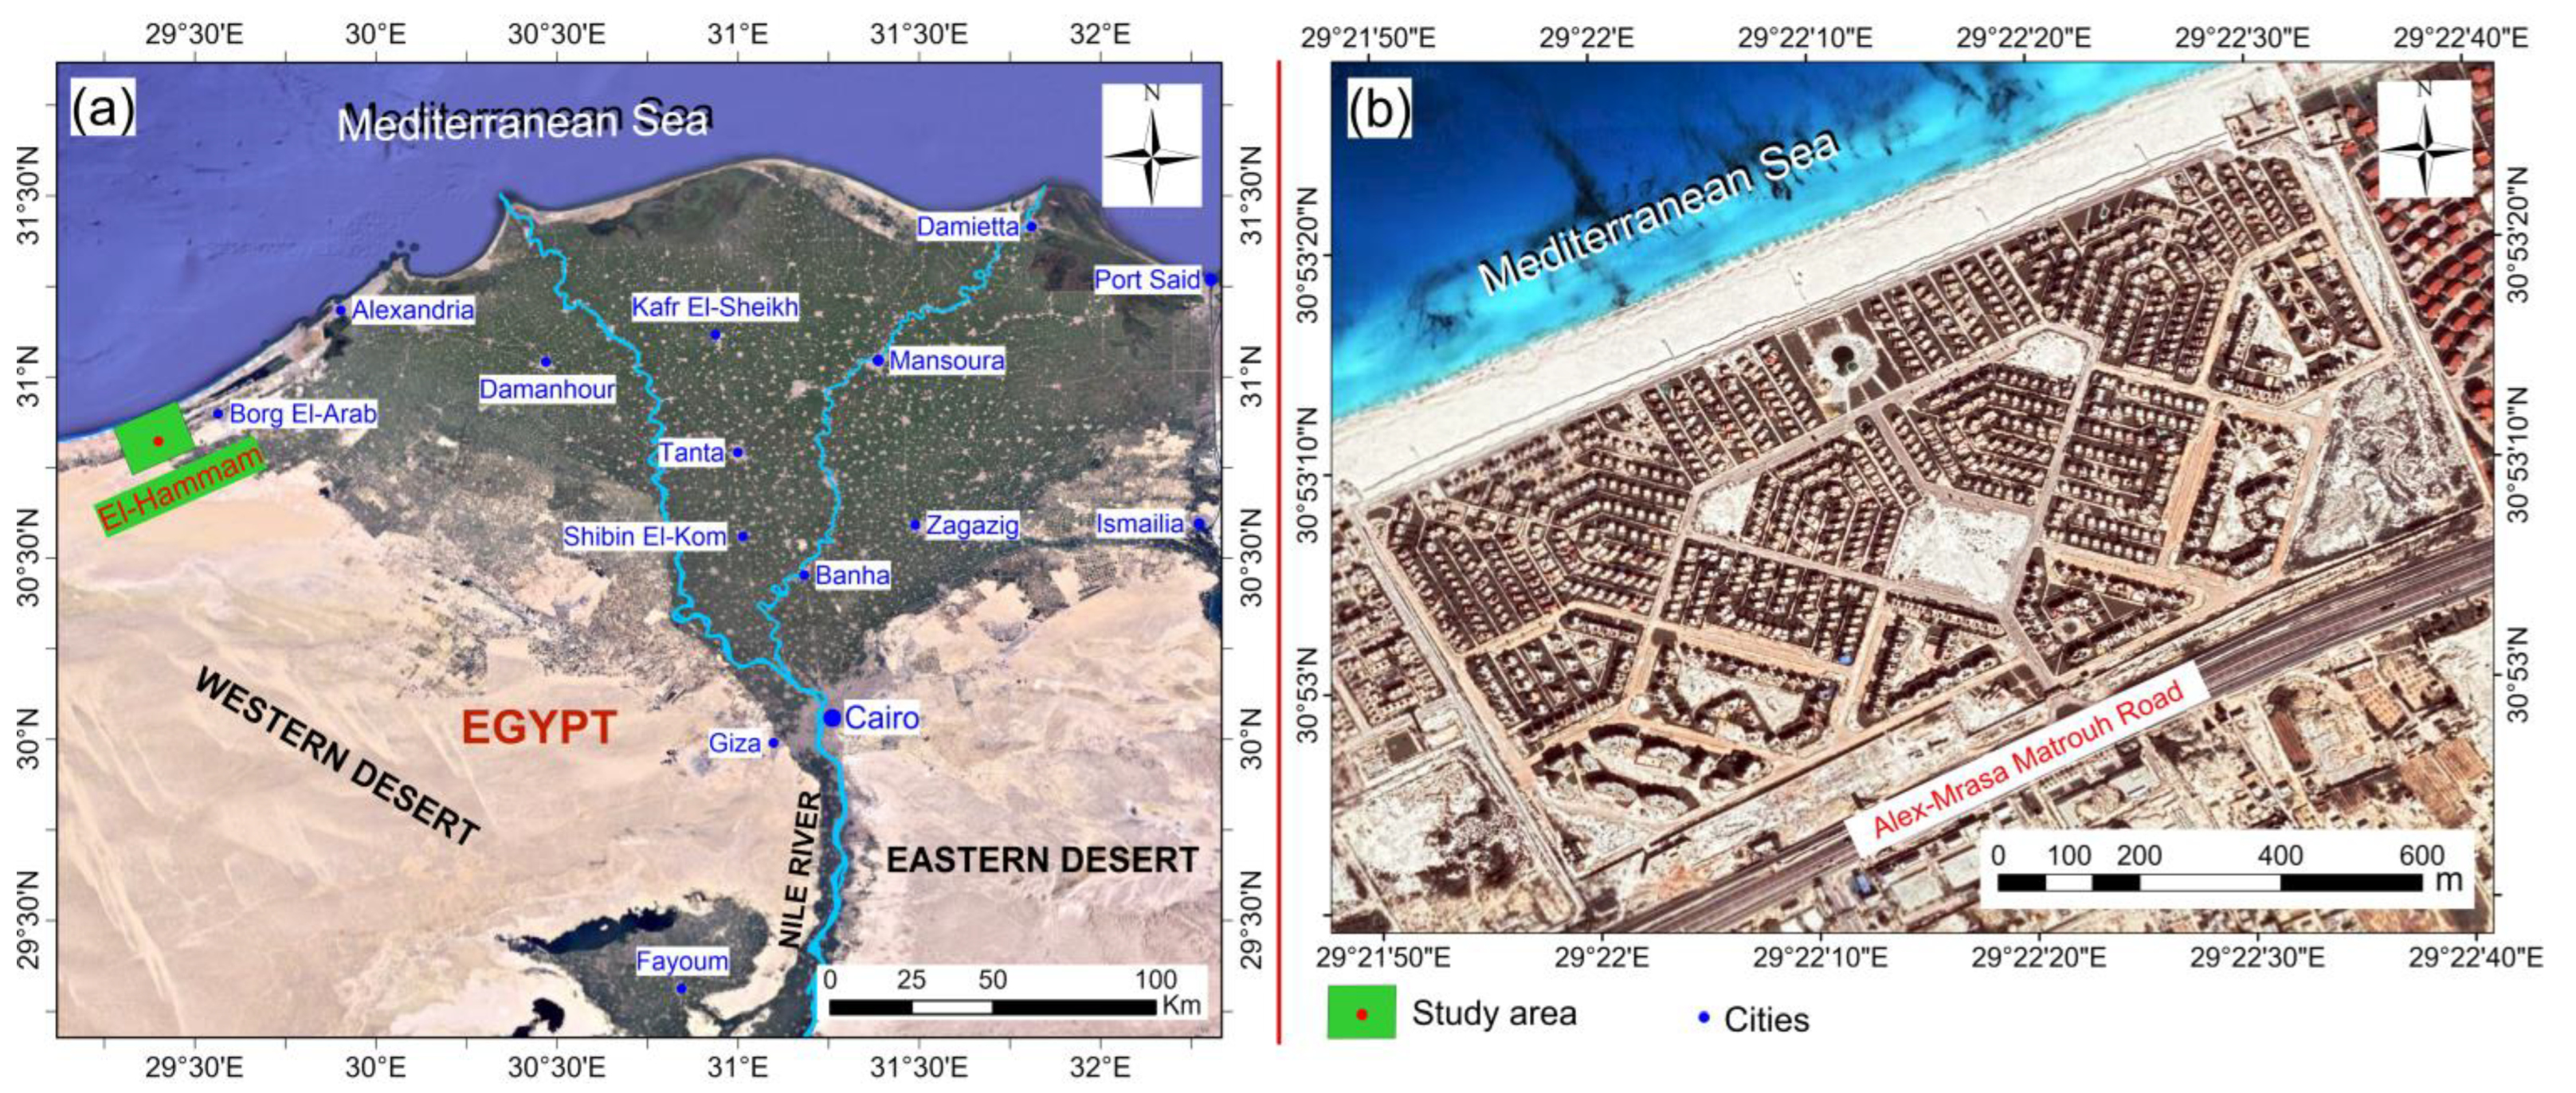
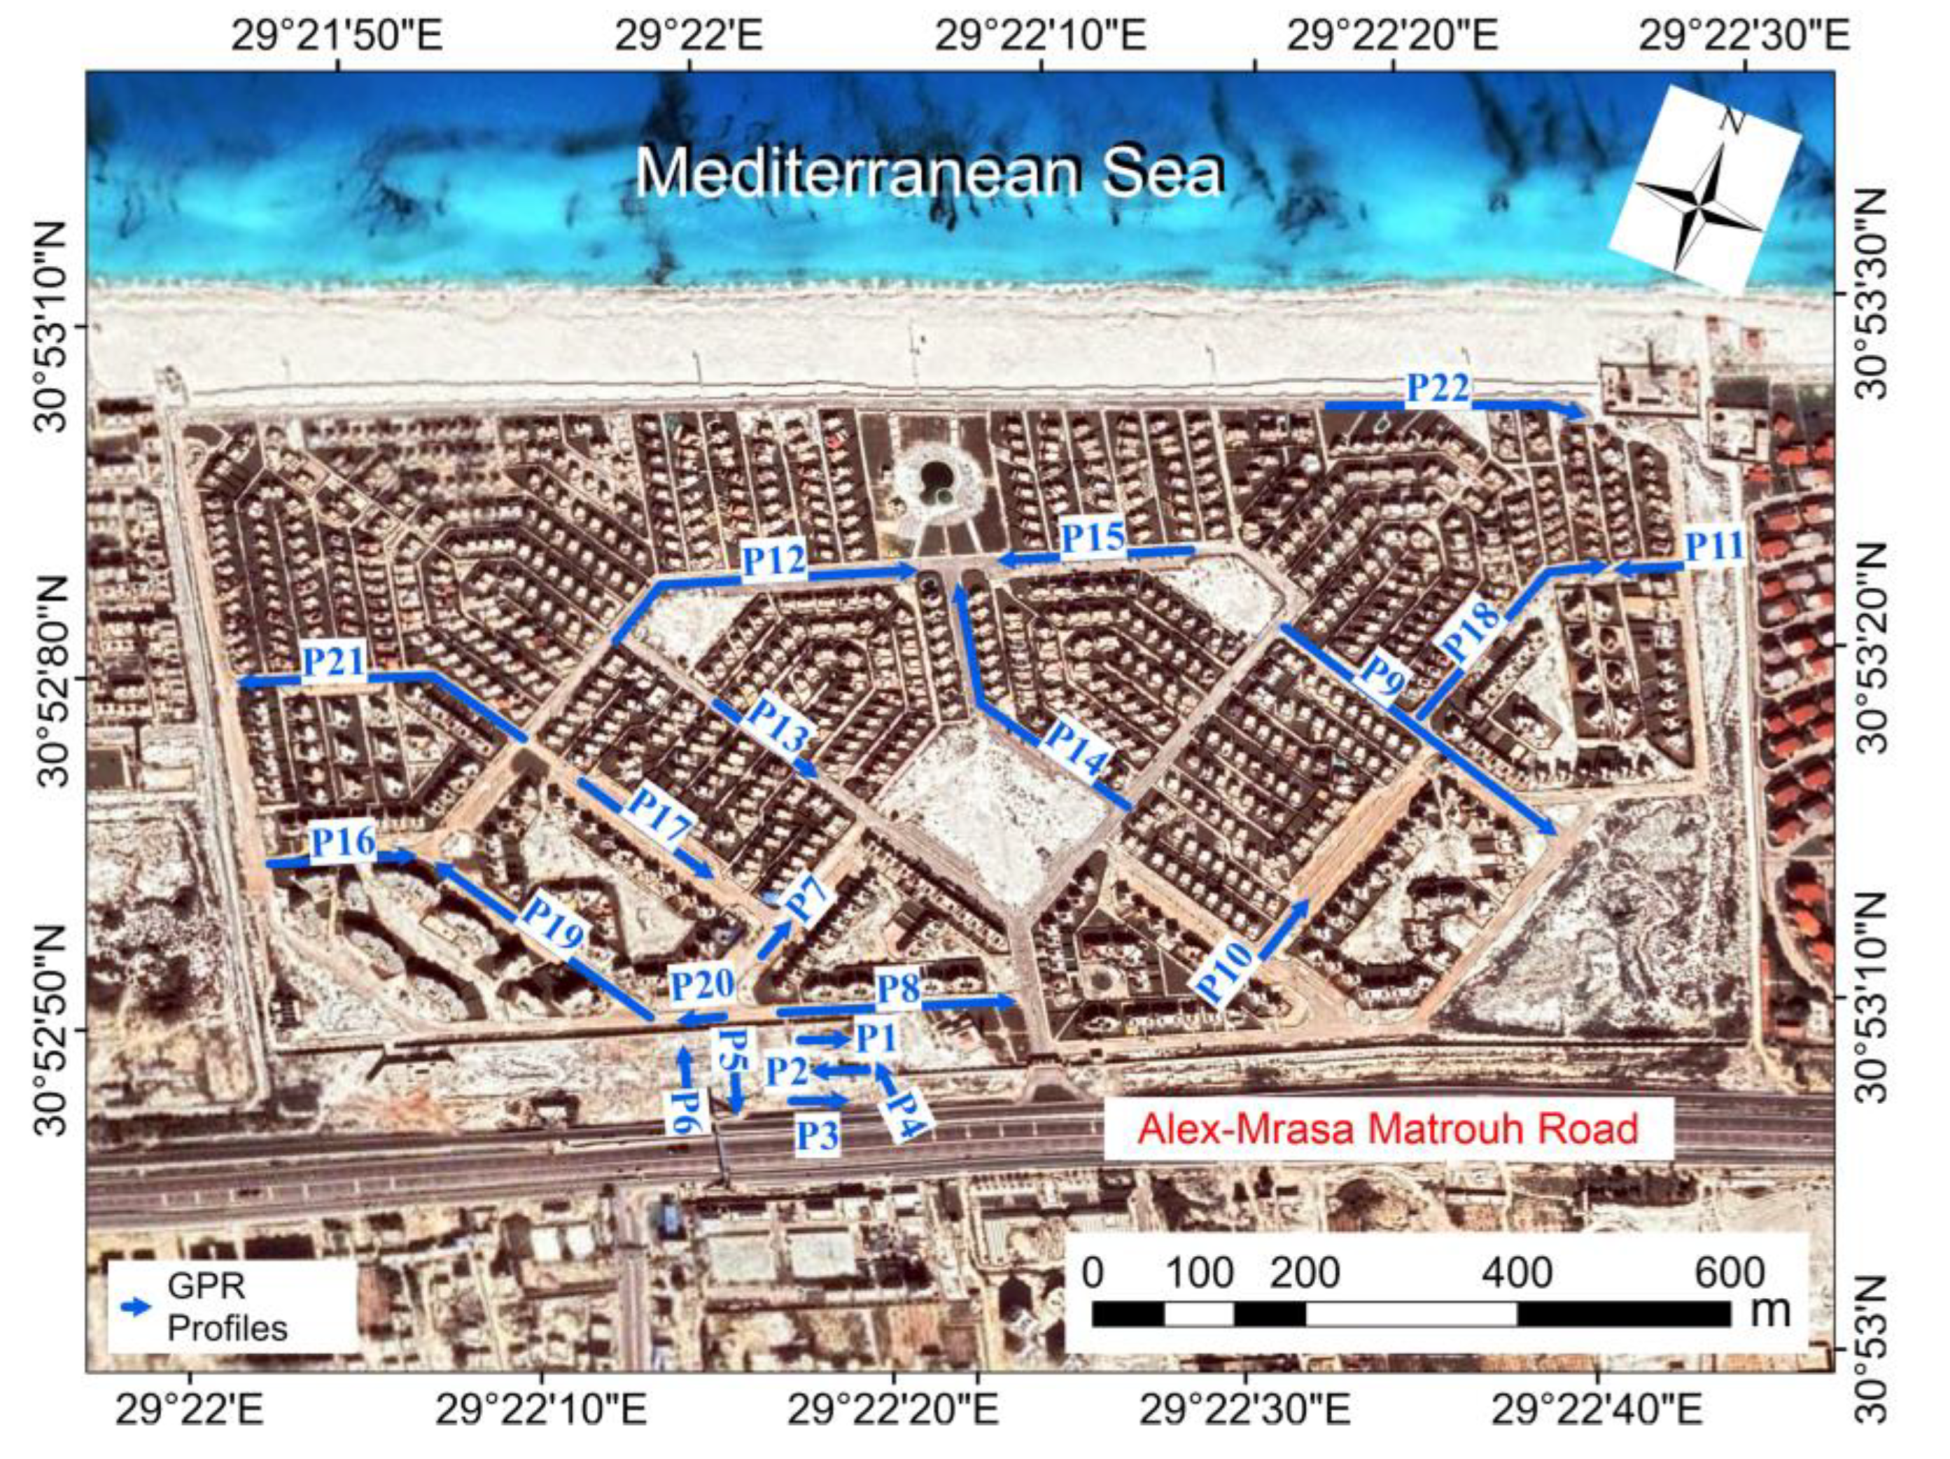
1.1. Study Area
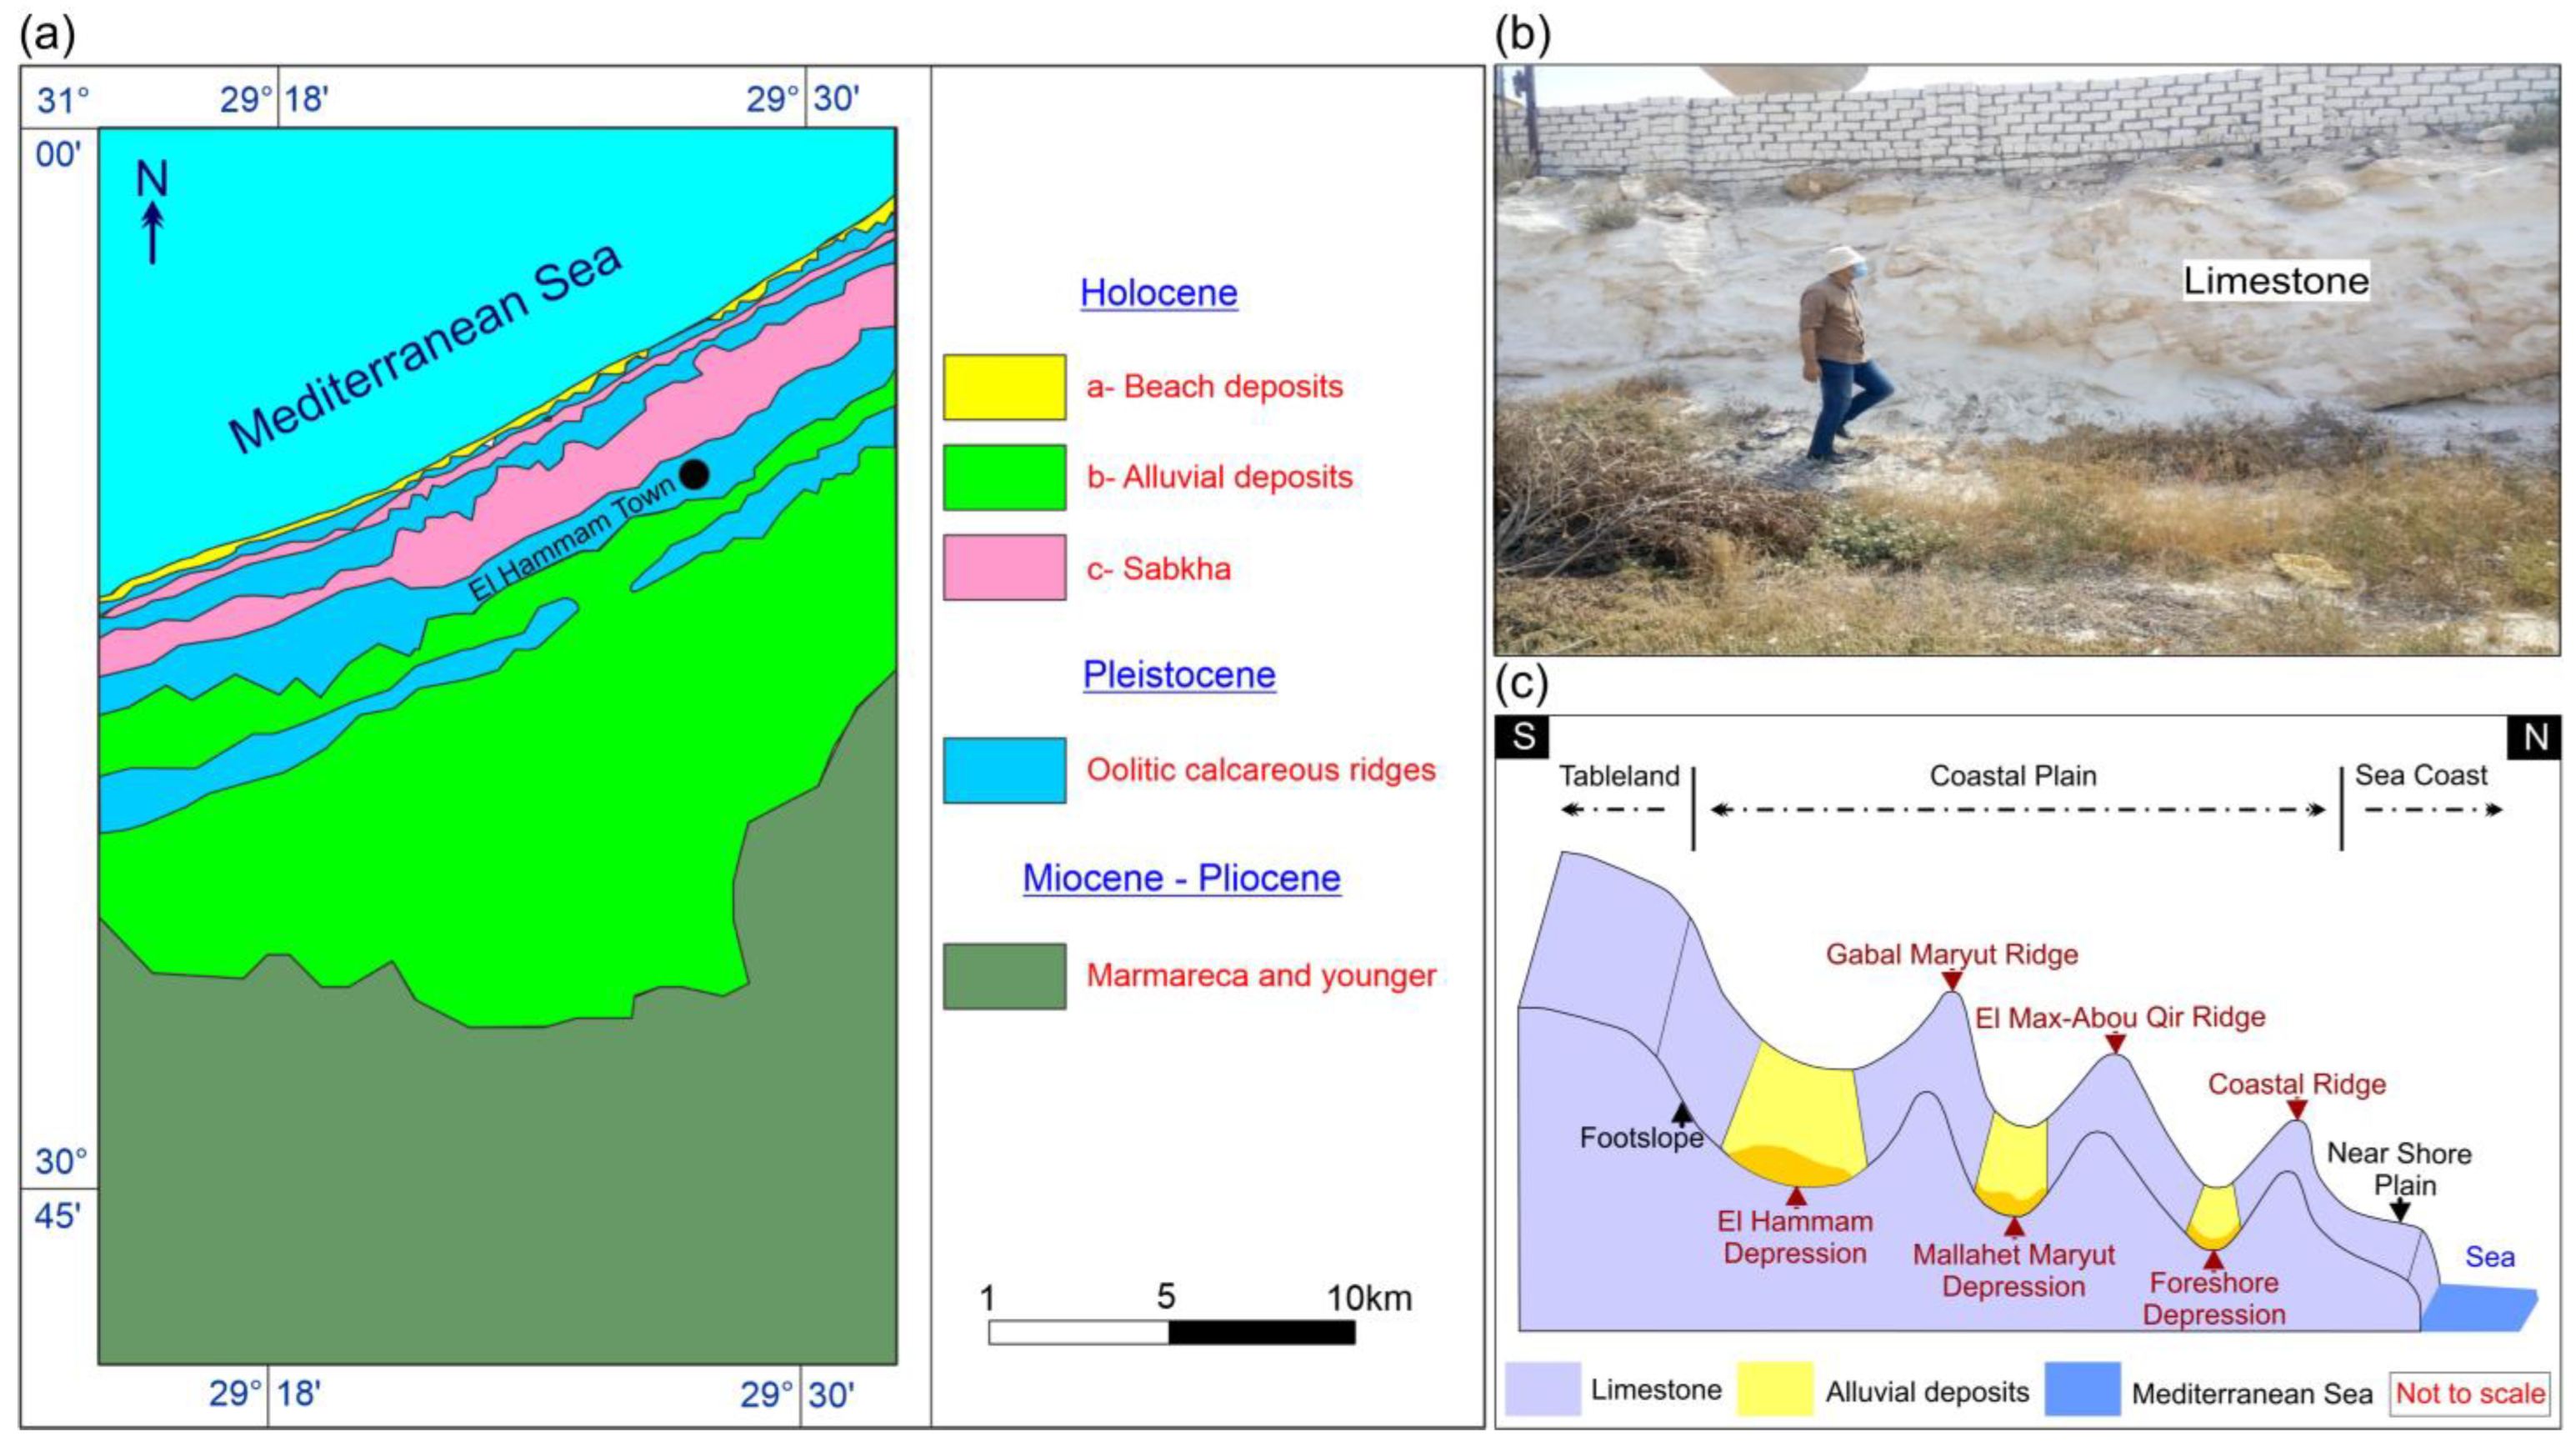
1.2. Geological and Geomorphological Setting

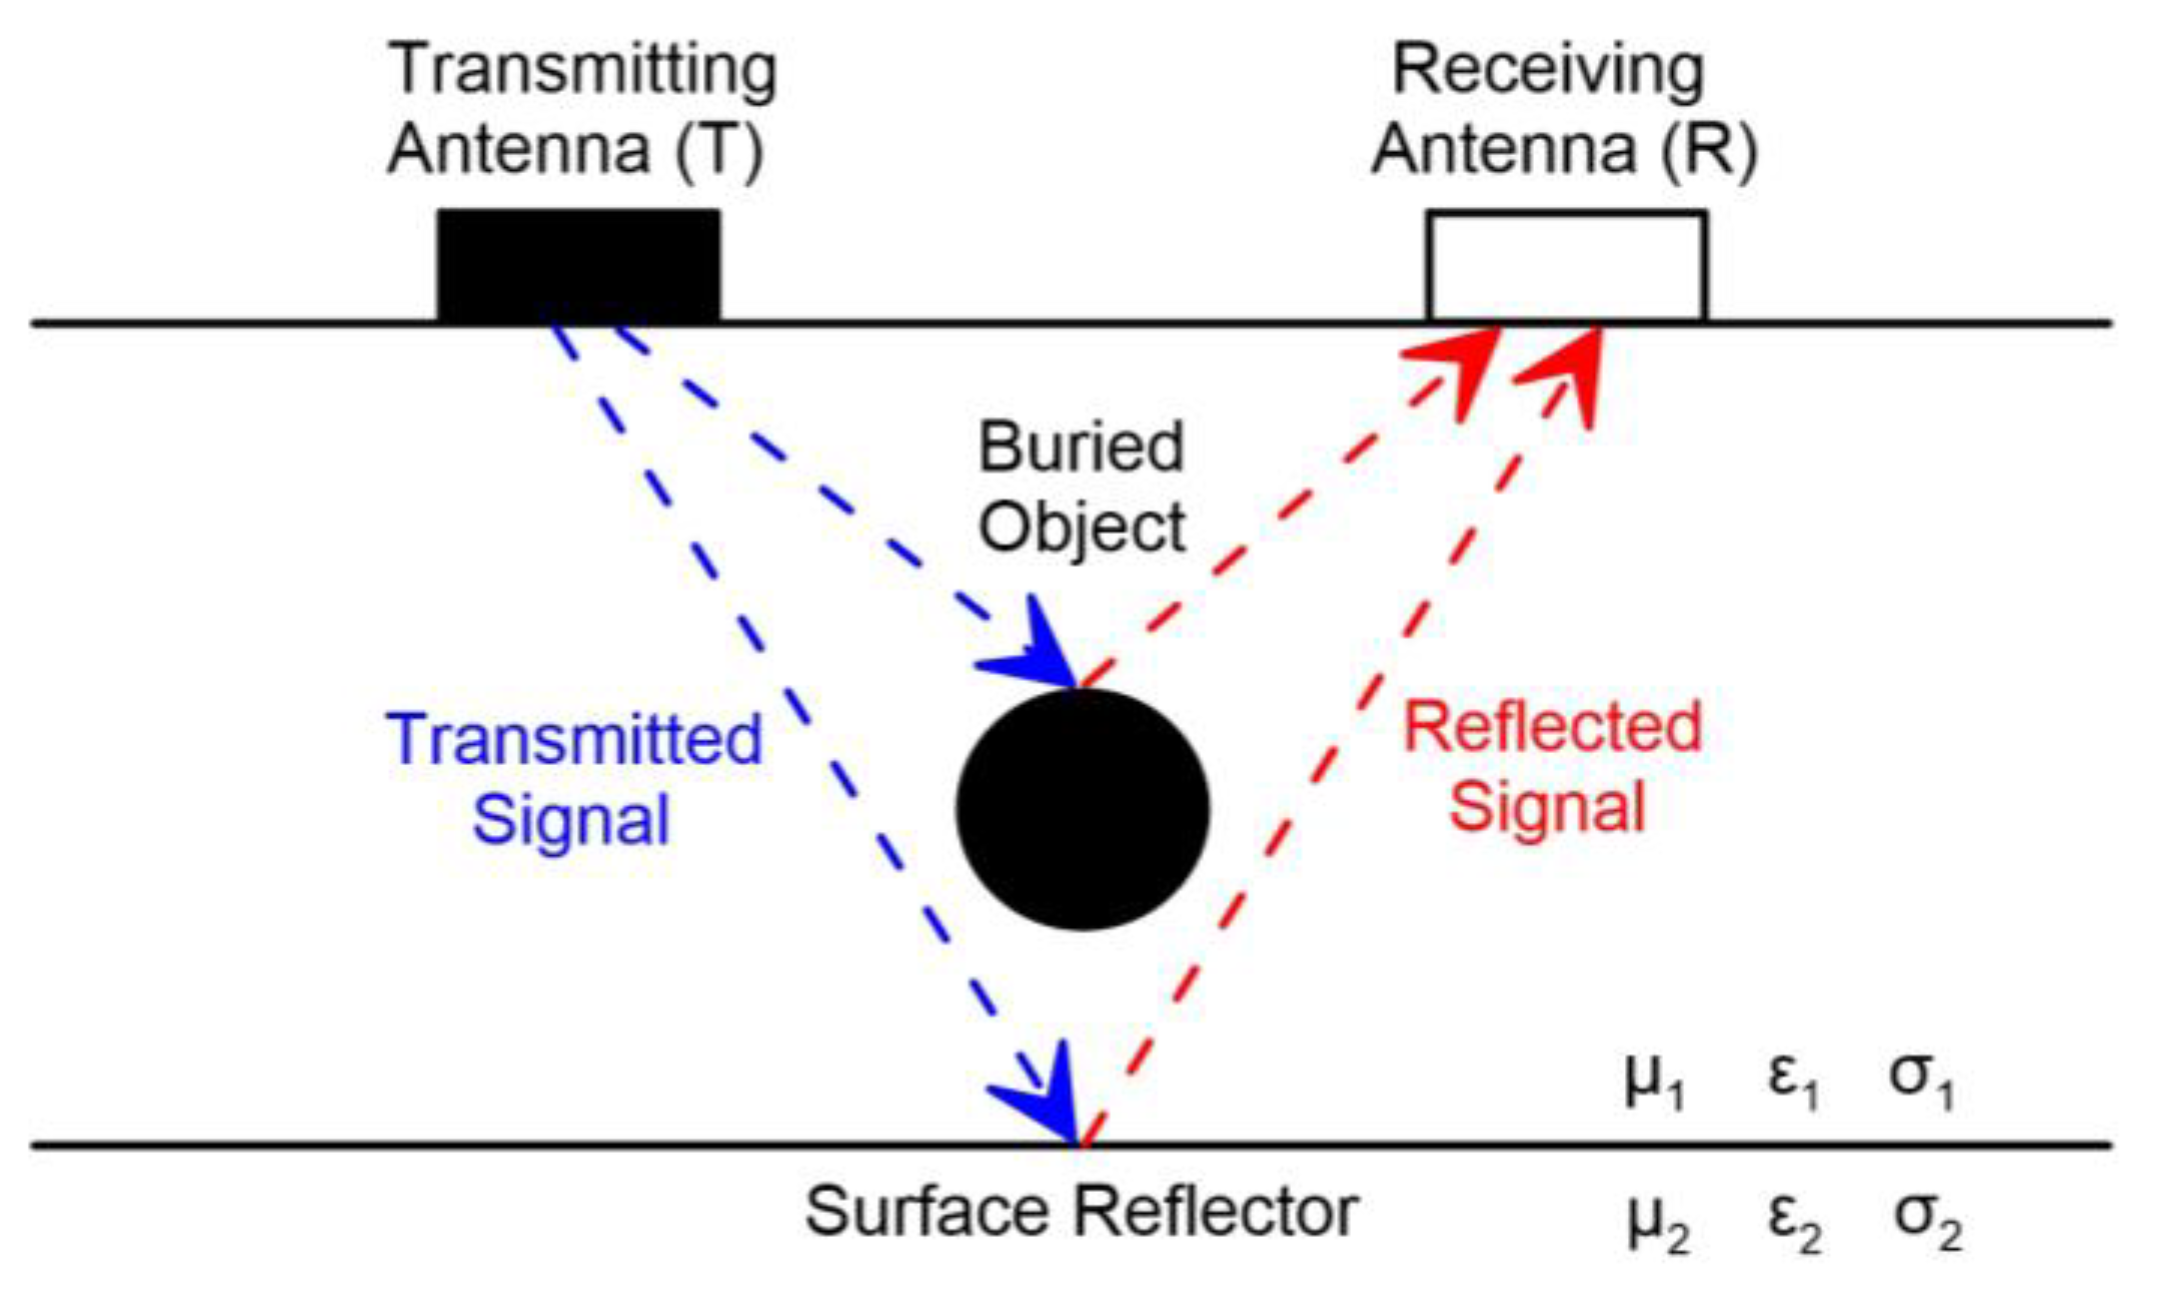
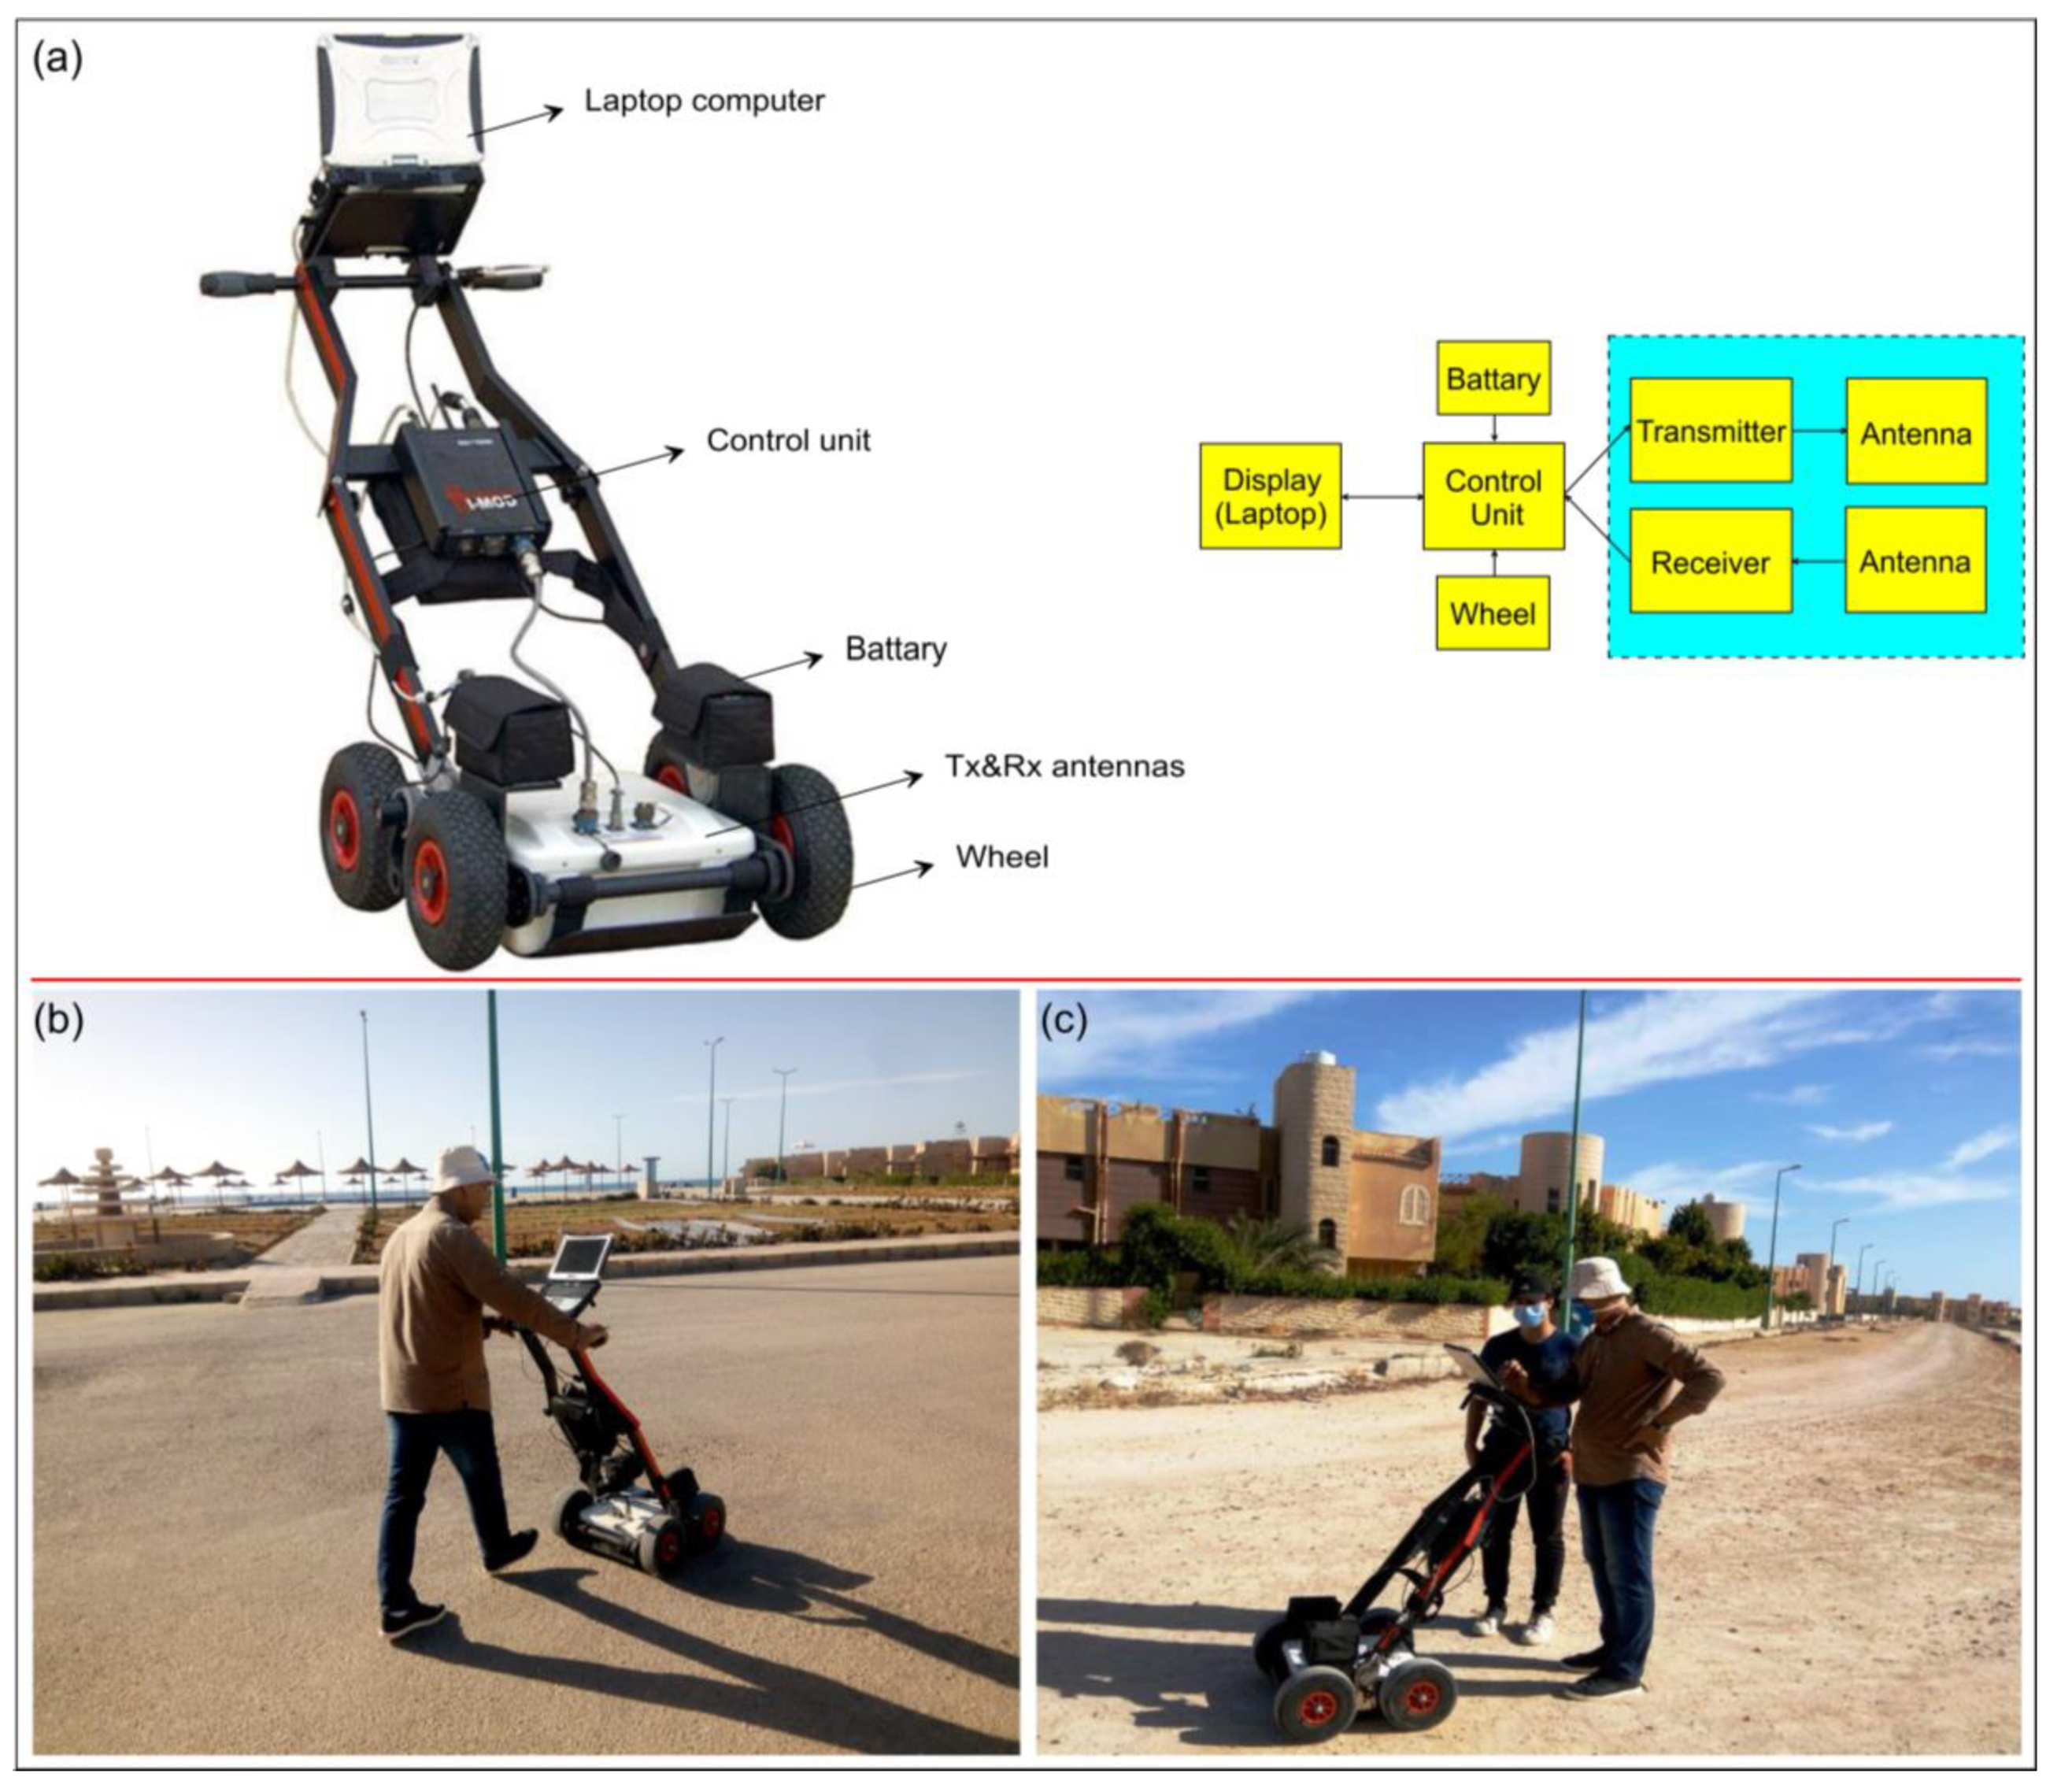
2. Materials and Methods
- Time-zero correction is the first step in processing GPR data, which involves adjusting traces to a common time-zero position [57]. This correction is necessary due to factors such as thermal drift, electronic instability, cable length differences, and variations in the antenna air gap, which can cause “jumps” in the air/ground wavelet’s first arrival time [60].
- Dewow filtering is a common processing step that uses temporal filtering to remove the data’s DC signal and low-frequency components, resulting in a mean zero level [61].
- Background removal is a frequently used step in GPR data processing that involves applying a high-pass filter or average trace removal as a form of spatial filtering. This technique helps to eliminate background noise and enhance weaker signals to become more visible in the processed section. In this process, the mean of all traces in a section is calculated and subtracted from each trace, which is particularly useful for reducing antenna ringing [61].
- Gain (energy decay) is one of the processing steps applied to GPR data. In subsurface exploration using radar signals, it becomes harder to distinguish events at greater depths due to rapid signal attenuation [61]. So, this step aims to enhance later arrivals by compensating for the energy loss that occurs during signal propagation through the subsurface, such as spherical divergence and intrinsic and scattering attenuation [62].
- Band-pass filtering (Butterworth) is commonly used to eliminate noise caused by human or system interference and enhance the visual clarity of GPR data (e.g., the removal of high-frequency “speckle” from radio transmissions or the striping effect from antenna ringing [60,62]). It consists of a combination of high-pass and low-pass filters that allow frequencies on either side of the peak frequency of the transmitted signal to pass through [63].
- Time-to-depth conversion is an important processing step for realistic interpretations and elevation corrections of GPR data. It is necessary to convert two-way travel time to depth in the GPR sections to help determine the target’s depth. This step requires an accurate estimate of the subsurface velocity, which can be obtained through ground-truthing, common midpoint surveys (CMPs), or hyperbolic velocity analysis [62]. This study used the constant velocity based on ground truthing, precisely 0.12 m/ns, to account for limestone outcrops in the study area [64].
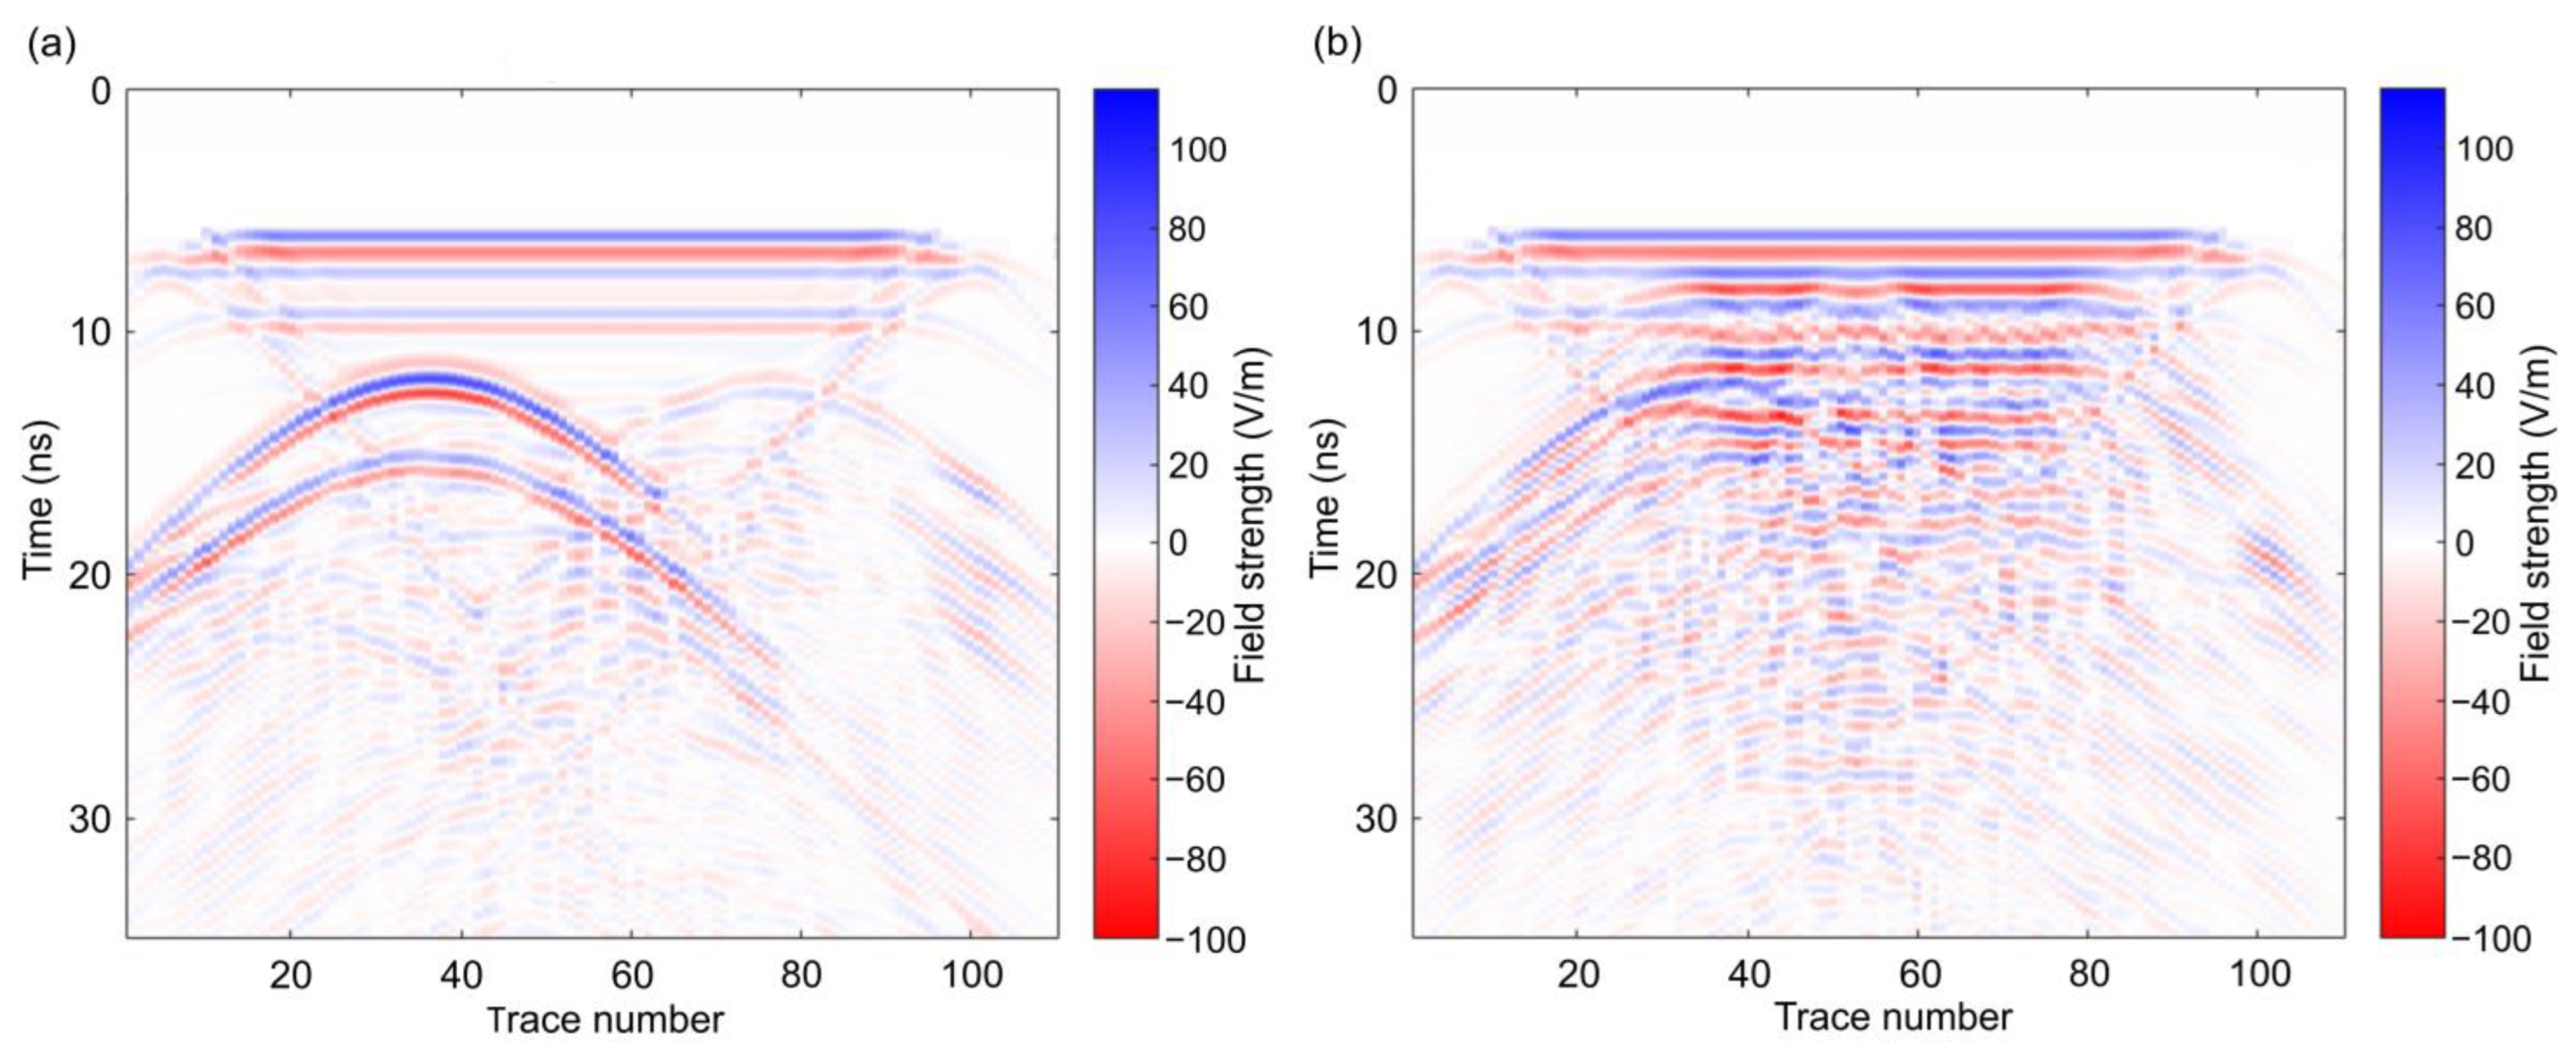
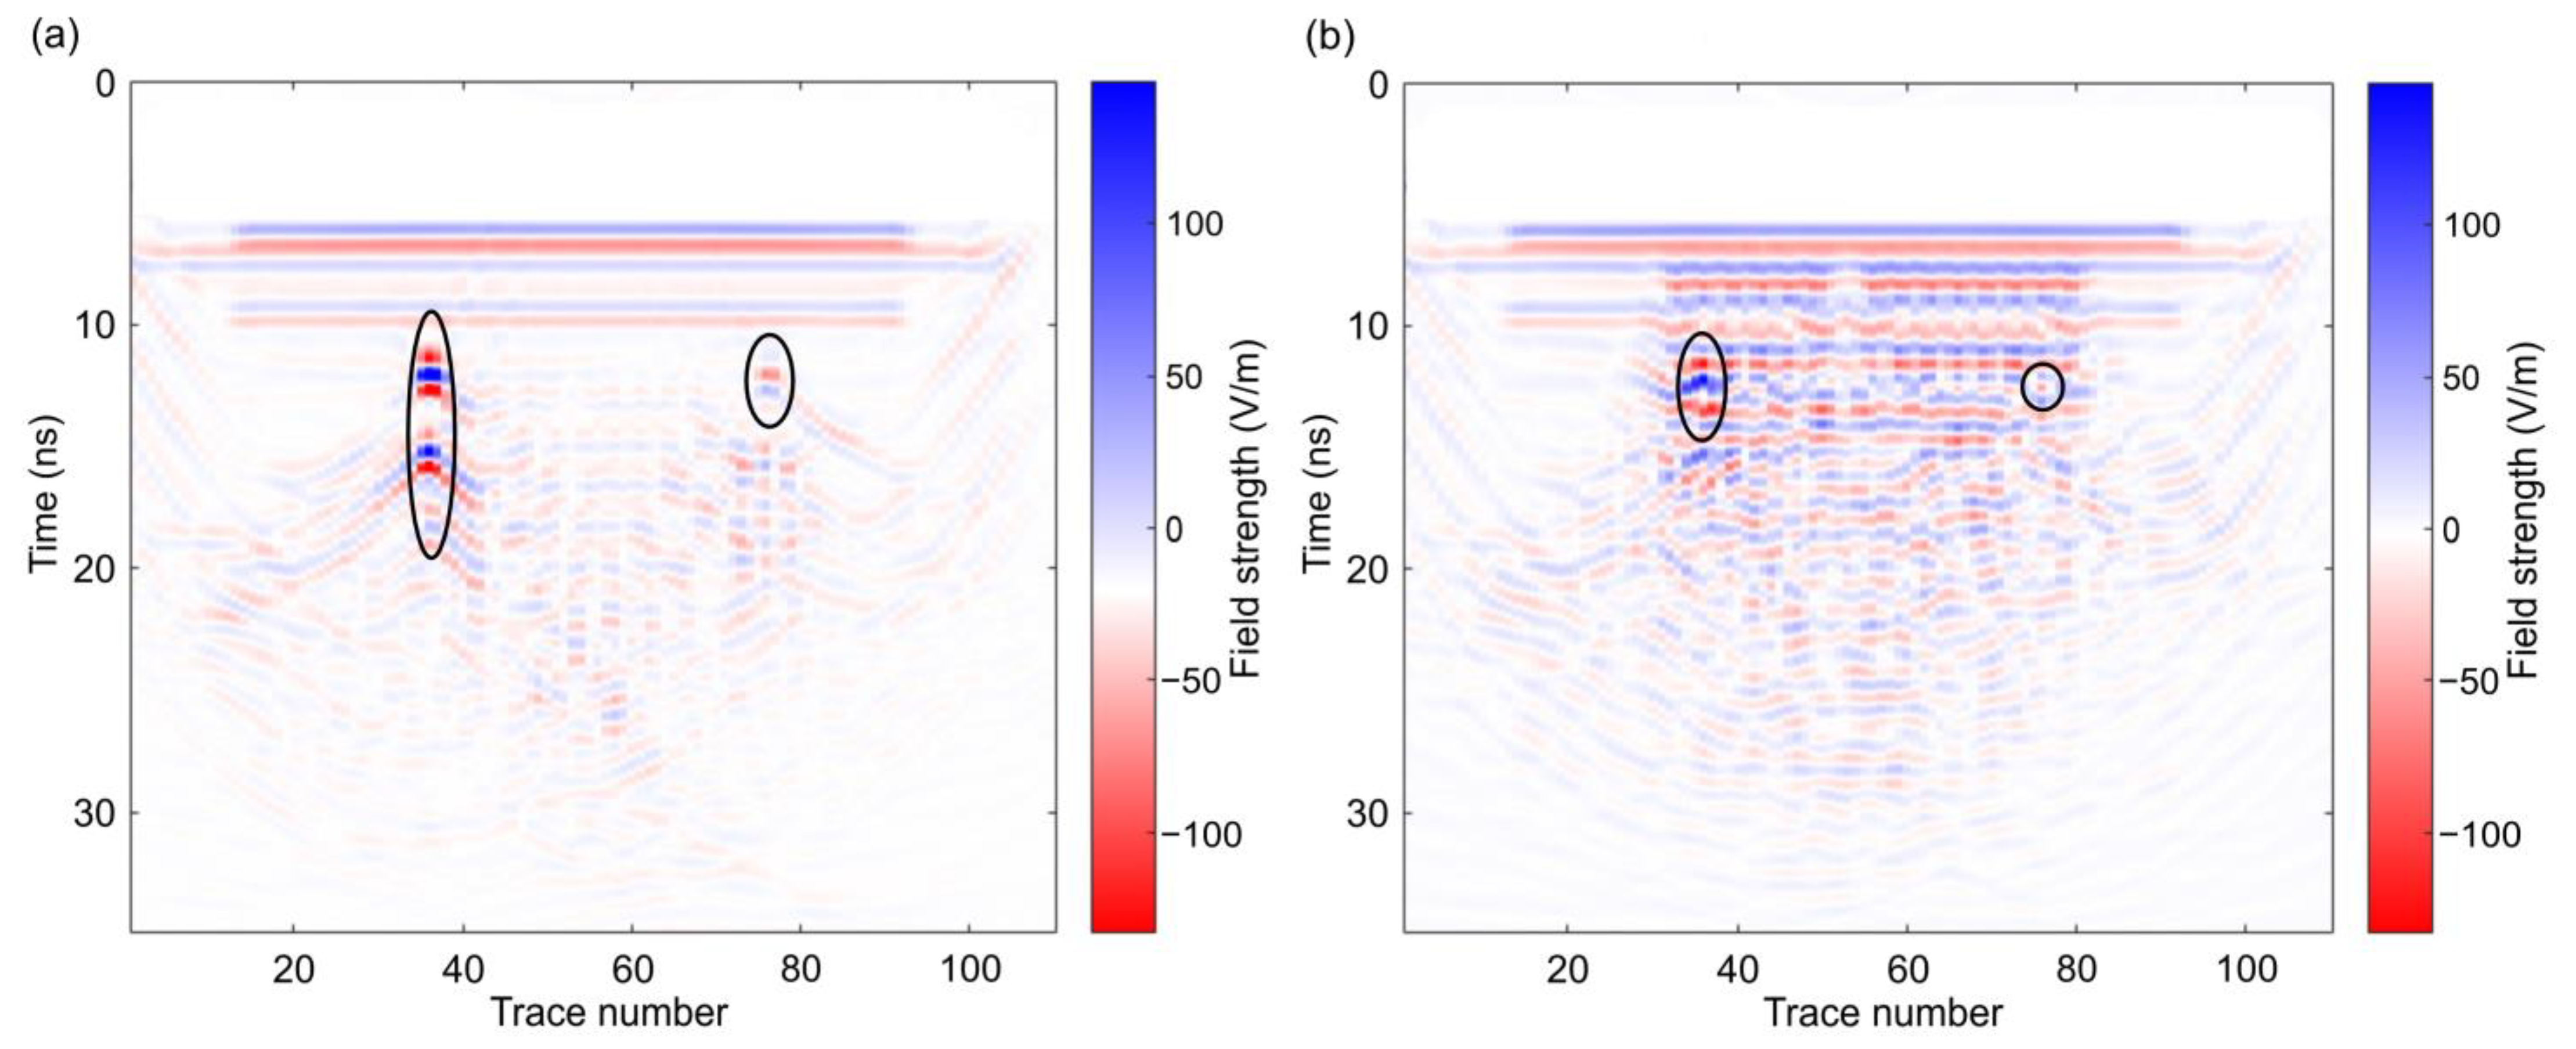
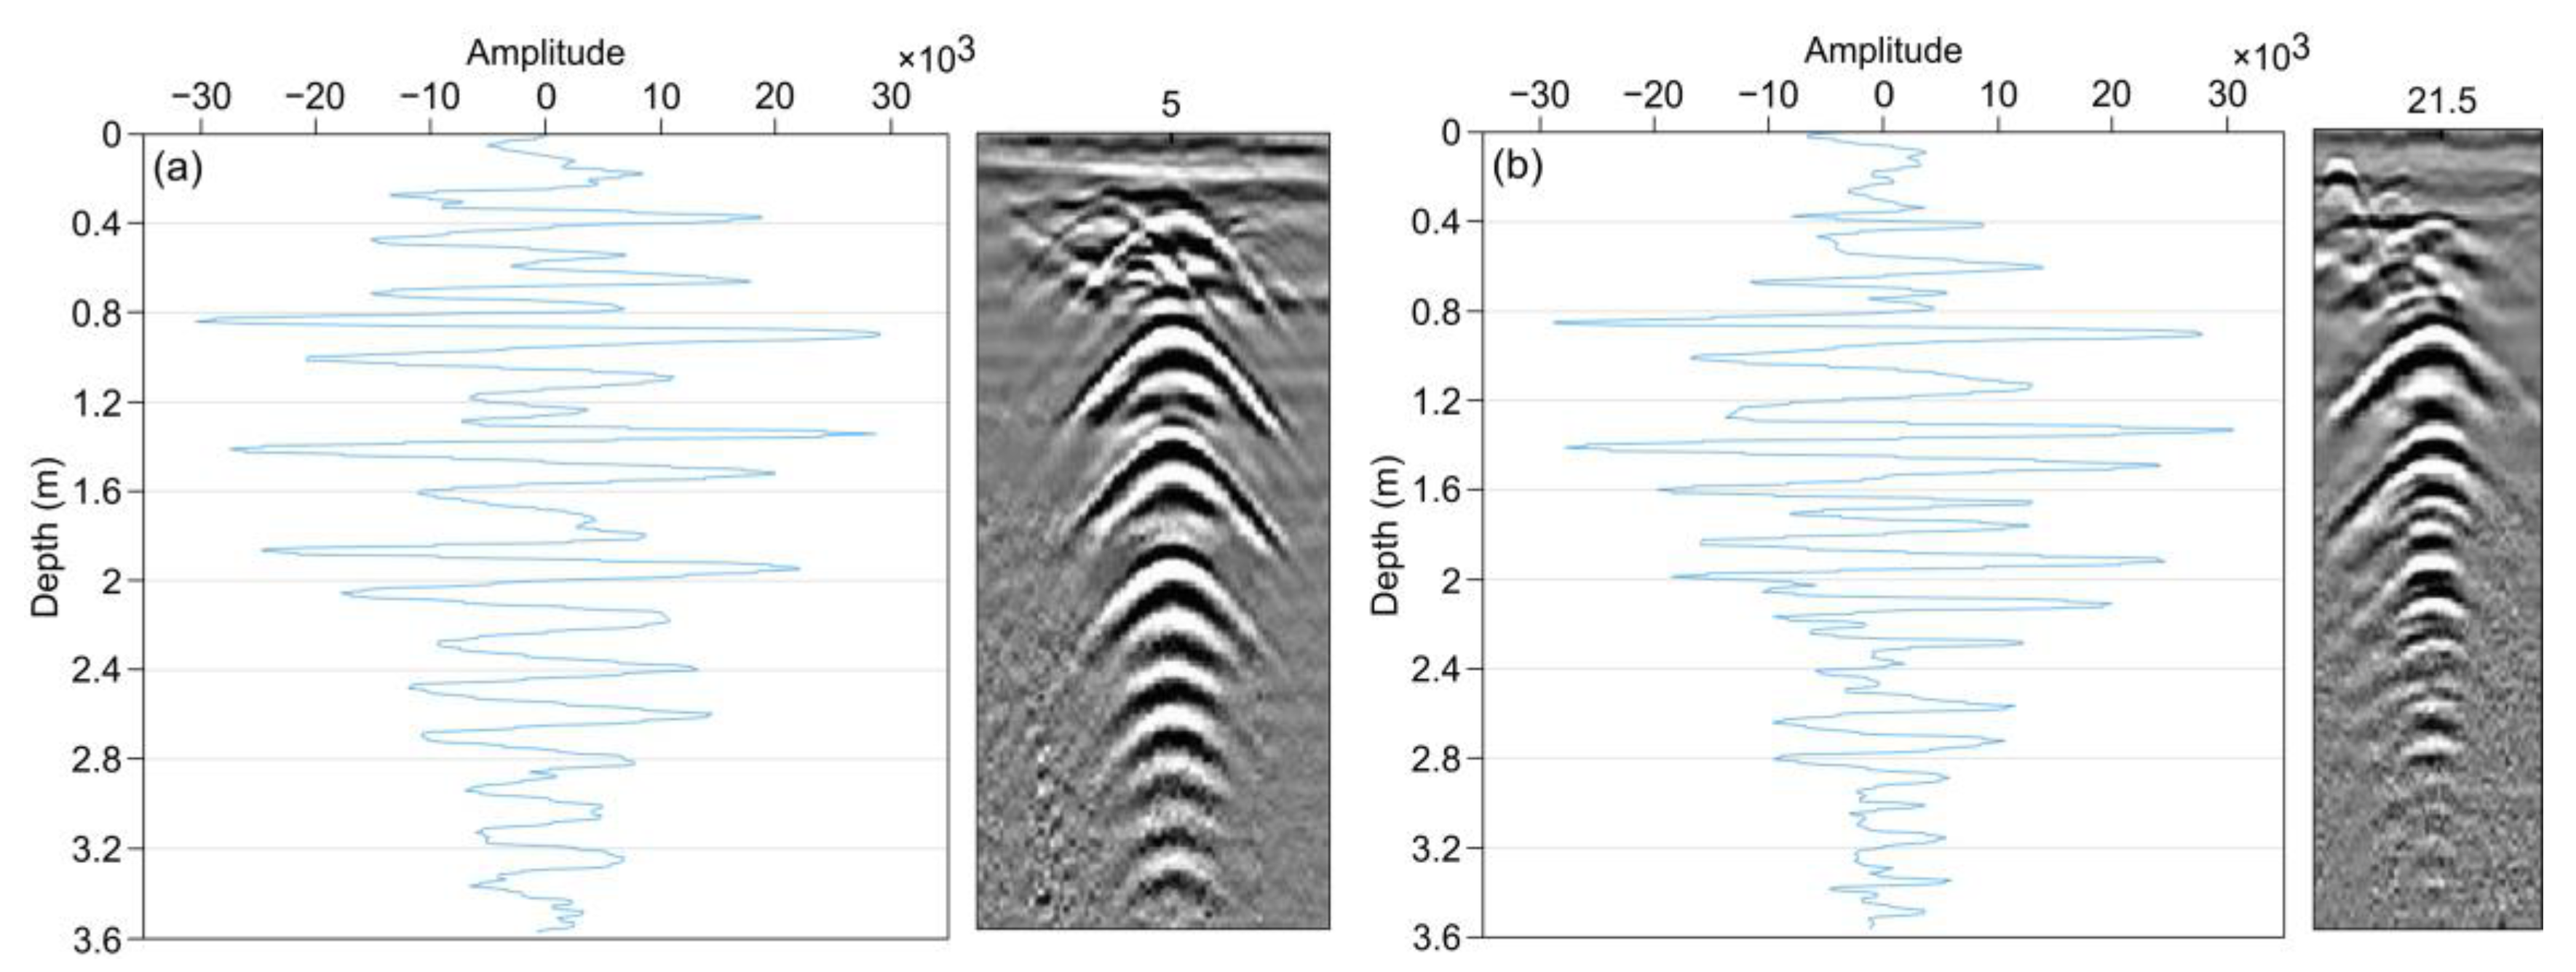
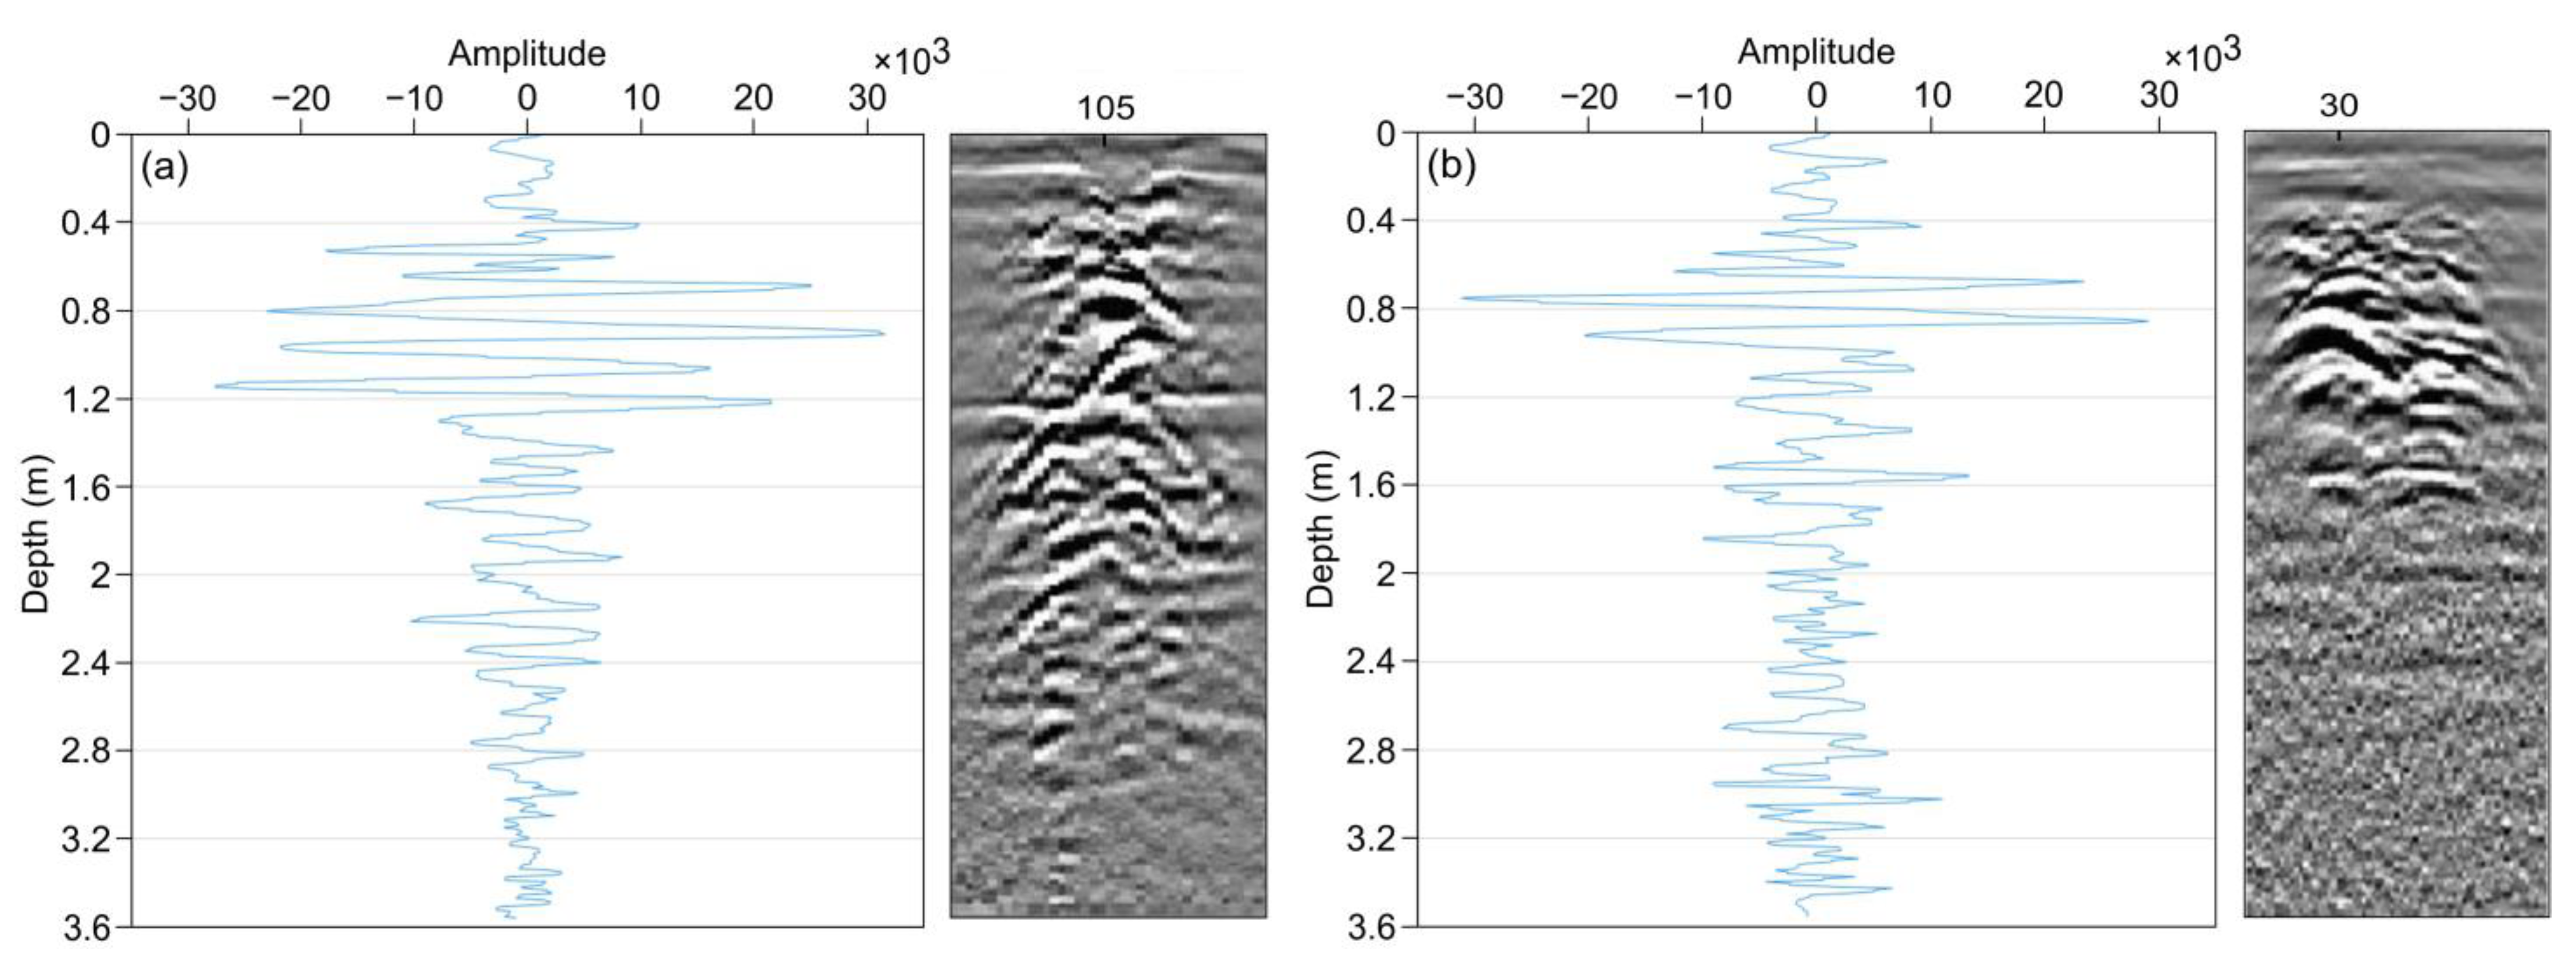
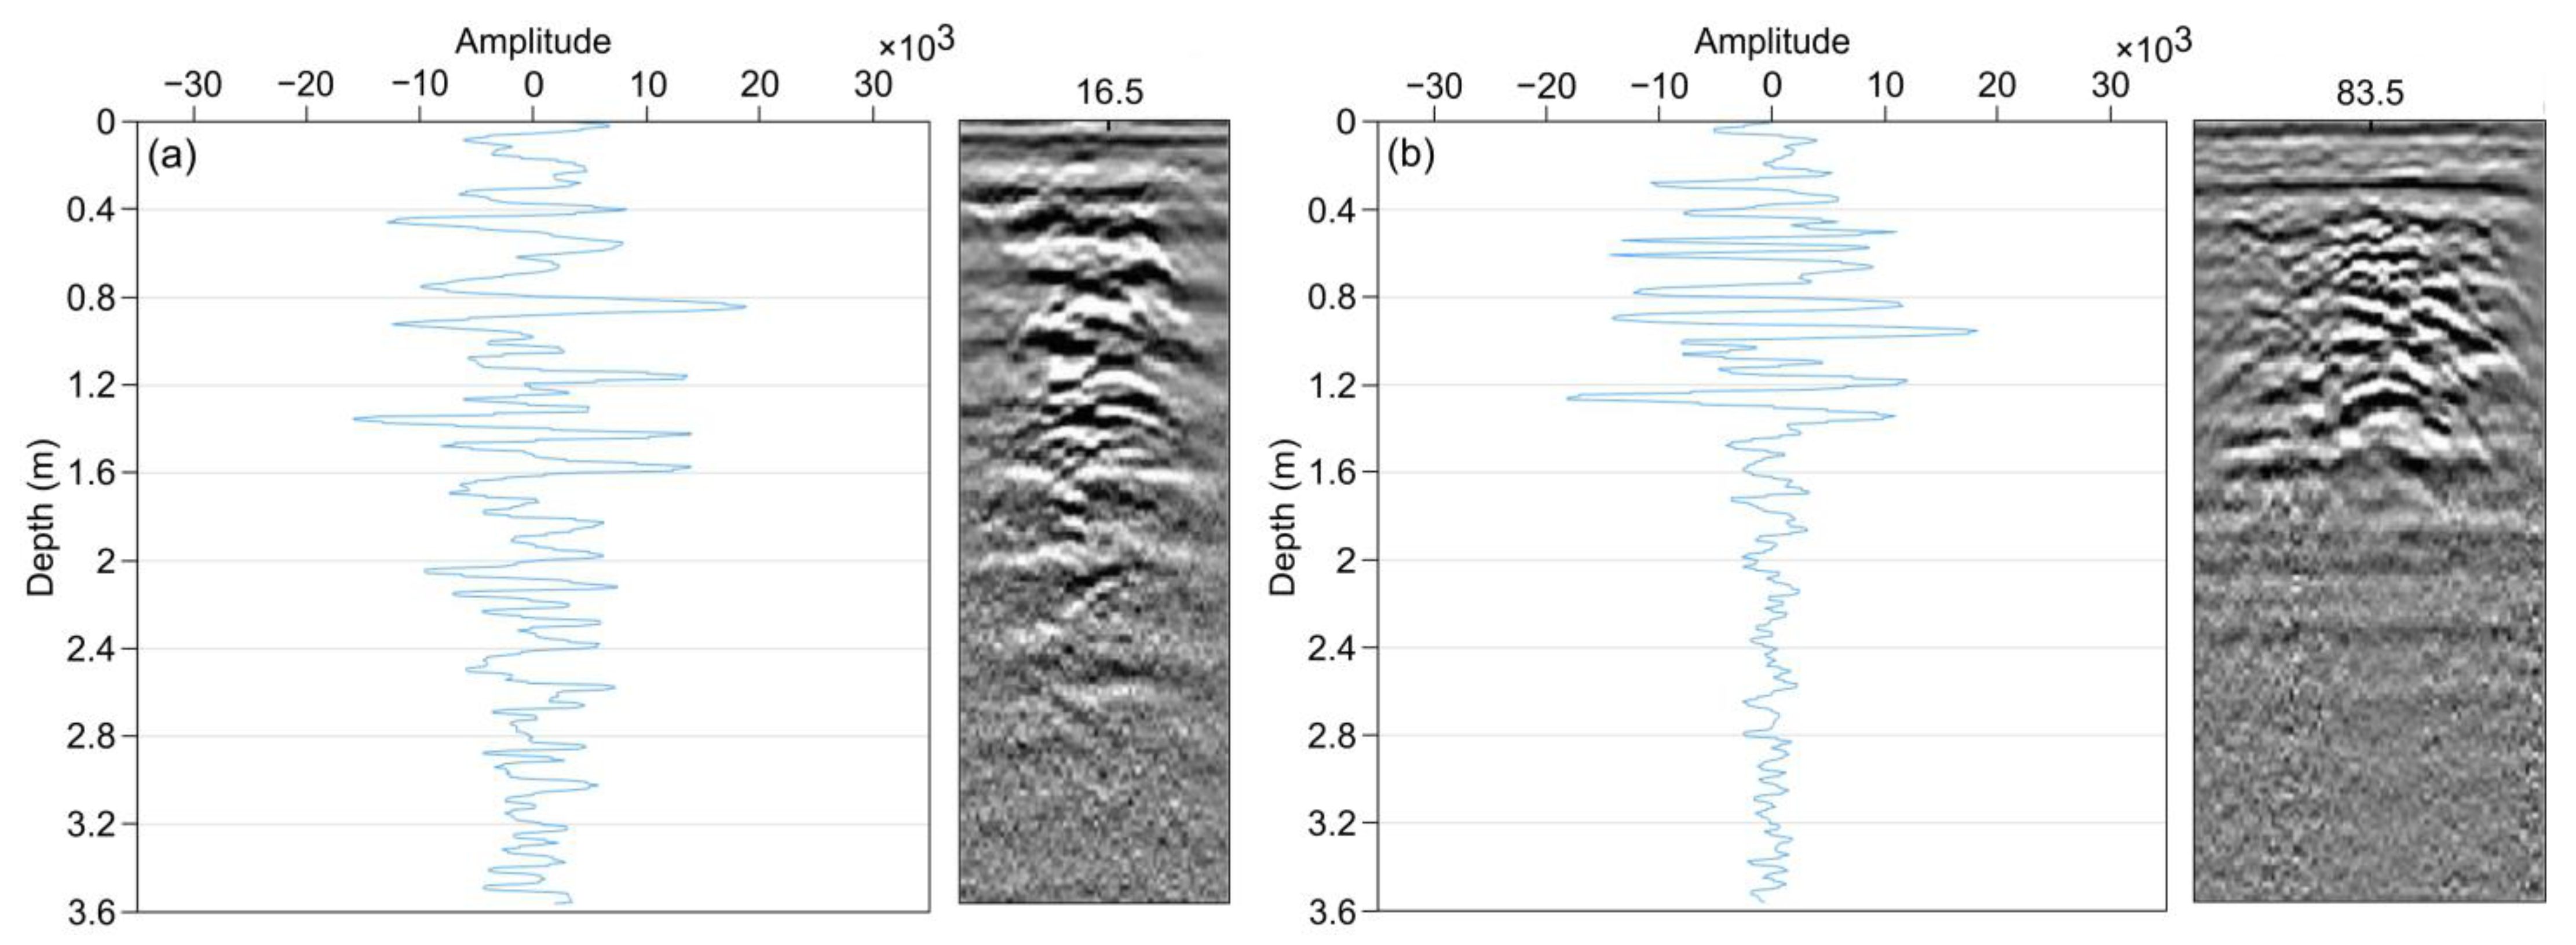
- Envelope is a technique that enhances the signal-to-noise ratio of data by processing the data in a way that allows incoherent stacking. This method involves squaring and adding the actual measured antenna voltage and its quadrature, which is equal to the magnitude of the Hilbert transformation of the radar trace. To implement this method, one can sum the squared radar trace data and their squared numerical differences, which is a simple and efficient approach. This is because the differential or integral of a sinusoid can be represented as a phase shift of π/2. The ultimate goal of this processing step is to generate a scattering amplitude envelope that represents the average amplitude of scattering versus depth [65]. The signals received by the GPR antenna are often complex, with various reflections arriving at different times due to different subsurface materials and features. The envelope technique extracts the maximum amplitude of these received signals over time. GPR signals typically contain both positive and negative peaks due to reflections. By taking the absolute value of the signal, the negative peaks become positive, resulting in a rectified version of the signal. The maximum values (peaks) of this rectified signal are extracted over a specific time range to create an “envelope” of the original signal. This processed signal can provide a clearer image of the subsurface structures than the raw GPR data. So, we designed a simple code to perform this step, which involved gathering the positive and negative reflections. This process effectively amplified the amplitude reflection for each pipe material, enabling us to identify the type of these pipes.
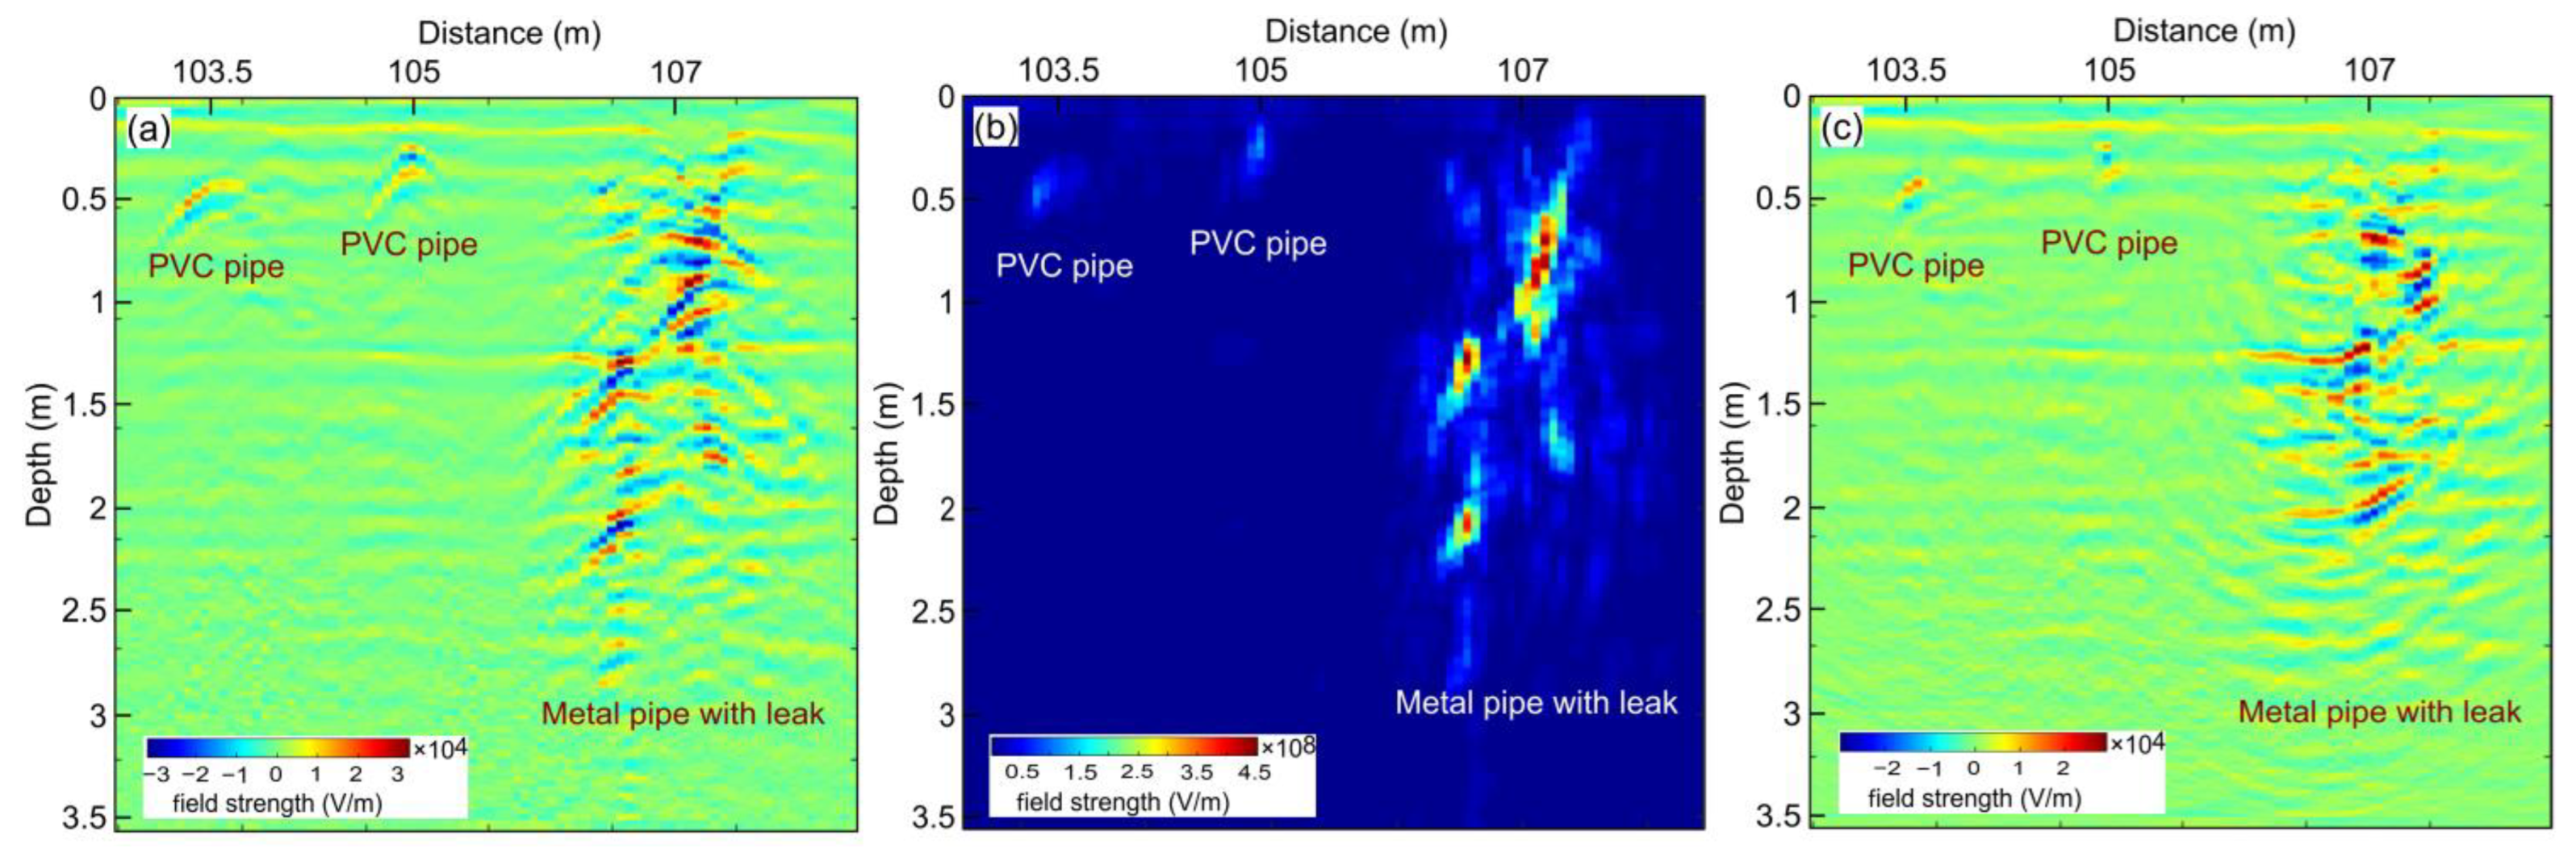
- Migration is a processing technique that is typically used to enhance section resolution and produce more accurate subsurface images in GPR. It is considered to be the most contentious of all GPR processing techniques. As the waves received by the GPR antenna are typically acquired vertically along the acquisition line, they do not accurately represent the positions of small-scale diffractors or sloped reflectors. This processing step extends the recorded wavefield downward to its origin to capture these features and move the hyperbola signal to the focal position more accurately [52,62]. The F-K migration technique converts hyperbola signals to object’s locations using a constant velocity [66]. This approach uses the exploding source model, which assumes that the scattered signal field originates from an explosion at the object’s location. It operates on frequency and wavenumber in the Fourier domain and then inverses to the time domain [67]. After applying the time-to-depth conversion processing step, we applied this step to the simulated and field data. We designed a basic code derived from the F-K migration code to improve the positioning of reflection points and create a more accurate representation of the subsurface features. The migration process enhanced the visibility of pipeline reflections, making them more discernible, particularly within the leak areas that remained undetectable in the radar cross-section derived from the field data after post-processing. Finally, we could deduce the probable pipeline material type and its precious position by comparing the reflection characteristics with known material signatures.
3. Results
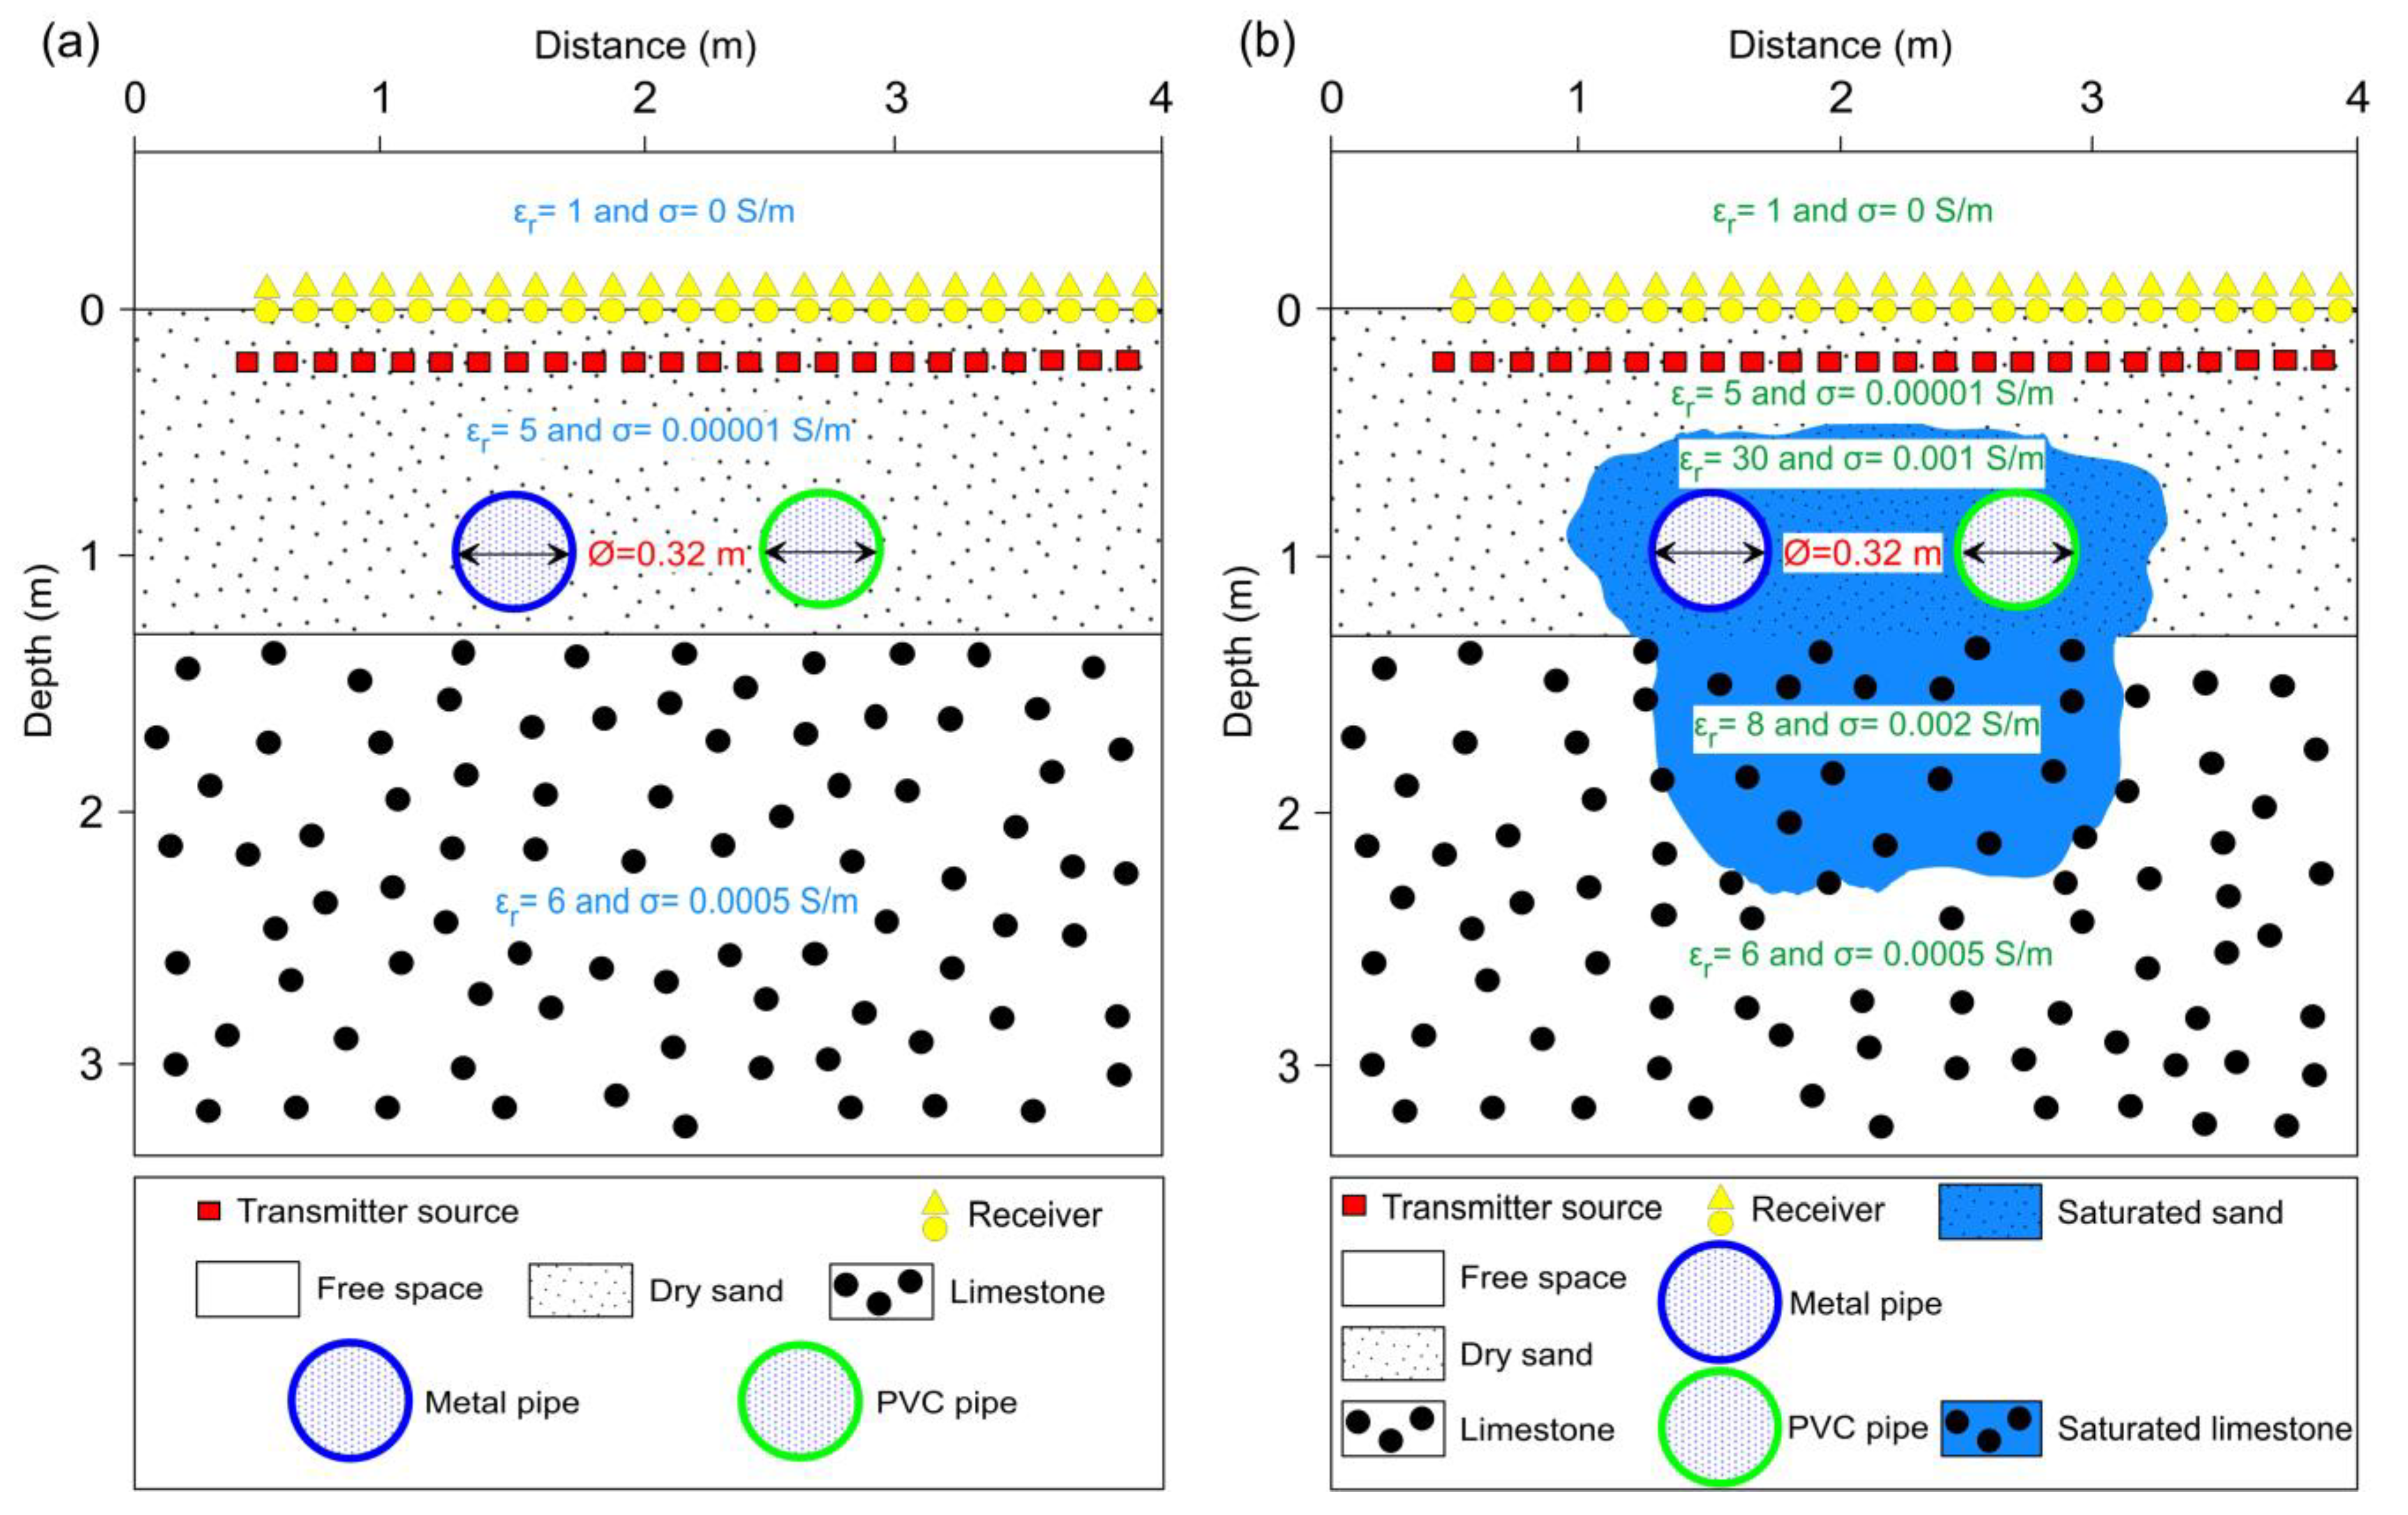
3.1. Simulated GPR Image
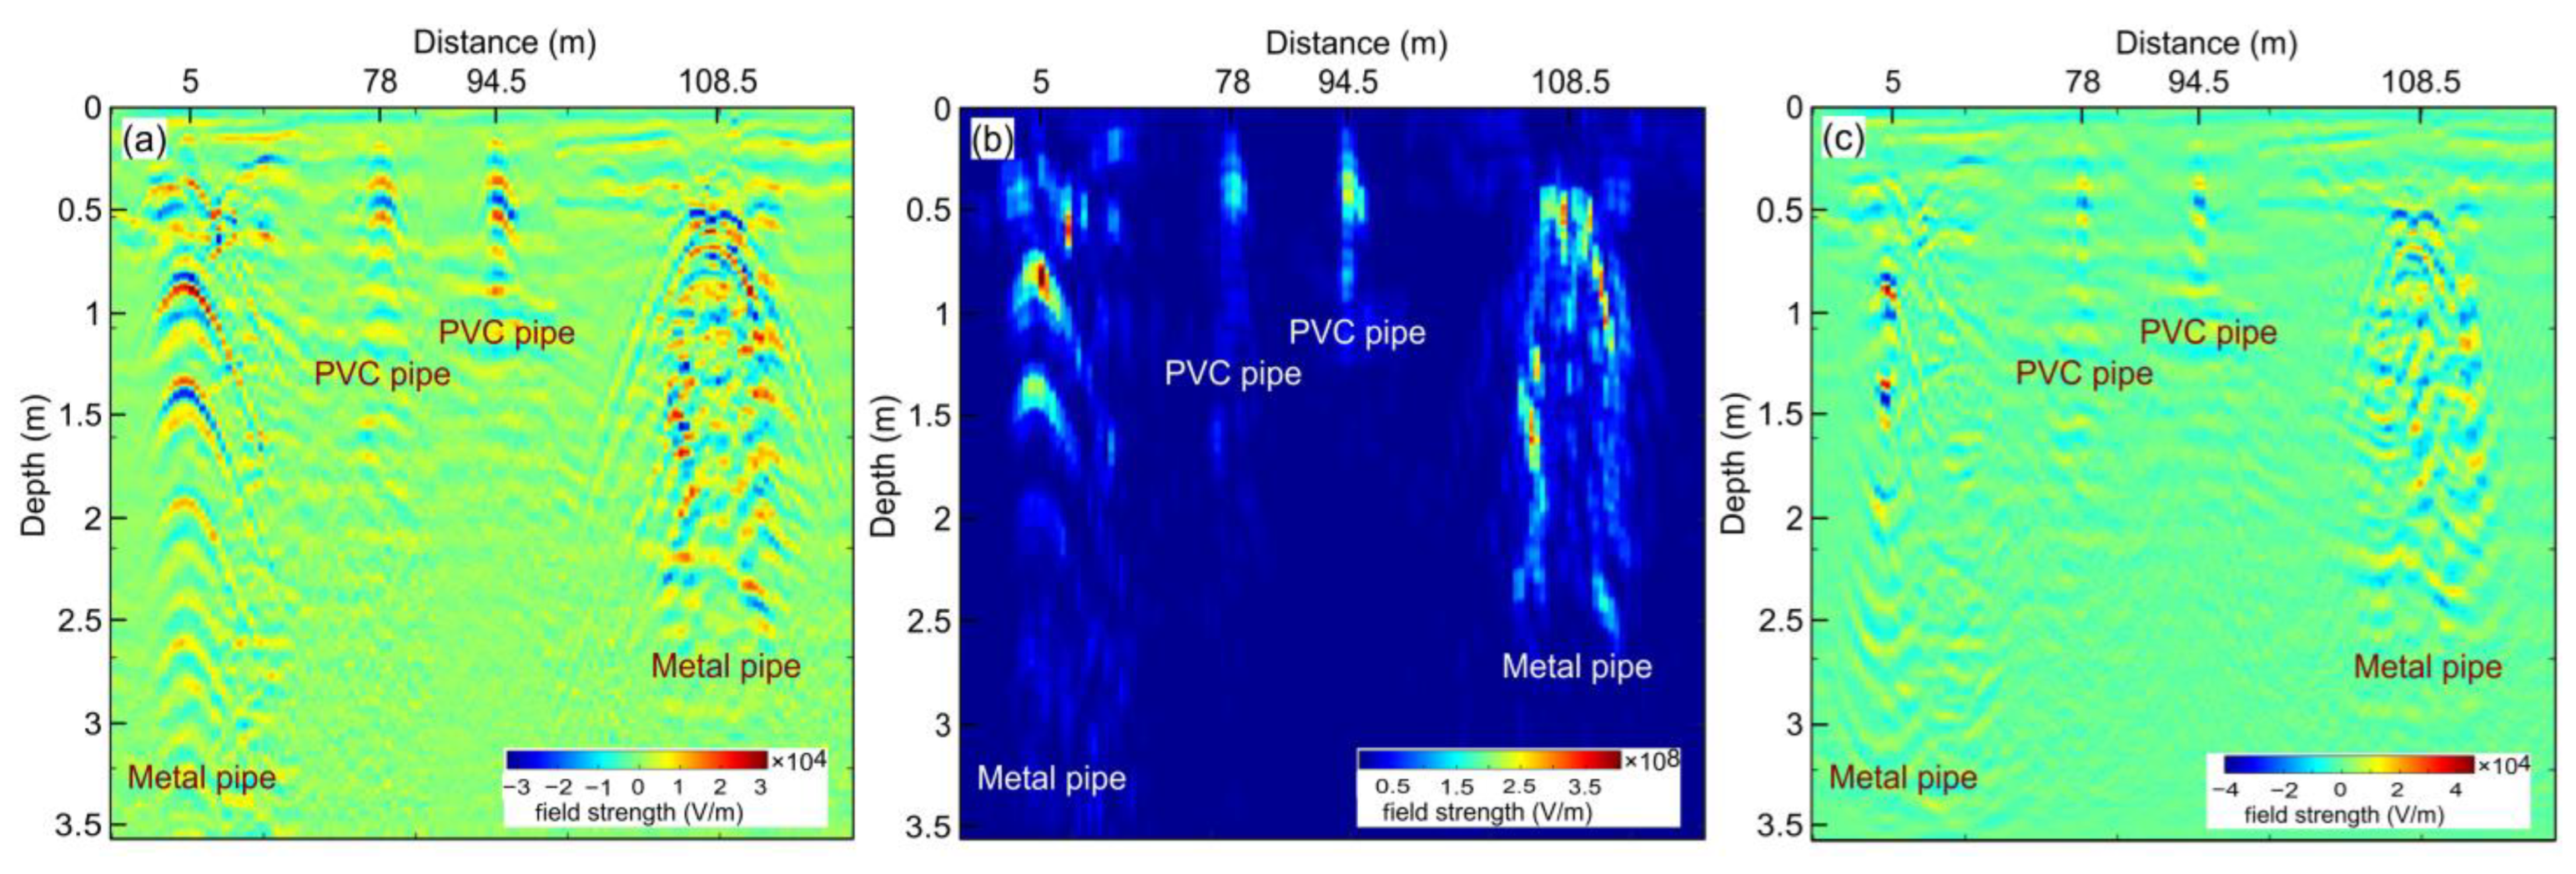
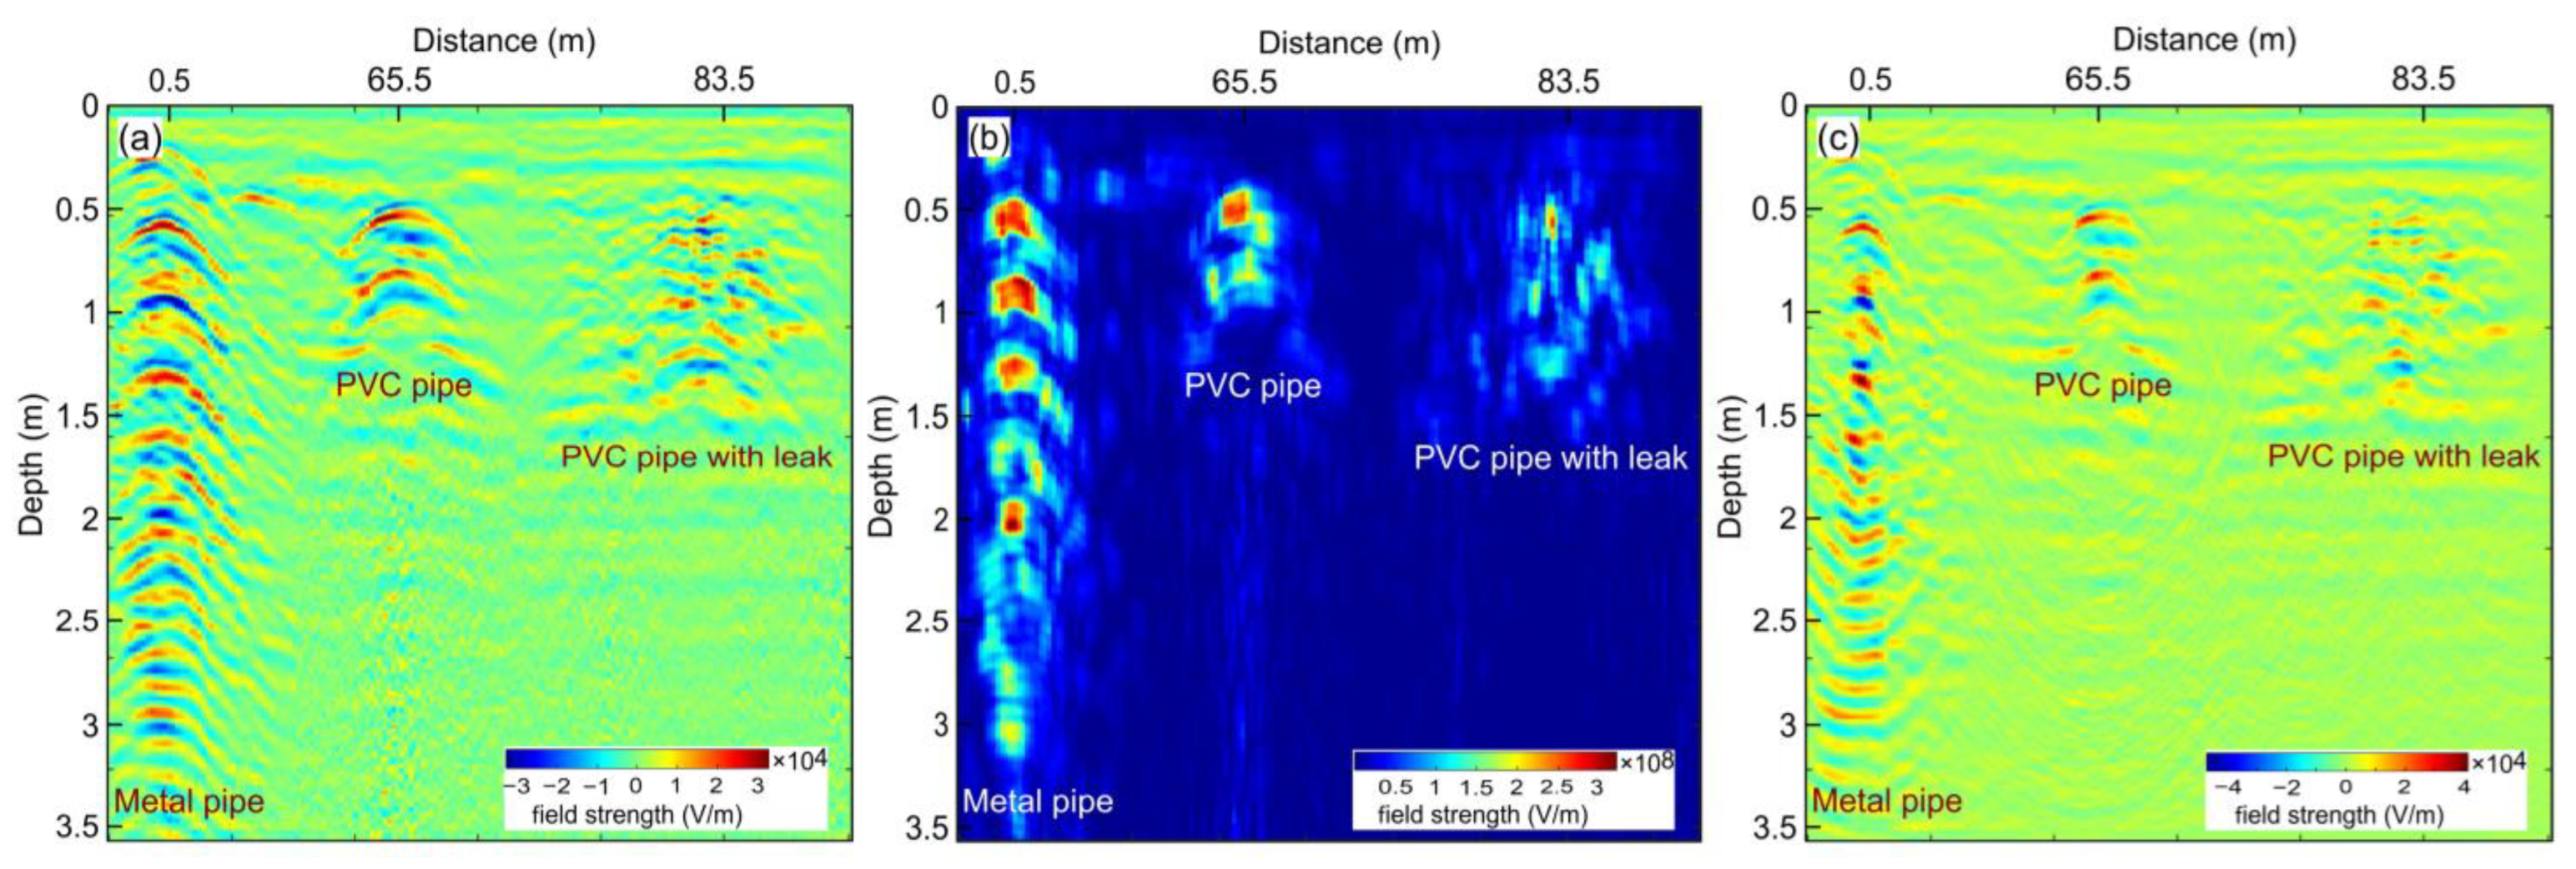
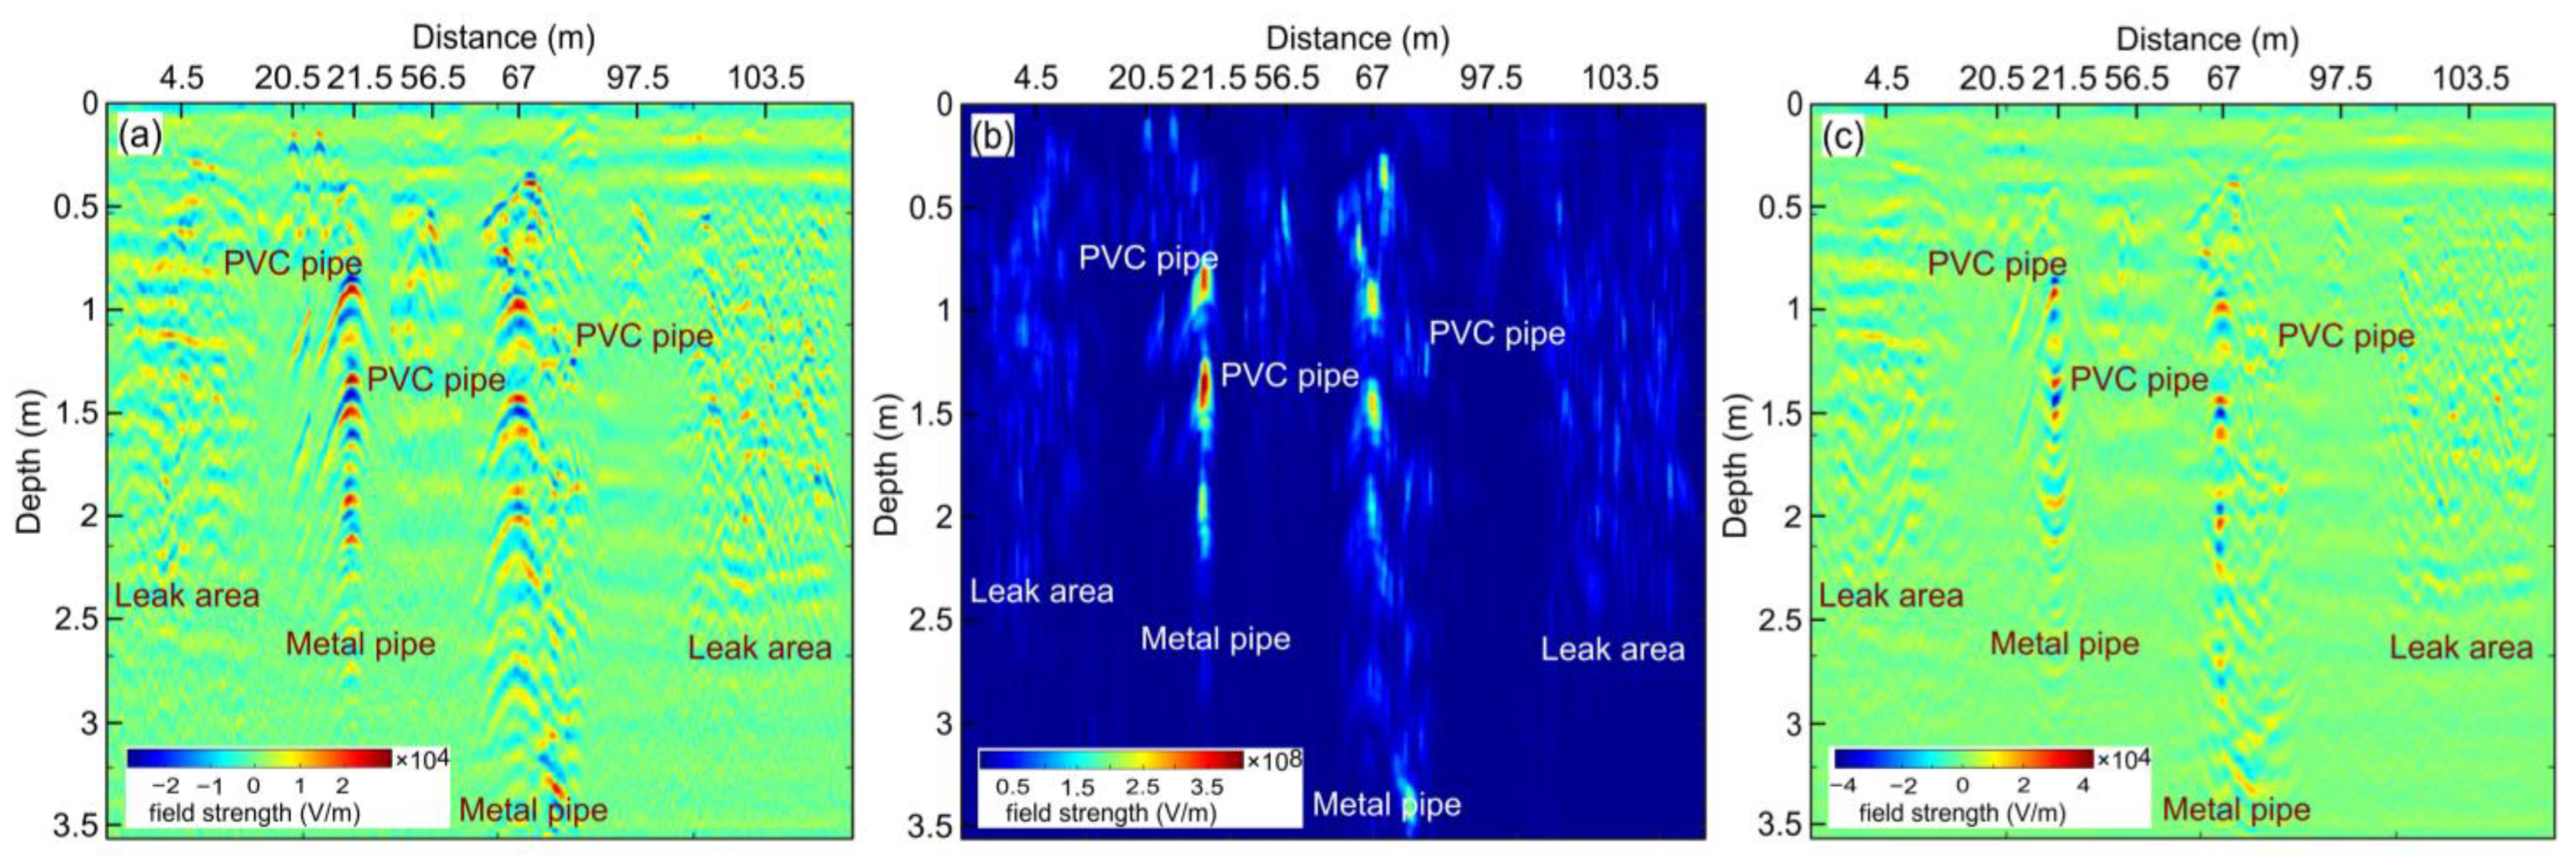
3.2. Real GPR Image
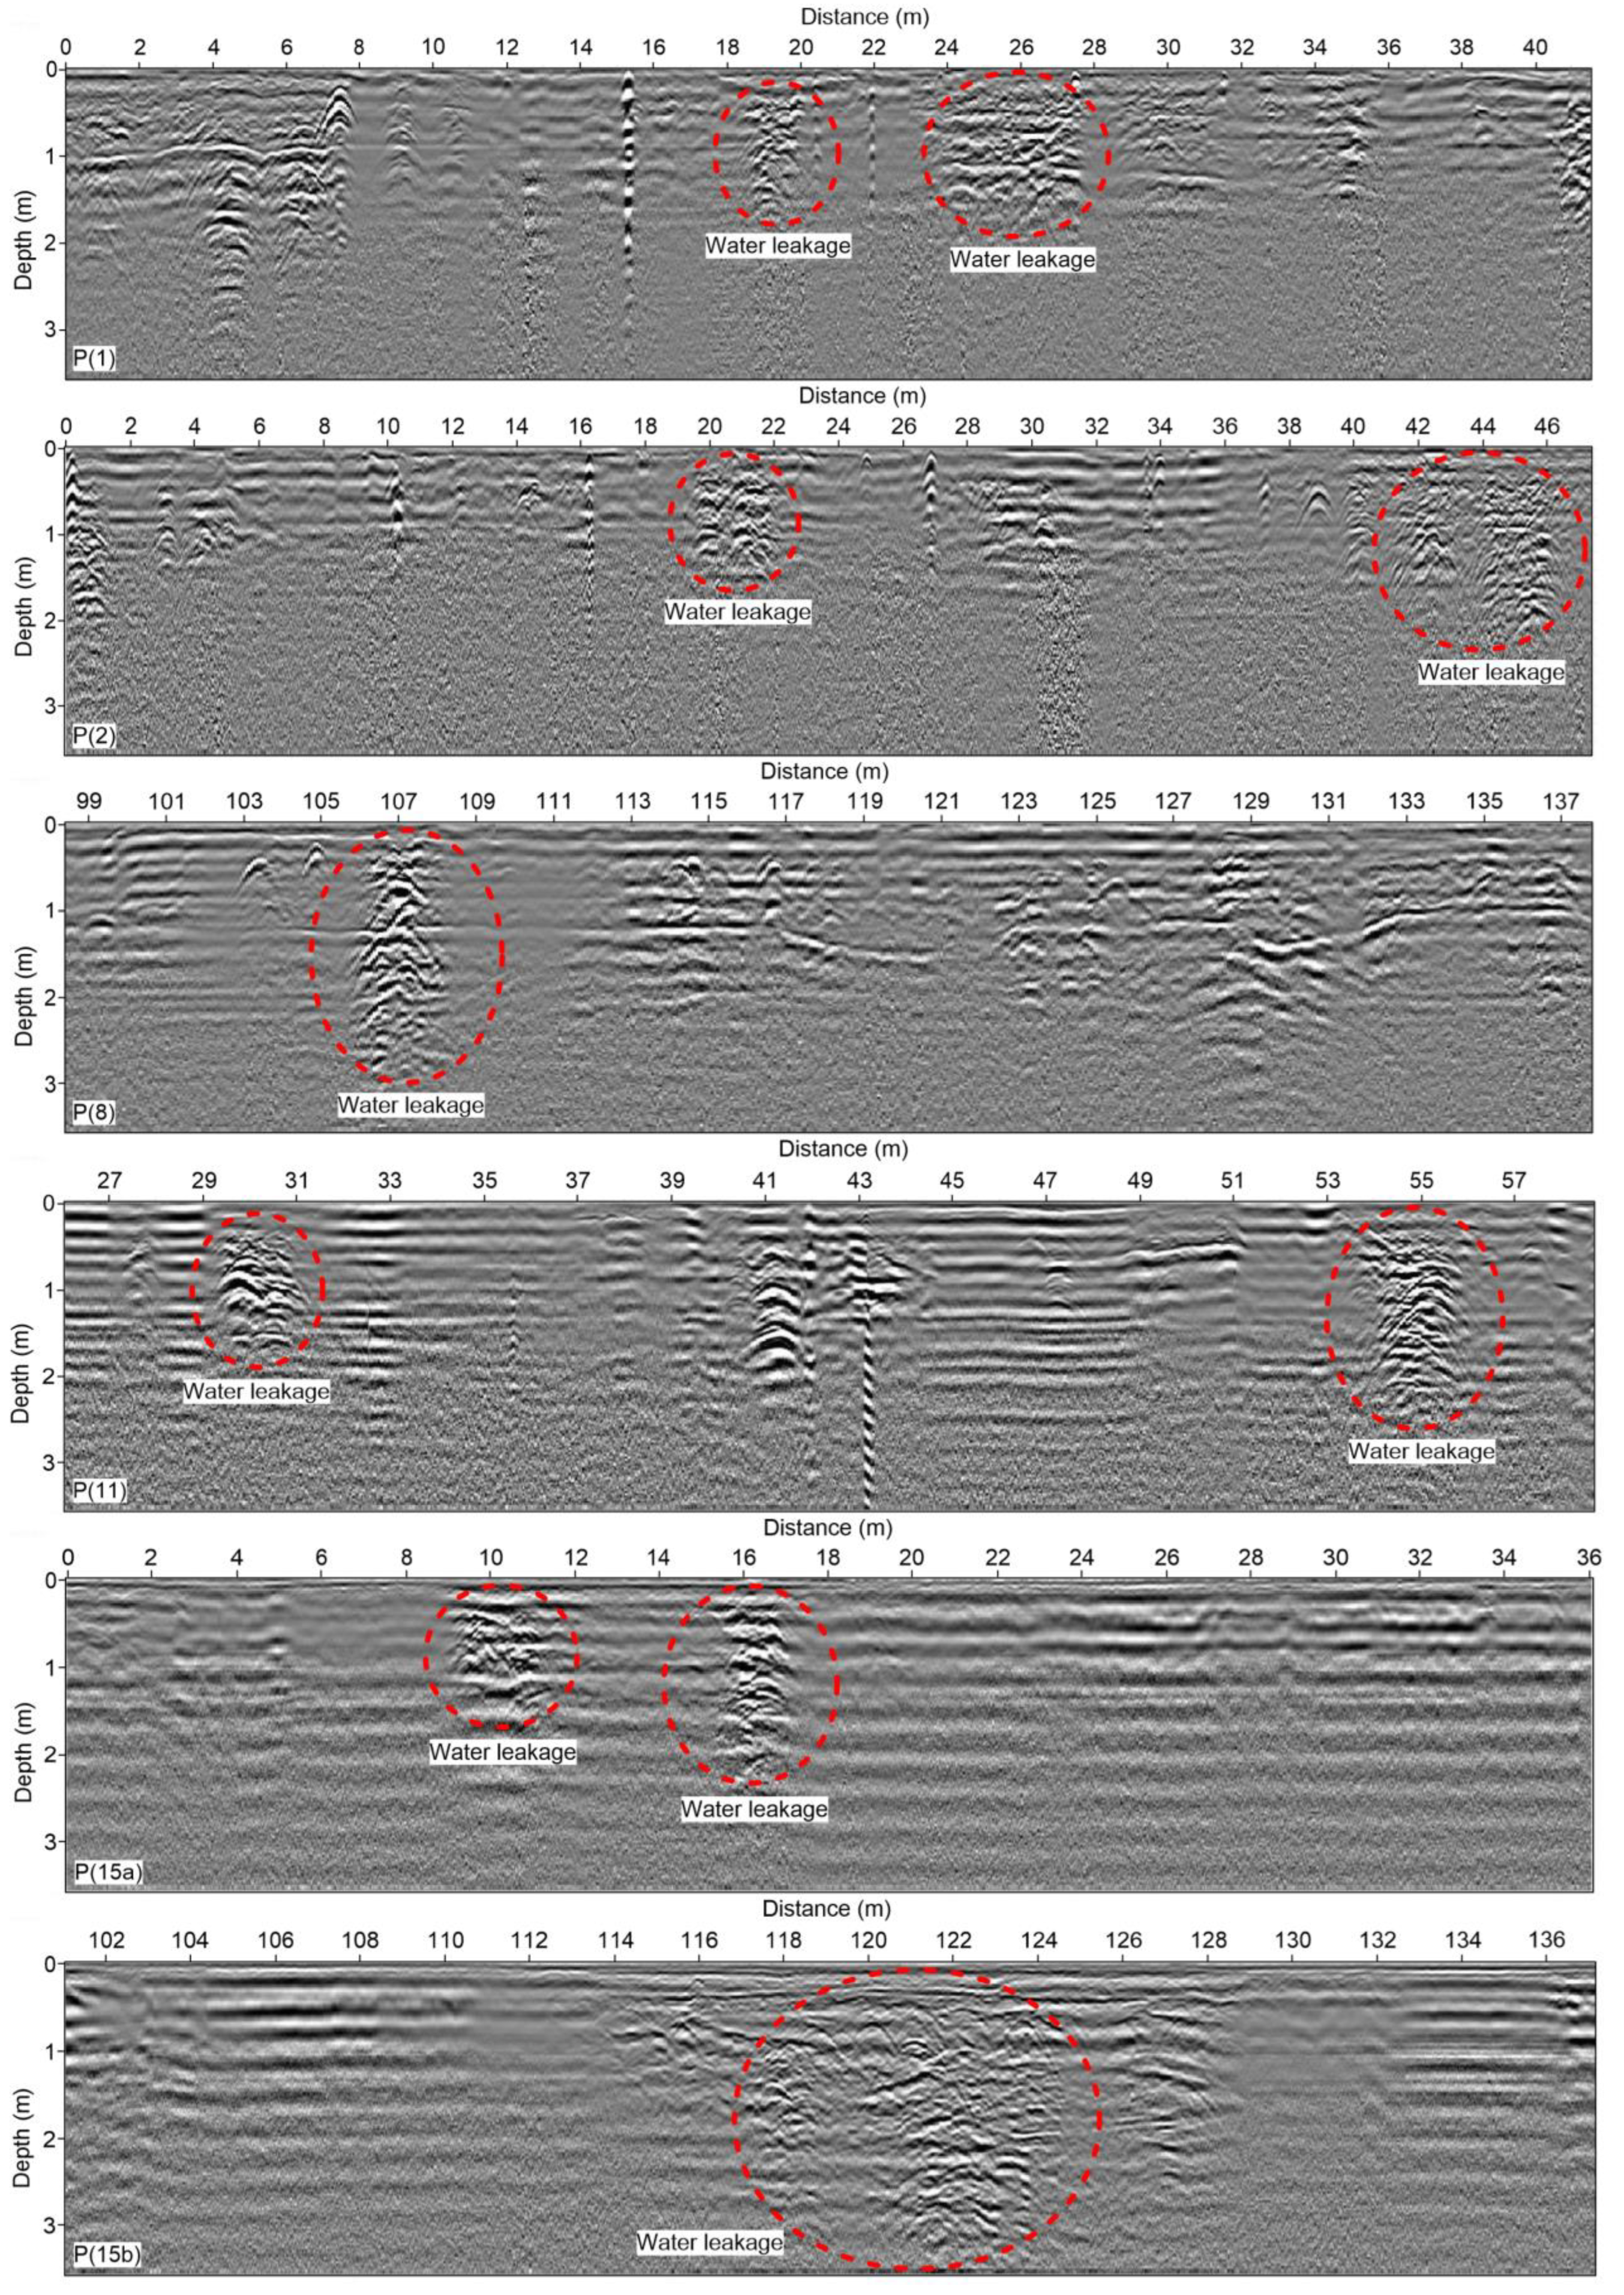
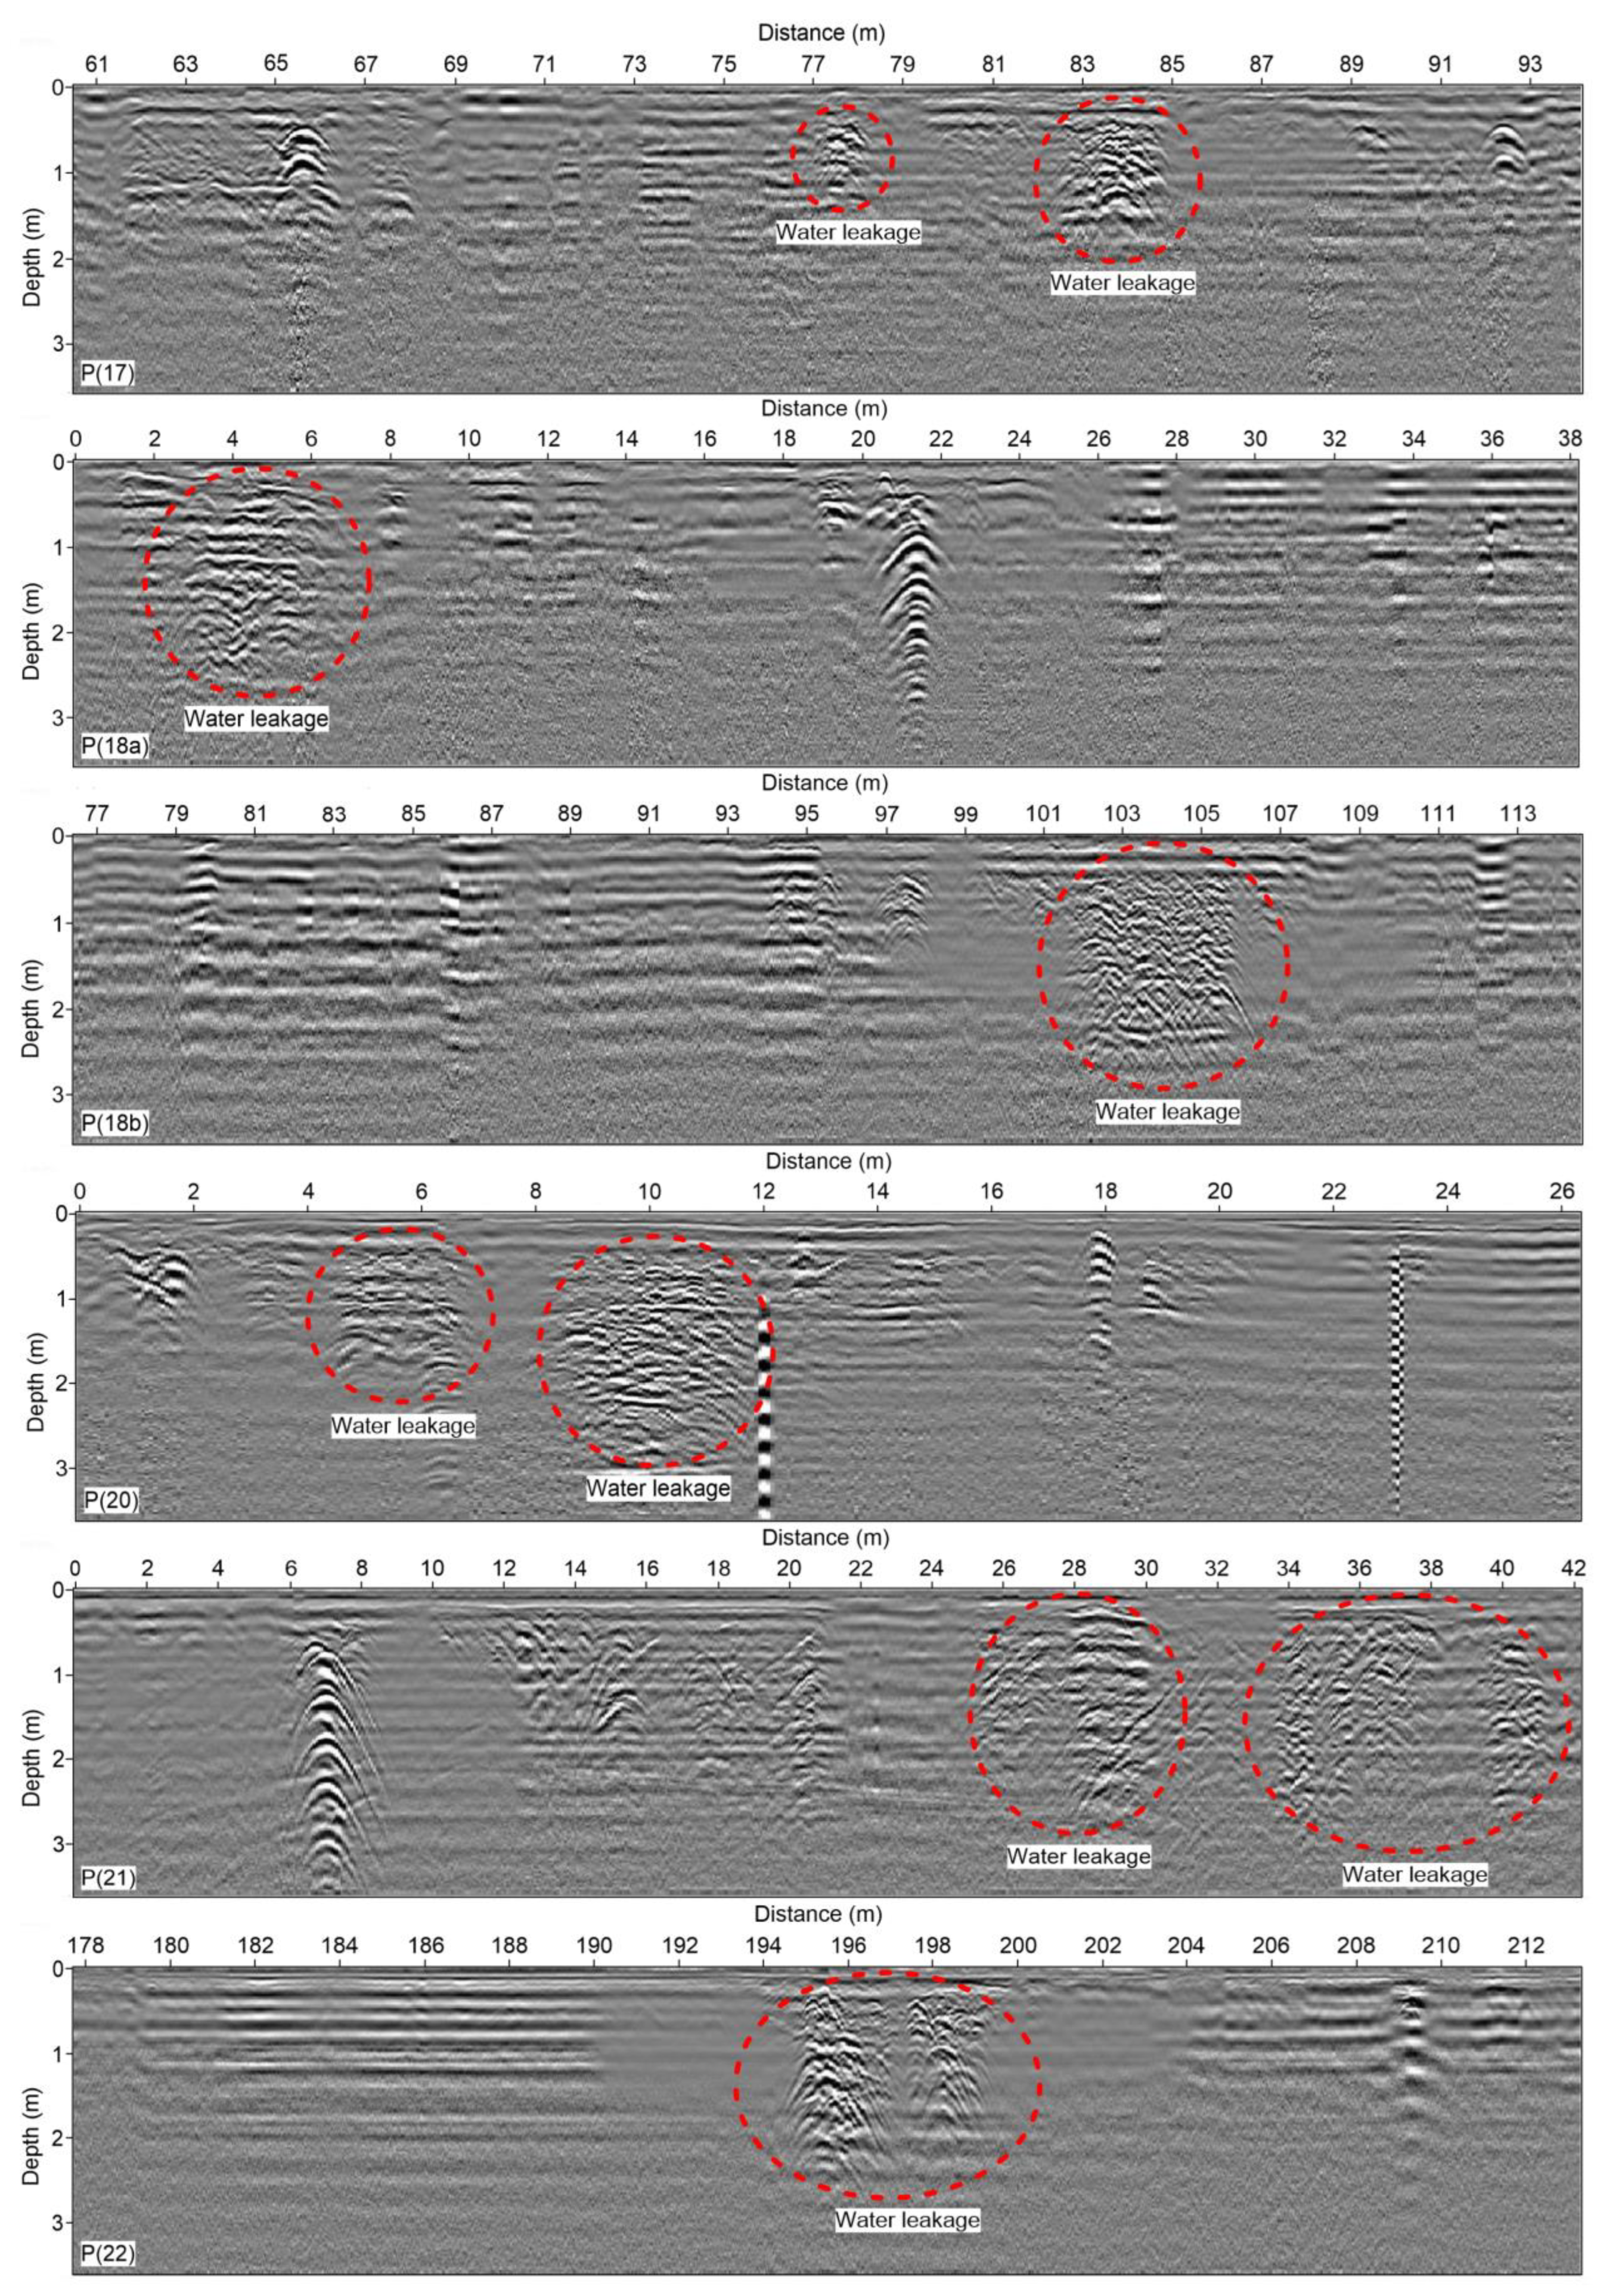
3.2.1. Detection of Leak Areas
3.2.2. Differentiation between Pipe Materials
- Using trace and radar section analysis
- Using envelope and F-K migration analysis
4. Discussion
5. Conclusions
Author Contributions
Funding
Data Availability Statement
Acknowledgments
Conflicts of Interest
References
- Karoui, T.; Jeong, S.-Y.; Jeong, Y.-H.; Kim, D.-S. Experimental study of ground subsidence mechanism caused by sewer pipe cracks. Appl. Sci. 2018, 8, 679. [Google Scholar] [CrossRef]
- Brennan, M.J.; Joseph, P.F.; Muggleton, J.M.; Gao, Y. Some Recent Research Results on the Use of Acoustic Methods to Detect Water Leaks in Buried Plastic Water Pipes; Institute of Sound Vibration Research, University of Southampton: Southampton, UK, 2008; pp. 1–7. [Google Scholar]
- Juliano, T.M.; Meegoda, J.N.; Watts, D.J. Acoustic emission leak detection on a metal pipeline buried in sandy soil. J. Pipeline Syst. Eng. 2013, 4, 149–155. [Google Scholar] [CrossRef]
- Atef, A.; Zayed, T.; Hawari, A.; Khader, M.; Moselhi, O. Multi-tier method using infrared photography and GPR to detect and locate water leaks. Autom. Constr. 2016, 61, 162–170. [Google Scholar] [CrossRef]
- Lee, B.; Oh, S. Modified electrical survey for effective leakage detection at concrete hydraulic facilities. J. Appl. Geophys. 2018, 149, 114–130. [Google Scholar] [CrossRef]
- Dong, L.; Carnalla, S.; Shinozuka, M. GPR survey for pipe leakage detection: Experimental and analytical study. In Proceedings of the Nondestructive Characterization for Composite Materials, Aerospace Engineering, Civil Infrastructure, and Homeland Security, San Diego, CA, USA, 4 April 2012; pp. 96–102. [Google Scholar]
- Hong, W.-T.; Kang, S.; Lee, S.J.; Lee, J.-S. Analyses of GPR signals for characterization of ground conditions in urban areas. J. Appl. Geophys. 2018, 152, 65–76. [Google Scholar] [CrossRef]
- Crocco, L.; Soldovieri, F.; Millington, T.; Cassidy, N.J. Bistatic tomographic GPR imaging for incipient pipeline leakage evaluation. Prog. Electromagn. Res. 2010, 101, 307–321. [Google Scholar] [CrossRef]
- Daniels, D.J. Ground Penetrating Radar, 2nd ed.; Institution of Electrical Engineers: London, UK, 2004; Volume 1. [Google Scholar]
- Amran, T.; Amin, M.; Ahmad, M.; Sani, S.; Masenwat, N.; Bundak, C.; Singoi, C. A study on detection water leakage of underground metal and PVC pipes using ground penetrating radar. In Proceedings of the IOP Conference Series: Materials Science and Engineering; Universiti Teknologi Malaysia: Skudai, Johor, Malaysia, 2019; p. 012012. [Google Scholar]
- Hunaidi, O.; Giamou, P. Ground-penetrating radar for detection of leaks in buried plastic water distribution pipes. In Proceedings of the Seventh International Conference on Ground Penetrating Radar, Lawrence, KS, USA, 27–30 May 1998; pp. 783–786. [Google Scholar]
- Shaikh, S.A.; Tian, G.; Shi, Z.; Zhao, W.; Junejo, S. Frequency band adjustment match filtering based on variable frequency GPR antennas pairing scheme for shallow subsurface investigations. J. Appl. Geophys. 2018, 149, 42–51. [Google Scholar] [CrossRef]
- Ayala-Cabrera, D.; Herrera, M.; Izquierdo, J.; Perez-Garcia, R. Location of buried plastic pipes using multi-agent support based on GPR images. J. Appl. Geophys. 2011, 75, 679–686. [Google Scholar] [CrossRef]
- Santos, V.R.N.; Teixeira, F.L. Application of time-reversal-based processing techniques to enhance detection of GPR targets. J. Appl. Geophys. 2017, 146, 80–94. [Google Scholar] [CrossRef]
- Annan, A.; Cosway, S.; Redman, J. Water table detection with ground-penetrating radar. In SEG Technical Program Expanded Abstracts; Society of Exploration Geophysicists: Houston, TX, USA, 1991; pp. 494–496. [Google Scholar]
- Abd El-Gawad, A.; Helaly, A.; Abd El-Latif, M. Application of geoelectrical measurements for detecting the ground-water seepage in clay quarry at Helwan, southeastern Cairo, Egypt. NRIAG J. Astron. 2018, 7, 377–389. [Google Scholar] [CrossRef]
- Araffa, S.A.; Mohamadin, M.I.; Saleh Sabet, H.; Takey, M.S. Geophysical interpretation for groundwater exploration around Hurghada area, Egypt. NRIAG J. Astron. 2019, 8, 171–179. [Google Scholar] [CrossRef]
- Alaminiokuma, G.; Chaanda, M. Geophysical Investigation of Structural Failures Using Electrical Resistivity Tomography: A Case Study of Buildings in FUPRE, Nigeria. J. Earth Sci. Geotech. Eng. 2020, 10, 15–33. [Google Scholar]
- Gemail, K.; Shebl, S.; Attwa, M.; Soliman, S.A.; Azab, A.; Farag, M. Geotechnical assessment of fractured limestone bedrock using DC resistivity method: A case study at New Minia City, Egypt. NRIAG J. Astron. Geophys. 2020, 9, 272–279. [Google Scholar] [CrossRef]
- Panisova, J.; Murín, I.; Pašteka, R.; Haličková, J.; Brunčák, P.; Pohánka, V.; Papčo, J.; Milo, P. Geophysical fingerprints of shallow cultural structures from microgravity and GPR measurements in the Church of St. George, Svätý Jur, Slovakia. J. Appl. Geophys. 2016, 127, 102–111. [Google Scholar] [CrossRef]
- Qin, T.; Zhao, Y.; Lin, G.; Hu, S.; An, C.; Geng, D.; Rao, C. Underwater archaeological investigation using ground penetrating radar: A case analysis of Shanglinhu Yue Kiln sites (China). J. Appl. Geophys. 2018, 154, 11–19. [Google Scholar] [CrossRef]
- Zhang, J.; Yang, W.; Hu, S.; Lin, Y.; Fang, G.; Li, C.; Peng, W.; Zhu, S.; He, Z.; Zhou, B. Volcanic history of the Imbrium basin: A close-up view from the lunar rover Yutu. Proc. Natl. Acad. Sci. USA 2015, 112, 5342–5347. [Google Scholar] [CrossRef] [PubMed]
- Zhang, J.; Zhou, B.; Lin, Y.; Zhu, M.-H.; Song, H.; Dong, Z.; Gao, Y.; Di, K.; Yang, W.; Lin, H. Lunar regolith and substructure at Chang’E-4 landing site in South Pole–Aitken basin. Nat. Astron. 2021, 5, 25–30. [Google Scholar] [CrossRef]
- Li, C.; Zheng, Y.; Wang, X.; Zhang, J.; Wang, Y.; Chen, L.; Zhang, L.; Zhao, P.; Liu, Y.; Lv, W. Layered subsurface in Utopia Basin of Mars revealed by Zhurong rover radar. Nature 2022, 610, 308–312. [Google Scholar] [CrossRef]
- Anbazhagan, P.; Dixit, P.N.; Bharatha, T. Identification of type and degree of railway ballast fouling using ground coupled GPR antennas. J. Appl. Geophys. 2016, 126, 183–190. [Google Scholar] [CrossRef]
- Curioni, G.; Chapman, D.N.; Metje, N. Seasonal variations measured by TDR and GPR on an anthropogenic sandy soil and the implications for utility detection. J. Appl. Geophys. 2017, 141, 34–46. [Google Scholar] [CrossRef]
- Abd El-Gawad, A. Water seepage source at the extension of Tourah clay quarry, southeastern Cairo based on geological and geoelectrical resistivity measurements. Earth Sci. 2020, 9, 108–116. [Google Scholar] [CrossRef]
- De Coster, A.; Medina, J.P.; Nottebaere, M.; Alkhalifeh, K.; Neyt, X.; Vanderdonckt, J.; Lambot, S. Towards an improvement of GPR-based detection of pipes and leaks in water distribution networks. J. Appl. Geophys. 2019, 162, 138–151. [Google Scholar] [CrossRef]
- Prudhomme, K.D.; Khalil, M.A.; Shaw, G.D.; Speece, M.A.; Zodrow, K.R.; Malloy, T.M. Integrated geophysical methods to characterize urban subsidence in Butte, Montana, USA. J. Appl. Geophys. 2019, 164, 87–105. [Google Scholar] [CrossRef]
- Zhang, J.-X.; Zhang, N.; Xu, Y.-S. Data on point cloud scanning and ground radar of composite lining in jointly constructed tunnel. Data Brief 2022, 41, 107993. [Google Scholar] [CrossRef] [PubMed]
- Powers, M.H.; Olhoeft, G.R. Modeling the GPR response of leaking buried pipes. In Proceedings of the 9th EEGS Symposium on the Application of Geophysics to Engineering and Environmental Problems, Keystone, CO, USA, 28 April 1996. cp-205-00057. [Google Scholar]
- Eiswirth, M.; Heske, C.; Burn, S.; De Silva, D. New methods for water pipeline assessment. In Proceedings of the IWA 2nd World Water Congress, Berlin, Germany, 15–19 October 2001; p. 8. [Google Scholar]
- Stampolidis, A.; Soupios, P.; Vallianatos, F.; Tsokas, G. Detection of leaks in buried plastic water distribution pipes in urban places-a case study. In Proceedings of the 2nd International Workshop on Advanced Ground Penetrating Radar, Delft, The Netherlands, 14–16 May 2003; pp. 120–124. [Google Scholar]
- Simi, A.; Bracciali, S.; Manacorda, G. Hough transform based automatic pipe detection for array GPR: Algorithm development and on-site tests. In Proceedings of the IEEE Radar Conference, Rome, Italy, 26–30 May 2008; pp. 1–6. [Google Scholar]
- Tavera, M. Aplicación del Georadar para la Mejora del Rendimiento de una Red Hídrica. Master’s Thesis, Universitat Politècnica de València, València, España, 2008. [Google Scholar]
- Lai, W.W.; Chang, R.K.; Sham, J.F.; Pang, K. Perturbation mapping of water leak in buried water pipes via laboratory validation experiments with high-frequency ground penetrating radar (GPR). Tunn. Undergr. Space Technol. 2016, 52, 157–167. [Google Scholar] [CrossRef]
- Liu, Y.; Shi, Z. Mapping water pipeline leakage by ground-penetrating radar diffraction imaging. Geophysics 2022, 87, WB1–WB7. [Google Scholar] [CrossRef]
- Lam, C.; Zhou, W. Statistical analyses of incidents on onshore gas transmission pipelines based on PHMSA database. Int. J. Press. Vessel. Pip. 2016, 145, 29–40. [Google Scholar] [CrossRef]
- Lee, K.-F.; Wang, T.-K.; Kang, Y.-M.; Wang, C.-S.; Lin, K.-A. Identification of pipelines from the secondary reflect wave travel time of ground-penetrating radar waves. J. Mar. Sci. Technol. 2013, 21, 6. [Google Scholar]
- dos Santos, V.R.N.; Al-Nuaimy, W.; Porsani, J.L.; Hirata, N.S.T.; Alzubi, H.S. Spectral analysis of ground penetrating radar signals in concrete, metallic and plastic targets. J. Appl. Geophys. 2014, 100, 32–43. [Google Scholar] [CrossRef]
- Kamal, N.H.B.M.; Amin, Z.M.; Mohamad, N.B. The effect of ground penetrating radar (GPR) image reflection on different pipes and soil. In Proceedings of the IOP Conference Series: Earth and Environmental Science, Kuala Lumpur, Malaysia, 20–21 October 2020; p. 012093. [Google Scholar]
- Said, R. The Geology of Egypt, 1st ed.; Editor Said, A., Ed.; Balkema: Rotterdam, The Netherlands, 1990; p. 734. [Google Scholar]
- Shata, A.A.; El Shazly, M.M.; Attia, S.H.; Abouel Fetouh, M. The geology of Quaternary deposits and their mutual relation to soil formations in the fringes west of the Nile Delta, Egypt. Desert Inst. Bull. 1978, 28, 43–77. [Google Scholar]
- Raslan, S.M. Geomorphological and Hydrogeological Studies on Some Localities along the Northwestern Coast of Egypt. Master’s Thesis, Faculty of Science, Menoufia University, Menofia, Egypt, 1995. [Google Scholar]
- Hammad, F.A. The Geology of the Soil and Water Resources in the Area between Ras El-Hekma and Ras Alam El-Rum (Western Mediterranean Littoral Zone, Egypt). Ph.D. Thesis, Faculty of Science, Cairo University, Cairo, Egypt, 1972. [Google Scholar]
- Selim, A.A. Origin and lithification of the Pleistocene carbonates of the Salum area, western coastal plain of Egypt. J. Sediment. Res. 1974, 44, 70–78. [Google Scholar]
- Ezzeldin, H.A.; Kamal, A.; Reda, A.M.; Guindy, K.; El-Shamy, I. Assessment of factors affecting the groundwater quality in El-Hammam Area, northwest coast of Egypt. Middle East J. Appl. Sci. 2019, 8, 798–819. [Google Scholar]
- Akinsunmade, A.; Karczewski, J.; Mazurkiewicz, E.; Tomecka-Suchoń, S. Finite-difference time domain (FDTD) modeling of ground penetrating radar pulse energy for locating burial sites. Acta Geophys. 2019, 67, 1945–1953. [Google Scholar] [CrossRef]
- Holden, J.; Burt, T.P.; Vilas, M. Application of ground penetrating radar to the identification of subsurface piping in blanket peat. Earth Surf. Process. Landf. 2002, 27, 235–249. [Google Scholar] [CrossRef]
- Jol, H.M.; Smith, D.G. Ground penetrating radar of northern lacustrine deltas. Can. J. Earth Sci. 1991, 28, 1939–1947. [Google Scholar] [CrossRef]
- Di Prinzio, M.; Bittelli, M.; Castellarin, A.; Pisa, P.R. Application of GPR to the monitoring of river embankments. J. Appl. Geophys. 2010, 71, 53–61. [Google Scholar] [CrossRef]
- Jol, H.M. Ground Penetrating Radar Theory and Applications; Elsevier: Amsterdam, The Netherlands, 2008. [Google Scholar]
- Utsi, E.C. Ground Penetrating Radar: Theory and Practice; Butterworth-Heinemann: Oxford, UK, 2017. [Google Scholar]
- Eyuboglu, S.; Mahdi, H.; Al-Shukri, H. Detection of water leaks using ground penetrating radar. In Proceedings of the Third International Conference on Applied Geophysics, Orlando, FL, USA, 8–12 December 2003; pp. 8–12. [Google Scholar]
- Kuo, S.-S.; Zhao, L.; Mahgoub, H.S.; Suarez, P.F. Investigation of Ground Penetrating Radar for Detection of Leaking Pipelines under Roadway Pavements and Development of Fiber-Wrapping Repair Technique; University of Central Florida: Orlando, FL, USA, 2005. [Google Scholar]
- Fariza, N.A.Y. Retrieval of Soil Physical Parameter from Multi Band GPR Dataset. Undergraduate Thesis, Universiti Teknologi Malaysia, Skudai, Malaysia, 2016. [Google Scholar]
- Neal, A. Ground-penetrating radar and its use in sedimentology: Principles, problems and progress. Earth-Sci. Rev. 2004, 66, 261–330. [Google Scholar] [CrossRef]
- Ferrara, C.; Barone, P.M.; Salvati, L.; Pettinelli, E. Ground penetrating radar as remote sensing technique to investigate the root system architecture. Appl. Ecol. Environ. Res. 2014, 12, 695–702. [Google Scholar] [CrossRef]
- Sandmeier, K. REFLEXW: Windows TM 9x/NT/2000/XP/7/8-Program for the Processing of Seismic, Acoustic or Electromagnetic Reflection, Refraction and Transmission Data; Sandmeier Scientific Software: Karlsruhe, Germany, 2014. [Google Scholar]
- Olhoeft, G.R. Maximizing the information return from ground penetrating radar. J. Appl. Geophys. 2000, 43, 175–187. [Google Scholar] [CrossRef]
- Annan, A.P. Ground-penetrating radar. In Near-Surface Geophysics; Investigations in Geophysics; Society of Exploration Geophysicists: Tulsa, OK, USA, 2005; Volume 13, pp. 357–438. [Google Scholar]
- Cassidy, N.J. Ground penetrating radar data processing, modeling and analysis. In Ground Penetrating Radar: Theory and Applications; Jol, H.M., Ed.; Elsevier: Amsterdam, Netherlands, 2009; pp. 141–176. [Google Scholar]
- Bristow, C.S. Ground penetrating radar. In Treatise on Geomorphology; Shroder, J.F., Ed.; Academic Press: San Diego, CA, USA, 2013; Volume 14, pp. 183–194. [Google Scholar]
- Davis, J.L.; Annan, A.P. Ground-penetrating radar for high-resolution mapping of soil and rock stratigraphy 1. Geophys. Prospect. 1989, 37, 531–551. [Google Scholar] [CrossRef]
- Nye, J.F.; Berry, M.V. Dislocations in wave trains. Proc. R. Soc. London. A. Math. Phys. Sci. 1974, 336, 165–190. [Google Scholar]
- Stolt, R.H. Migration by Fourier transform. Geophysics 1978, 43, 23–48. [Google Scholar] [CrossRef]
- Smitha, N.; Ullas Bharadwaj, D.R.; Abilash, S.; Sridhara, S.N.; Singh, V. Kirchhoff and FK migration to focus ground penetrating radar images. Int. J. Geo-Eng. 2016, 7, 1–12. [Google Scholar] [CrossRef]
- GSSI, G.S.S., Inc. Utility Locating Handbook; MN72-615 Rev B; GSSI: Nashua, United States, 2018. [Google Scholar]
- Liu, Y.; Greenwood, A.; Hetényi, G.; Baron, L.; Holliger, K. High-resolution seismic reflection survey crossing the insubric line into the Ivrea-Verbano Zone: Novel approaches for interpreting the seismic response of steeply dipping structures. Tectonophysics 2021, 816, 229035. [Google Scholar] [CrossRef]


| Profile Number | Leak Areas | Distance (m) | Depth (m) | ||
|---|---|---|---|---|---|
| Start | End | Start | End | ||
| P(1) | 1st | 18.6 | 20.1 | 0.4 | 1.6 |
| 2nd | 24 | 27.6 | 0.4 | 1.6 | |
| P(2) | 1st | 19.5 | 21.9 | 0.4 | 1.3 |
| 2nd | 41.8 | 46.1 | 0.4 | 1.96 | |
| P(8) | 1st | 106.2 | 107.8 | 0.4 | 1.64 |
| P(11) | 1st | 29.4 | 31 | 0.4 | 1.64 |
| P(15) | 1st | 9.2 | 11.2 | 0.4 | 1.4 |
| 2nd | 15.6 | 17 | 0.4 | 2.2 | |
| 3rd | 117.4 | 124.2 | 0.4 | 3.2 | |
| P(17) | 1st | 77.1 | 78.2 | 0.44 | 1.32 |
| 2nd | 82.6 | 84.6 | 0.44 | 1.62 | |
| P(18) | 1st | 2.8 | 6.2 | 0.4 | 2.44 |
| 2nd | 101.7 | 105.7 | 0.4 | 2.52 | |
| P(20) | 1st | 4.5 | 6.7 | 0.4 | 1.8 |
| 2nd | 8.5 | 11.7 | 0.4 | 2.9 | |
| P(21) | 1st | 25.3 | 30.1 | 0.2 | 2.44 |
| 2nd | 33.6 | 41.2 | 0.24 | 2.64 | |
| P(22) | 1st | 194.7 | 199.1 | 0.28 | 2.32 |
Disclaimer/Publisher’s Note: The statements, opinions and data contained in all publications are solely those of the individual author(s) and contributor(s) and not of MDPI and/or the editor(s). MDPI and/or the editor(s) disclaim responsibility for any injury to people or property resulting from any ideas, methods, instructions or products referred to in the content. |
© 2023 by the authors. Licensee MDPI, Basel, Switzerland. This article is an open access article distributed under the terms and conditions of the Creative Commons Attribution (CC BY) license (https://creativecommons.org/licenses/by/4.0/).
Share and Cite
Gamal, M.; Di, Q.; Zhang, J.; Fu, C.; Ebrahim, S.; El-Raouf, A.A. Utilizing Ground-Penetrating Radar for Water Leak Detection and Pipe Material Characterization in Environmental Studies: A Case Study. Remote Sens. 2023, 15, 4924. https://doi.org/10.3390/rs15204924
Gamal M, Di Q, Zhang J, Fu C, Ebrahim S, El-Raouf AA. Utilizing Ground-Penetrating Radar for Water Leak Detection and Pipe Material Characterization in Environmental Studies: A Case Study. Remote Sensing. 2023; 15(20):4924. https://doi.org/10.3390/rs15204924
Chicago/Turabian StyleGamal, Mohamed, Qingyun Di, Jinhai Zhang, Changmin Fu, Shereen Ebrahim, and Amr Abd El-Raouf. 2023. "Utilizing Ground-Penetrating Radar for Water Leak Detection and Pipe Material Characterization in Environmental Studies: A Case Study" Remote Sensing 15, no. 20: 4924. https://doi.org/10.3390/rs15204924