Article

Assessing the Spatiotemporal Evolution and Drivers of Ecological Environment Quality Using an Enhanced Remote Sensing Ecological Index in Lanzhou City, China

1
Key Laboratory of Mine Environmental Monitoring and Improving around Poyang Lake of Ministry of Natural Resources, East China University of Technology, Nanchang 330013, China
2
School of Surveying and Geoinformation Engineering, East China University of Technology, Nanchang 330013, China
3
Centre for Climate-Resilient and Low-Carbon Cities, School of Architecture and Urban Planning, Chongqing University, Chongqing 400030, China
4
Network for Education and Research on Peace and Sustainability (NERPS), Hiroshima University, Hiroshima 739-8530, Japan
5
Smart City Research Institute of Chongqing University in Liyang, Chongqing University, Liyang 213300, China
*
Author to whom correspondence should be addressed.
Remote Sens. 2023, 15(19), 4704; https://doi.org/10.3390/rs15194704
Submission received: 13 August 2023 / Revised: 11 September 2023 / Accepted: 11 September 2023 / Published: 26 September 2023

Abstract

:
Lanzhou City is located in the semi-arid region of northwest China, which experiences serious desertification. Moreover, the high intensity of land development, with the accelerated industrialization and urbanization, causes increasingly aggravated conflict between humans and the environment. Exploring the response of the ecological environment quality to the natural environment and anthropogenic activities is important to protect the sustainable development of urban economic construction and the environment. Based on the Google Earth Engine (GEE) platform, this paper constructed a modified Remote Sensing Ecological Index (MRSEI) model which could reflect the ecological environment quality by integrating the desertification index (DI) into the Remote Sensing Ecological index (RSEI) model. This paper explores the spatiotemporal variation in the environmental quality from 2000 to 2020 in Lanzhou, China, and analyzes the natural and anthropogenic factors affecting the environment quality in terms of temperature, precipitation, gross domestic product (GDP), land use, night lighting, and population. The results showed that the mean value of MRSEI ranged from 0.254 to 0.400. The area undergoing fast growth in ecological quality was in the northwestern part of Lanzhou, and the area of decrease was in the central part. Various factors have different degrees of influence on the ecosystem, with temperature, precipitation, and land use having a greater impact, and GDP and population having a limited impact. Precipitation and temperature showed a strong impact when interacting with other factors, demonstrating that precipitation and temperature were also key factors affecting MRSEI. Overall, climate change and the implementation of ecological restoration projects have led to an improvement in the quality of the ecological environment in Lanzhou. This study provides a reference for understanding the spatiotemporal changes in the ecological environment in semi-arid Lanzhou and is conducive to formulating proper protection strategies.

1. Introduction

The ecological environment plays a critical role in providing fundamental resources and support for human production and societal development [1]. However, the rapid advancements in science and technology, coupled with human activities and resource exploitation, have resulted in severe and unprecedented changes in the global climate, posing significant challenges to the stability of the Earth’s ecosystems [2]. As economic globalization and modern technology continue to progress, the transformation and destruction of the environment caused by anthropogenic activities have intensified. This escalation has led to increasingly prominent conflicts between humans and nature, resulting in a range of ecological problems such as soil erosion, extreme heat, drought, soil fertility degradation, and air pollution [3,4,5].
In 2015, the United Nations proposed 17 Sustainable Development Goals (SDGs), among which the urgent need to alleviate the synergistic impacts of climate change and human activities on the environment was highlighted. This issue has become a central focus of numerous scholars and experts [6]. Consequently, it is crucial to monitor and assess the quality of the regional ecological environment, which is also a precondition to investigate the influence of natural environments and human activities on environmental quality. Understanding the environmental quality and associated drivers is important for effective environmental protection and sustainable development of cities.
The advancement of remote sensing technology and the availability of multi-source remote sensing data have greatly facilitated regional-scale Earth observation research. This progress has opened up new avenues for monitoring and assessing regional environment quality [7]. Scholars have proposed various assessment index systems for this purpose, with the Remote Sensing Ecological Index (RSEI) being the most widely used [8]. RSEI is an ecological index based on remote sensing images and is constructed using four indicators: greenness (normalized difference vegetation index, NDVI), heat (land surface temperature, LST), dryness (NDBSI), and humidity (WET). The index is established through principal component analysis (PCA) and is extensively employed due to its advantages of speed, objectivity, and result visualization [9]. However, when applied to different regions, the selection of RSEI indicators often fails to consider the dominant ecosystem service functions in each region [10]. Consequently, the construction of indicators needs to be adjusted and improved to account for the uniqueness of the ecosystem and the distinct governance tasks [11].
Changes in ecological quality are driven by many factors at various levels and angles, including natural influences, such as global climate change, the evolution of the natural environment, and biological activities, as well as human and social factors, like urbanization, irrational land resource allocation, and water pollution [9]. The structure and quality of land-use types can serve as indicators reflecting ecological quality. Temperature and rainfall hold significant climatic influences, while population and socioeconomic development exert a certain degree of disturbance on the ecological environment as crucial human factors [12]. Therefore, there is an urgent need to systematically evaluate changes in ecological quality, investigate patterns of change, identify driving factors, and propose targeted improvements to restore and enhance the ecological environment. It is of utmost importance to assess and monitor the regional environmental quality and explore the impact of natural environments and human activities to ensure environmental protection and sustainable development.
Nevertheless, previous ecological and environmental quality assessments have faced challenges related to managing large data volumes and processing long time series analyses. The Google Earth Engine (GEE) platform provides convenient access to a vast array of open-access resources, ensuring the availability of extensive geospatial datasets. GEE is particularly suitable for large-scale, long time series monitoring and ecological and environmental quality assessment, including applications such as detecting natural disaster changes, demonstrating great potential in this field [8,13,14].
Situated in northwestern China, Lanzhou serves as the political, economic, cultural, and tourist hub of Gansu Province. However, escalating industrialization has placed immense pressure on the urban ecological environment. Consequently, there is an urgent need to conduct research on the spatiotemporal variations in the ecological environment quality. Despite Lanzhou City being a semi-arid region, studies on such regions are scarce. The RSEI primarily caters to urban ecological environments, but in semi-arid regions like Lanzhou, where sandy and deserted lands dominate, relying solely on the dryness index fails to provide representative results [15]. Given the substantial differences in ecological characteristics among regions, it is essential to enhance the RSEI to align it with the unique ecological conditions of the study area [16].
Addressing the limited studies on comprehensive long-term evaluations of regional ecological quality, it is apparent that solely relying on the RSEI model is inadequate. To overcome this challenge, this study develops a modified RSET (MRSEI) by integrating desertification data into the RSEI model on the GEE platform. The objectives of this study are (1) to evaluate the long-term dynamics of the ecological environment quality in Lanzhou City from 2000 to 2020, (2) to analyze the spatial changes in the ecological environment quality within the study area, and (3) to identify the potential factors influencing the variation in ecological quality.

2. Study Area and Data Sources

2.1. Study Area

Lanzhou (102°36′–104°35′E, 35°34′–37°00′N) is a prefecture-level city and provincial capital of Gansu Province. Lanzhou is located in northwest China and central Gansu Province (Figure 1). Lanzhou has a typical continental arid climate, with an average annual temperature of 10.3 °C. The rainfall is low, with an average annual value of 324.85 mm, while the annual evaporation reaches 1486 mm. The surrounding regions of Lanzhou have sparse vegetation, drought, and little rain. The desertification situation in its northern part is severe, and the ecological environment foundation is weak. In terms of social development, Lanzhou has a population of about 4.3843 million, and an urban population of about 3.6635 million (urbanization rate: 83.56%). In 2022, Lanzhou achieved a GDP of 334.4 billion RMB. According to the Bulletin on Desertification and Desertification Land Status in Gansu Province, the desertification land area in Gansu Province is 19.2393 million hectares, accounting for 45.18% of the provincial land area [17]. The desertification in central Lanzhou is concentrated and severe [18]. However, Lanzhou is an important part of the western ecological safety barrier, and reconstruction of the ecological environment is one of the main tasks of urban development.

2.2. Data Sources

Table 1 showcases the key data used in this study, including vector map data, Landsat 5/7/8 image data (reflectance data), MODIS product data (surface temperature data MOD11A2), land-use data, population data, GDP data, nighttime light data, temperature data, and precipitation data. Moreover, monthly average temperature data were adopted to estimate annual average temperature. Monthly precipitation data were adopted to calculate annual precipitation. The data-processing procedure includes cloud masking, cropping, stitching of Landsat data, and the final integrated computation of MRSEI data. The processing of Landsat images and surface temperature data MOD11A2 was carried out on the Google Earth Engine (GEE) platform.

3. Methodology

A workflow diagram was established to exhibit the main methods in this paper (Figure 2). First, based on the GEE platform, MRSEI images were constructed using Landsat and MODIS data for a total of 21 years from 2000 to 2020. Second, the spatiotemporal evolution of the ecological environment quality was analyzed based on one-way linear regression trend analysis and the F-test. Afterwards, spatial correlation of the ecological environment quality was analyzed using Moran’s I index and the local spatial correlation index. Finally, drivers of the ecological environment quality were analyzed by combining the changes in the influencing factors with the Geo-detector analysis.

3.1. Remote Sensing Ecological Index (RSEI) Model Construction

The RSEI model is a comprehensive index model that reflects the ecological environment quality [19]. The model is usually constructed using a combination of greenness (NDVI), wetness (WET), heat (LST), and dryness (NDBSI) indices [20].

3.1.1. Calculation of the Ecological Factor Index

1.
Greenness index
The normalized difference vegetation index (NDVI) is used to characterize the greenness index and is calculated as follows:
N D V I = ( ρ n i r ρ r e d ) ( ρ n i r + ρ r e d )
where ρ n i r and ρ r e d represent the reflectance of the Landsat images in the near-infrared and red bands, respectively.
2.
Wetness index
The wetness index (WET) reflects the moisture information of the soil and vegetation by using the moisture component obtained through the tasseled cap transformation [21,22]. It is expressed as follows:
W e t ( T M ) = 0.0315 b 1 + 0.020 b 2 + 0.3102 b 3 + 0.1594 b 4 0.6806 b 5 0.6109 b 7
W e t ( O L I ) = 0.1511 b 1 + 0.1973 b 2 + 0.3283 b 3 + 0.3407 b 4 0.7117 b 5 0.4559 b 7
where b 1   b 2 , b 3 , b 4 , b 5 , and b 7 represent the reflectance in bands 1, 2, 3, 4, 5, and 7 for Landsat5/TM images and 2, 3, 4, 5, 6, and 7 for Landsat8/OLI images, respectively; Wet(TM) and Wet(OLI) represent the moisture component of Landsat5/TM and Landsat8/OLI images, respectively.
3.
Heat index
The heat index is represented by the temperature corrected by specific emissivity [23,24], and the expression is as follows:
L S T = T / 1 + ( λ γ T / ρ ) l n ε 273.15
where LST is the land surface temperature (°C); T is the bright temperature (K); λ is the central wavelength of the thermal infrared band; ρ = 1.438 × 10⁻² mK; and ε is the specific emissivity.
4.
Dryness index
The dryness index is synthesized from the index-based built-up index (IBI) and the soil index (SI), and the expression is as follows:
I B I = 2 ρ S W I R 2 / ( ρ S W I R 1 + ρ N I R ) 2 ρ N I R / ( ρ r e d + ρ N I R ) + 2 ρ g r e e n / ( ρ S W I R 1 + ρ g r e e n ) 2 ρ S W I R 2 / ( ρ S W I R 1 + ρ N I R ) + 2 ρ N I R / ( ρ r e d + ρ N I R ) + 2 ρ g r e e n / ( ρ S W I R 1 + ρ g r e e n )
S I = ( ρ S W I R 1 + ρ r e d ) ( ρ b l u e + ρ N I R ) ( ρ S W I R 1 + ρ r e d ) + ( ρ b l u e + ρ N I R )
N D B S I = ( S I + I B I ) / 2
where ρ b l u e , ρ g r e e n , ρ r e d , ρ N I R , ρ S W I R 1 and ρ S W I R 2 represent the reflectance of the features in the blue, green, red, near-infrared, short-wave infrared 1, and short-wave infrared 2 bands corresponding to the TM and OLI images, respectively [9,19].

3.1.2. RSEI Model Construction

  R S E I = f N D V I , W e t , L S T , N D B S I
where NDVI, Wet, LST and NDBSI represent the greenness, wetness, heat, and dryness indices, respectively.

3.2. Modified Remote Sensing Ecological Index (MRSEI) Model Construction

RSEI integrates various factors such as greenness, humidity, heat, and dryness information, and can reflect the spatially dynamic change characteristics of ecological environments. However, it is only suitable for specific environments such as cities, where human activities predominate, or river and lake basins with natural ecological scenarios [15]. It is not suitable for arid areas, and thus there is room for optimization and improvement. Since Lanzhou is located in a typically arid region, there is a large area of desert land [18]. Therefore, the RSEI application in this study should be improved, and the desertification index (DI) should be included as one of the indicators for constructing the MRSEI.

3.2.1. Desertification Index

Land desertification significantly affects the quality of the environment in arid areas. The desertification index is therefore regarded as an important indicator for evaluating the quality of the environment in arid areas [25]. Zeng et al. explored the relationships among desertification, NDVI, and surface albedo, and constructed the albedo–NDVI feature space system, based on which they developed the desertification index (DI) model [26]. This index integrates various desert-land characteristics and elements and can accurately characterize the degree of desertification in arid areas [27,28]. Therefore, DI is selected as the desertification index, and its calculation formula is as follows:
A l b e d o = 0.356 ρ B + 0.130 ρ R + 0.373 ρ N I R + 0.085 ρ S W I R 1 + 0.072 ρ S W I R 2 0.0018
where ρ B , ρ R , ρ N I R , ρ S W I R 1 , and ρ S W I R 2 denote the reflectance of the features in the blue, red, NIR, shortwave IR 1, and shortwave IR 2 bands corresponding to the TM and OLI images, respectively:
N D V I s c a l e = N D V I N D V I m i n N D V I m a x N D V I m i n × 100 %
A l b e d o s c a l e = A l b e d o A l b e d o m i n A l b e d o m a x A l b e d o m i n × 100 %
where N D V I s c a l e and A l b e d o s c a l e are the standardized NDVI and albedo, respectively; N D V I m a x and N D V I m i n are the maximum and minimum values of the NDVI, respectively; A l b e d o m a x and A l b e d o m i n are the maximum and minimum values of albedo, respectively.
D D I = 1 K i × N D V I A l b e d o
D I = D D I
where K i is the slope of the albedo–NDVI characteristic equation, and i represents the year.

3.2.2. MRSEI Model Construction

The MRSEI is mainly coupled with the above-mentioned five ecological indicators using the principal component analysis (PCA) method. The weights of each indicator were objectively determined by load values generated by principal component transformation without human subjective involvement, so the model is very robust [29]. In order to avoid imbalanced weights of each indicator in the PCA calculation process caused by different magnitudes, it is necessary to normalize each indicator before the principal component transformation, ensuring that their magnitudes are all unified between 0 and 1.
The first principal component of the transformation was selected as the initial MRSEI and then normalized to obtain the MRSEI with values between [0,1]. The closer the MRSEI value is to 1, the better the ecological condition, and vice versa.
M R S E I 0 = 1 { P C 1 [ F ( N D V I , W e t , N D B S I , D I , L S T ) ] }
M R S E I = ( M R S E I 0 M R S E I 0 _ m i n ) / ( M R S E I 0 _ m a x M R S E I 0 _ m i n )
where M R S E I 0 is the initial MRSEI; MRSEI is the modified remote sensing ecological index; M R S E I 0 _ m a x is the maximum value of the initial MRSEI; and M R S E I 0 _ m i n is the minimum value of the initial MRSEI.
The generalized normalization formula for each indicator is as follows:
N i = ( I i I m i n ) / ( I m a x I m i n )
where N i is the normalized index value; I i is the index value before normalization; and I m i n and I m a x are the minimum and maximum values of the index before normalization, respectively.
The calculation platform is the GEE (Google Earth Engine). Since June–November is the season of vegetation growth, we selected data from June to November every year to calculate the MRSEI.

3.3. Trend Analysis Method

The spatial trend of the ecological environment quality in Lanzhou from 2000 to 2020 was analyzed using one-dimensional linear regression analysis, expressed as follows:
θ s l o p e = n × i = 1 n i × x i i = 1 n i i = 1 n x i n × i = 1 n i 2 i = 1 n i 2
where θ s l o p e is the trend of the x-indicator from 2000 to 2020, n is 21, i is the year, and x i is the value of the x-indicator in the ith year. An F-test was used to judge the trend of the MRSEI in Lanzhou from 2000 to 2020. The analytical formula is as follows:
F = U × n 2 Q
where U = i = 1 n ( y ^ i y ¯ ) 2 is the sum of error squares, Q = ( y i y ^ i ) 2 is the regression sum of squares, y i is the image value of the MRSEI in the ith year, y ^ i is the regression value, y ¯ is the mean value of the MRSEI at the monitoring time, and n is the number of monitoring years. According to the test results, the dynamic trends were classified into five levels: highly significant improvement ( θ s l o p e > 0, F > F α   = 0.01), significant improvement ( θ s l o p e   > 0, F α   = 0.05 < F < = F α   = 0.01), unchanged (F < = F α = 0.05), highly significant degradation ( θ s l o p e < 0, F > F α   = 0.01), and significant degradation ( θ s l o p e < 0, Fα = 0.05 < F < = F α   = 0.01).

3.4. Spatial Autocorrelation

The spatial autocorrelation method was used to analyze the characteristics and distribution of the spatial correlation of the ecological environmental quality. The global autocorrelation and local autocorrelation methods can reflect the correlation between variables in the whole study area and the local clustering characteristics of the spatial relationship [30,31]. The global autocorrelation and local autocorrelation are expressed using Moran’s I and local Moran’s I indices, respectively, and are expressed as follows [32]:
I = i = 1 n j 1 n W i j y i y m e a n y j y m e a n S 2 · i = 1 n j 1 n W i j
where y i and y j are the attribute values of cell i and cell j, respectively, and n is the number of spatial cells, representing the weight matrix established based on the spatial connectivity.
The bivariate global autocorrelation and local autocorrelation based on Moran’s I index can be used to describe the degree of correlation of the spatial distribution of different elements, and are expressed as follows:
I l m p = Z l p · q = 1 n W p q · Z m q
Z l p = X l p X l m e a n e l
Z m q = X m q X m m e a n e m
where X l p is the value of attribute l of the space cell P; X m q is the value of attribute m of the space cell q; X l m e a n ,   e l are the mean and variance of attribute l, respectively; X m m e a n ,   e m are the mean and variance of attribute m, respectively.
The value of Moran’s I is within [–1,1], where Moran’s I > 0 indicates a positive association, Moran’s I < 0 indicates a negative association, and Moran’s I = 0 indicates that the attribute values are randomly distributed. With the help of GeoDa 1.14.0 software, local indicator of spatial association (LISA) clustering maps were drawn to reflect the spatial dependence and correlation between the degree of socioeconomic development and ecosystem services based on the Z-value test (p < 0.05). The outputs include high clustering (HH), low clustering (LL), high–low clustering (HL), low–high clustering (LH), and uncorrelated (NN).

3.5. Geographical Detection Factor

To solve the problem of inconsistent resolution, a fishing net was developed when analyzing the driving force [33,34]. Precisely, a 3 × 3 km fishing net divided the research area into 1601 sampling units. The natural breakpoint method was adopted to divide precipitation, temperature, population, land use (LU), GDP, and nighttime light intensity into five categories. Sample points were extracted and fed into geographic detectors to quantify the drivers.
The geographic detector model is powerful enough to analyze the drivers of spatial differentiation [35]. The basic principle of this model is to use the relationship between local and global variances within the layer to detect the explanatory power q-value of the influencing factors, that is, the degree to which the explanatory variable affects the spatial differentiation results of the explained variable. Interaction detectors can be used to determine whether explanatory variables working together will increase or decrease the explanatory power of the explained variable, and the relationship between two explanatory variables can be divided into the following categories (Table 2). Its expression is as follows:
q = 1 1 n σ 2 h = 1 L n h σ h 2
where q is the explanatory power of the influencing factor, and a larger value of q indicates that the influencing factor has a greater influence on the spatial differentiation of the degree of differentiation.

4. Results

4.1. Validity of the MRSEI Model

Table 3 shows the PCA results for the five indicators coupled to the MRSEI. The contributions of the first principal component were 80.68%, 87.13%, 85.09%, 82.17%, and 83.57% in 2000, 2005, 2010, 2015, and 2020, respectively. A value above 80% proved that the first principal component played a dominant role and PC1 integrated the main information. Therefore, it is reasonable to use PC1 to represent the MRSEI. The greenness (NDVI) and humidity (WET) were positive, proving that greenness and humidity played a positive role in the MRSEI. In comparison, DI, LST, and NDBSI, which represent desertification, heat, and dryness, respectively, were negative, proving that sandiness, heat, and dryness played a negative role in the MRSEI. This paper deals with the problem of the plus–minus sign of the principal component load value of each index [36]. Due to the different results calculated by different software, some software may calculate negative values for NDVI and WET, while NDBSI and LST are positive. Therefore, it is necessary to use “1-PC1” for restoration. If the load value of the NDVI and WET in PC1 is positive, and the NDBSI and LST are negative, this operation is not necessary.
Table 4 shows the mean values of the indicators every five years. The MRSEI showed an oscillating upward trend. The NDVI and WET increased and then decreased, but overall showed an upward trend. The DI, LST, and NDBSI showed an oscillating downward trend. The development trends of the five indicators coincided with the development trend of the MRSEI. Thus, the MRSEI can represent the environmental quality using these five indicators.
To evaluate the effectiveness of the MRSEI, this paper compared the RSEI and MRSEI [24,37,38], as shown in Figure 3. The RSEI and MRSEI roughly had the same trend in the evaluation of the environmental quality in Lanzhou City, but there were differences in the spatial distribution and degree.
To further verify the applicability of the MRSEI, this paper analyzed the differences between the RSEI and MRSEI by selecting four representative types of land (construction land, dry land, unused land, and forest land) and comparing local details of the RSEI and MRSEI (Figure 4). Compared with the RSEI, the low-value area of built-up land in the MRSEI was more prominent, which better reflected the detailed characteristics of built-up areas. The dry land and unutilized land in Lanzhou City were more seriously affected by desertification and after adding the sandiness indicator. The MRSEI was more responsive to sandiness and better highlights the contour characteristics and distribution patterns of the dry land and unutilized land than the RSEI. There was no prominent difference between the RSEI and MRSEI in terms of woodland, but the MRSEI shows more obvious distribution details in the surrounding areas of woodland, and the MRSEI can better reflect the contrast between woodland and surrounding areas. The difference between the MRSEI and RSEI is more obvious in dry land compared to other land classes, further indicating that the MRSEI model is more in line with the characteristics of the arid zone in Lanzhou City. Overall, the MRSEI is more suitable to showcase the actual situation in Lanzhou, China.

4.2. Analysis of Spatial and Temporal Variation of the MRSEI

Figure 5 shows the interannual variation trend of the MRSEI in Lanzhou City from 2000 to 2020. The annual average MRSEI showed fluctuating characteristics, with a minimum average MRSEI of 0.254 in 2006 and a maximum average MRSEI of 0.340 in 2018. Overall, the MRSEI showed an upward trend from 0.282 in 2000 to 0.340 in 2020, an increase of 20.57%. The value changes showed two different stages. From 2009 to 2020, the MRSEI showed an oscillating downward trend, but the decline was not large. From 2009 to 2020, the MRSEI showed an upward trend. Moreover, the interannual trend line of the MRSEI was obtained by the fitting process, showing that the annual average MRSEI exhibited an overall slow upward trend.
Trend analysis was adopted to showcase the spatiotemporal trends of the MRSEI in Lanzhou City (Figure 6 and Figure 7). As shown in Figure 7, when the values of the change trend were greater than zero, the environmental quality improved. When the values of the change trend were less than zero, the environmental quality degraded. The MRSEI in most areas showed an increasing trend, among which the rising trend was more obvious in the northwestern part, close to the woodland and might be influenced by greenness and humidity. However, there was a decreasing trend in the south-central and north-central parts, which were mainly areas of dense human population and dry lands. Therefore, human activities as well as changes in the natural environment might interfere with the ecological environment quality in Lanzhou City, China.
From a spatial perspective (Figure 8, Table 5), the largest proportion of areas with very significant improvement (42.369%) were mainly in the western, central, and northeastern parts, and the proportion of areas with significant improvement (22.808%) were mainly in the western, central, and northeastern regions. The proportion of areas with significant improvement was 22.808%. About one-third (32.882%) of the total area remained unchanged, mainly in the southern region and a small part of the northern region. Very significantly degraded and significantly degraded areas accounted for 1.259% and 0.682%, respectively, mainly in the south-central and northern areas. These areas underwent more intensive human activities, proving that the degradation of the ecological environment quality was directly caused by human activities.

4.3. Spatial Correlation Analysis of Ecological Environment Quality

The global Moran’s I index was greater than 0.89 during the study period (Table 6), with an overall upward trend (p < 0.01, z > 1.96). This indicates that the ecological environmental quality from 2000 to 2020 had a significant positive spatial correlation and was clustered, with the spatial clustering characteristics of high–high and low–low constantly strengthened.
The local spatial autocorrelation analysis showed that the local spatial characteristics of the ecological environment quality had five types of spatial characteristics: high–high, high–low, low–low, low–high, and non-significant (Figure 9). As shown in Figure 9, the local Moran’s I index of the RSEI was mainly distributed in the first and third quadrants, i.e., high–high and low–low clustering types, which were spatially positively correlated. The number of grids in the second and fourth quadrants was lower, as was the number of grids in the low–low quadrant. The number of grids in quadrants two and four was smaller, and they are of the low–high and high–low types with polarization. Moreover, the overall spatial pattern around 2020 was relatively stable with limited changes (Figure 9).
The spatial pattern of the ecological environment quality was dominated by high–high and low–low agglomeration types. High–high types were mainly in the northwest and southwest parts, of which the southwest kept expanding with limited increase and had a certain spatial spillover effect. The high-value area was closely related to the distribution of woodland with high humidity and greenness levels. Low–low types were in the central part with a block-like clustered distribution, spreading along the periphery, roughly consistent with the layout of construction land. The expansion of construction land leads to the increasing fragmentation of grassland and cultivated land, and the dryness and heat gradually increase. In the future, we should pay attention to the dryness and heat effect brought by the urban construction area, improve the urban blue–green space layout, and comprehensively improve the level of urban humidity and greenness.

4.4. Driving Factors

4.4.1. Analysis of Changes in Driving Factors

Before driving force analysis, the multicollinearity of each variable was tested to ensure the reliability of the regression results. The maximum value of the variance inflation factor (VIF) among the variables was 5.61, and the average value was 2.54, lower than the warning value of 10 (Table 7). Therefore, there was no serious collinearity problem.
From 2000 to 2020, the temperature showed a general trend of increasing with insignificant spatial variation (Figure 10). The temperature in 2000 was −1.375 to 9.825 °C, and the temperature in 2020 was −0.833 to 10.325 °C. The precipitation showed a general trend of decreasing with little spatial variation. The spatial distribution of the population was higher in the central city and lower in the rest of the city. The GDP had a similar spatial distribution compared to the population. The GDP range in 2000 was 7.04–4.149 million RMB/km2, and GDP in 2020 was 66–101.681 million RMB/km2, indicating that the GDP of Lanzhou City has increased significantly in the past 20 years. From 2000 to 2020, most of the land was grassland and cropland, compared with lower water area and unused land. Over the past 20 years, the land use (LU) in Lanzhou shifted between cropland, grassland, forest land, and construction land. The development of urbanization has intensified, with a significant decrease in arable land and the expansion of construction land. In 2000, the Digital Number (DN) value of night lighting was 0–416.37, and the DN value was 0–431.48 in 2020, indicating that the night lighting has increased over the past 20 years.

4.4.2. Single-Factor Detection Analysis

Table 8 presents the impact of GDP, land use, temperature, precipitation, nighttime lights, and population on the MRSEI. The results showed that land use, temperature, and precipitation had a more significant influence on the environmental quality. The largest q-value among the five years was temperature, with values of 0.537, 0.509, 0.467, 0.547, and 0.528, respectively. In each year, the explanatory power of GDP, population, and nighttime lights was lower, indicating that human activities have less influence on the environmental quality. Temperature was the main factor affecting the environmental quality in recent years.

4.4.3. Multi-Factor Detection Analysis

To further explore the cross-interaction among the factors, interaction detection was performed by the geographic cross-factor module. The results showed that the interaction between the factors was more significant (Figure 11). The q-value of Temperature ∩ LU was largest in 2000, indicating that the interaction influence of temperature and land use was the strongest. In 2005, 2010, 2015, and 2020, Temperature ∩ Precipitation was the main driver of the MRSEI. Meanwhile, precipitation and temperature also showed a strong influence when interacting with other factors, mainly because both precipitation and temperature were the main factors influencing the MRSEI. Overall, the interaction between GDP, population, and nighttime lights were all lower compared with the single-factor detection, while the q-values of both temperature and precipitation increased when they interacted with other factors. Therefore, precipitation and temperature had a stronger interaction when combined with other factors and could interact with other factors to greatly impact the environmental quality. This also indicates that temperature and precipitation were the key factors affecting the environmental quality.

5. Discussion

5.1. Advantages of the MRSEI

At present, the RSEI is often used in the ecological environment assessment of cities or watersheds [9,39,40]. Because there are differences in the ecological characteristics of each region, many scholars have improved the RSEI according to the characteristics of the region by adding indices that can represent the characteristics of the region [41,42]. There are relatively few studies on semi-arid regions. China is one of the countries most affected by desertification in the world. The problems of cultivated land degradation and pasture shrinkage caused by land desertification are becoming more and more serious [43]. At the same time, disasters such as sandstorms seriously threaten the living environment of the local and surrounding areas [44]. Lanzhou City has a temperate continental climate with little precipitation. It faces serious ecological problems in the process of rapid urbanization, among which desertification is particularly prominent [18]. Based on the ecological characteristics of the study area, the impact of desertification on the quality of the ecological environment cannot be ignored [41]. Therefore, this paper constructed an MRSEI index by introducing DI into the RSEI, conducting long-term dynamic assessment of the environmental quality of Lanzhou City through the GEE platform. It was found that the degree of desertification in this area was directly related to vegetation coverage, and DI could effectively reflect the degree of desertification [28]. Therefore, the inclusion of DI can improve the characteristics of the RSEI of Lanzhou’s environmental quality. The contribution rate of PC1 of the MRSEI was above 80% from 2000 to 2020, indicating that PC1 could comprehensively represent the information of various indicators. Compared with the RSEI, the comprehensive information reflected by the MRSEI was clearer, and the local texture features were more clearly distinguished, especially in unused land, construction land, and dry land. The evaluation results obtained were closer to the real surface conditions. This is due to the effective integration of DI factors into the MRSEI, which expanded its research area’s applicability, especially to arid and semi-arid areas.

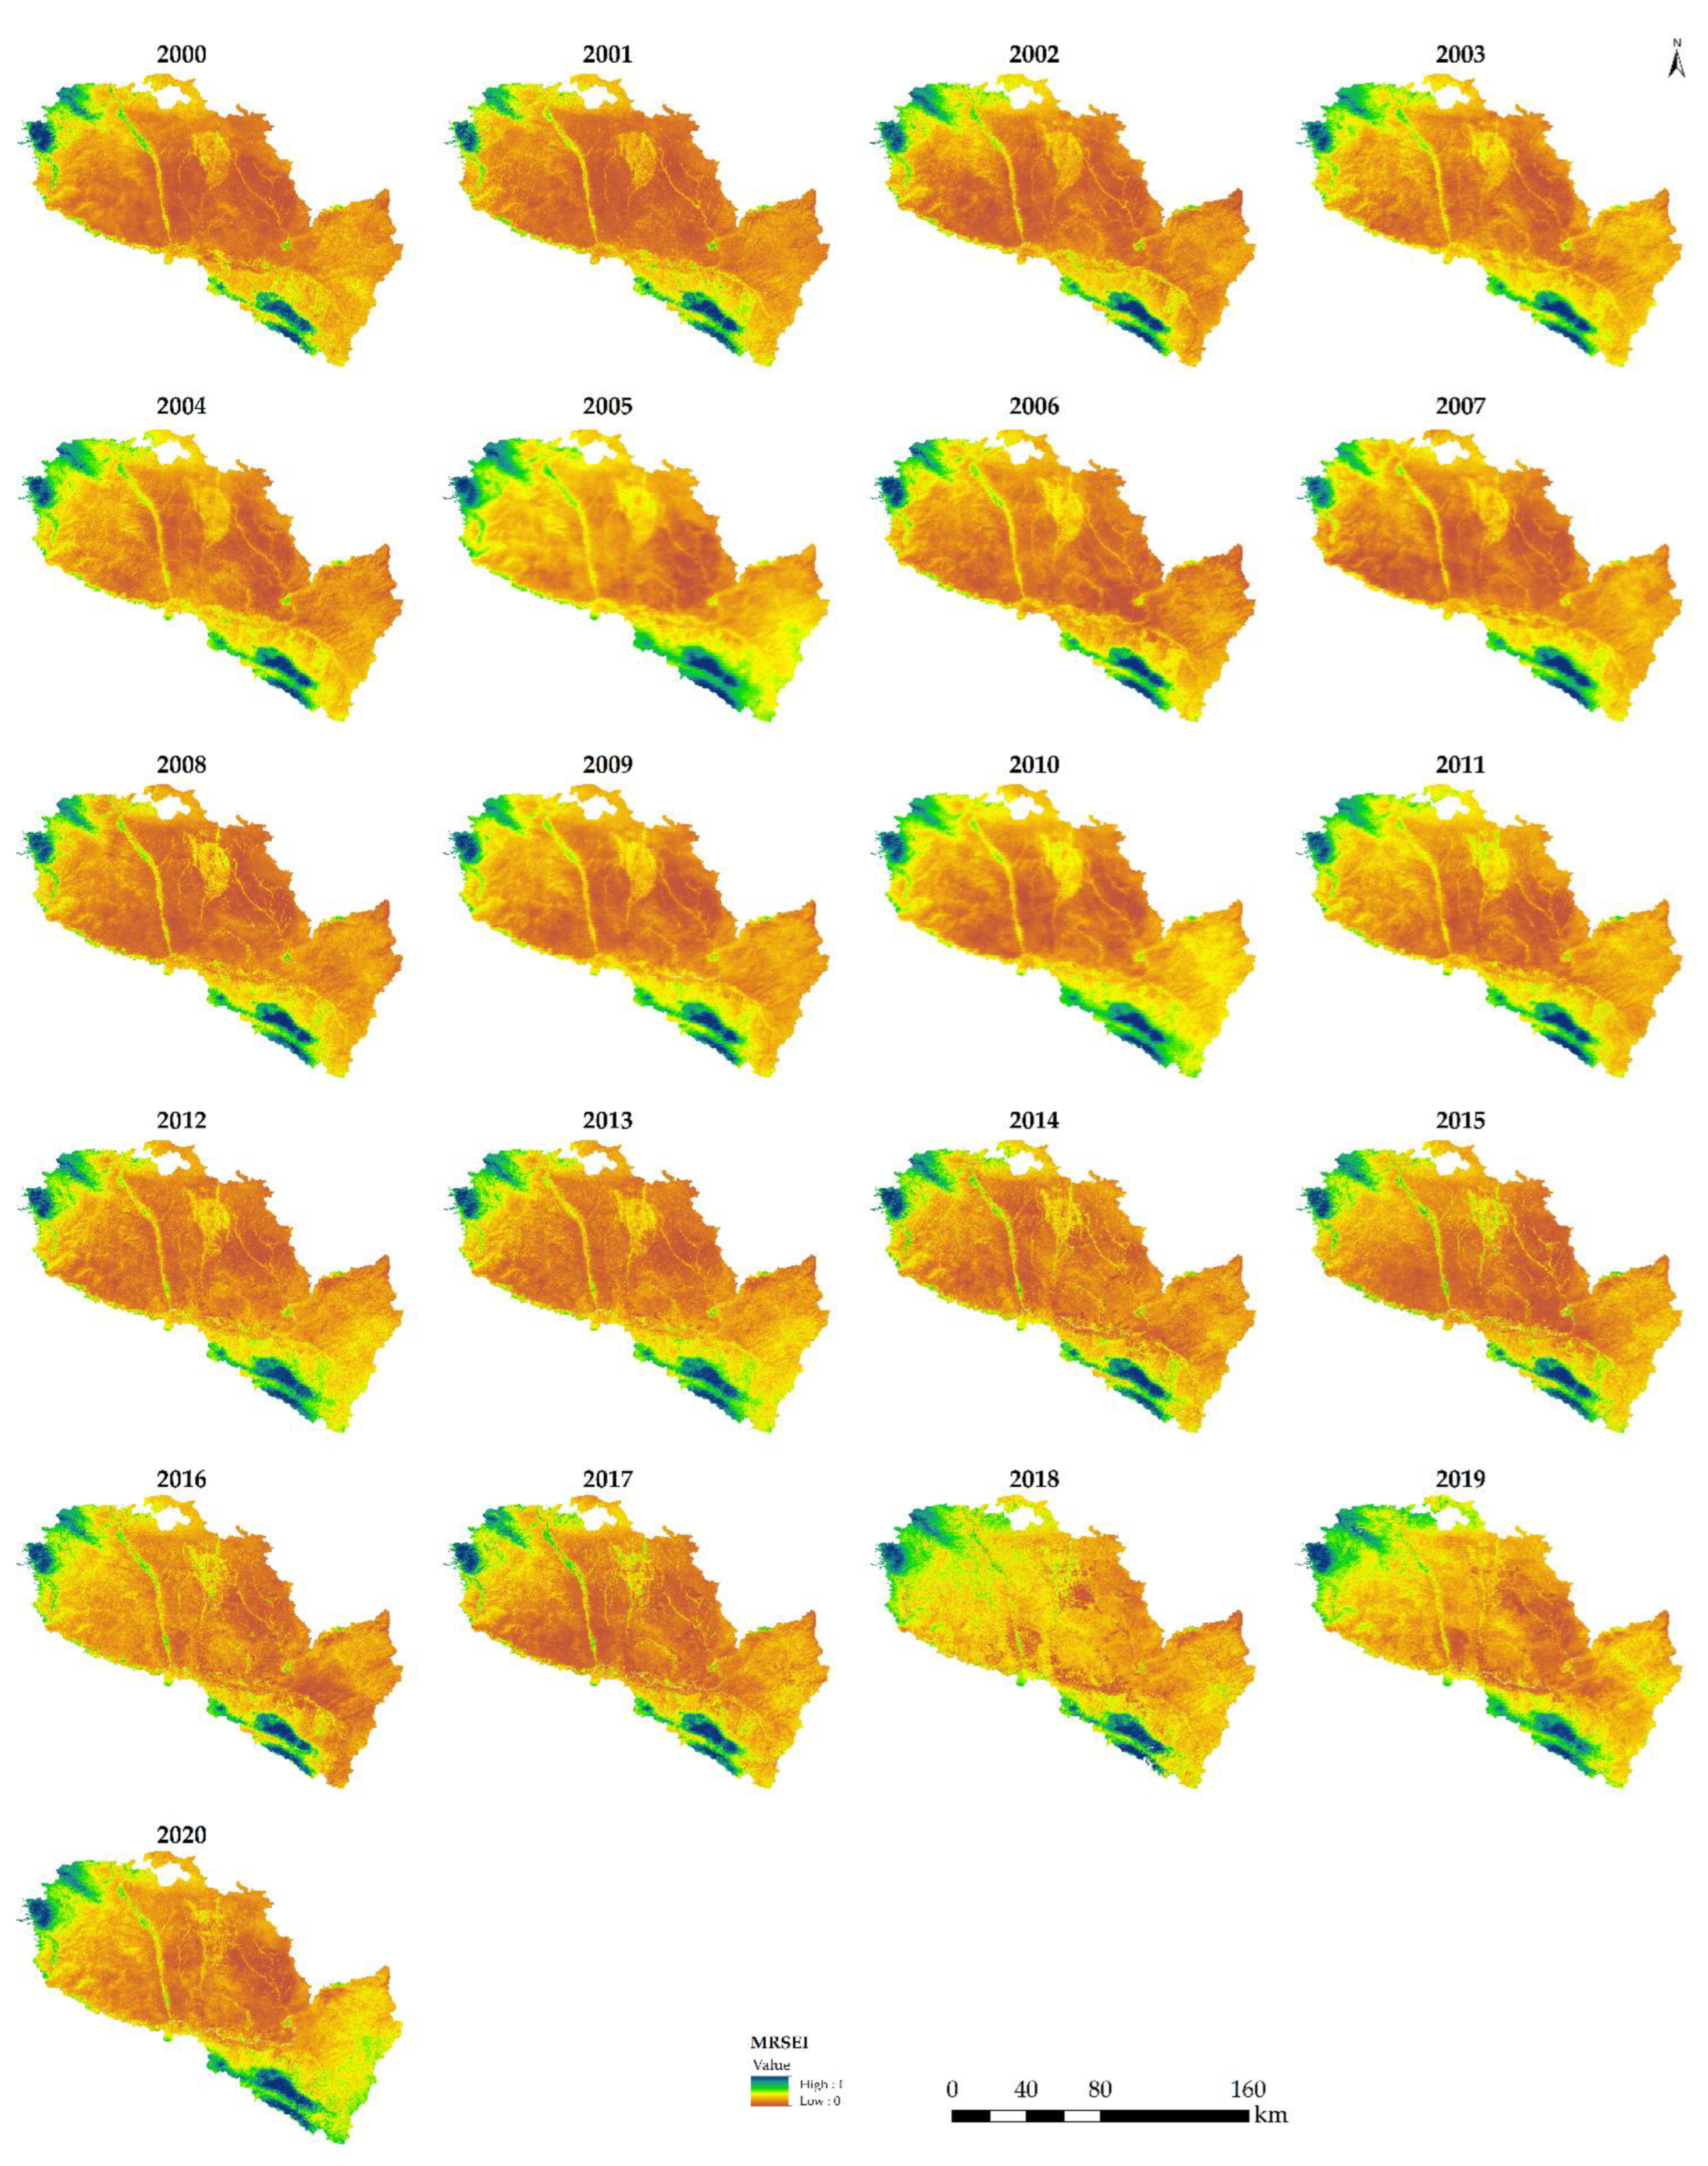
5.2. Changes in the MRSEI

The ecological environment quality of Lanzhou City presented a wave-like rising trend, which is consistent with the conclusions of other researchers. For example, from 2000 to 2020, urban green spaces in Lanzhou had an obvious two-stage evolution process, which was a V-shaped change process of decline–rise, and the overall trend was upwards [45]. Since 2000, Lanzhou has carried out a number of ecological restoration projects to reduce the spread of sand and improve human living conditions. These projects include the integrated protection and systematic management of mountains, rivers, forests, fields, lakes, grass, and sand; natural forest protection; restoration of degraded forests; three northern shelterbelts, etc. [17]. This proves that actions to improve ecological quality in Lanzhou can achieve positive results.
In addition, our study uses statistical yearbooks to determine the state of environmental restoration in Lanzhou. The survey results show that between 2000 and 2020, the area of green coverage increased from 1929 hectares to 11,451.07 hectares, the area of garden green space increased from 1450 hectares to 10,003.6 hectares, and the per capita public green area increased from 2.56 square meters to 13.19 square meters. From 2010 to 2020, the afforestation area of barren hills and wasteland expanded from 66,200 mu to 169,100 mu. This shows that ecological management has progressed in the government. This supports the findings of this study in terms of spatial and temporal characteristics of MRSEI evolution in Lanzhou City and MRSEI trend analysis, that the overall ecological environment of Lanzhou City has improved from 2000 to 2020. The change in the environmental quality is affected by many factors [46,47].

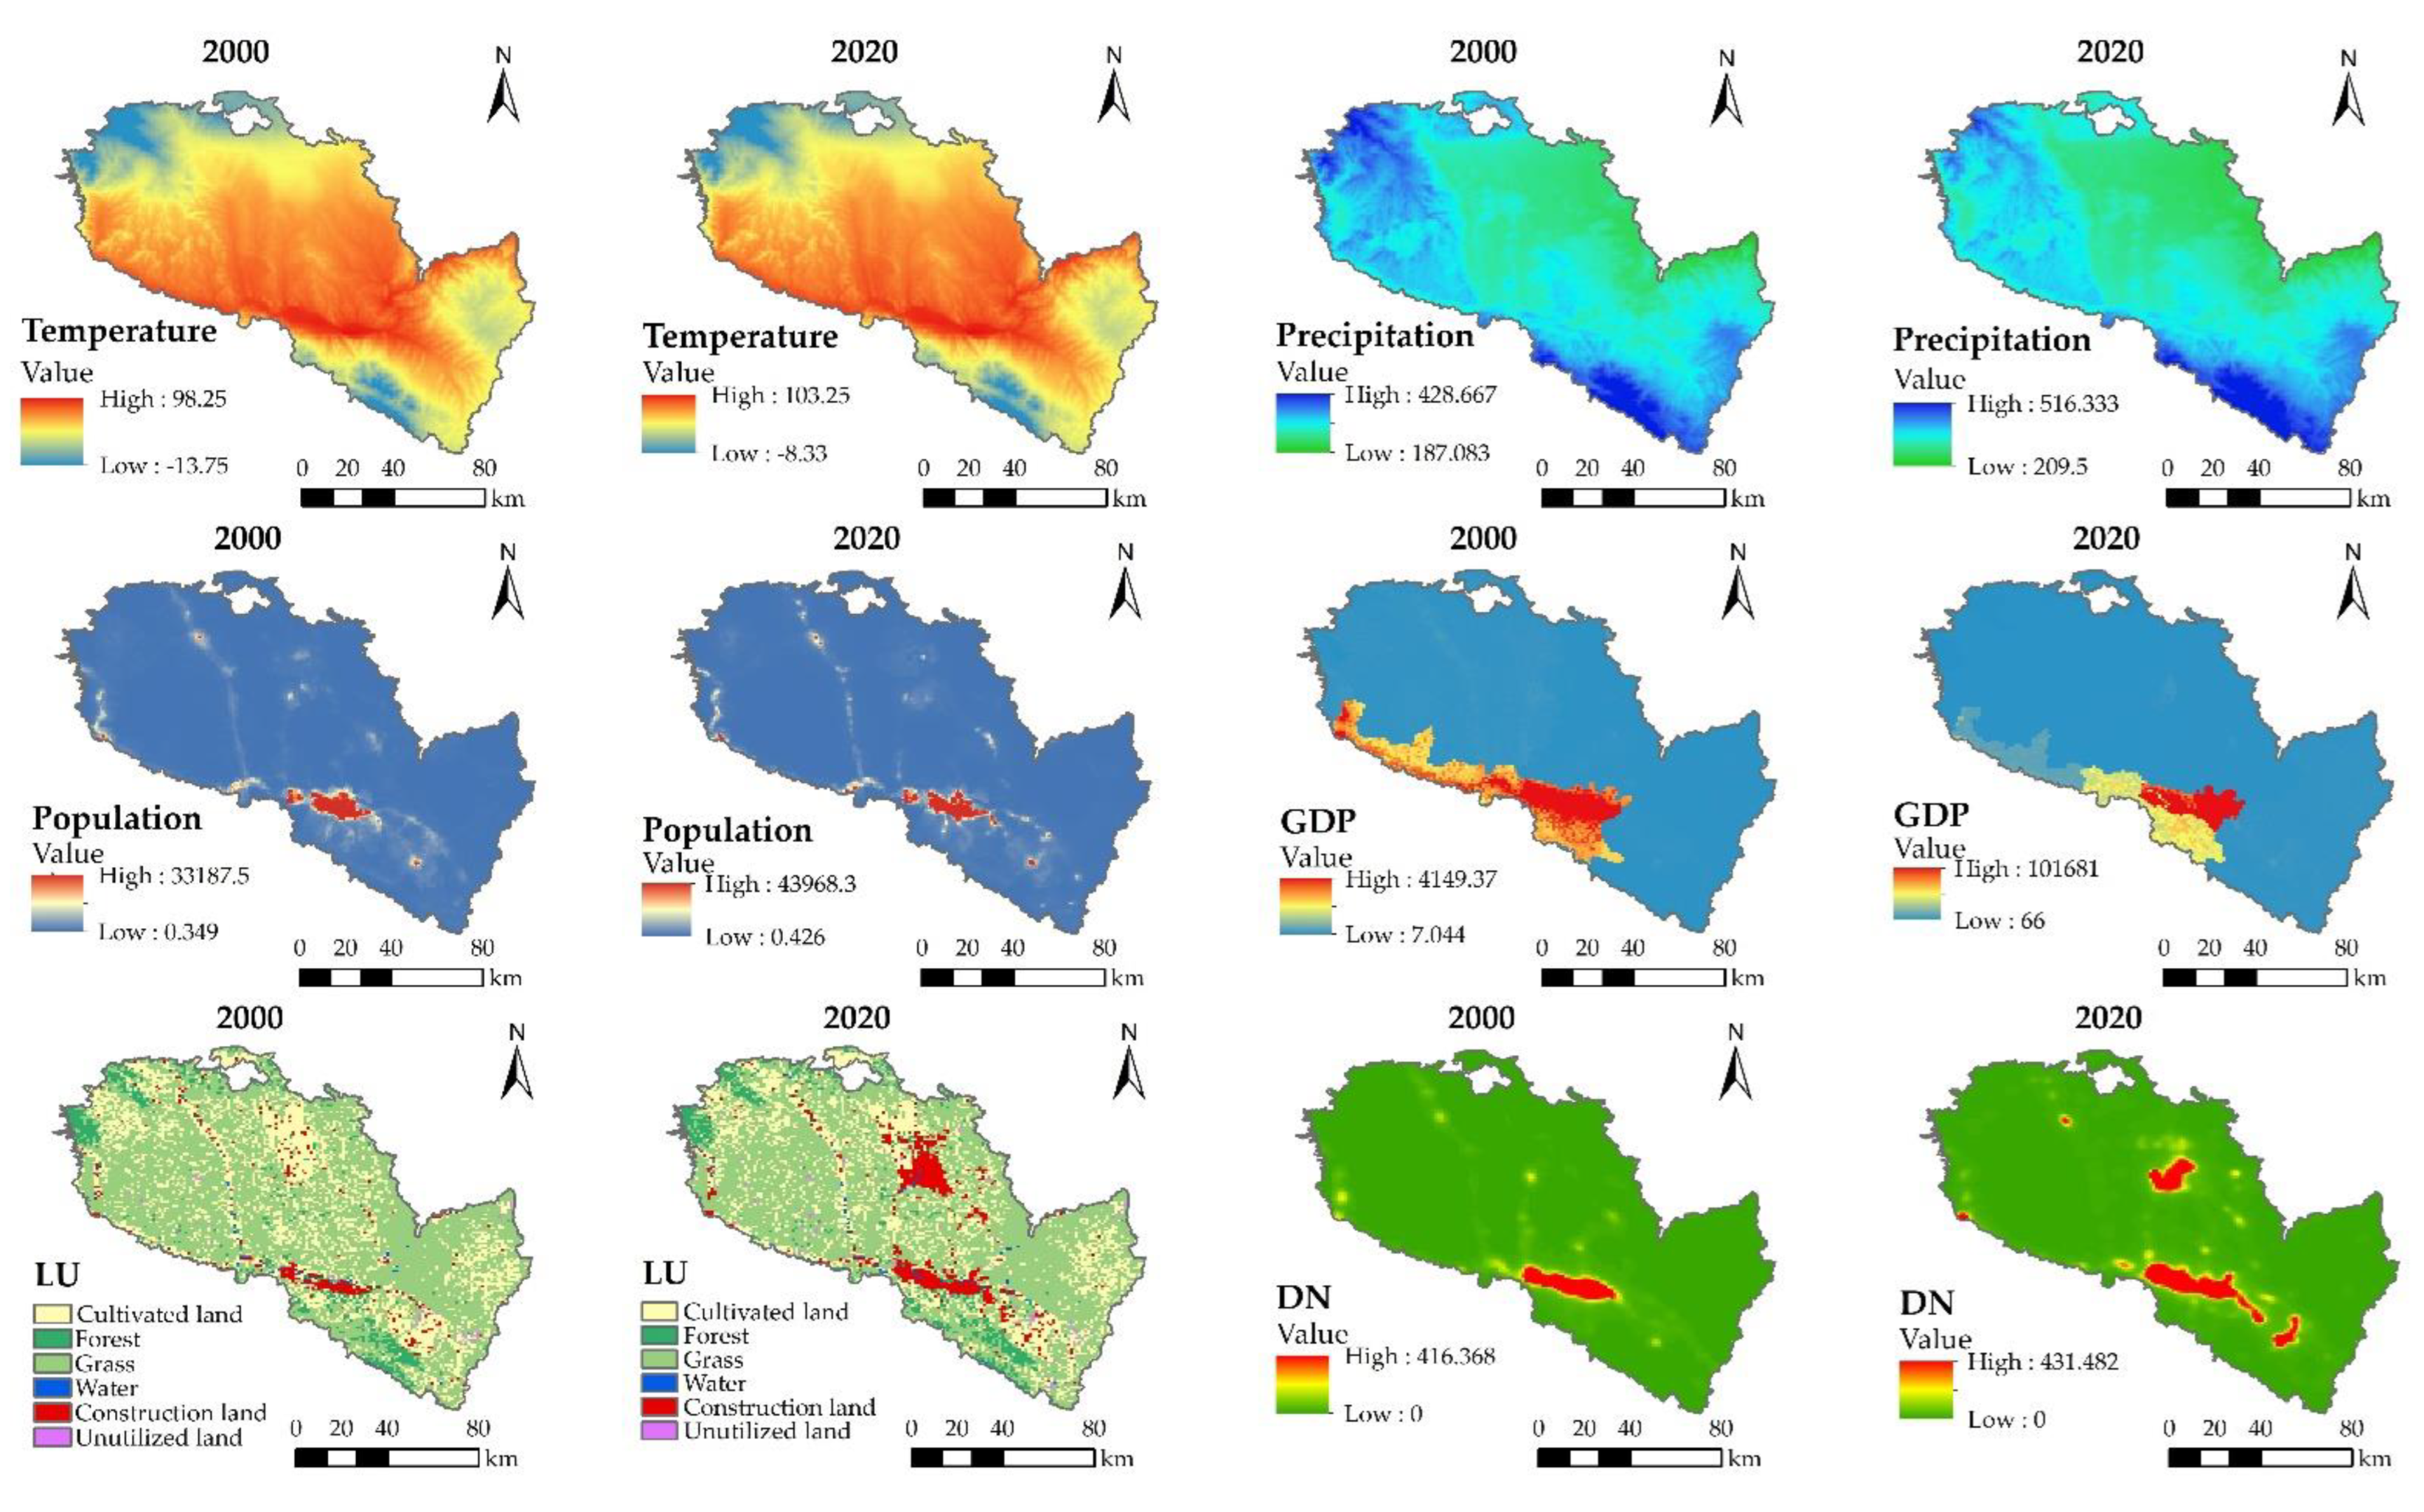
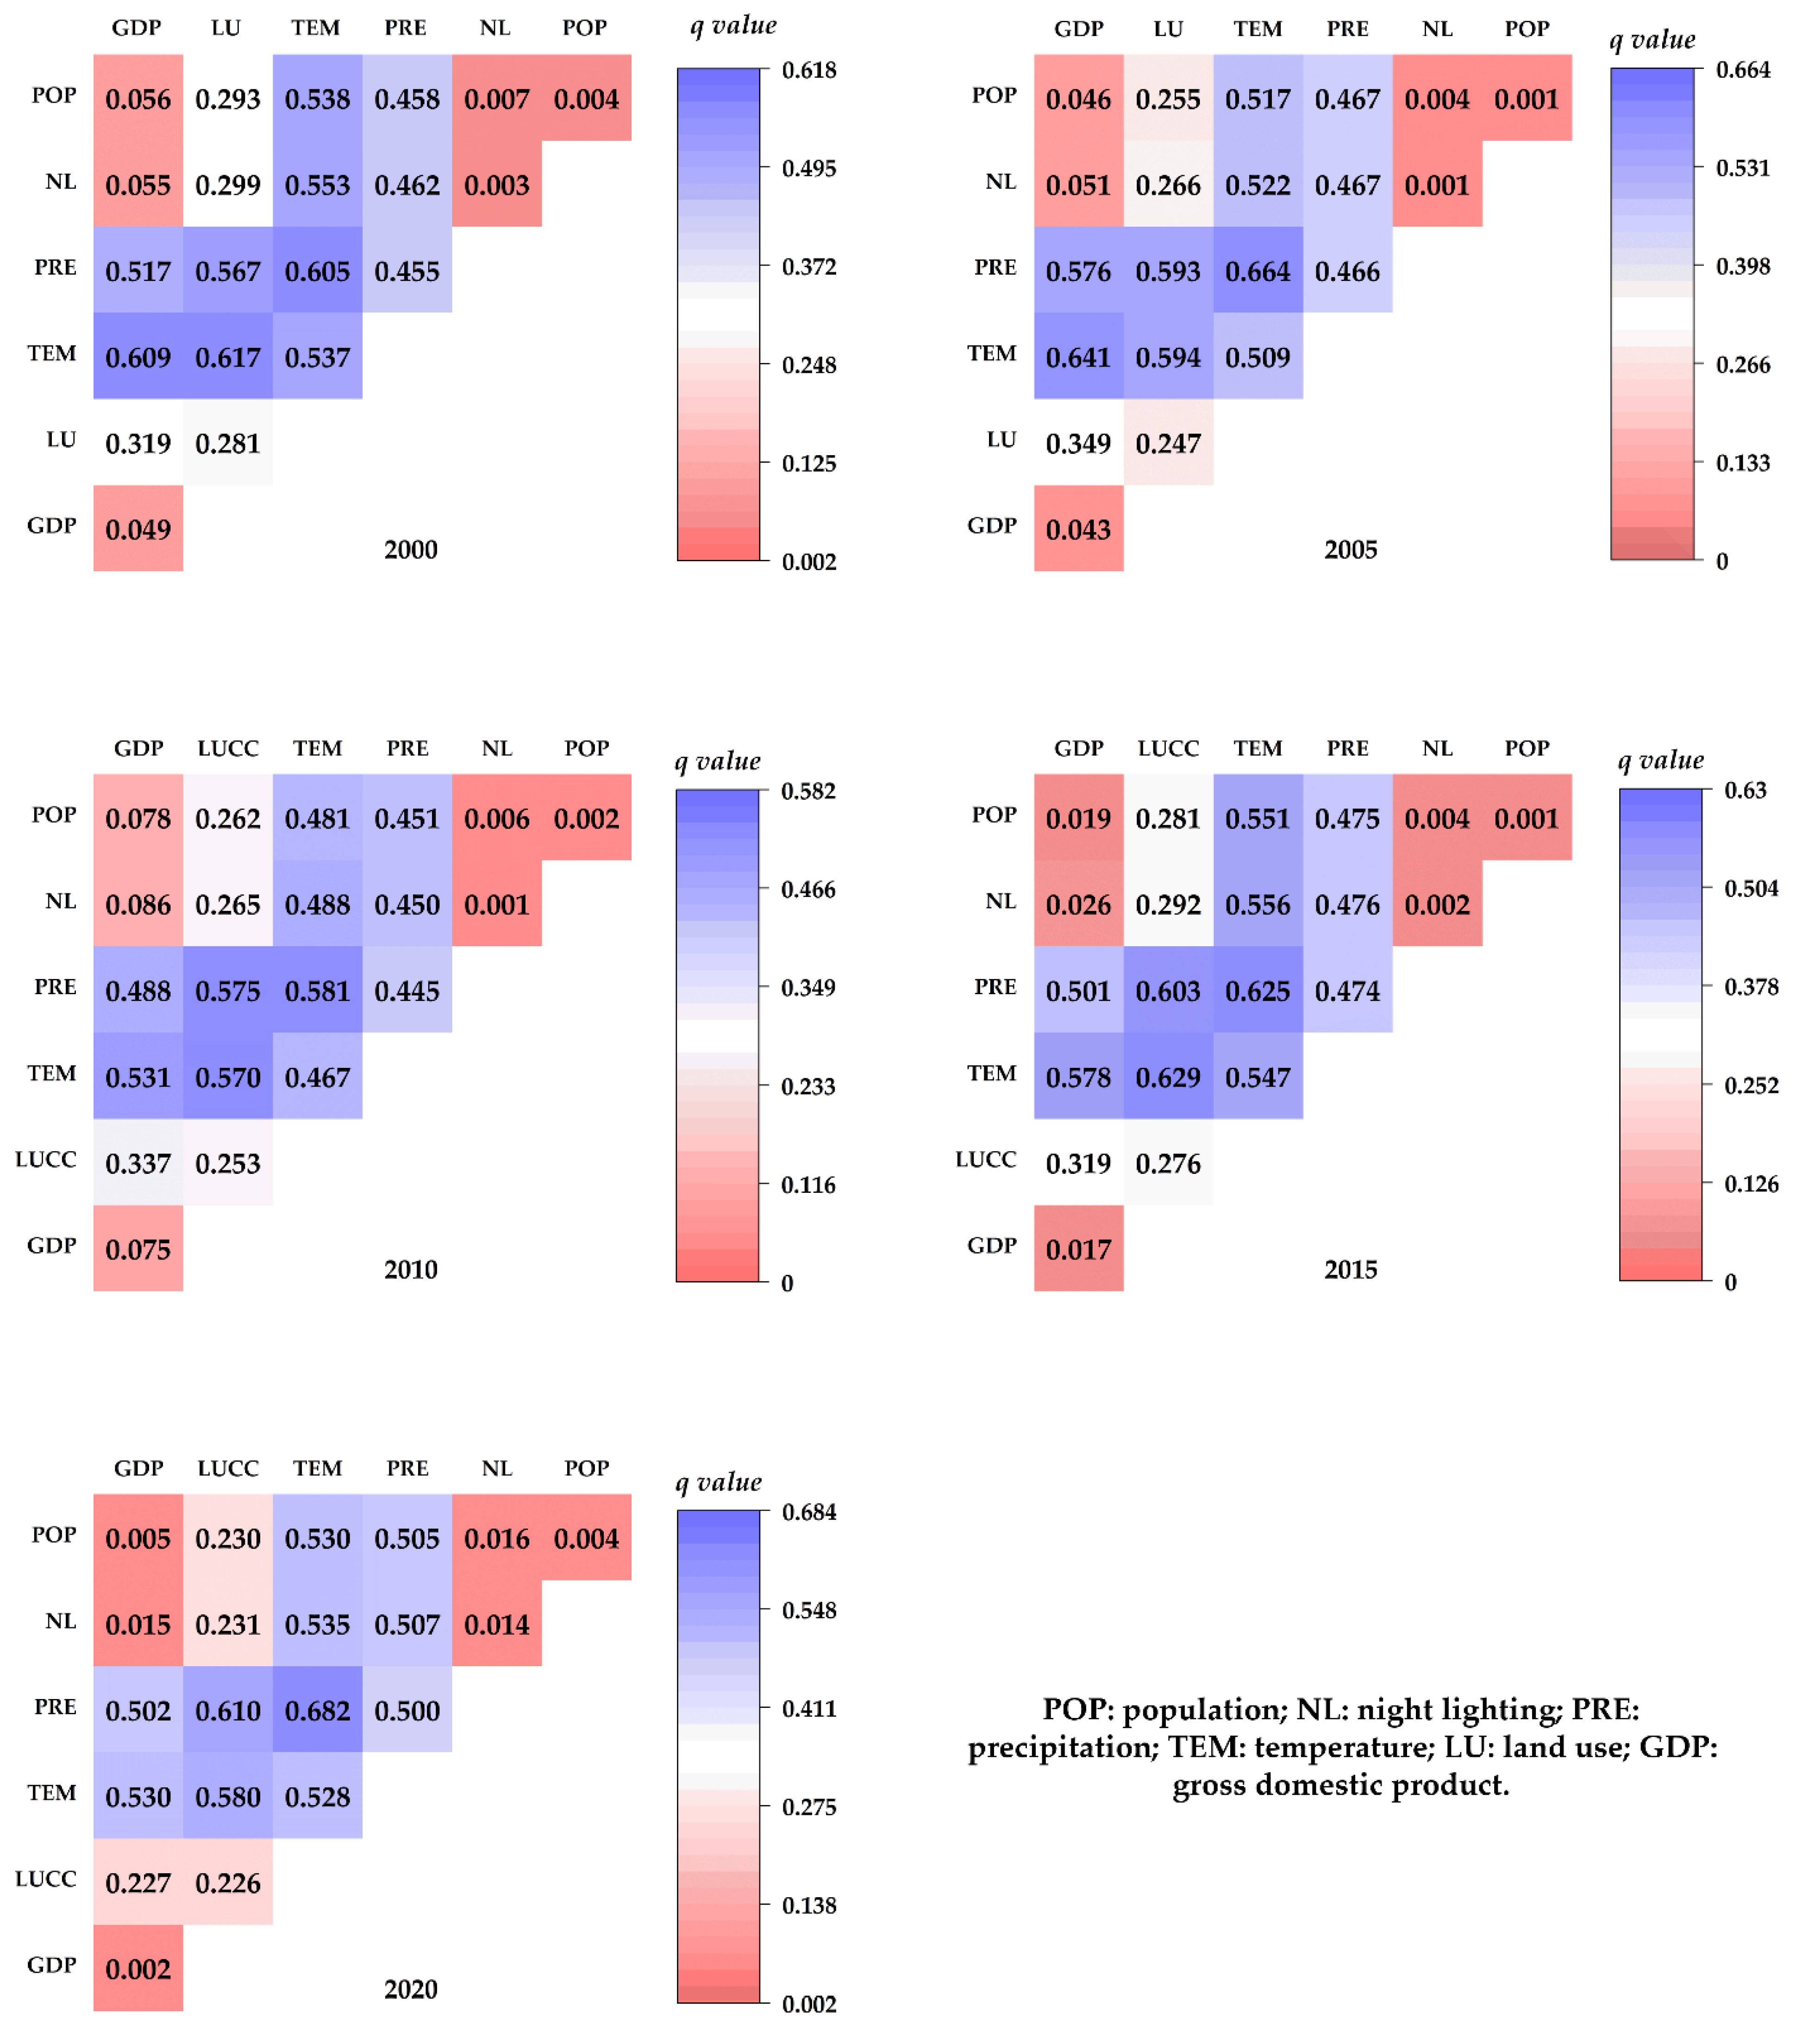
5.3. Driving Forces of the MRSEI

This study explores the degree of influence of natural and socioeconomic factors on the environmental quality of Lanzhou City. During the study period, the temperature and precipitation q-values continued to increase and remained at a relatively high level, indicating that temperature and precipitation have important long-term effects on the degree of influence on the ecological environment quality in the study area. This is consistent with the conclusions of related studies that climate change has significant impacts on ecosystems [48,49]. Climate change not only has a direct positive impact on the RSEI, but it can also have an indirect impact on the RSEI by affecting precipitation, vegetation growth, and terrain [50]. The improvement of the terrestrial ecosystem is conducive to the better development of the climate, thus forming a virtuous circle to jointly promote the improvement of the RSEI.
At the same time, there is a close relationship between vegetation growth and ecological quality, and many scholars’ conclusions on vegetation changes are similar to this study. Vegetation changes will be affected by natural factors and human activities, and climate is the main factor that determines the distribution of vegetation types. The most important climatic factors are temperature, precipitation, and sunshine duration [51]. Milich & Weiss found that precipitation plays a decisive role in the seasonal NDVI [52]. Lamchin et al. found a good correlation between vegetation change, temperature, and precipitation in semi-arid regions [53].
The influence of social and economic factors on the ecological environment of Lanzhou City is relatively low. This is due to the low degree of urban development in Lanzhou City. Although social and economic activities have an impact on the ecological quality of local areas, from the perspective of the overall region, social and economic activities are not the leading factors affecting the environmental quality of Lanzhou City. Due to the special geographical environment of Lanzhou City, which is long and narrow and surrounded by mountains, its urban development model must be limited to a certain area and restricted by natural geographical conditions. The urban area of Lanzhou City reports small-scale and low-level development [54].

5.4. Implications

This paper examines the changes and driving influences on the ecological quality of Lanzhou City, which is conducive to the future policy development of the city. The climate is a key factor affecting the ecological quality of Lanzhou City, especially temperature and precipitation. The problem of climate change is a global challenge, and its solution requires global cooperation and practical actions. Reducing greenhouse gas emissions is an effective way to mitigate climate change, and countries should take measures to reduce carbon emissions, such as adopting renewable energy, increasing the use of public transportation, and limiting pollution from power plants. Meanwhile, planting trees not only reduces carbon dioxide emissions, but also improves the ecological environment and promotes land conservation and water resource management. In view of the desertification problem in Lanzhou City, the implementation of a series of ecological construction projects, such as the Three North Protective Forests, the Closed Protected Areas, the protection and restoration of desert grasslands, the comprehensive management of soil and water conservation and erosion, the integrated protection and systematic management of mountains, water, forests, lakes, grasslands, and sandy areas, the protection of natural forests, the restoration of degraded forests, etc., will make it possible to significantly increase the cover of forests, grasses, and vegetation, playing an important role in the reduction in desertification in terms of both area and degree.

5.5. Limitations and Future Perspectives

The study area in Lanzhou was selected according to the administrative division, and the natural space and environmental space effects were not limited by the natural division, which inevitably led to limitations of the research results. In the selection of influencing factors, more indicators that can reflect the actual situation of the study area should be selected in the future [41,55]. In addition, in the area of ecological environment quality modeling, the National Earth System Science Data Center (http://www.geodata.cn, accessed on 2 May 2023) released the latest China’s historical 1 km resolution eco-environmental quality dataset (CHEQ), which fills a research gap in the field of ecological environment quality monitoring in China [56,57]. Future research should refer to the CHEQ for studies related to the evaluation of ecological quality. The method of the CHEQ should be further explored, and the CHEQ should be used as an index for the validation of the results to obtain more accurate results. The results of this study suggest that climate plays a more important role in the MRSEI, so further research on the response of the state of Lanzhou to climate change should be considered in future studies.

6. Conclusions

This study presented the incorporation of a desertification index into the traditional RSEI model, resulting in the development of the MRSEI model. This enhanced model considers the arid and semi-arid characteristics of the study area, allowing it to effectively assess the ecological environment quality in Lanzhou City. Furthermore, the study investigated the spatial and temporal variations in the ecological environment quality and examines the influence of natural and economic factors such as temperature, precipitation, GDP, and population. The findings of this study will contribute to the establishment of a theoretical foundation for promoting the coordinated development of economic construction and the ecological environment in Lanzhou City, facilitating the advancement of high-quality urban development. Compared to the conventional RSEI, the improved MRSEI demonstrates higher sensitivity to vegetation in arid and semi-arid regions and exhibits a superior discriminatory capability for impervious surfaces, land areas, and sandy regions. As such, it proves to be a suitable model for evaluating ecological quality in Lanzhou City.
Over the study period from 2000 to 2020, the overall MRSEI exhibited a positive upward trend, indicating an improvement in the environmental quality. The northwestern region of the study area experienced growth, while a decline in ecological quality was observed in the densely populated central part of the study area. The MRSEI values displayed a significant positive spatial correlation and exhibited clustering characteristics. High–high (H-H) areas were concentrated in the northwest and southwest, while low–low (L-L) zones were distributed in the central part, demonstrating a blocky agglomeration distribution with a gradual spread along the periphery.
The analysis reveals that land use, temperature, and precipitation exert a substantial influence on the ecological environment quality in Lanzhou City. Temperature emerges as the most significant factor, with a q-value reaching as high as 0.5469. Additionally, temperature and precipitation demonstrate a strong interaction when combined with other factors, thus indicating their ability to interact with various elements and influence the environmental quality in Lanzhou City. This highlights the crucial role of temperature and precipitation as key factors affecting the environmental quality in the region.
The ecosystems in different study areas are characterized by different components, and the natural environments and morphological features of the ecosystems therein are also very different. Therefore, we suggest that when selecting different ecosystems as research objects, we should screen and deliberate according to the actual situation of the study area, selecting the natural factors that are practical and have significant characteristics to construct the ecological evaluation model. For example, factors such as habitat quality index (HQI), degree of soil erosion, and vegetation evapotranspiration can be combined to accurately assess the quality of the environment at more levels.

Author Contributions

Conceptualization, L.D., B.-J.H. and J.W.; methodology, L.D. and B.-J.H.; software, Y.X.; validation, F.Z., Y.X. and S.X.; data curation, F.Z., Y.X. and S.X.; writing—original draft preparation, L.D., B.-J.H. and J.W.; writing—review and editing, L.D., B.-J.H. and J.W.; funding acquisition, L.D. All authors have read and agreed to the published version of the manuscript.

Funding

This research was funded by the National Natural Science Foundation of China (42377472, 42174055), Jiangxi Provincial Social Science Foundation Project (23GL34), Humanities and social science research project of universities in Jiangxi Province (GL22228), Open Fund of Key Laboratory of Mine Environmental Monitoring and Improving around Poyang Lake of the Ministry of Natural Resources (Grant No. MEMI-2021–2022-28), Key Laboratory for Digital Land and Resources of Jiangxi Province, East China University of Technology (DLLJ202207), Science and Technology Research Project of Jiangxi Provincial Department of Education (GJJ2200741), the Graduate Innovation Fund of Jiangxi (YC2023-S583), and the Doctoral Research Initiation fund of East China University of Technology (DHBK2019184).

Acknowledgments

We would like to thank the editors and anonymous reviewers for their constructive comments and suggestions, which helped to improve the quality of the paper.

Conflicts of Interest

The authors declare no conflict of interest.

References

  1. Ji, J.; Wang, S.; Zhou, Y.; Lin, W.; Wang, L. Spatiotemporal change and landscape pattern variation of eco-environmental quality in Jing-Jin-Ji urban agglomeration from 2001 to 2015. IEEE Access 2020, 8, 125534–125548. [Google Scholar] [CrossRef]
  2. Sun, J.; Hu, Y.; Li, Y.; Weng, L.; Bai, H.; Meng, F.; Wang, T.; Du, H.; Xu, D.; Lu, S. A temporospatial assessment of environmental quality in urbanizing Ethiopia. J. Environ. Manag. 2023, 332, 117431. [Google Scholar] [CrossRef] [PubMed]
  3. Wang, Z.; Lyu, L.; Lin, W.; Liang, H.; Huang, J.; Zhang, Q. Topogaphic patterns of forest decline as detected from tree rings and NDVI. Catena 2021, 198, 105011. [Google Scholar] [CrossRef]
  4. Zhao, G.; Mu, X.; Wen, Z.; Wang, F.; Cao, P. Soil erosion, conservation, and eco-environment changes in the loess plateau of China. Land Degrad. Dev. 2013, 5, 499–510. [Google Scholar] [CrossRef]
  5. Zhang, F.; Xing, Z.; Zhao, C.; Deng, J.; Yang, B.; Tian, Q.; Rees, H.; Badreldin, N. Characterizing long-erm sil and water erosion and their interactions with various conservation practices in the semi-arid Zulihe Basin, Dingxi, Gamsu, China. Ecol. Eng. 2017, 106, 458–470. [Google Scholar] [CrossRef]
  6. Kourtit, K.; Nijkamp, P.; Suzuki, S. Are global cities sustainability champions? A double delinking analysis of environmental performance of urban agglomerations. Sci. Total Environ. 2020, 709, 134963. [Google Scholar] [CrossRef] [PubMed]
  7. Pricope, N.; Mapes, K.; Woodward, K. Remote sensing of human–environment interactions in global change research: A review of advances, challenges and future directions. Remote Sens. 2019, 11, 2783. [Google Scholar] [CrossRef]
  8. Xiong, Y.; Xu, W.; Lu, N.; Huang, S.; Wu, C.; Wang, L.; Dai, F.; Kou, W. Assessment of spatial–temporal changes of ecological environment quality based on RSEI and GEE: A case study in Erhai Lake Basin, Yunnan province, China. Ecol. Indic. 2021, 125, 107518. [Google Scholar] [CrossRef]
  9. Xu, H.; Wang, Y.; Guan, H.; Shi, T.; Hu, X. Detecting ecological changes with a remote sensing based ecological index (RSEI) produced time series and change vector analysis. Remote Sens. 2019, 11, 2345. [Google Scholar] [CrossRef]
  10. Xu, D.; Yang, F.; Yu, L.; Zhou, Y.; Li, H.; Ma, J.; Huang, J.; Wei, J.; Xu, Y.; Zhang, C.; et al. Quantization of the coupling mechanism between eco-environmental quality and urbanization from multisource remote sensing data. J. Clean. Prod. 2021, 321, 128948. [Google Scholar] [CrossRef]
  11. Jia, H.; Yan, C.; Xing, X. Evaluation of Eco-Environmental Quality in Qaidam Basin Based on the Ecological Index (MRSEI) and GEE. Remote Sens. 2021, 13, 4543. [Google Scholar] [CrossRef]
  12. Jia, H.; Pan, D.; Zhang, W. Health assessment of wetland ecosystems in the Heilongjiang River Basin, China. Wetlands 2015, 35, 1185–1200. [Google Scholar] [CrossRef]
  13. Gorelick, N.; Hancher, M.; Dixon, M.; Llyushchenko, S.; Thau, D.; Moore, R. Google earth engine; planetary-scale geospatial analysis for everyone. Remote Sens. Environ. 2017, 202, 18–27. [Google Scholar] [CrossRef]
  14. Wang, L.; Diao, C.; Xin, C.; Yin, D.; Ln, Y.; Zou, S.; Erickson, T.A. A summary of the special issue on remote sensing of land change science with Google earth engine. Remote Sens. Environ. 2020, 248, 112002. [Google Scholar] [CrossRef]
  15. Firozjaei, M.K.; Fathololoumi, S.; Kiavarz, M.; Biswas, A.; Homaee, M.; Alavipanah, S.K. Land Surface Ecological Status Composition Index (LSESCI): A novel remote sensing-based technique for modeling land surface ecological status. Ecol. Indic. 2021, 123, 107375. [Google Scholar] [CrossRef]
  16. Xu, H. A remote sensing urban ecological index and its application. Acta Ecol. Sin. 2013, 33, 7853–7862. [Google Scholar]
  17. Gansu Provincial Forestry and Grassland Bureau. Bulletin on Desertification and Desertification Land Status in Gansu Province. Gansu Dly. 2023, 6, 10. [Google Scholar]
  18. Ding, Q.; Wang, X.; Shang, L. Dynamic changes and prevention strategies of water erosion and desertification in Gansu Province. Soil Water Conserv. China 2013, 08, 29–31. [Google Scholar]
  19. Yuan, B.; Fu, L.; Zou, Y.; Zhang, S.; Chen, X.; Li, F.; Deng, Z.; Xie, Y. Spatiotemporal change detection of ecological quality and the associated affecting factors in Dongting Lake Basin, based on RSEI. J. Clean. Prod. 2021, 302, 126995. [Google Scholar] [CrossRef]
  20. Zhang, Y.; She, J.; Long, X.; Zhang, M. Spatio-temporal evolution and driving factors of eco-environmental quality based on RSEI in Chang-Zhu-Tan metropolitan circle, central China. Ecol. Indic. 2022, 144, 109436. [Google Scholar] [CrossRef]
  21. Gou, R.; Zhao, J. Eco-environmental quality monitoring in Beijing, China, using an RSEI-based approach combined with random forest algorithms. IEEE Access 2020, 8, 196657–196666. [Google Scholar] [CrossRef]
  22. Yue, H.; Liu, Y.; Li, Y.; Lu, Y. Eco-environmental quality assessment in China’s 35 major cities based on remote sensing ecological index. IEEE Access 2019, 7, 51295–51311. [Google Scholar] [CrossRef]
  23. An, M.; Xie, P.; He, W.; Wang, B.; Huang, J.; Khanal, R. Spatiotemporal change of ecologic environment quality and human interaction factors in three gorges ecologic economic corridor, based on RSEI. Ecol. Indic. 2022, 141, 109090. [Google Scholar] [CrossRef]
  24. Luo, R.; Wang, H.; Wang, C. Ecological quality evaluation of Gulang County in Gansu Province based on improved remote sensing ecological index. Arid. Land Geogr. 2023, 46, 539–549. [Google Scholar]
  25. Kalyan, S.; Sharma, D.; Sharma, A. Spatio-temporal variation in desert vulnerability using desertification index over the Banas River Basin in Rajasthan, India. Arab. J. Geosci. 2021, 14, 54. [Google Scholar] [CrossRef]
  26. Zeng, Y.; Xiang, N.; Feng, Z.; Xu, H. Albedo-NDVI Space and Remote Sensing Synthesis Index Models for Desertification Monitoring. Sci. Geogr. Sin. 2006, 26, 75–81. [Google Scholar]
  27. Zou, M.; Han, Y.; Zeng, J.; Yang, C.; Guo, J.; Yue, D. Temporal and spatial dynamic mornitoring of desertification in Maqu County based on Albedo-NDVI features space. J. Glaciol. Geocryol. 2019, 41, 45–53. [Google Scholar]
  28. Ren, Y.; Liu, H.; Tang, L.; Jiang, L.; An, X. A Study on Dynamic Changes of Desertification in South Edge of Junggar Basin Based on NDVI-Albedo Features. Bull. Soil Water Conserv. 2014, 34, 267–271+325. [Google Scholar]
  29. Xu, H.; Li, C.; Lin, M. Should RSEI use principal component analysis or kernel principal component analysis? J. Wuhan Univ. 2023, 48, 506–513. [Google Scholar]
  30. Zhou, T.; Chen, W.; Li, J.; Liang, J. Spatial relationship between human activities and habitat quality in Shennongjia Forest Area. J. Ecol. 2021, 41, 6134–6145. [Google Scholar]
  31. Shi, Z.; Cheng, Q.; Xu, D. Spatial econometric analysis of cultural tourism development quality in the Yangtze River Delta. Asia Pac. J. Tour. Res. 2021, 26, 597–613. [Google Scholar] [CrossRef]
  32. Li, L.; Zhu, L.; Zhu, W.; Xu, S.; Li, Y.; Ma, H. Correlation analysis and trade-offs between ecosystem service value and human activity intensity: The case of Qi River Basin. China Environ. Sci. 2020, 40, 365–374. [Google Scholar]
  33. Wang, F.; Li, W.; Lin, Y.; Nan, X.; Hu, Z. Spatiotemporal Pattern and Driving Force Analysis of Ecological Environmental Quality in Typical Ecological Areas of the Yellow River Basin from 1990 to 2020. Environ. Sci. 2023, 44, 2518–2527. [Google Scholar]
  34. Shi, Z.; Hu, X.; Xie, H.; Liu, X. Eco-environmental quality assessment and driving force analysis based on RSEI: A case study of the Minjiang River basin (Fuzhou section). Bull. Surv. Mapp. 2023, 2, 28–33. [Google Scholar]
  35. Wang, J.; Xu, C. Geodetector: Principle and prospective. J. Geogr. 2017, 72, 116–134. [Google Scholar]
  36. Xu, H.; Deng, W. Rationality Analysis of MRSEI and Its Difference with RSEI. Remote Sens. Technol. Appl. 2022, 37, 1–7. [Google Scholar]
  37. Bai, Z.; Han, L.; Liu, H.; Jiang, X.; Li, L. Spatiotemporal change and driving factors of ecological status in Inner Mongolia based on the modified remote sensing ecological index. Environ. Sci. Pollut. Res. 2023, 30, 52593–52608. [Google Scholar]
  38. Zhao, J.; Li, X.; Sun, B. Spatial-temporal Evolution and Driving Factors Analysis of Ecological Environment Quality in Daihai Basin based on AWRSEI. Environ. Sci. 2023, 09, 1–24. [Google Scholar]
  39. Yang, X.; Meng, F.; Fu, P.; Zhang, Y.; Liu, Y. Spatiotemporal change and driving factors of the Eco-Environment quality in the Yangtze River Basin from 2001 to 2019. Ecol. Indic. 2021, 131, 108214. [Google Scholar] [CrossRef]
  40. Hang, X.; Luo, X.; Cao, Y.; Li, Y. Ecological quality assessment and the impact of urbanization based on RSEI model for Nanjing, Jiangsu Province, China. J. Appl. Ecol. 2020, 31, 219–229. [Google Scholar]
  41. Shi, Z.; Wang, Y.; Zhao, Q.; Zhu, C. Assessment of Spatiotemporal changes of ecological environment quality of the Yangtze River Delta Urban Agglomeration in China Based on MRSEI. Front. Ecol. Evol. 2022, 10, 1013859. [Google Scholar] [CrossRef]
  42. Ye, X.; Kuang, H. Evaluation of ecological quality in southeast Chongqing based on modified remote sensing ecological index. Sci. Rep. 2022, 12, 15694. [Google Scholar] [CrossRef] [PubMed]
  43. Wang, T. Study on Sandy Desertification in China—3. Key Regions for Studying and Combating Sandy Desertification. J. Desert Res. 2004, 24, 3–11. [Google Scholar]
  44. Cheng, J.; Wang, P.; Chen, H.; Han, Y. Geographical exploration of the spatial and temporal evolution of ecological risk and its influencing factors in semi-arid regions. Arid. Land Geogr. 2022, 45, 1637–1648. [Google Scholar]
  45. Wang, X.; Zhou, L.; Tang, X.; Chen, Z.; Sun, D. Spatial-temporal evolution characteristics of urban green space in typical mountainous cities of Northwest China: A case study in Lanzhou. J. Arid. Land Resour. Environ. 2023, 37, 106–112. [Google Scholar]
  46. Bai, T.; Cheng, J.; Zheng, Z.; Zhang, Q.; Li, Z.; Xu, D. Drivers of eco-environmental quality in China from 2000 to 2017. J. Clean. Prod. 2023, 396, 136408. [Google Scholar] [CrossRef]
  47. Wang, Z.; Bai, T.; Xu, D.; Kang, J.; Shi, J.; Fang, H.; Nie, C.; Zhang, Z.; Yan, P.; Wang, D. Temporal and Spatial Changes in Vegetation Ecological Quality and Driving Mechanism in Kökyar Project Area from 2000 to 2021. Sustainability 2022, 14, 7668. [Google Scholar] [CrossRef]
  48. Zandalinas, S.I.; Fritschi, F.B.; Mittler, R. Global warming, climate change, and environmental pollution: Recipe for a multifactorial stress combination disaster. Trends Plant Sci. 2021, 26, 588–599. [Google Scholar] [CrossRef]
  49. Servino, R.N.; de Oliveira Gomes, L.E.; Bernardino, A.F. Extreme weather impacts on tropical mangrove forests in the Eastern Brazil Marine Ecoregion. Sci. Total Environ. 2018, 628, 233–240. [Google Scholar] [CrossRef]
  50. Liu, Z.; Wei, H.; Zhang, J.; Saleem, M.; He, Y.; Zhong, J.; Ma, R. Seasonality regulates the effects of acid rain on microbial community in a subtropical agricultural soil of Southern China. Ecotoxicol. Environ. Saf. 2021, 224, 112681. [Google Scholar] [CrossRef]
  51. Wang, X.; Hou, X. Variation of Normalized Difference Vegetation Index and its response to extreme climate in coastal China during 1982–2014. Geogr. Res. 2019, 38, 69–83. [Google Scholar]
  52. Milich, L.; Weiss, E. GAC NDVI images: Relationship to rainfall and potential evaporation in the grazing lands of the Gourma (northern Sahel) and in the croplands of the Niger-Nigeria border (southern Sahel). Int. J. Remote Sens. 2000, 21, 261–280. [Google Scholar] [CrossRef]
  53. Lamchin, M.; Lee, W.K.; Jeon, S.W.; Wang, S.W.; Lim, C.H.; Song, C.; Sung, M. Long-term trend and correlation between vegetation greenness and climate variables in Asia based on satellite data. Sci. Total Environ. 2018, 618, 1089–1095. [Google Scholar] [CrossRef] [PubMed]
  54. Li, M.; Dong, Z.; Zhang, J. Urban Spatial Development Logic and Planning Response of Lanzhou under Complex Geoqraphical Conditions. Planners 2021, 37, 61–67. [Google Scholar]
  55. Wei, W.; Guo, Z.; Xie, B.; Zhou, J.; Li, C. Spatiotemporal evolution of environment based on integrated remote sensing indexes in arid inland river basin in Northwest China. Environ. Sci. Pollut. Res. 2019, 26, 13062–13084. [Google Scholar] [CrossRef] [PubMed]
  56. Zhang, R.; Liu, X.; Xu, D.; Li, Q.; Sui, B.; Chen, L. Temporal and spatial changes of eco-environmental quality and its influencing factors in the Dongting Lake basin from 2001 to 2019. Bull. Surv. Mappin 2023, 2, 1. [Google Scholar]
  57. Zhang, R.; Shi, W.; Zhou, J.; Fang, H.; Wang, Y.; Xu, S.; Kang, J.; Xu, D. Temporal and spatial variation characteristics and driving forces of eco-environmental quality in China’s nature reserves from 2001 to 2019. Acta Ecol. Sin. 2023, 43, 2101–2113. [Google Scholar]
Figure 1. Study area.
Remotesensing 15 04704 g001
Figure 2. Flow chart of assessing the spatiotemporal evolution and drivers of the ecological environment quality using MRSEI.
Remotesensing 15 04704 g002
Figure 3. Comparation between the RSEI and MRSEI.
Remotesensing 15 04704 g003
Figure 4. Comparison of local details between the RSEI and MRSEI.
Remotesensing 15 04704 g004
Figure 5. Interannual change in the MRSEI in Lanzhou City from 2000 to 2020.
Remotesensing 15 04704 g005
Figure 6. Spatial distribution of the MRSEI from 2000 to 2020.
Remotesensing 15 04704 g006
Figure 7. Spatial change trend of the MRSEI in Lanzhou City from 2000 to 2020.
Remotesensing 15 04704 g007
Figure 8. Spatial distribution of significant MRSEI values in Lanzhou City from 2000 to 2020.
Remotesensing 15 04704 g008
Figure 9. The 2000–2020 LISA agglomeration map in Lanzhou City. (a) Scatter chart of local moran’s I index, (b) LISA cluster diagram.
Remotesensing 15 04704 g009
Figure 10. Influencing factors in 2000 and 2020.
Remotesensing 15 04704 g010
Figure 11. Interactive probe results.
Remotesensing 15 04704 g011
Table 1. Detailed description of data.
Data TypeSpatial ResolutionTime ResolutionTime ResolutionSource
Vector map data1:1,000,0002020National Geographic Information Resource Catalog Service System (https://www.webmap.cn/ accessed on 2 May 2023)
Landsat 5/7/8 Image data30 m16 days2000–2020The GEE Platform (https://earthengine.google.com/ accessed on 2 May 2023)
MODIS1000 m8 days2000–2020The GEE Platform (https://earthengine.google.com/ accessed on 2 May 2023)
Temperature1000 mMonth2000–2020National Qinghai-Tibet Plateau Scientific Data Center (https://data.tpdc.ac.cn/ accessed on 2 May 2023)
Precipitation1000 mMonth2000–2020National Qinghai-Tibet Plateau Scientific Data Center (https://data.tpdc.ac.cn/ accessed on 2 May 2023)
Night Lights1000 mYear2000–2020National Qinghai-Tibet Plateau Scientific Data Center (https://data.tpdc.ac.cn/ accessed on 2 May 2023)
Population1000 mYear2000–2020WorldPop (https://hub.worldpop.org/ accessed on 2 May 2023)
GDP1000 mYear2000–2020Resource and Environmental Science and Data Center, Chinese Academy of Sciences (https://www.resdc.cn/ accessed on 2 May 2023)
Land use1000 mYear2000–2020Resource and Environmental Science and Data Center, Chinese Academy of Sciences (https://www.resdc.cn/ accessed on 2 May 2023)
Table 2. Types of interaction between two explanatory variables.
DescriptionInteraction
q X 1 X 2 < M i n q ( X 1 ) , q ( X 2 ) Weaken, nonlinear
M i n ( q ( X 1 ) , q ( X 2 ) ) < q ( X 1 X 2 ) < M a x q ( X 1 ) , q ( X 2 ) Weaken, single factor
nonlinear
q ( X 1 X 2 ) > M a x q ( X 1 ) , q ( X 2 ) Enhance, double factors
q X 1 X 2 = q X 1 + q ( X 2 ) Independent
q X 1 X 2 > q X 1 + q ( X 2 ) Enhance, nonlinear
Table 3. Contribution of each indicator in the first principal component.
YearThe First Principal Component (PC1)EigenvalueContribution %
NDVIWETDILSTNDBSI
20000.4690.372−0.471−0.449−0.4660.04980.68
20050.4730.395−0.480−0.450−0.4340.02987.13
20100.4680.385−0.484−0.441−0.4520.03285.09
20150.4670.388−0.468−0.445−0.4630.05782.17
20200.460.401−0.460−0.452−0.4610.04983.57
Table 4. Average values of the MRSEI and each indicator for 2000–2020.
YearNDVIWETDILSTNDBSI
20000.3800.3060.6370.6810.747
20050.5470.4090.4980.6620.234
20100.5310.4620.5650.6770.136
20150.4390.6750.5800.6430.645
20200.4320.5860.5940.6620.399
Table 5. Proportion of the MRSEI change trend in Lanzhou City.
Type of Change Trend   θ s l o p e and Significance pPercentage Area %
Highly significant degradation θ s l o p e < 0 , p < 0.01 1.259
Significant degradation θ s l o p e < 0 , 0.01 p < 0.05 0.682
Unchanged p 0.05 32.882
Significant improvement θ s l o p e > 0 , 0.01 p < 0.05 22.808
Highly significant improvement θ s l o p e > 0 , p < 0.01 42.369
Table 6. Moran’s I index of the ecological environment quality of Lanzhou City as a whole from 2000 to 2020.
YearMoran’s IZ-Valuep Value
20000.89565.0480.001
20050.92568.5210.001
20100.92168.4180.001
20150.89765.6510.001
20200.91566.6180.001
Table 7. Collinearity test.
VariableVIF1/VIF
Night lighting5.610.178
Population5.540.180
Land use1.040.963
Temperature1.010.986
Precipitation1.010.988
GDP1.010.990
Mean VIF2.54
Table 8. Single-factor detection results.
Detection FactorsQ-Value in 2000Q-Value in 2005Q-Value in 2010Q-Value in 2015Q-Value in 2020
GDP0.0490.0430.0750.0170.002
Land Use0.2810.2470.2530.2760.226
Temperature0.5370.5090.4670.5470.528
Precipitation0.4550.4660.4450.4740.500
Night Lighting0.0030.0010.0010.0020.014
Population0.0040.00040.0020.00070.0035
Disclaimer/Publisher’s Note: The statements, opinions and data contained in all publications are solely those of the individual author(s) and contributor(s) and not of MDPI and/or the editor(s). MDPI and/or the editor(s) disclaim responsibility for any injury to people or property resulting from any ideas, methods, instructions or products referred to in the content.

