Article

Driving Mechanisms of Spatiotemporal Heterogeneity of Land Use Conflicts and Simulation under Multiple Scenarios in Dongting Lake Area

1
Research Center of Forestry Remote Sensing and Information Engineering, Central South University of Forestry and Technology, Changsha 410004, China
2
Hunan Provincial Key Laboratory of Forestry Remote Sensing Based Big Data and Ecological Security, Changsha 410004, China
3
Key Laboratory of National Forestry and Grassland Administration on Forest Resources Management and Monitoring in Southern China, Changsha 410004, China
*
Author to whom correspondence should be addressed.
Remote Sens. 2023, 15(18), 4524; https://doi.org/10.3390/rs15184524
Submission received: 22 July 2023 / Revised: 7 September 2023 / Accepted: 8 September 2023 / Published: 14 September 2023

Abstract

:
As an important ecological hinterland in Hunan Province, the Dongting Lake area has an irreplaceable role in regional socioeconomic development. However, owing to rapid environmental changes and complex land use relationships, land use/land cover (LULC) changes are actively occurring in the region. Therefore, assessment of the current LULC status and the future development trend for sustainable economic development is of considerable importance. In this study, the driving mechanisms of spatiotemporal evolution for land use conflicts (LUCF) in Dongting Lake from 2000 to 2020 were analyzed by constructing a LUCF model. Additionally, a new model, EnKF-PLUS, which couples ensemble Kalman filtering (EnKF) with patch-generating land use simulation (PLUS), was developed to predict the LULC changes and LUCF in 2030 under different scenarios. The results provide three insights. First, during the period of 2000–2020, high LUCF values were concentrated in highly urbanized and densely populated areas, whereas low LUCF values were centered in hilly regions. Secondly, the impacts of static factors (topographical factors) and dynamic factors (population, GDP, and climate factors) on changes in LUCF were regionally differentiated. Thirdly, our results indicate that the implementation of land use strategies of cropland conservation and ecological conservation can effectively mitigate the degree of LUCF changes in the region and contribute to the promotion of the rational allocation of land resources.

1. Introduction

The Dongting Lake area is a significant development region at the national level, playing an irreplaceable role in safeguarding national food security, flood security, ecological security, and many other aspects [1,2]. The Dongting Lake area is the most significant water catchment and flood storage lake basin of the Yangtze River and an important guarantee of ecological security and food security in the middle and lower reaches of the Yangtze River [3,4,5]. For the past several years, land use at the regional and global scales has undergone profound changes as a result of sustained development, the continuous expansion of built-up areas, and the successive emergence of ecological problems such as the occupation of wetland resources [6,7]. With the implementation of ecological protection, wetland ecological restoration, and other management methods, the regional LULC has shifted to a favorable situation [8,9]. However, problems such as land encroachment persist, which makes the contradiction between socioeconomic development and the ecological environment prominent. Therefore, in-depth analysis of the trend of LULC changes in the Dongting Lake area and quantitative assessment of future LULC transformation can help to facilitate the rational choice of regional land resources, providing a new opportunity for the ecological environmental safeguarding and socioeconomic development of the Dongting Lake area.
Land use conflict (LUCF) refers to the phenomenon of spatial competition and conflicts of interest between people and land arising among stakeholders with respect to land use patterns and structures in the process of land resource utilization [10]. The occupation of cropland by building and urban expansion and the destruction of forest and grassland as a result of marginal land cultivation are concrete manifestations of various contradictions or conflicts in land use [11,12]. Owing to the considerable differences in land resources and the level of socioeconomic development among regions, LUCFs manifest themselves differently in different regions and at different times [13]. Rapid changes in LULC, especially in developing countries, inevitably lead to a reduction in natural resources, including water and vegetation [14]. Currently, research on LUCFs in China concentrates on the causes, identification, and management strategies associated with LUCF and mainly occurs in agricultural and pastoral zones, urban fringe areas, and land and water transition zones; furthermore, existing research involving the analysis of LUCF from the perspective of watersheds is relatively homogeneous [15,16]. Accompanied by the continuous deepening of applied research, LUCF research has gradually expanded to geography and related fields. The most widely applied methods of LUCF analysis include qualitative analysis methods (game theory and logical framework method) [17] and quantitative analysis of the intensity of LUCF through the pressure–state response (PSR) model and the conflict composite index method of complexity–vulnerability–stability of land use systems [18,19]. Following the advancement of remote sensing technology, methods based on landscape patterns and public participation geographic information systems (PPGIS) have been increasingly applied to the analysis of spatiotemporal changes in LUCF [20,21]. In previous studies, a single rationale or methodology has been employed to weigh conflicting interests, whereas fewer studies have coupled the advantages of various approaches. Therefore, in this research, we applied the LUCF index and introduced spatial analysis, using maps or grids as evaluation units to obtain the value of the LUCF index of each evaluation unit. Indices were constructed to characterize the appropriate direction and strength of land use in each evaluation unit, classify the type of conflict, and diagnose the intensity of conflict by constructing a discriminant matrix and arranging combinations.
In view of the LULC status quo, predicting LULC changes and their transfer trends under different scenarios in the future can help to comprehensively analyze the problem of LUCF in the Dongting Lake area and identify potential development regions. In recent years, several models have been proposed for LULC simulation, such as multicriteria criteria (MCE)-CA [22], artificial neural network (ANN)-CA [23], the CLUE-S model [24], the future land use simulation (FLUS) model [25], and the PLUS model [26]. However, the majority of these models assume that land expansion patterns remain constant over time and into the future, using static model variables in their simulations and ignoring model uncertainty and error transmission. The improvement of LULC simulation models using data assimilation methods provides a more accurate simulation of future land development and enhances land use simulation accuracy [27]. Data assimilation is a method to automatically adjust and optimize model states and parameters using observational data that is capable of merging direct or indirect observational data from different sources and with different accuracies and automatically adjusting the model simulation trajectory to improve model accuracy [28,29]. The ensemble Kalman filter algorithm can solve the problem of difficulty in estimating and forecasting the background error covariance matrix and has become a mainstream prediction method for data assimilation [30]. However, research on land use simulation models based on improved data assimilation as a means of estimating the impact of future LULC evolution on regional socioeconomic development is lacking.
Therefore, the aim of this study is to use remote sensing data to obtain LULC information in the Dongting Lake area and construct an LUCF assessment model to analyze its evolutionary characteristics and driving mechanisms. The future LUCF situation in the Dongting Lake area under different scenarios is also explored. Our aim was for the results reported in this paper to provide a reference for the promotion of the optimal regulation of land resources in Dongting Lake, contributing to sustainable socioeconomic development in the region.

2. Study Area and Data
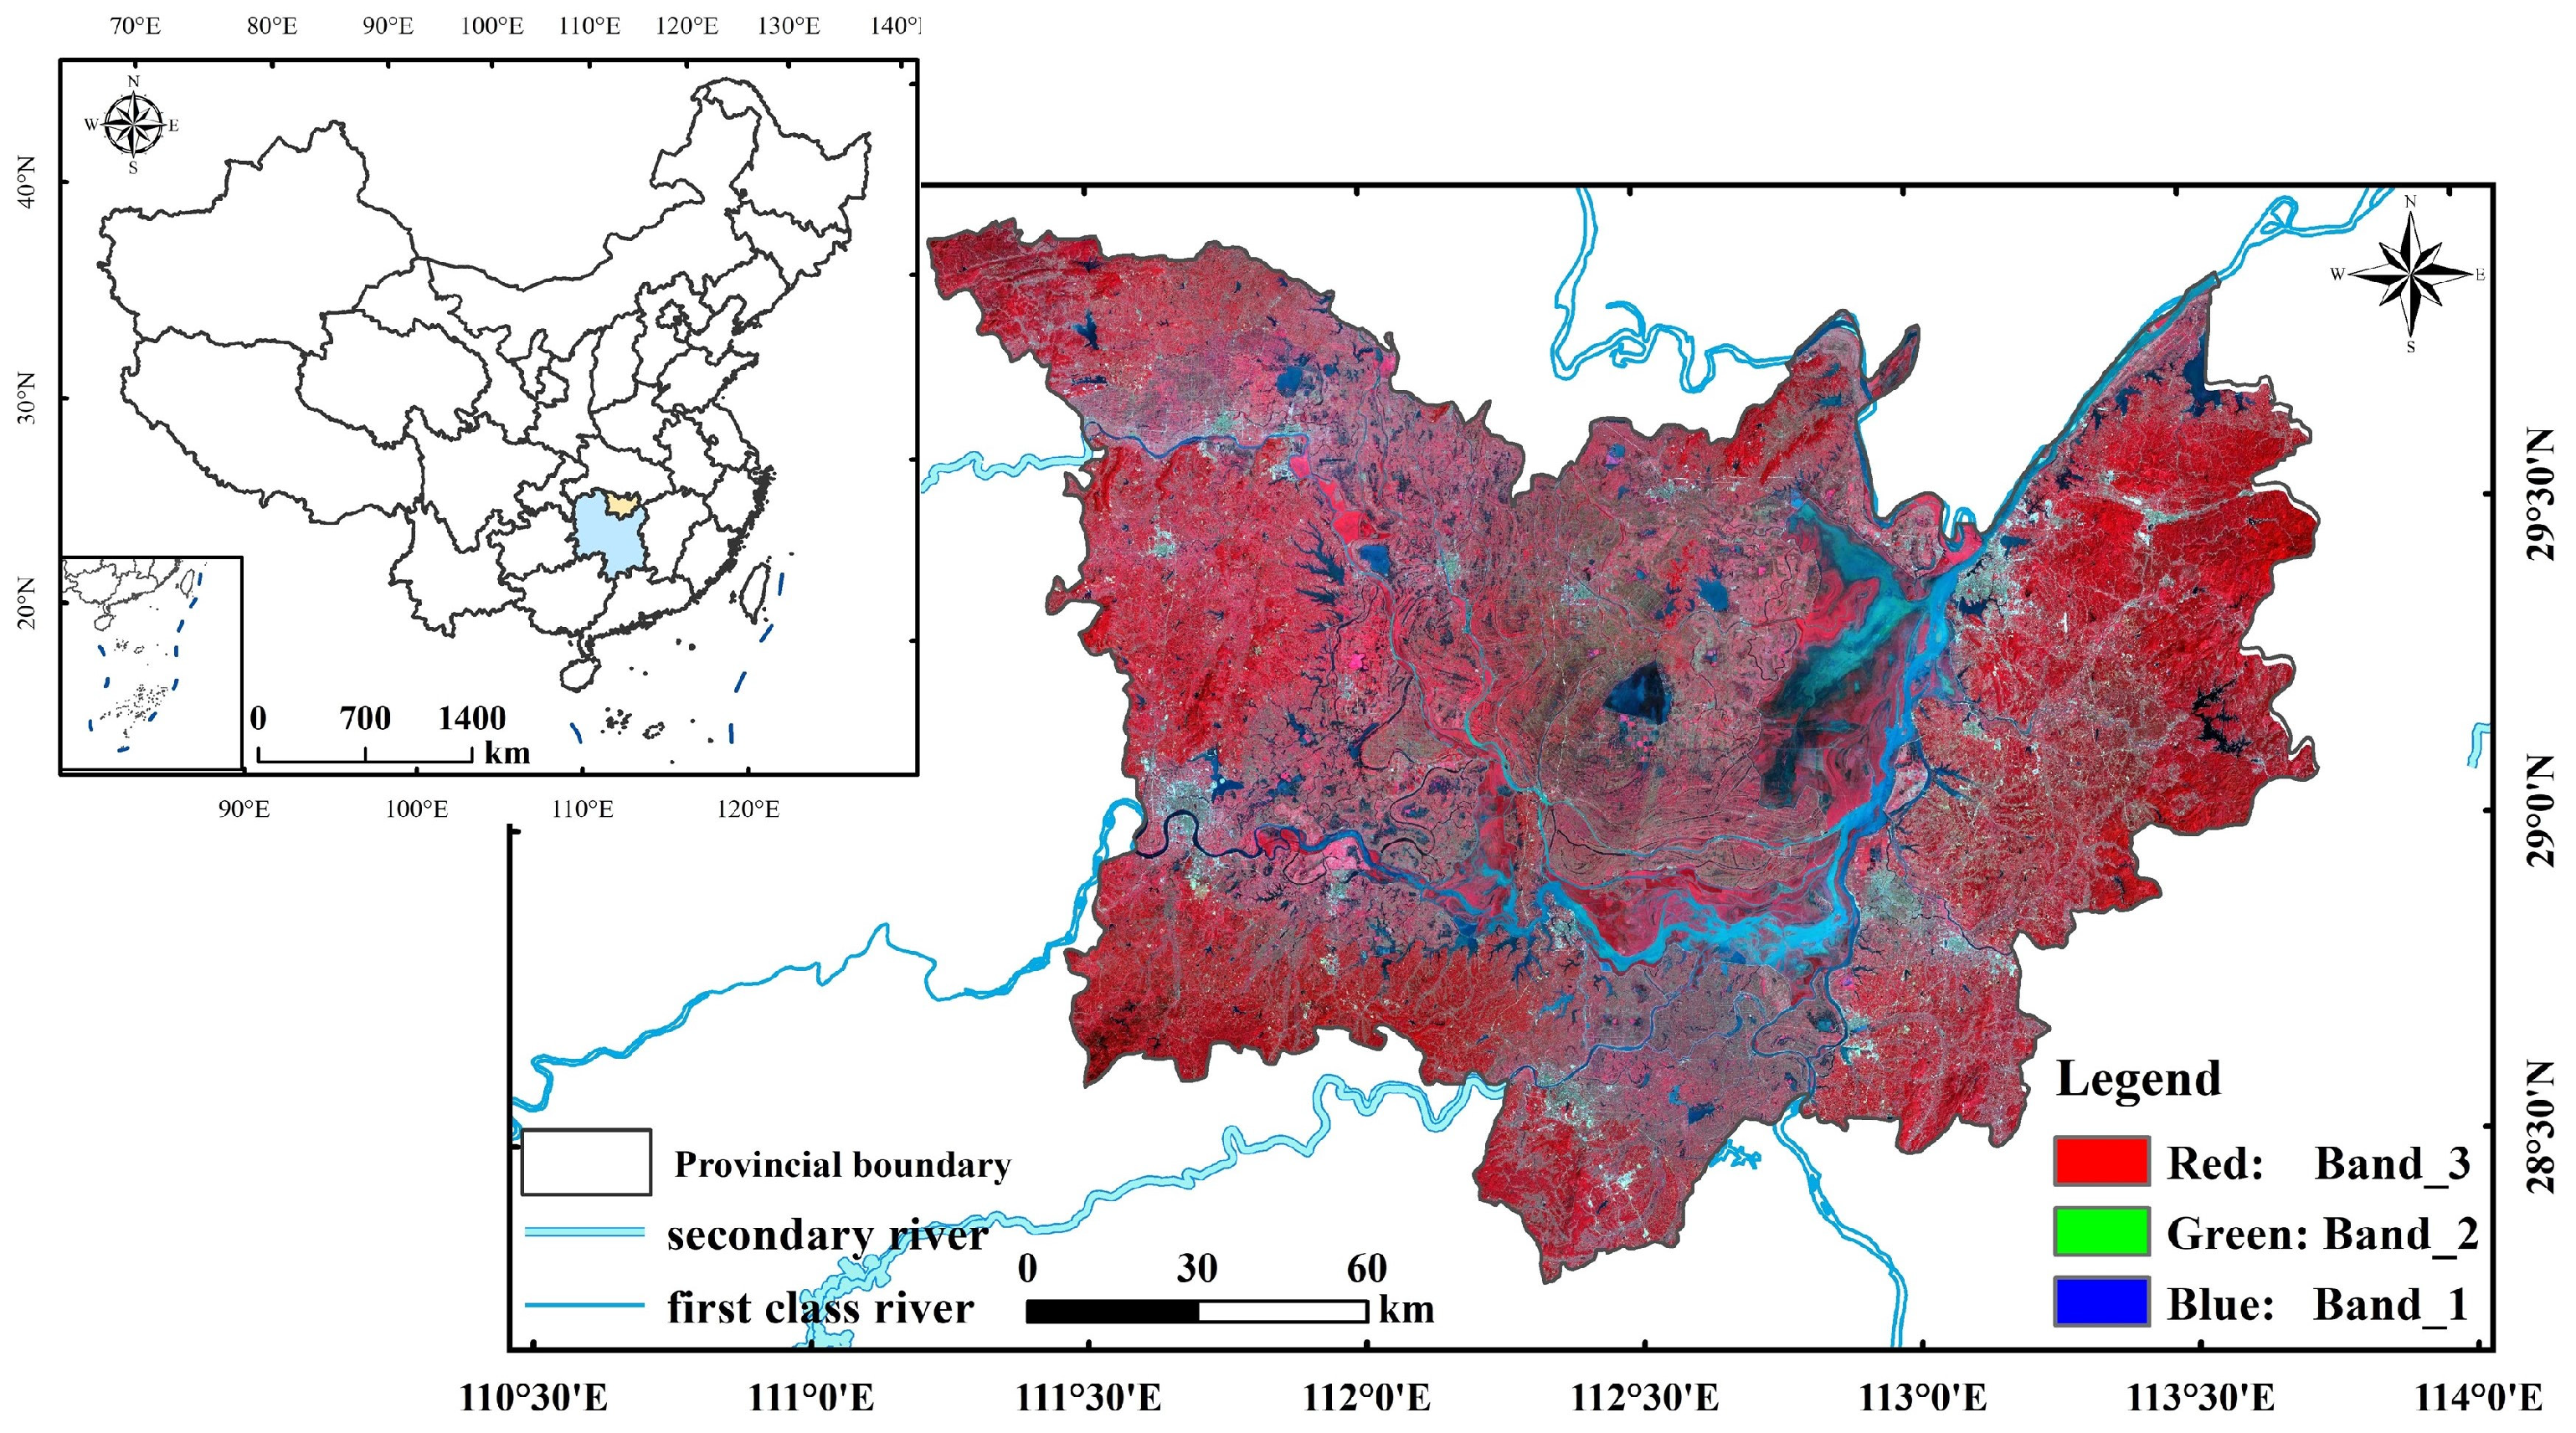
2.1. Study Area

The Dongting Lake area covers three municipal districts, namely Yueyang, Changde, and Yiyang, and lies between latitudes of 28.25° and 29.95°N and longitudes of 110.20° and 113.75°E (Figure 1). The Dongting Lake area has a typical subtropical monsoon climate, which is temperate, with an average annual temperature of about 16.5–17.0 °C and an average annual precipitation of about 1200–1450 mm. The terrain of the region is high in all directions and low in the middle, with favorable natural conditions and high levels of vegetation cover. Dongting Lake is also the most important commercial grain and oil base and fishery and aquaculture base in Hunan Province and even in the nation.

2.2. Data Sources and Processing

2.2.1. Remote Sensing Data

The remote sensing data considered in this study include Landsat5 TM (2000, 2005 and 2010) and Landsat8 OLI (2015 and 2020) images at a 30-m resolution, which were mainly used to obtain LULC data (30 m) and for the calculation of landscape indices in Dongting Lake area. Image data were acquired from the United States Geological Survey (USGS) (https://www.usgs.gov, accessed on 15 October 2022). The image preprocessing steps were based on the Google Earth Engine (GEE) cloud platform and included the use of the QA_PIXEL band and update mask function to remove clouds, selecting different combinations of bands for visual interpretation of the image by adjustment and utilizing the median function for median processing of regions of the image with large clouds.

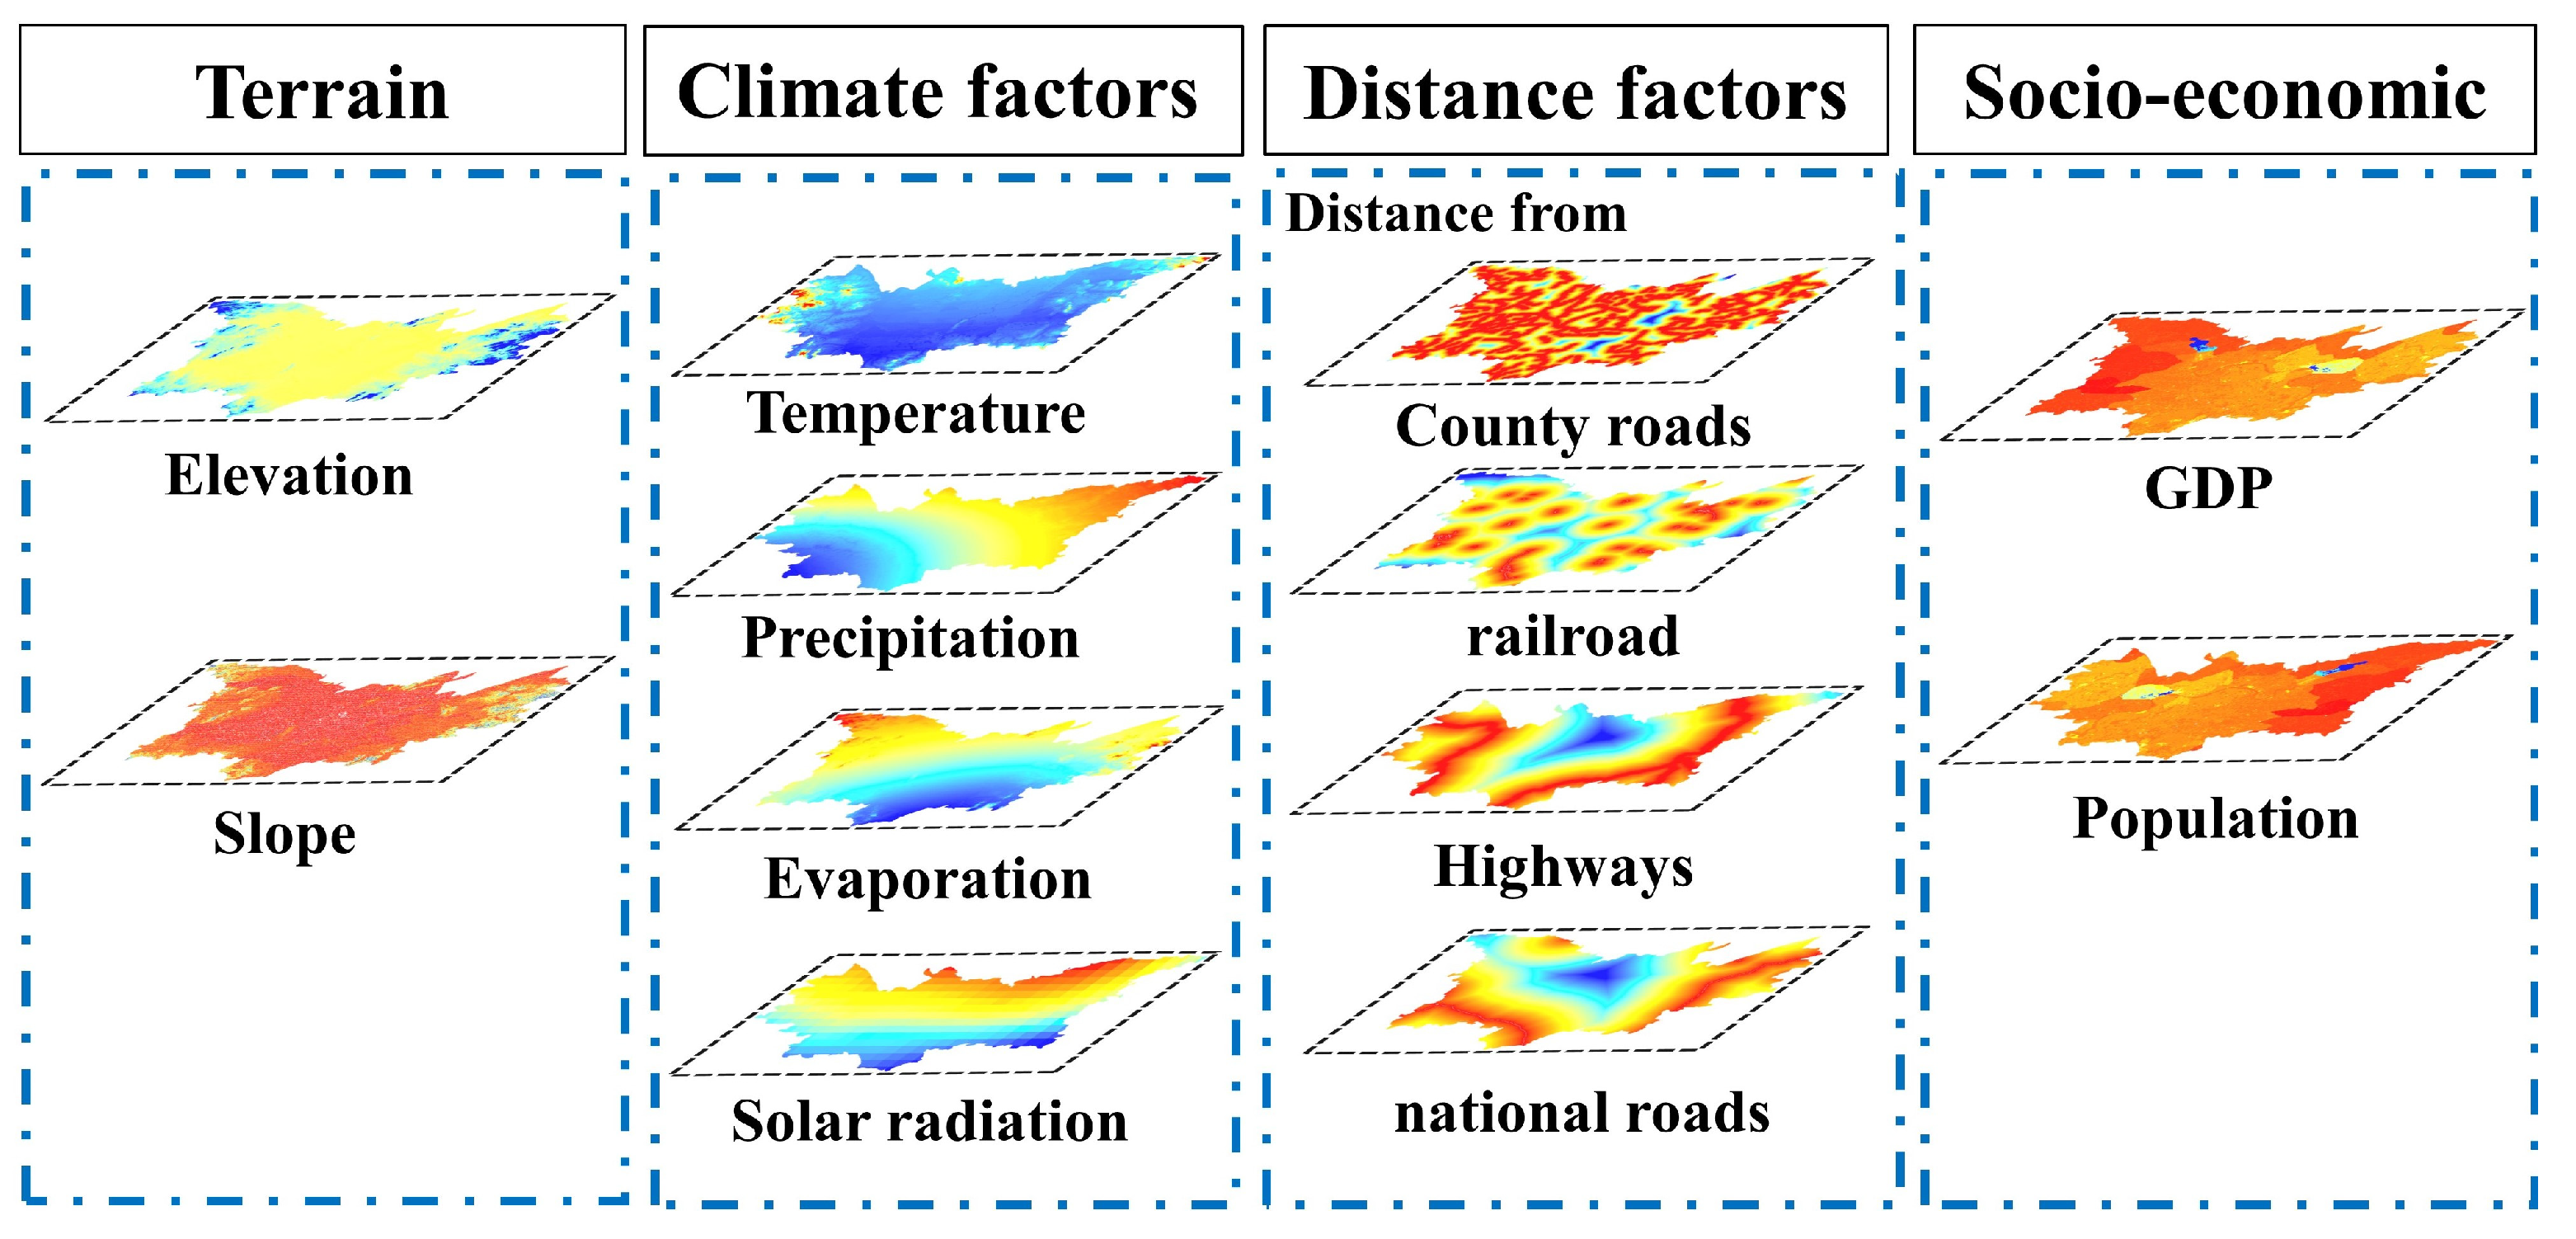
2.2.2. Model-Driven Data

Driving factor data were principally used in models of driving mechanisms for the changes in the LUCF (2000–2020) and LULC simulation models. According to the accessibility, consistency, and spatial variability of the data, the driving factors were selected based on the three dimensions of natural (precipitation, average annual temperature, evaporation, solar radiation, elevation, and slope), socioeconomic (GDP and population), and distance factors (distance from national and county roads, as well as the distance from highways and railroads) (Figure 2). Data pertaining to these factors were obtained from the Center for Resource and Environmental Sciences and Data of the Chinese Academy of Sciences (https://www.resdc.cn, accessed on 3 March 2023) and China’s Hunan Province Statistical Yearbook of Districts and Counties (http://www.hunan.gov.cn/zfsj/tjnj, accessed on 4 March 2023). To achieve data consistency, all 1 km driving factors were resampled to a spatial resolution of 30 m, consistent with the LULC data.

2.2.3. Other Auxiliary Data
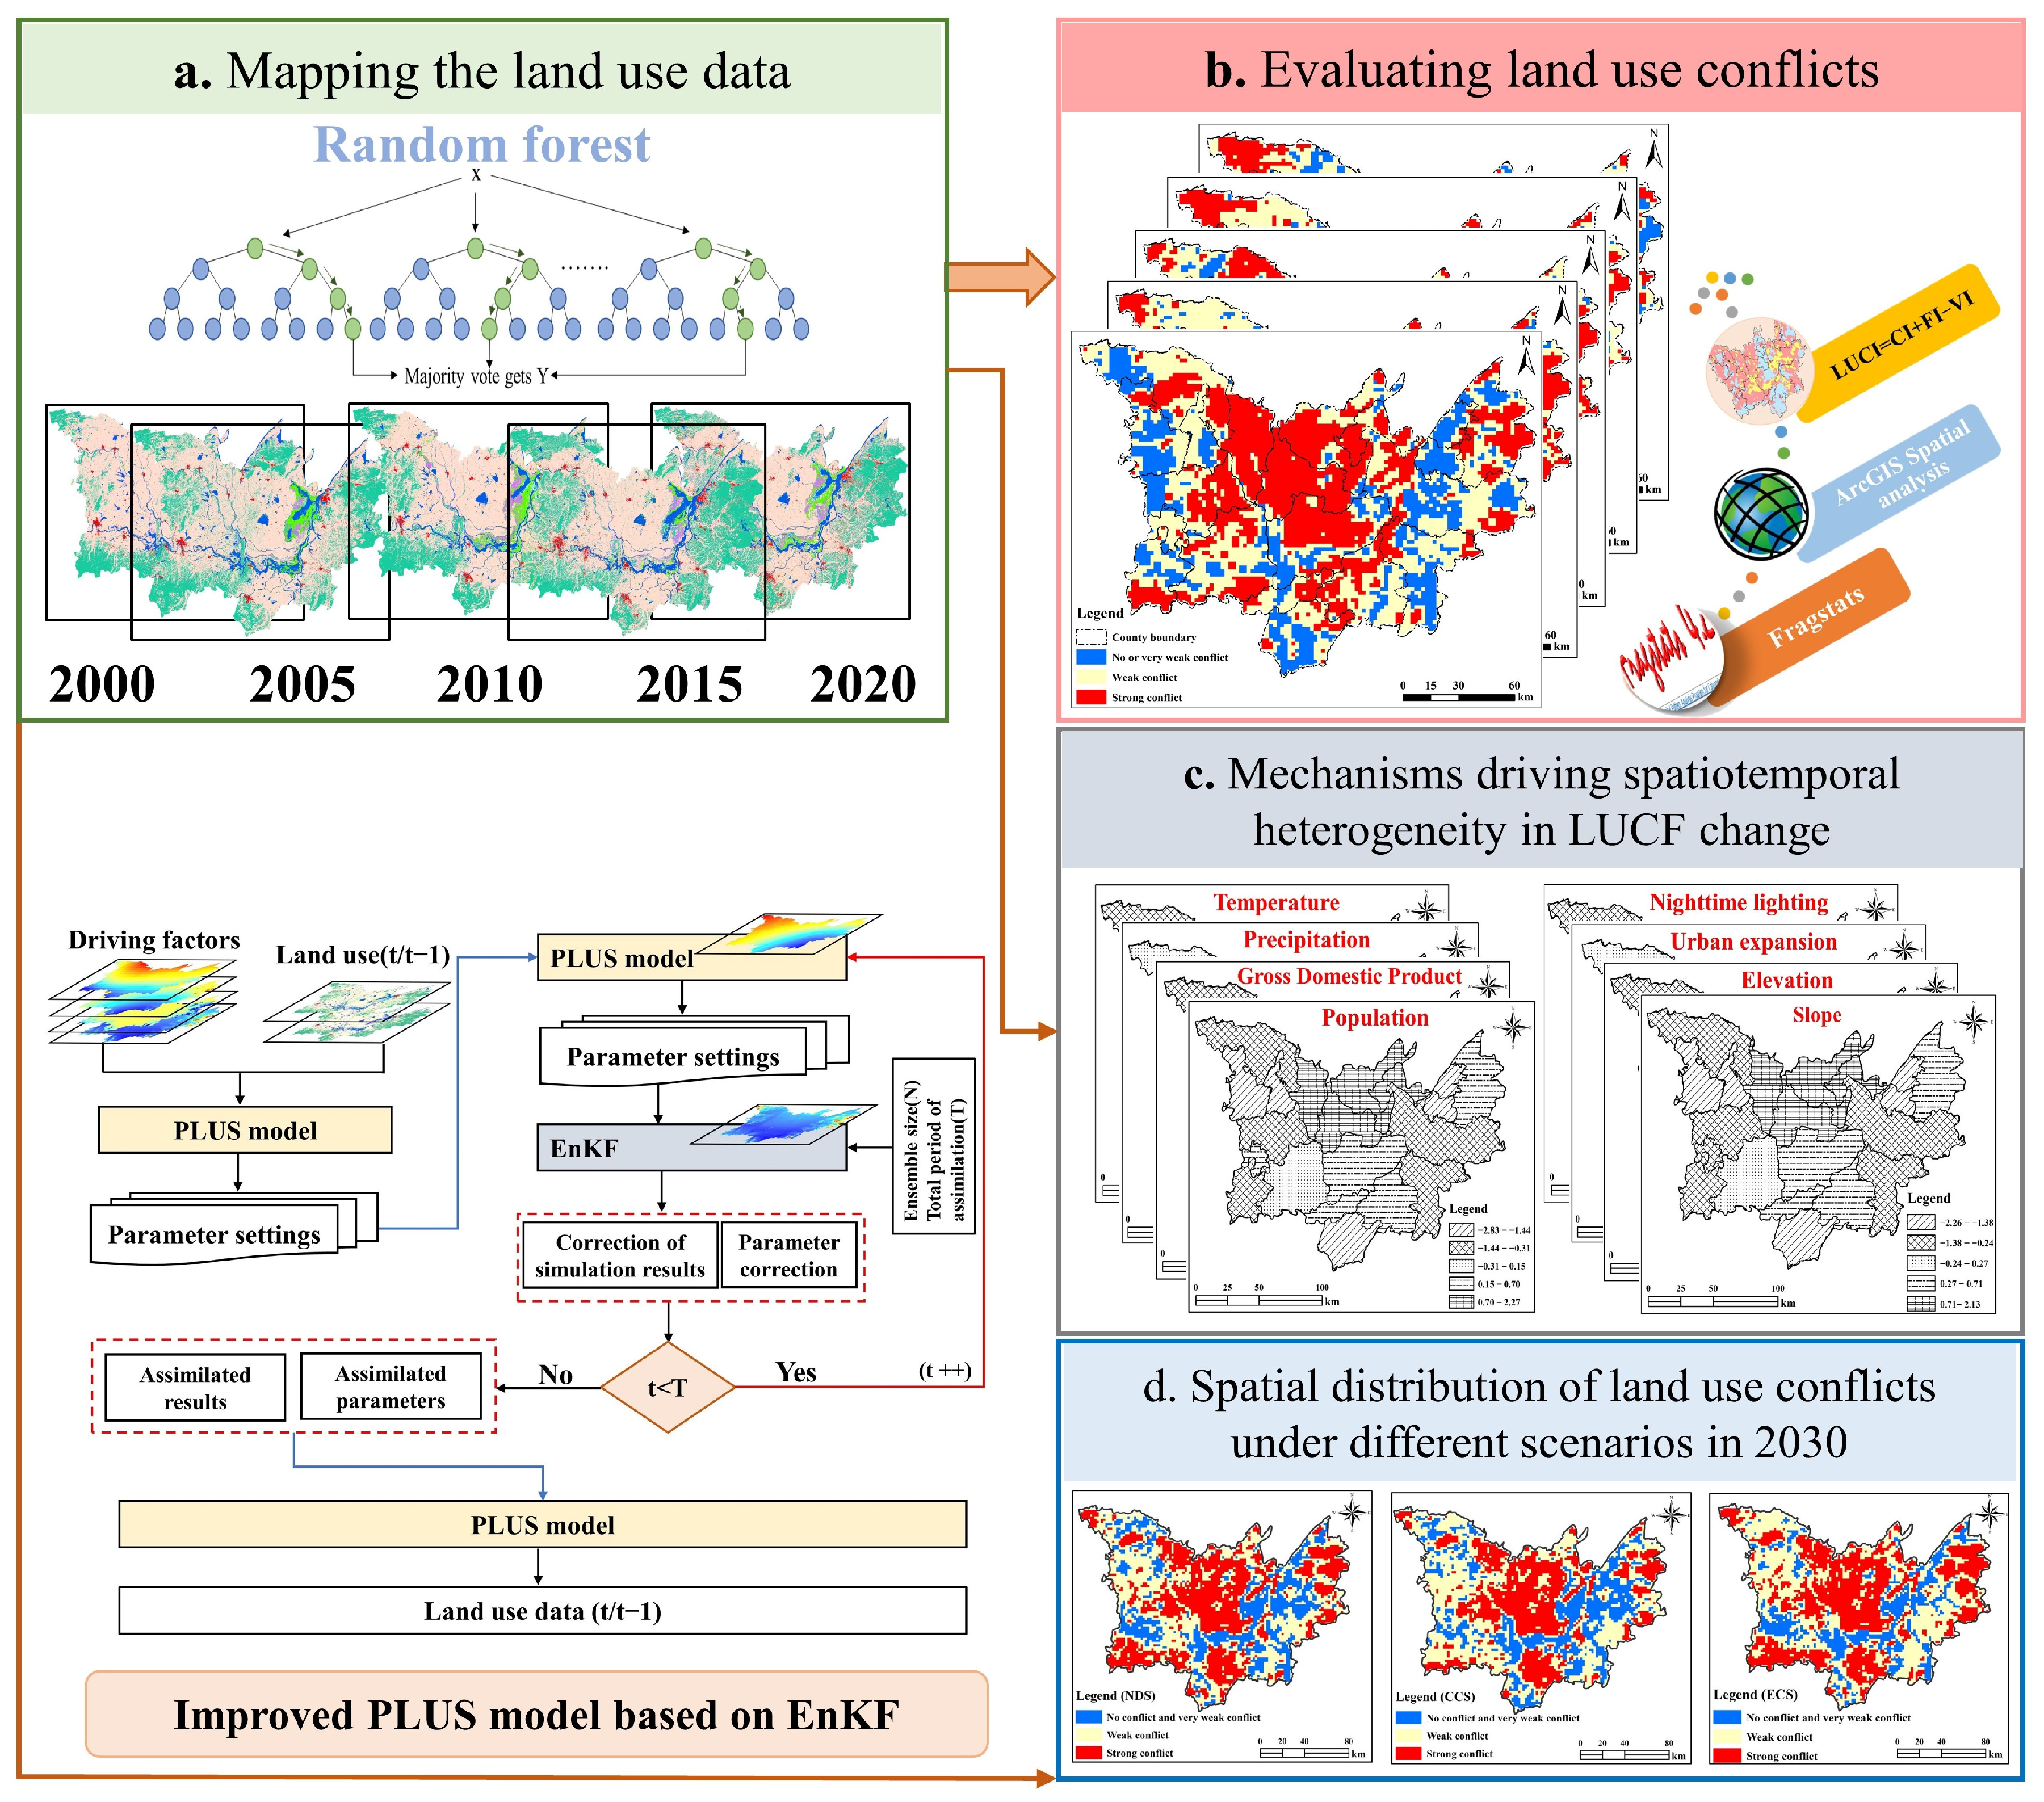
Other auxiliary data included Chinese administrative division data and LULC product data at a 30 m resolution, which were used for mapping and to assist in validating the LULC classification results reported in this paper, respectively. The administrative division data and LULC product were obtained from the National Center for Basic Geographic Information (http://ngcc.sbsm.gov.cn, accessed on 8 March 2023) and Zenodo users (https://zenodo.org/record/5816591, accessed on 10 November 2022), respectively.

3. Methods

The overall framework proposed in this paper consists of four major steps, as shown in Figure 3: (1) using the random forest (RF) model combined with the GEE cloud platform to obtain LULC data for the Dongting Lake area between 2000 and 2020, (2) constructing an LUCF model and combining spatial analysis methods to calculate the LUCF index, (3) investigating the driving mechanism of LUCF change by combining static and dynamic factors through using a spatiotemporal geographically weighted regression model, and (4) developing an EnKF-PLUS model to simulate LULC under three scenarios in the Dongting Lake area in 2030 and estimating its future LUCF trend.

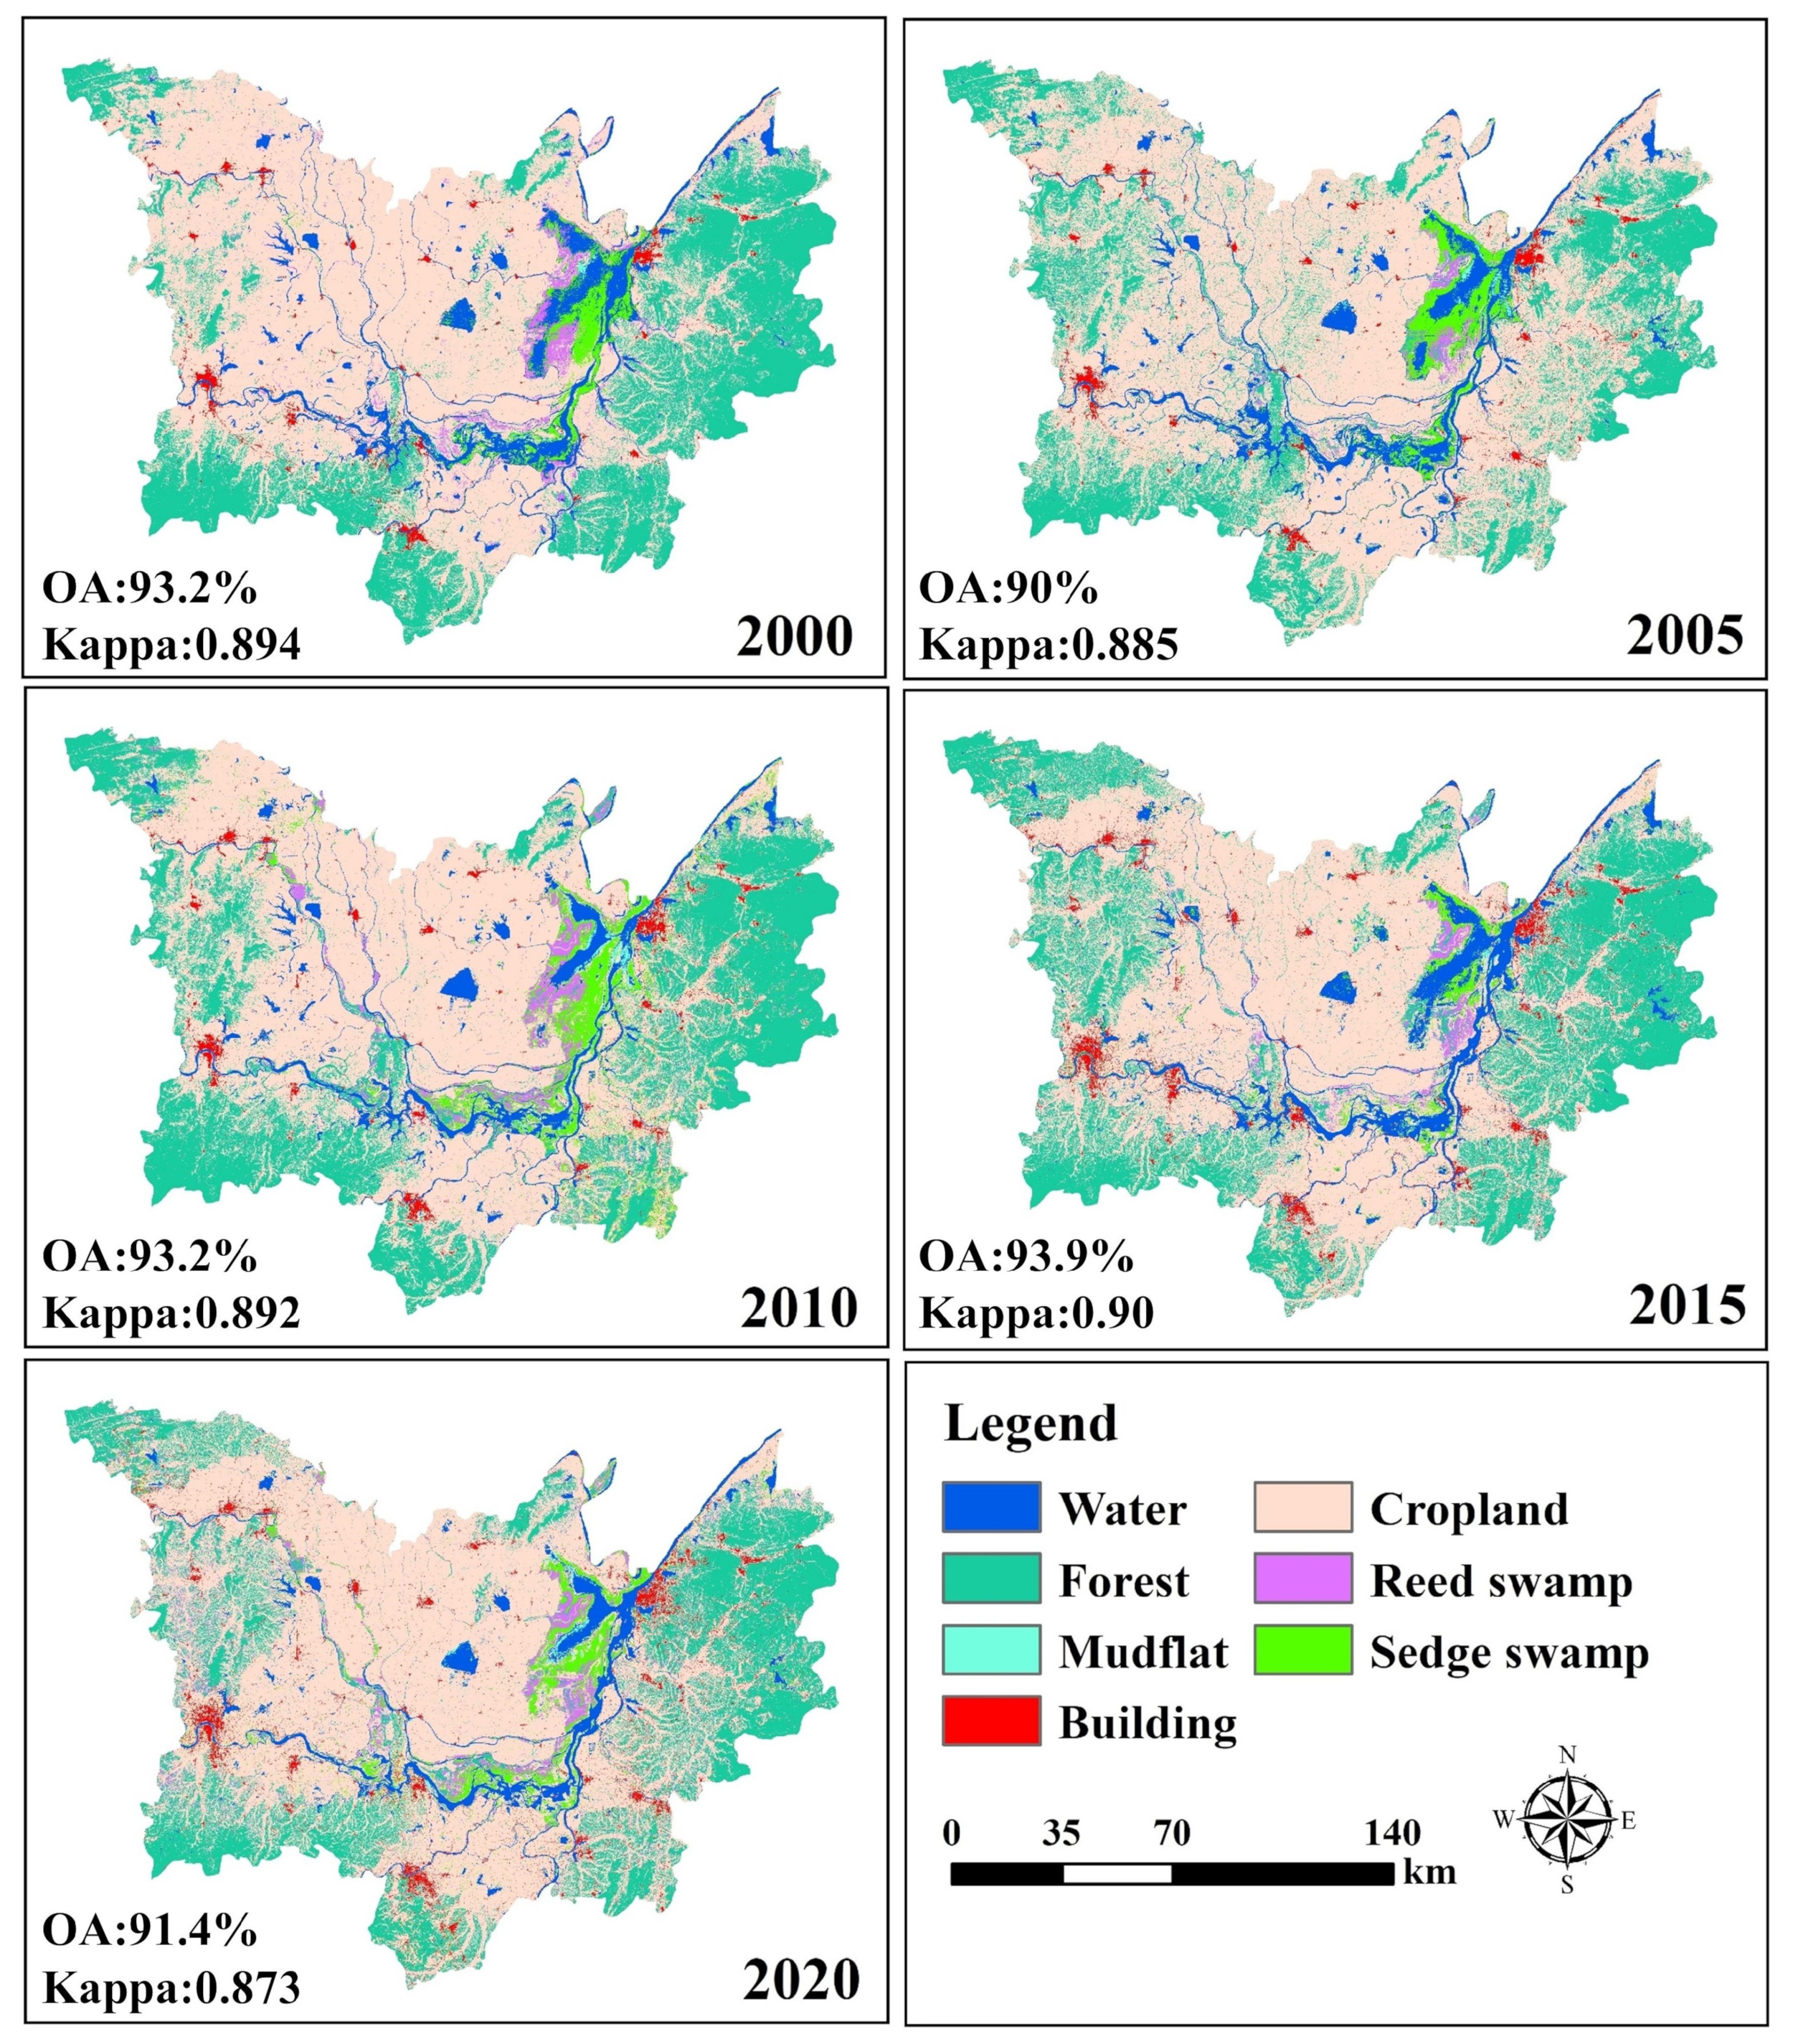
3.1. LULC Data Derived from Landsat Images and the RF Algorithm

In this study, the LULC data for the Dongting Lake area from 2000 to 2020 were generated by the RF algorithm in the GEE cloud platform based on Landsat remote sensing images. According to the national LULC classification system standards and the current situation with respect to LULC types in the study area, the LULC types were identified as water, forest, mudflat, building, cropland, reed swamp, and sedge swamp. The specific steps of land use classification are outlined as follows:
(1) Constructing the initial dataset: Landsat5/8 images were loaded. The image preprocessing process included de-clouded, band combination, and median synthesis. In order to take advantage of the band information of remote sensing images to increase the accuracy of vegetation, water body, and building classification, we incorporated the normalized difference vegetation index (NDVI), normalized difference water index (NDWI), and normalized difference built-up index (NDBI) on the basis of spectral bands.
(2) Determining sample data: Samples are the basis for supervised classification of remote sensing images, and high-quality sample data significantly improve classification accuracy. Data sampling was performed using visual interpretation combined with field survey data; a total of 1800 samples (35,000 pixels) were uniformly selected to ensure that the training and validation samples were evenly distributed across the study area. Then, 70% of the sample was randomly selected for training, with the other 30% allocated for validation.
(3) Selecting optimal features: The optimal classification features were filtered by a random forest classifier.
(4) Accuracy evaluation: We utilized the field survey data to evaluate the LULC classification data, whereas the overall accuracy, Kappa coefficient, and producer accuracy were used as evaluation metrics. The classification results indicate that the overall accuracy of the LULC classification data exceeded 90%, and the Kappa coefficients were all above 88% in the Dongting Lake area between 2000 and 2020 (Figure 4).

3.2. LUCF Modeling

We constructed a LUCF model to measure the LUCF index by drawing on the ecological risk assessment model and relevant theories of ecology. Based on a combination of landscape ecological risk evaluation methods reported in previous studies, the formula for measuring LUCF can be represented as follows:
LUCI = CI + VI − SI
where LUCI is the degree of regional landscape risk and the comprehensive index of LUCF, and CI, FI, and SI represent the ecological risk source, risk receptor, and risk effect corresponding to the complexity index (CI), vulnerability index (VI), and stability index (SI), respectively (Table 1). Complexity is an effective indicator for risk sources, and the area weighted mean patch fractal dimension (AWMPFD) index is usually used to express the complexity of spatial units. The larger the value, the more complex the landscape pattern is, indicating a strong land use conflict associated with anthropogenic disturbance. Vulnerability is an indicator that reflects the attributes of the risk receptor itself. With reference to the existing studies, the vulnerability score should be fixed to ensure that land use types participate in the calculation of spatial vulnerability. The stability index is usually expressed in terms of patch density. In this study, landscape-scale correlation indices were utilized in FRAGSTATS software to calculate LUCF from 2000 to 2020. Because the results of various landscape indices calculated by FRAGSTATS software depend on the grid scale and size, a grid scale of 3 × 3 km was comparatively identified as the most appropriate through volumes of tests. The ecological meaning and calculation of the indicators are shown below:

3.3. The Spatiotemporal Geographically Weighted Regression Model

The spatiotemporal geographically weighted regression (GTWR) model introduces a time dimension based on spatial heterogeneity, which can help to handle spatiotemporal non-stationarity and improve the accuracy of the estimates. The calculation formula is expressed as follows:
Y i = β 0 u i , v i , t i + k β k u i , v i , t i X i t + ε i
where (ui, vi, ti) are the spatiotemporal coordinates of the ith sample point, where ui denotes longitude, vi refers to latitude, and ti is time; β0 (ui, vi, ti) represents the regression parameters and the constant term of the model; βk (ui, vi, ti) refers to the kth regression parameter of the ith sample point; Xit indicates the value of the kth independent parameter at the ith point; and εi is the residual. It is estimated as follows:
β u i , v i , t i = X T W u i , v i , t i X 1 X T W u i , v i , t i Y
where βk(ui, vi, ti) is an estimate; XT is the transpose of the matrix; X and Y are the independent variable and the matrix constituted in the sample, respectively; W(ui, vi, ti) denotes the spatiotemporal weight matrix, which is obtained through the bi-square spatial weight function; W refers to the Gaussian distance function; and the spatiotemporal distance between sample i and sample j is denoted as follows:
d i j = δ U i u j 2 + v i v j 2 + μ t i t j 2
where the choice of bandwidth influences the determination of the spatiotemporal weights. The AICC law was used in this study to determine the adaptive bandwidth.
According to the result of previous research results and the current land use situation in the Dongting Lake area, the study area has an important geographic location and a developed water system. In the development process, land use changes due to urban expansion are often accompanied by inharmonious human–environment interactions that may pose a threat to ecosystem security. In addition, climate change and its associated natural disasters have led to changes in land use resulting in an uncoordinated land use structure. Thus, in this study, we extracted the change values of climate factors, socioeconomic factors, and topography in three dimensions as independent variables and used the change in LUCF during 2000–2020 as the dependent variable to analyze the driving mechanism. In order to ensure the viability of the data, correlation analysis was first used to screen out the factors that play an important role in the dependent variable. The results indicate that most of the factors were significantly correlated. In order to avoid pseudo-regression phenomena in the model before the GTWR model was run, multiple covariance tests were conducted on all the variables using regression analysis, which showed that the variance inflation factor (VIF) for all variables was less than 10, indicating that there was no serious covariance problem among the factors and proving that the model is reliable. The finalized factors include six dynamic factors, i.e., mean annual temperature, precipitation, gross domestic product, population, night-time lighting data, and degree of urban expansion; and two static factors, i.e., elevation and slope.

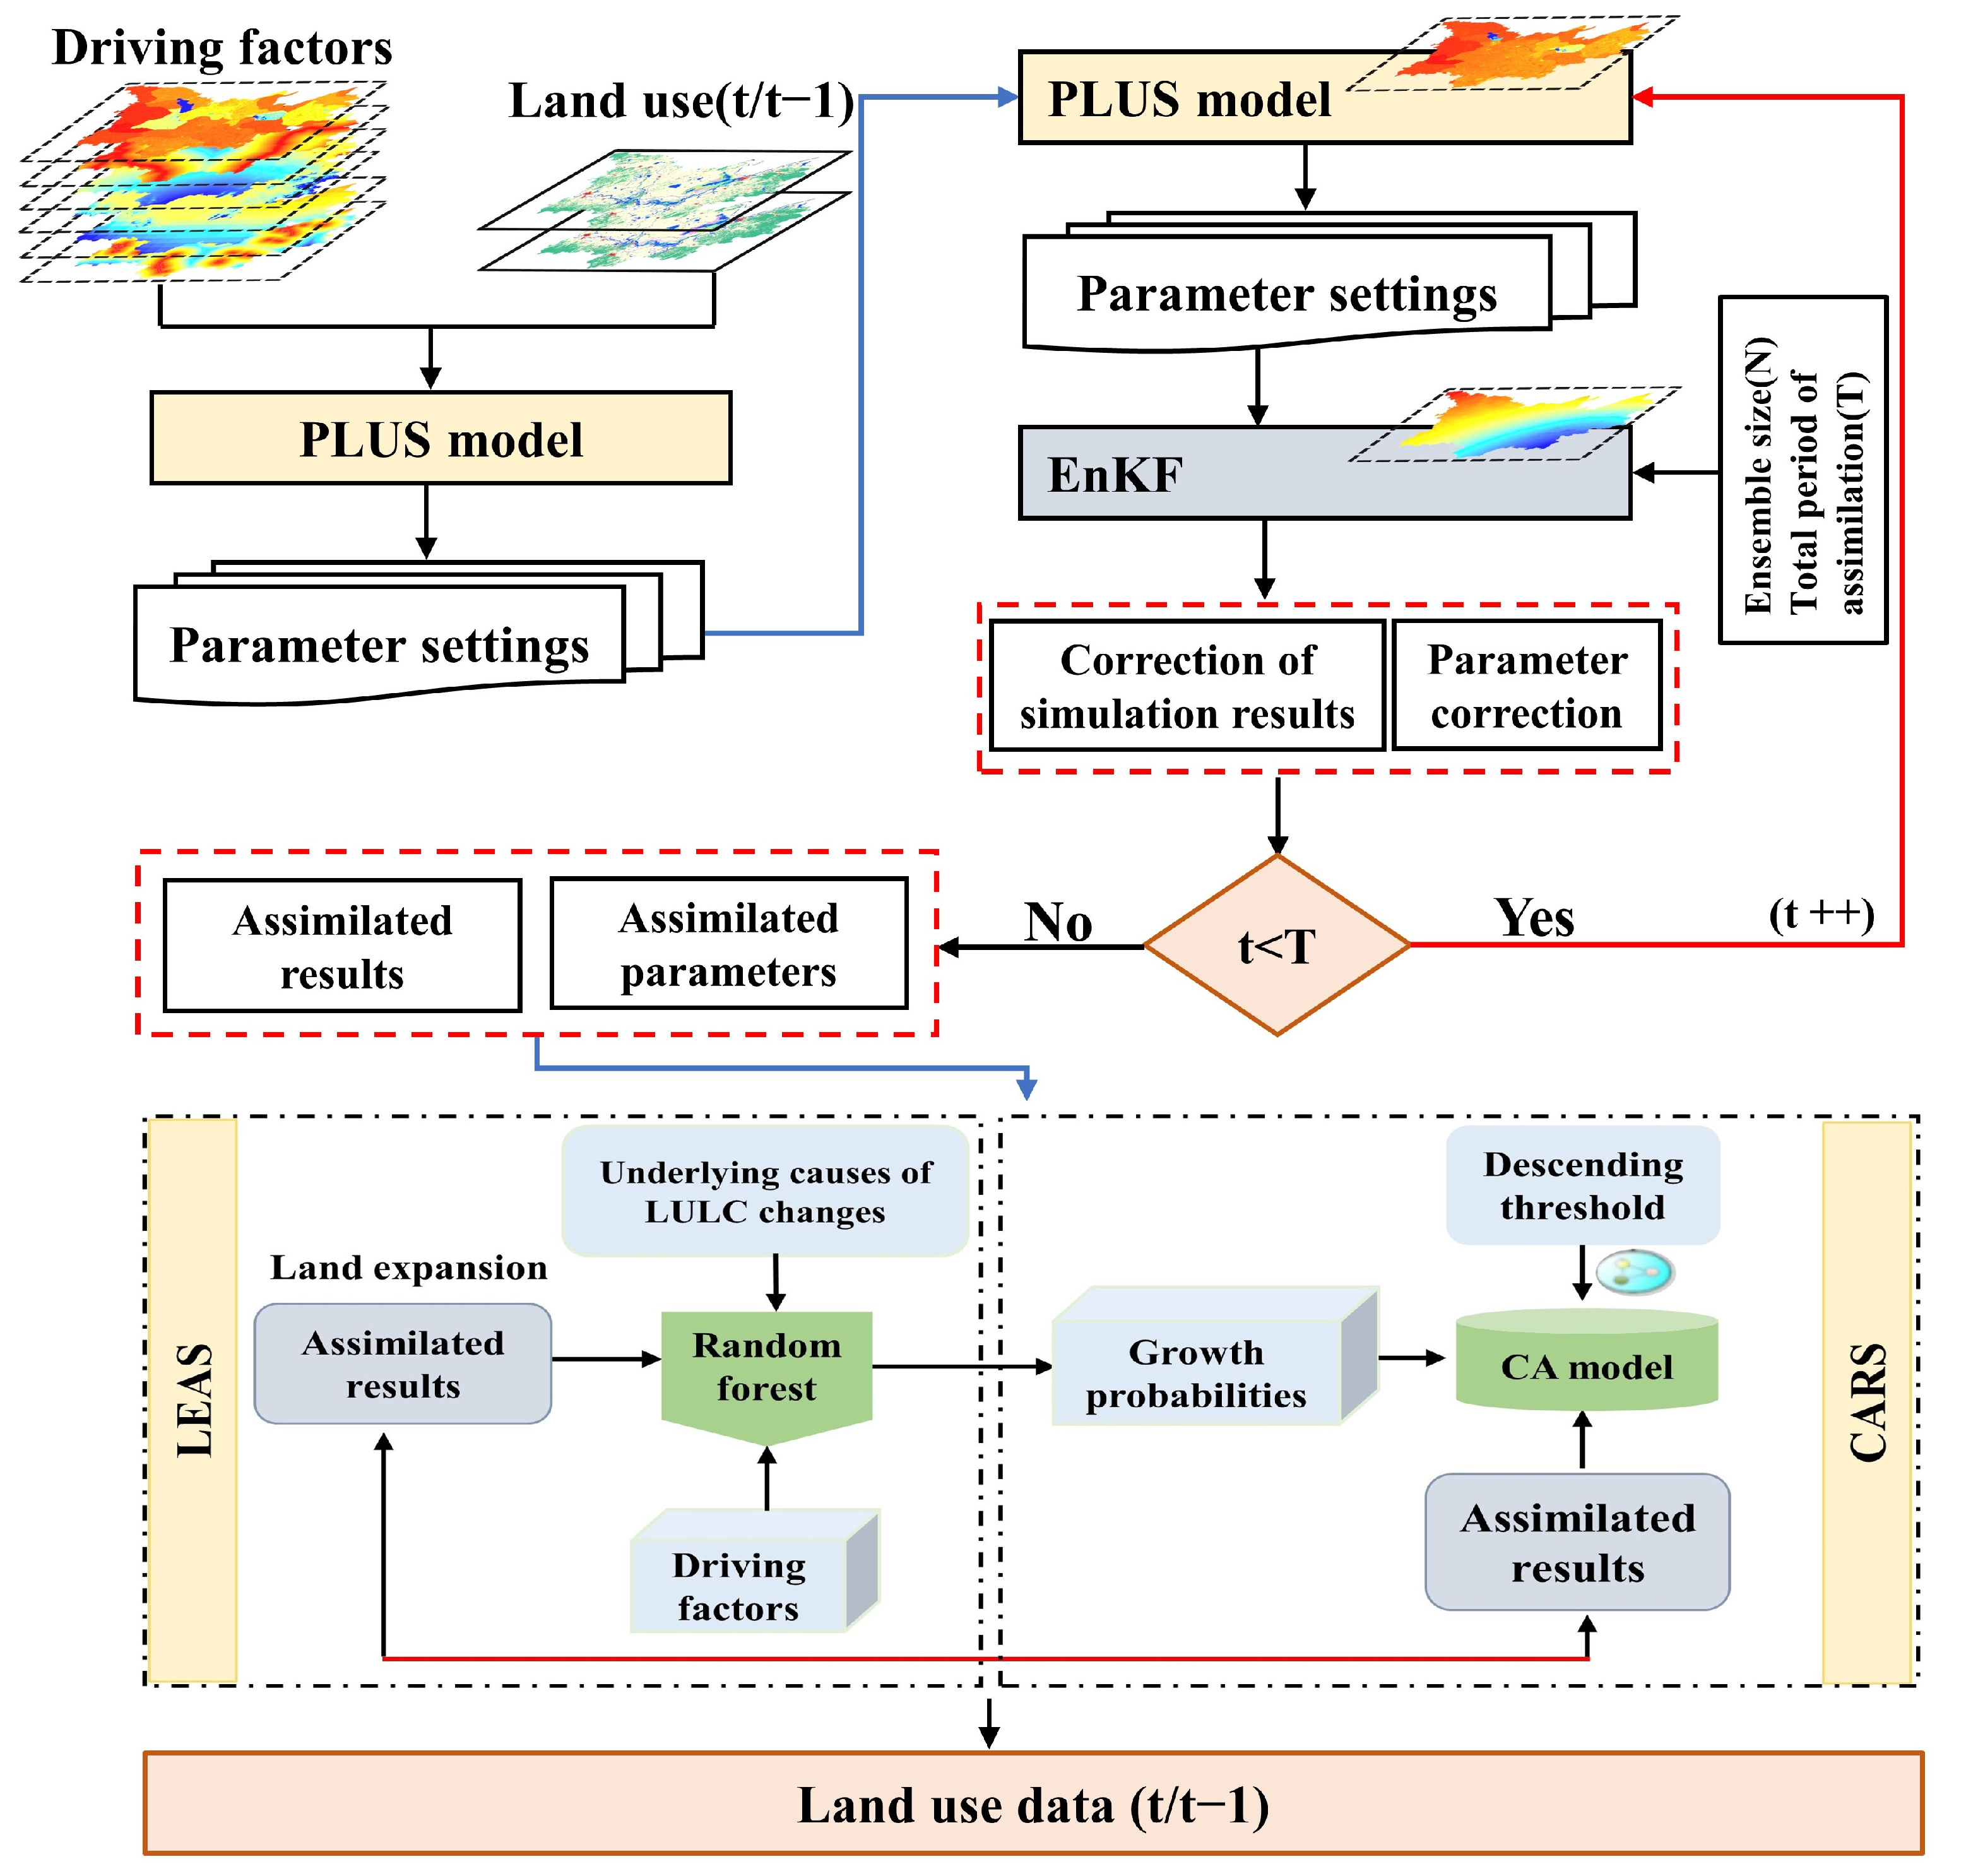
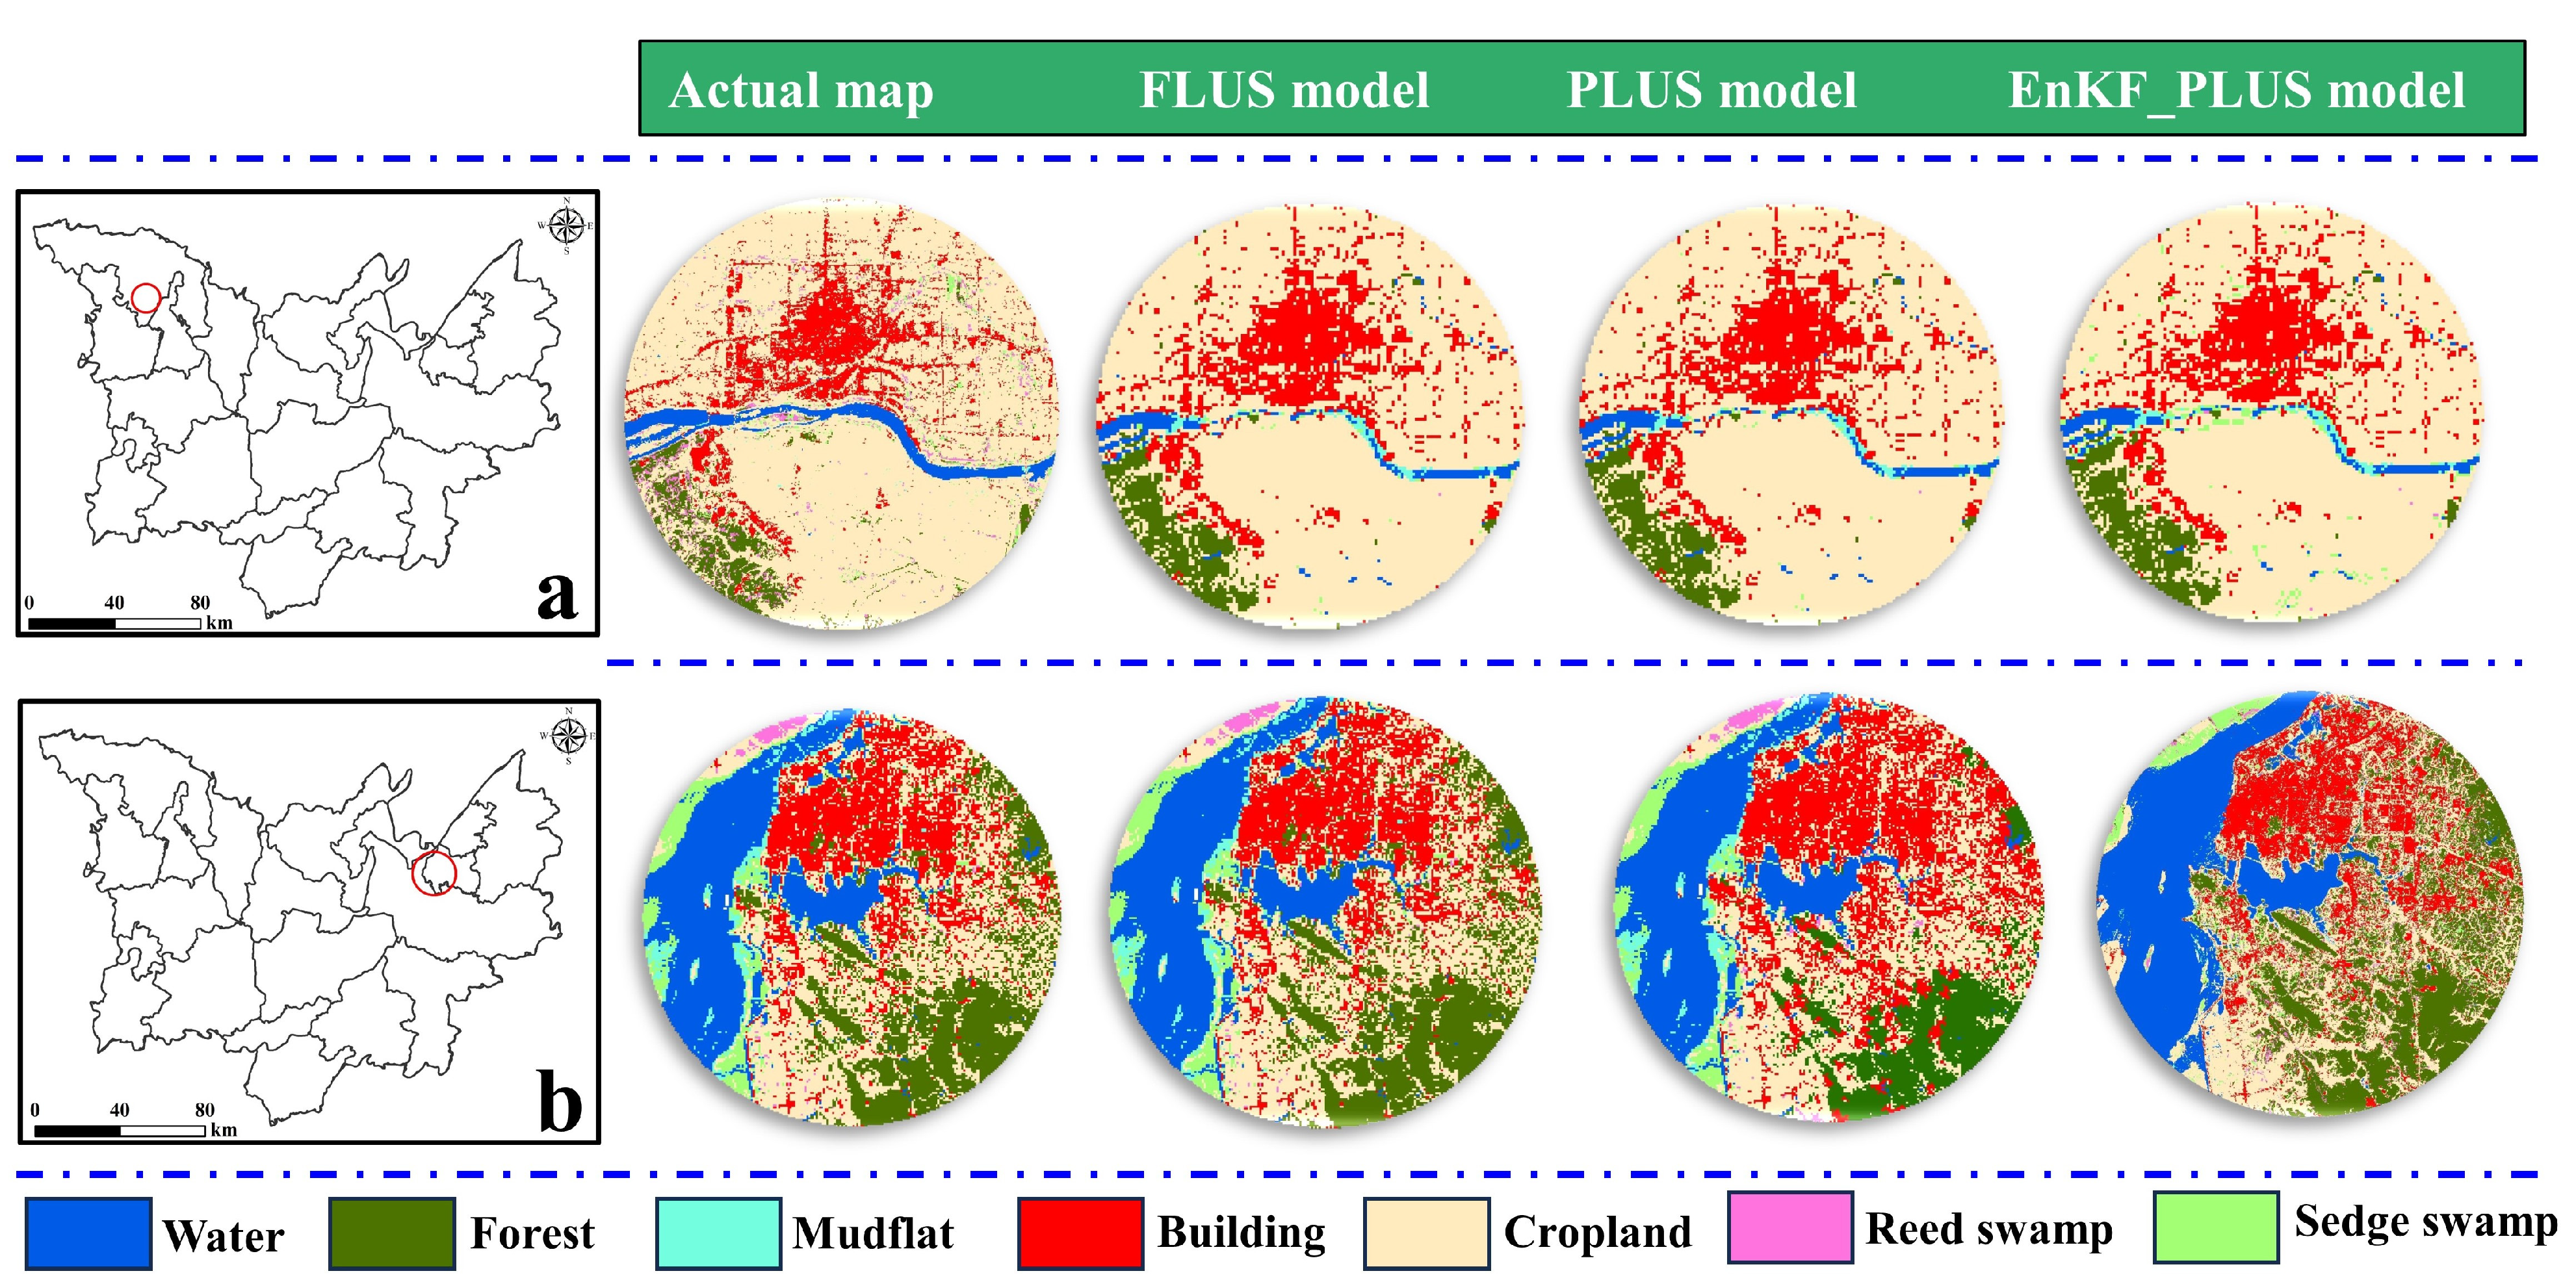
3.4. EnKF-PLUS Model for LULC Simulation

The PLUS model includes a rule mining framework for land expansion analysis (LEAS), as well as a CA model for multitype stochastic patch seeding mechanisms (CARS). The model can be used to mine the drivers of land expansion and predict the patch-level evolution of the land use landscape. Compared to other models, LEAS not only simplifies the evolution of land use change but also supports the ability to simulate changes in natural land patches with a high degree of accuracy for multiple or complex changes in land use type. The ensemble Kalman filtering algorithm can be divided into two stages: prediction and updating. In the prediction stage, the model is initialized using random sampling based on the state values at time t. The initial set of states is obtained to simulate the model and obtain the prediction set; then, the prediction set is used to compute the Kalman gain. In the update phase, the prediction set is updated using the observations and Kalman gain, and the updated results are taken as the analyzed dataset. The prediction and updating steps are then repeated until all states have been predicted and updated.
The EnKF-PLUS model structure is shown in Figure 5. The fundamental principle of model coupling involves inputting the simulation results and observation data of the land use model into the EnKF model to reprocess the data, then using the observational data to continuously optimize the simulation results and related parameters in order to realize and improve the updating of model parameters. First, the initial parameters were constructed by combining the driving data and the PLUS model. Secondly, the initial parameters were substituted into the PLUS model to obtain the LULC simulation results. Thirdly, the EnKF model was combined with the actual LULC data to correct the predicted results and model parameters of the PLUS model, obtaining the simulation results, using the Kappa coefficients and FOM values to validate the accuracy of the model. It consisted of the following steps: (a) random selection of several grids as observation points and extraction of the development values for each square grid as observations; (b) calculation of LULC in the year of data assimilation using the PLUS model, with simulation results used as projections; (c) combination of the EnKF equations to set the parameters based on the simulated and observed values, using the predicted and observed values to calculate the Kalman gain; and (d) calibration of land use results and input parameters of the PLUS model using Kalman gains and observations. Fourth, the calibrated results and parameters were reinjected into the land use simulation model as initial values to emulate the next assimilation moment (t + 1) until the end of all assimilation processes. Eventually, the improved PLUS model based on EnKF was used to simulate future LULC changes.
Based on the overall urban development trend and the current situation in the study area, a natural development scenario (NDS), cropland conservation scenario (CCS), and ecological conservation scenario (ECS) were set up to predict future LULC and LUCF.
(1) Natural development scenario: Without setting any transfer rules and restrictions on LULC using land planning policies, the LULC development scenario for 2030 was projected according to the development probabilities for 2000–2015.
(2) Cropland conservation scenario: Based on the superiority of the natural conditions of the Dongting Lake area, the main aim was to limit the occupation of cropland by other LULC types and to support the transfer of all other LULC types to cropland except for building land.
(3) Ecological conservation scenario: Parameters were set for the land use change scenario in 2030 with reference to the concept of “ecological priority and green development”, strictly protecting ecological land such as forests, grasslands, and waters; controlling the transfer of ecological land; and realizing the priority of ecological protection.

4. Results and Analysis

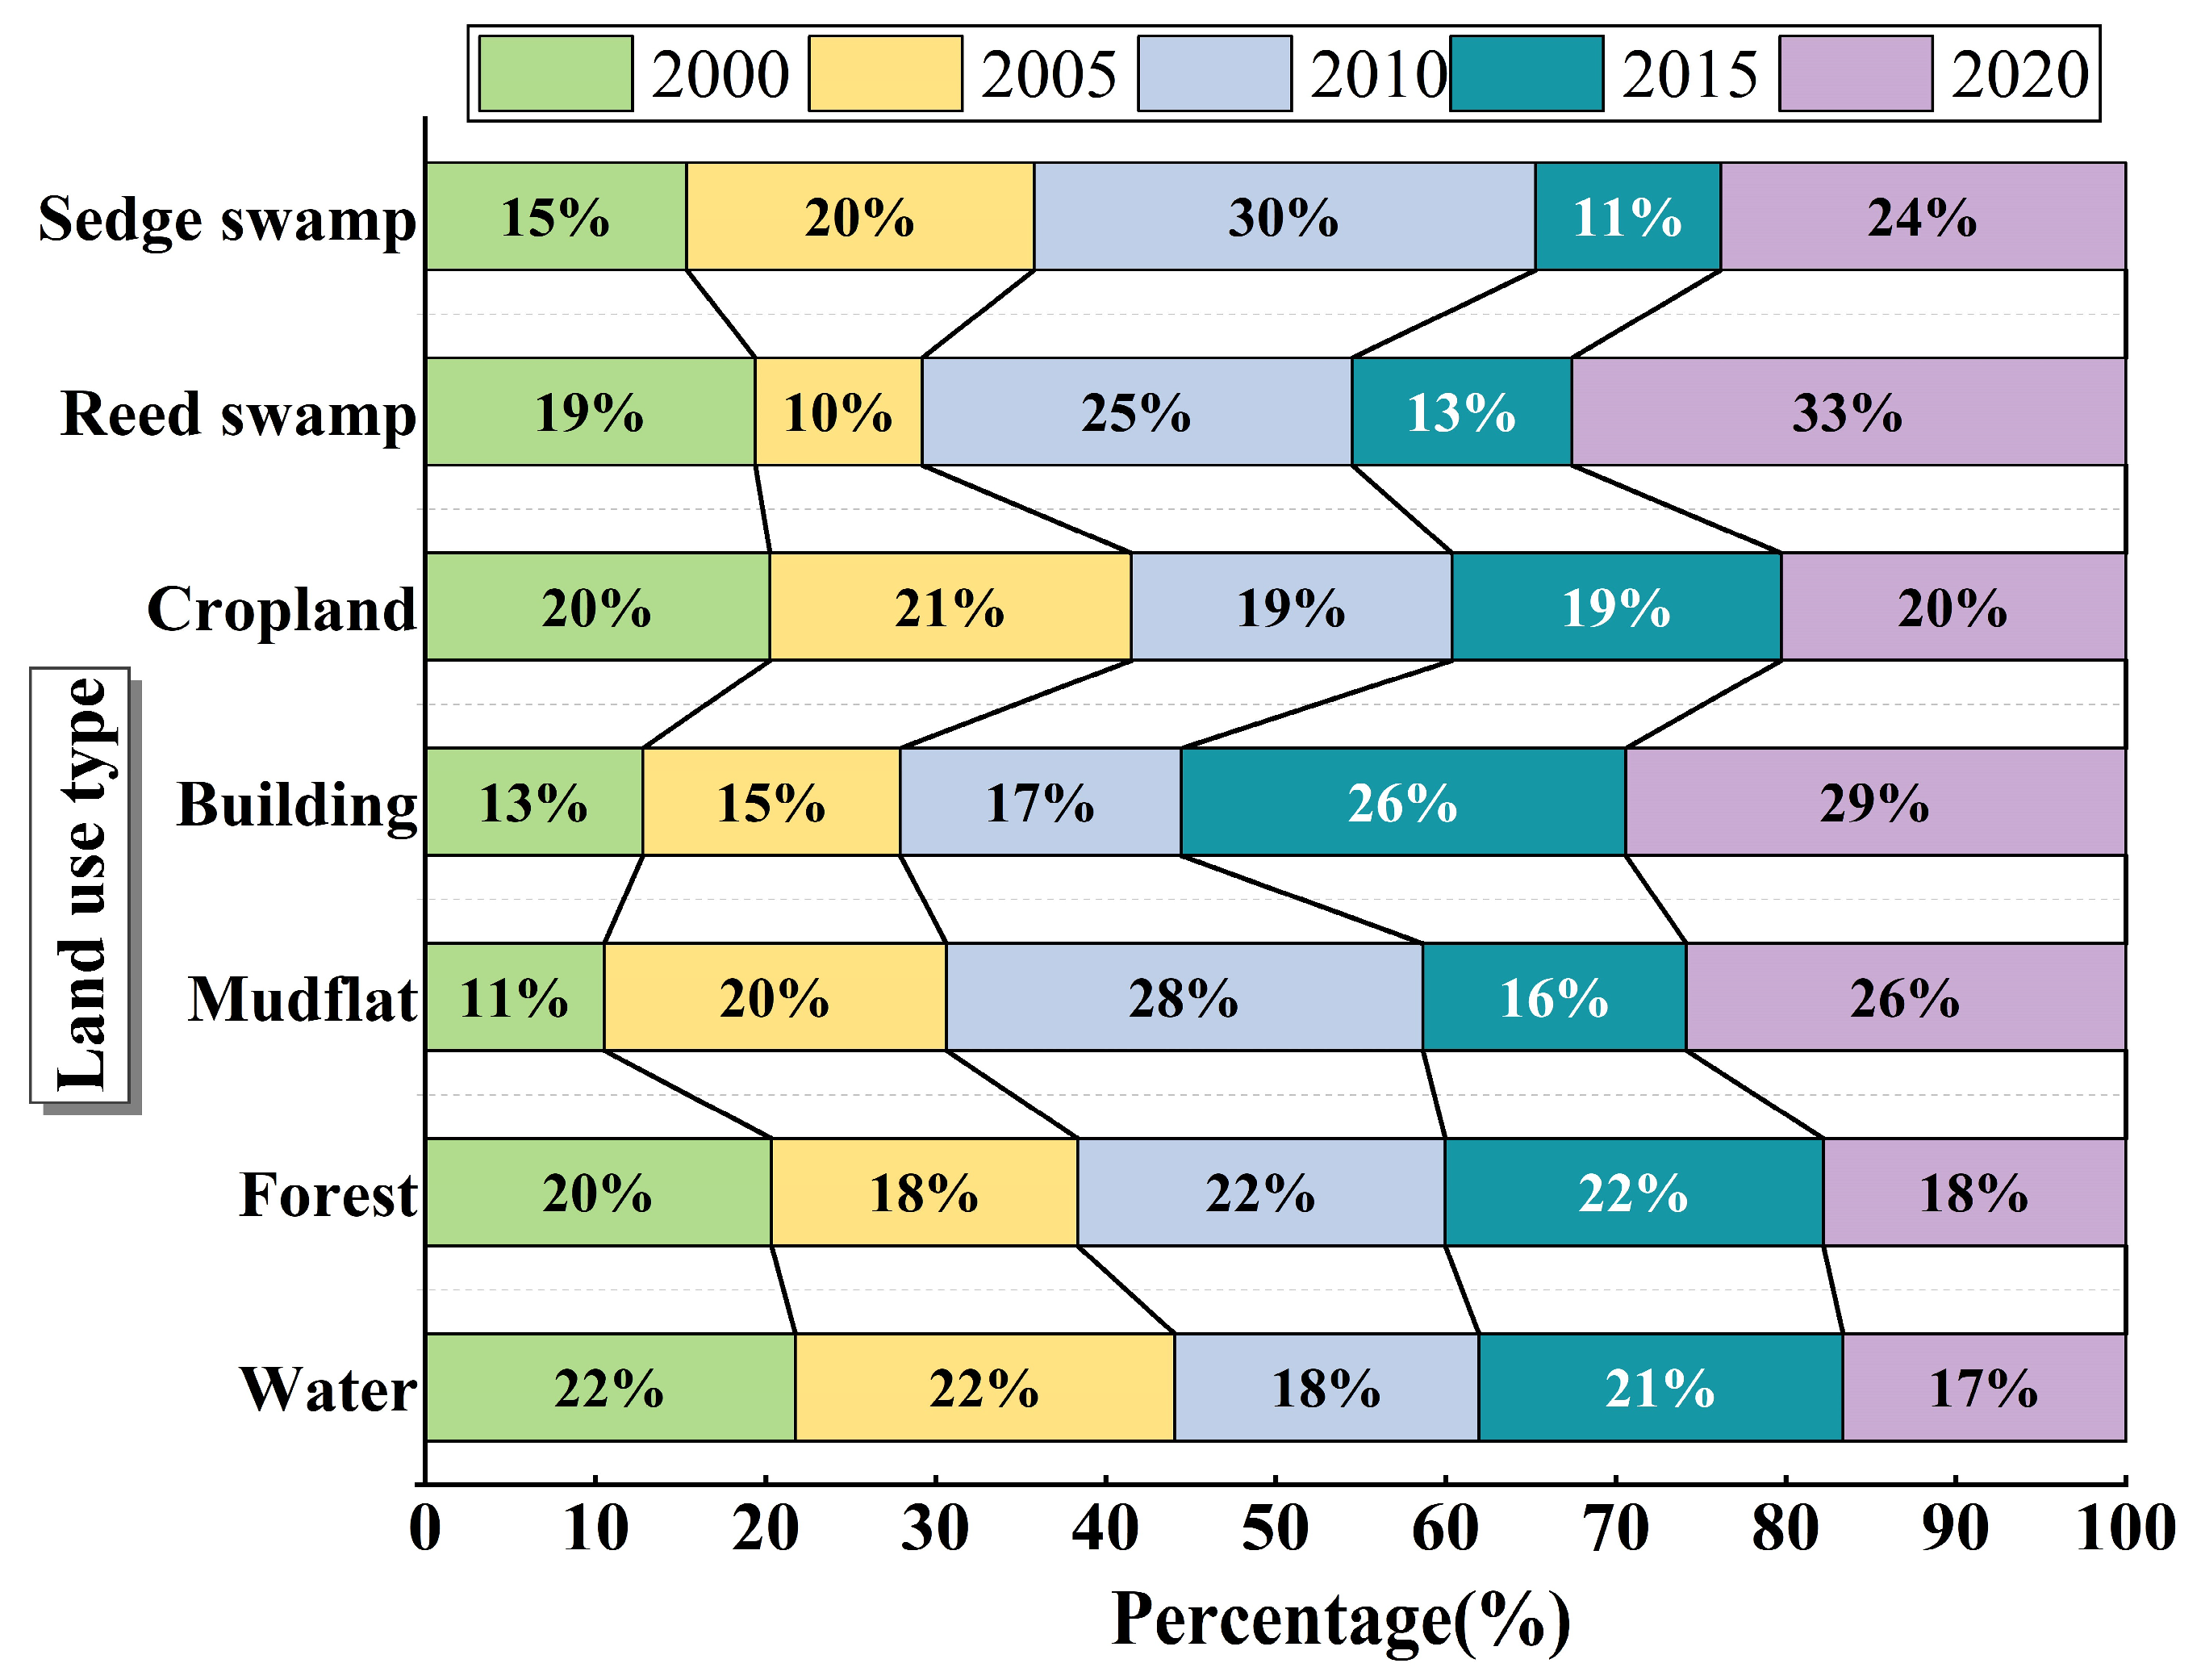
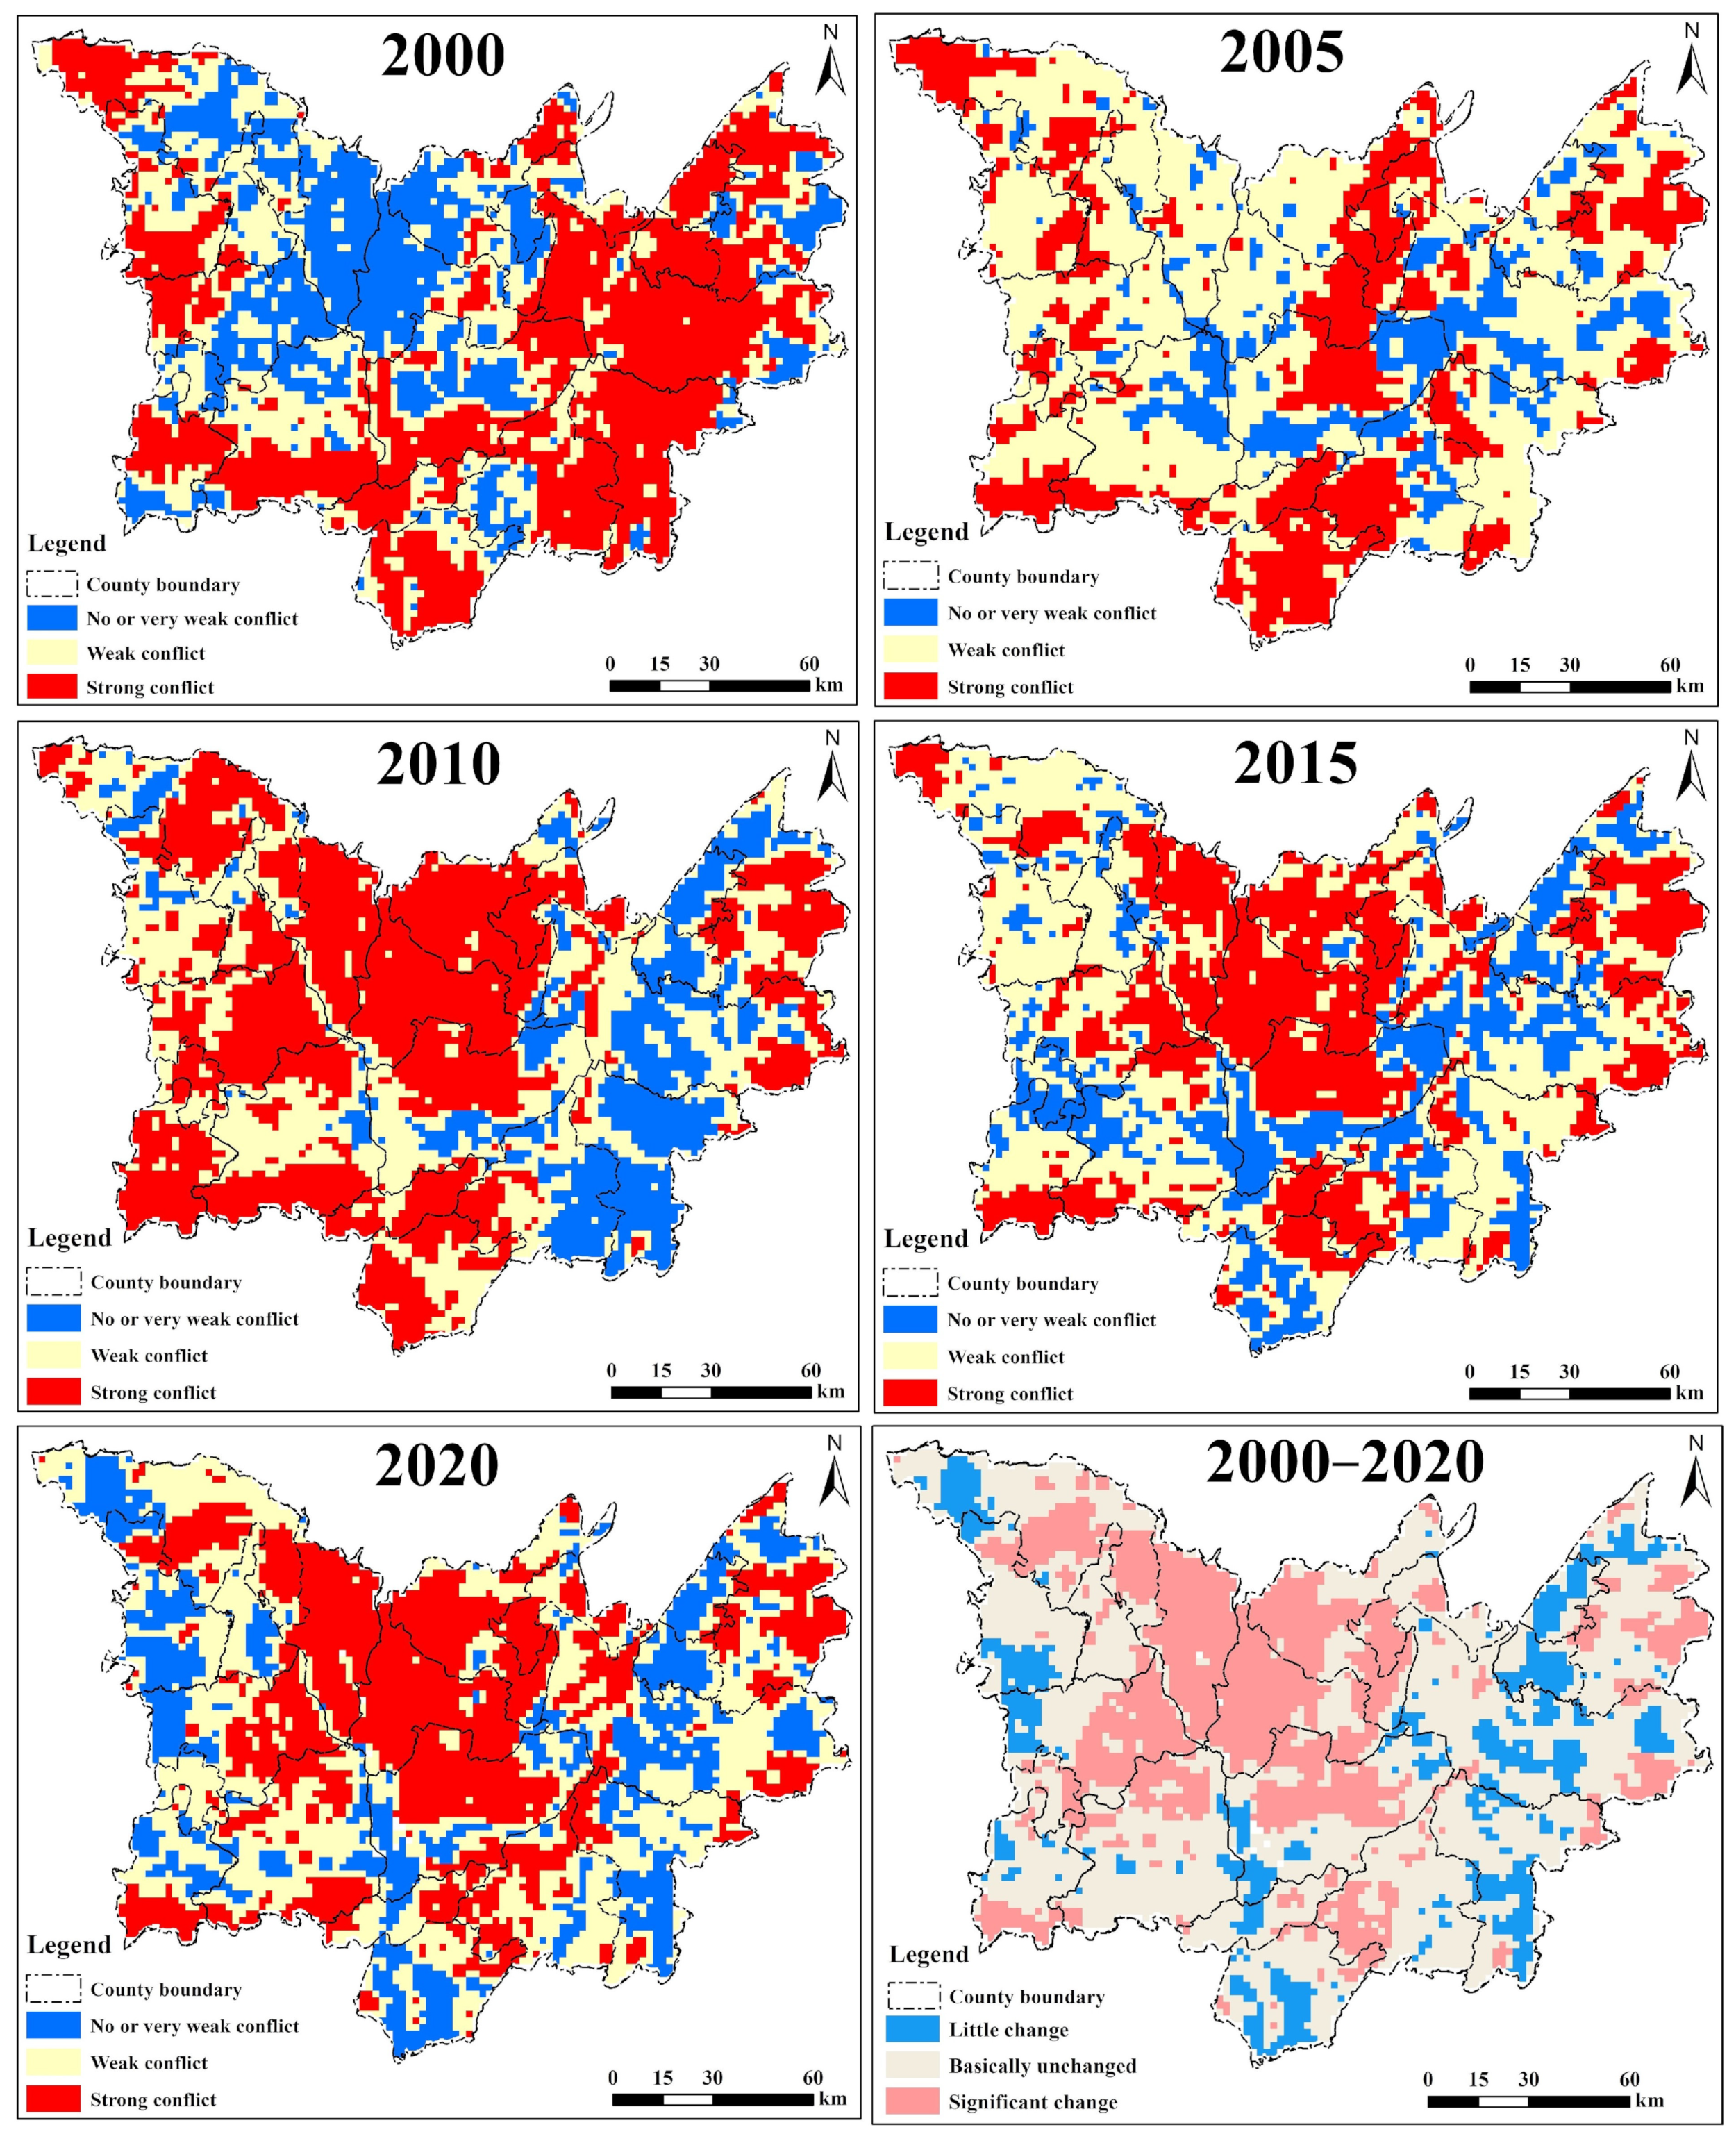
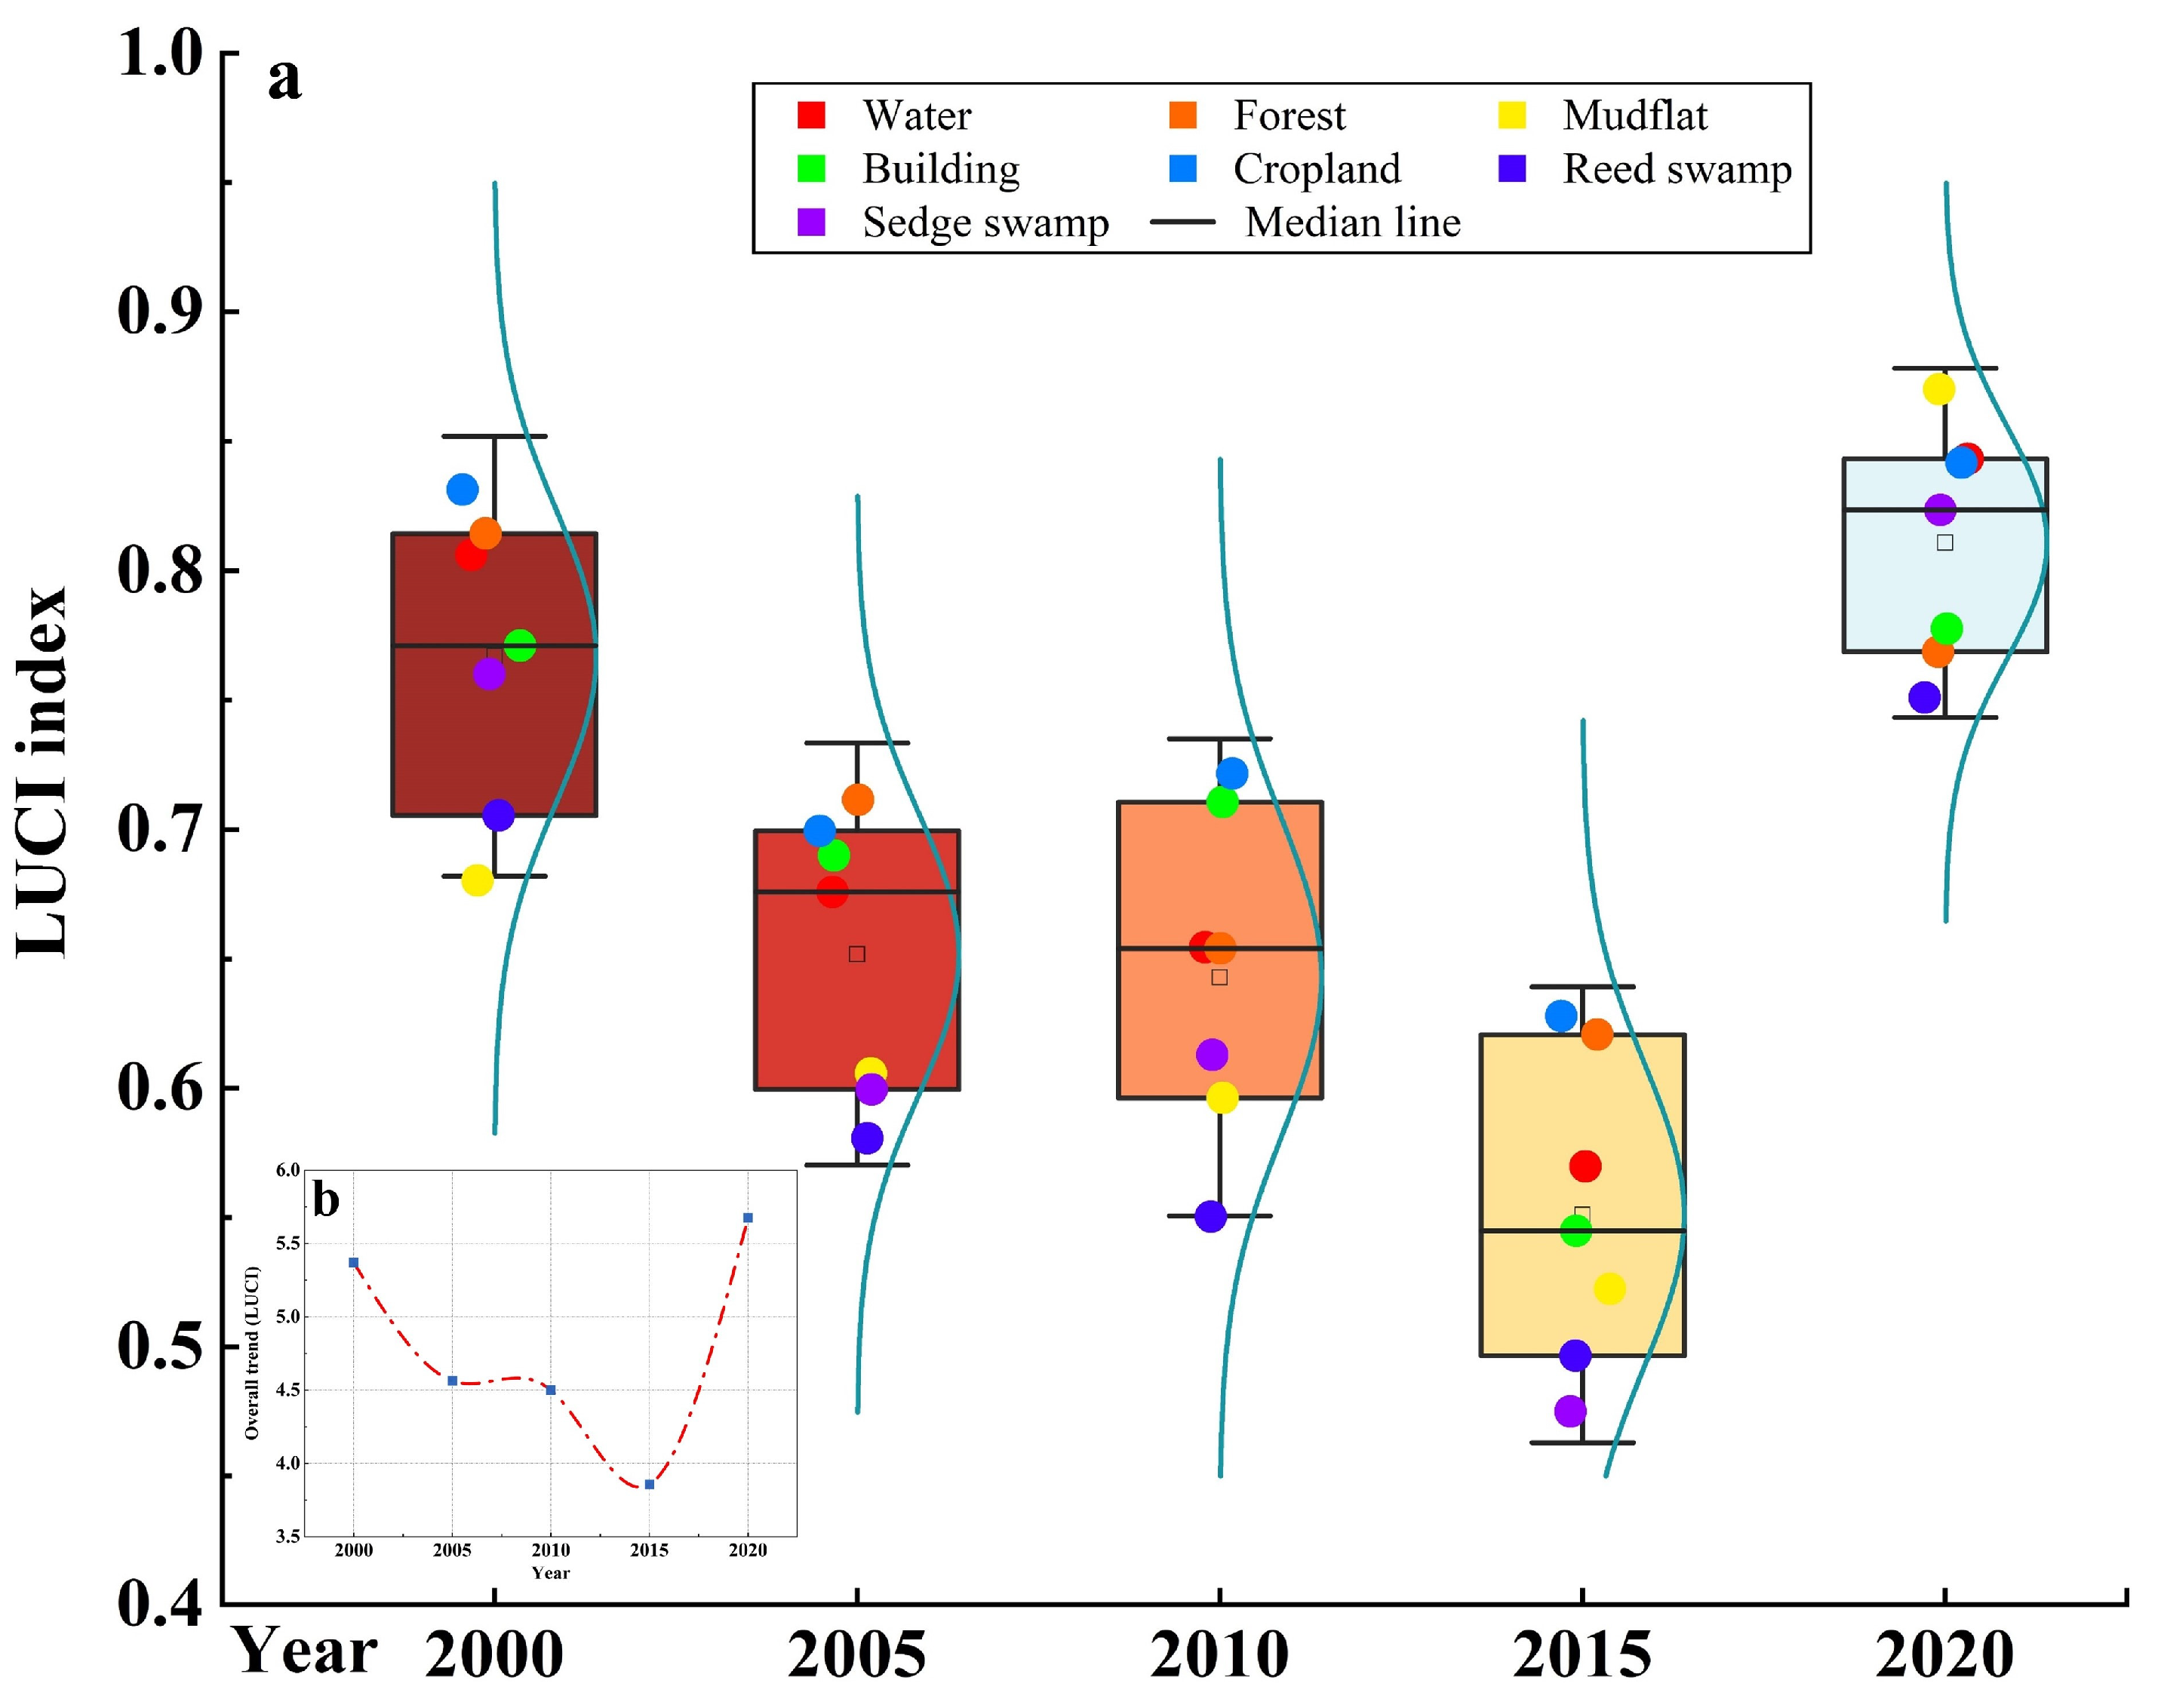
4.1. Spatiotemporal Evolution of LUCF in Dongting Lake Area

The areas of mudflat, building, cropland, reed swamp, and sedge swamp in the Dongting Lake area all showed an increase during the period of 2000–2020. In particular, the building area increased most significantly and presented a continuous growth trend, with a total increase of 563.3001 km2, corresponding to an increase of 1.30%. However, the area of water and forest dropped by 494.1594 km2 and 1016.5725 km2, corresponding to a decrease of 0.23% and 0.12%, respectively (Figure 6). In general, the need for urban development strategies has led to an accelerated rate of urbanization and frequent human activities, which have resulted in the encroachment of a large amount of cropland and led to the phenomenon of de-agrarianization.
The LUCF index of the Dongting Lake area from 2000 to 2020 was categorized into three levels: no conflict or very weak conflict (0–0.5), weak conflict (0.5–0.7), and strong conflict (>0.7) (Figure 7). The figures demonstrate that the LUCF in the Dongting Lake area has significant spatial differences highly coupled with the spatial distribution characteristics of the terrain, with spatial distribution characteristics presenting a trend of “high in the middle and low in the surrounding”. Generally, the high-value areas of LUCF are concentrated in Wuling District, Nanxian, Yuanjiang City, Yueyanglou District, and other areas with low terrain. These regions are densely populated and highly urbanized, whereas the excessive demand for land resources generated by the concentration of cropland creates a high level of LUCF. In contrast, the low-value areas of LUCF are in the hilly parts of Linxiang County, Pingjiang County, Yueyang County, and Anhua County. The predominant land cover type in these regions is forest, with high vegetation cover and low levels of anthropogenic interference, resulting in a low level of LUCF. In 2000, strong LUCF areas mainly occurred in Hualong, Nanxian, and Anxiang counties. The proportion of strong conflict areas decreased significantly in 2005, whereas weak conflict areas increased and occurred mainly in the northwest and east of the study area, represented by Linxiang County and Pingjiang County. Facing a series of ecological degradation problems brought about by rapid economic and social development, China has undergone a profound shift in its conceptual perception of ecological protection and restoration, which has fundamentally promoted ecological protection and restoration policies and led to the rationalization of the use of land resources. As a result, LUCFs in the study area have declined significantly. Between 2010 and 2020, no significant change in LUCFs in the study area was observed, and strong conflict areas leveled off, with high-value areas of conflicts distributed around the Dongting Lake water system (Nanxian County, Yuanjiang County, and Yueyanglou District), confirming that the exploitation and utilization of land resources are characterized by exchanges of various land use modes.
Differences in the LUCF index were observed depending on LULC type (Figure 8); cropland, building, and water had high LUCF compared to other types. Because urbanized areas represent the main platform for human economic activities and for the purpose of meeting the needs of urban development, the urbanized area will continue to spread and expand outward, resulting in a diffusion effect of LUCF in the spatial distribution to a certain degree, as well as increased LUCF. Furthermore, owing to the unique geographic location of Dongting Lake, as well as the abundance of water resources and cropland, the land resources in the study area have a very high development value, making the area a hot spot for competition among stakeholders, with a relatively intense degree of LUCF. Weak and very weak conflict areas are dominated by forest, with stable LUCF.

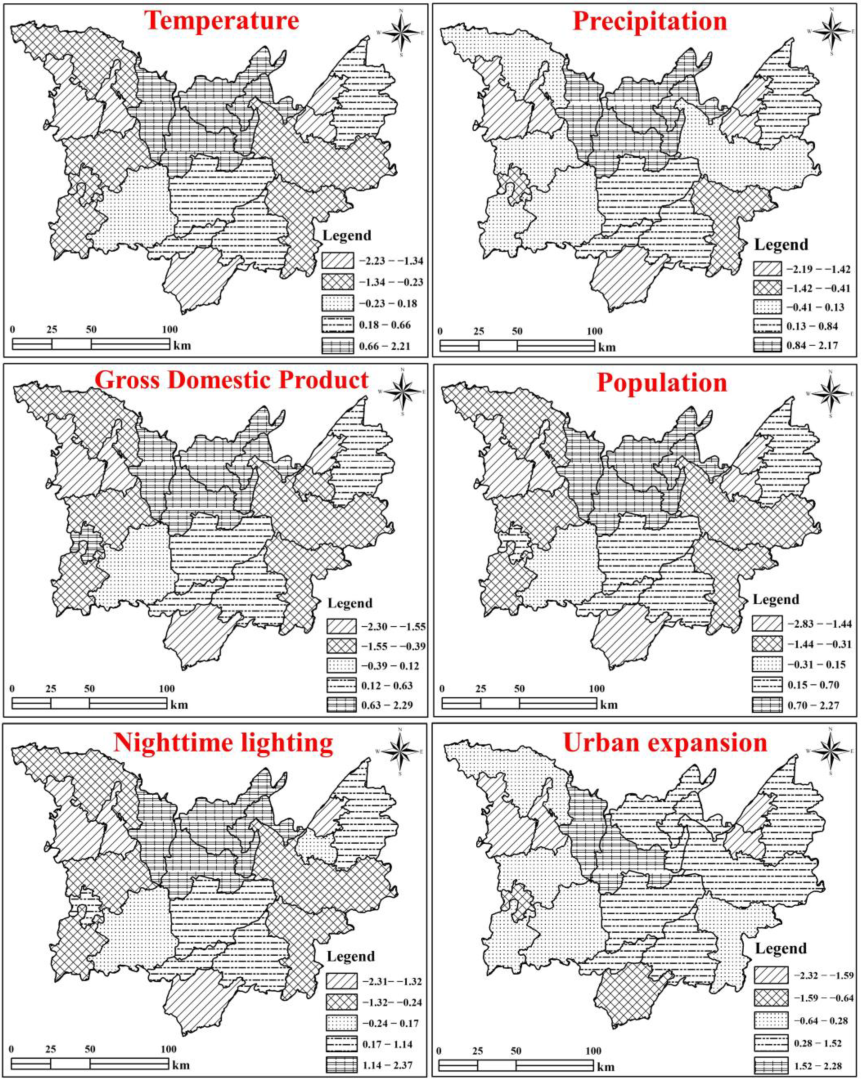
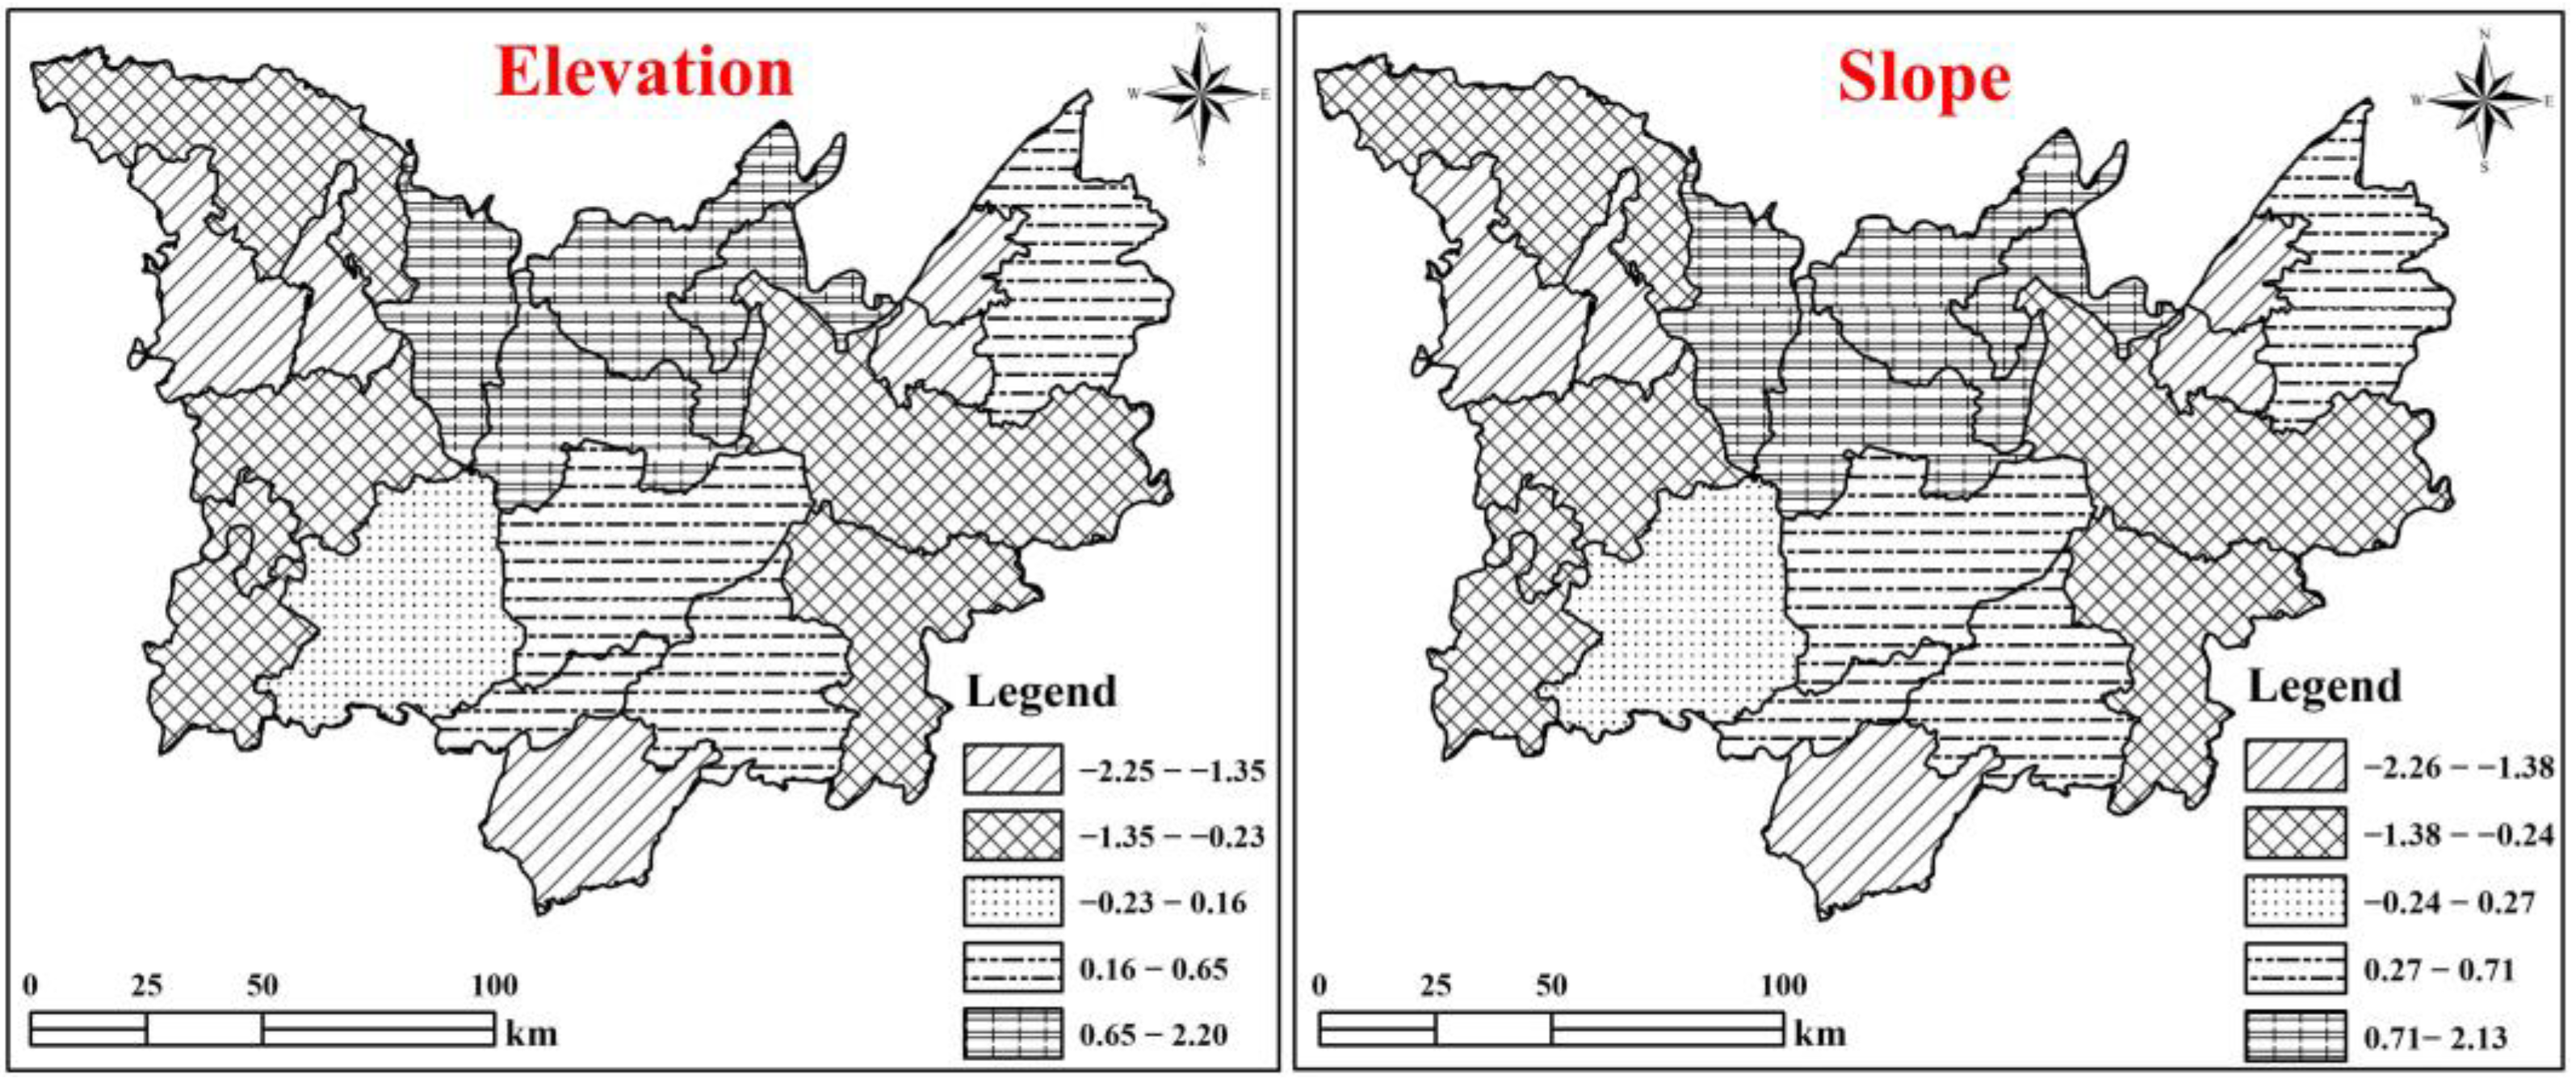
4.2. Mechanisms Driving Spatiotemporal Heterogeneity in LUCF Change

The driving factors exhibited spatial heterogeneity for all LUCF changes. Specifically, the high-value areas of regression coefficients of mean annual temperature and precipitation with respect to the change in LUCF are mostly distributed in the Hualong, Nanxian, and Junshan districts, and the negative-value areas are centered in Linli and Yunxi districts, with a significant correlation with the mean annual temperature. In contrast to the regression coefficients for mean annual temperature, the mean region of influence of precipitation on changes in LUCF is significantly larger than the degree of interference of mean annual temperature. Climate conditions, especially precipitation, have a greater degree of influence on changes in LUCF. On the one hand, an increase in precipitation can effectively alleviate the competition for water resources in production and daily life, thereby reducing the intensity of LUCF. On the other hand, the increase in precipitation can put pressure on the water level, which can lead to disasters such as floods and contribute to changes in the intensity of LUCF. There was a strong consistency between the effects of GDP and population on changes in LUCF. Given the rapid pace of economic growth, expansion has continued, with more frequent human activities resulting in significant changes in LUCF. Population growth leads to increased competition for land types and changes in the demand for various types of land, causing LUCF. Anthropogenic interference affects the stability of the surrounding landscape pattern, corresponding with increased LUCF. With increased distance and decreased inhuman activities, land use conflict decreased significantly. Night-time lighting data have become an increasingly important indicator of human activity, including socioeconomic factors and energy consumption. The results indicate that the high-value areas of night-time lighting with respect to LUCF changes are mainly distributed in Huarong, Nanxian, and Yuanjiang City, whereas the low-value areas are centered in Linli County. The more available night-time lighting data, the better the economic development, the higher the industrial production of human societies, and the higher the energy consumption, all of which are factors contributing to conflicting land use changes. Urban expansion and LUCF changes show a positive correlation: the more prominent the urban expansion, the stronger the LUCF (Figure 9).
Topographic factors are consistent with changes in LUCF. Elevation and slope are suitable for human activities in the lower range, whereas increased values are not suitable for human production and life, corresponding with a decline in land use conflict. When the elevation and slope increase further, the land use is basically undisturbed in any way, maintaining its original state, with land use conflict also in a low-level stable state. As Dongting Lake is a hilly basin, the high terrain is dominated by forest as the major land use type, whereas the lower terrain is generally cropland and farmland, with a high degree of land use. The complexity of the terrain results in significant changes in LUCF. Overall, the change in LUCF in Dongting Lake is affected by the comprehensive effect of multiple driving forces; the competition and interaction of each driving factor constantly reconstruct the spatial pattern of land use. The turnover of the dominant driving force of land use over time characterizes the coupled state of the driving factors for dynamic changes in the spatial pattern of LUCF (Figure 10).

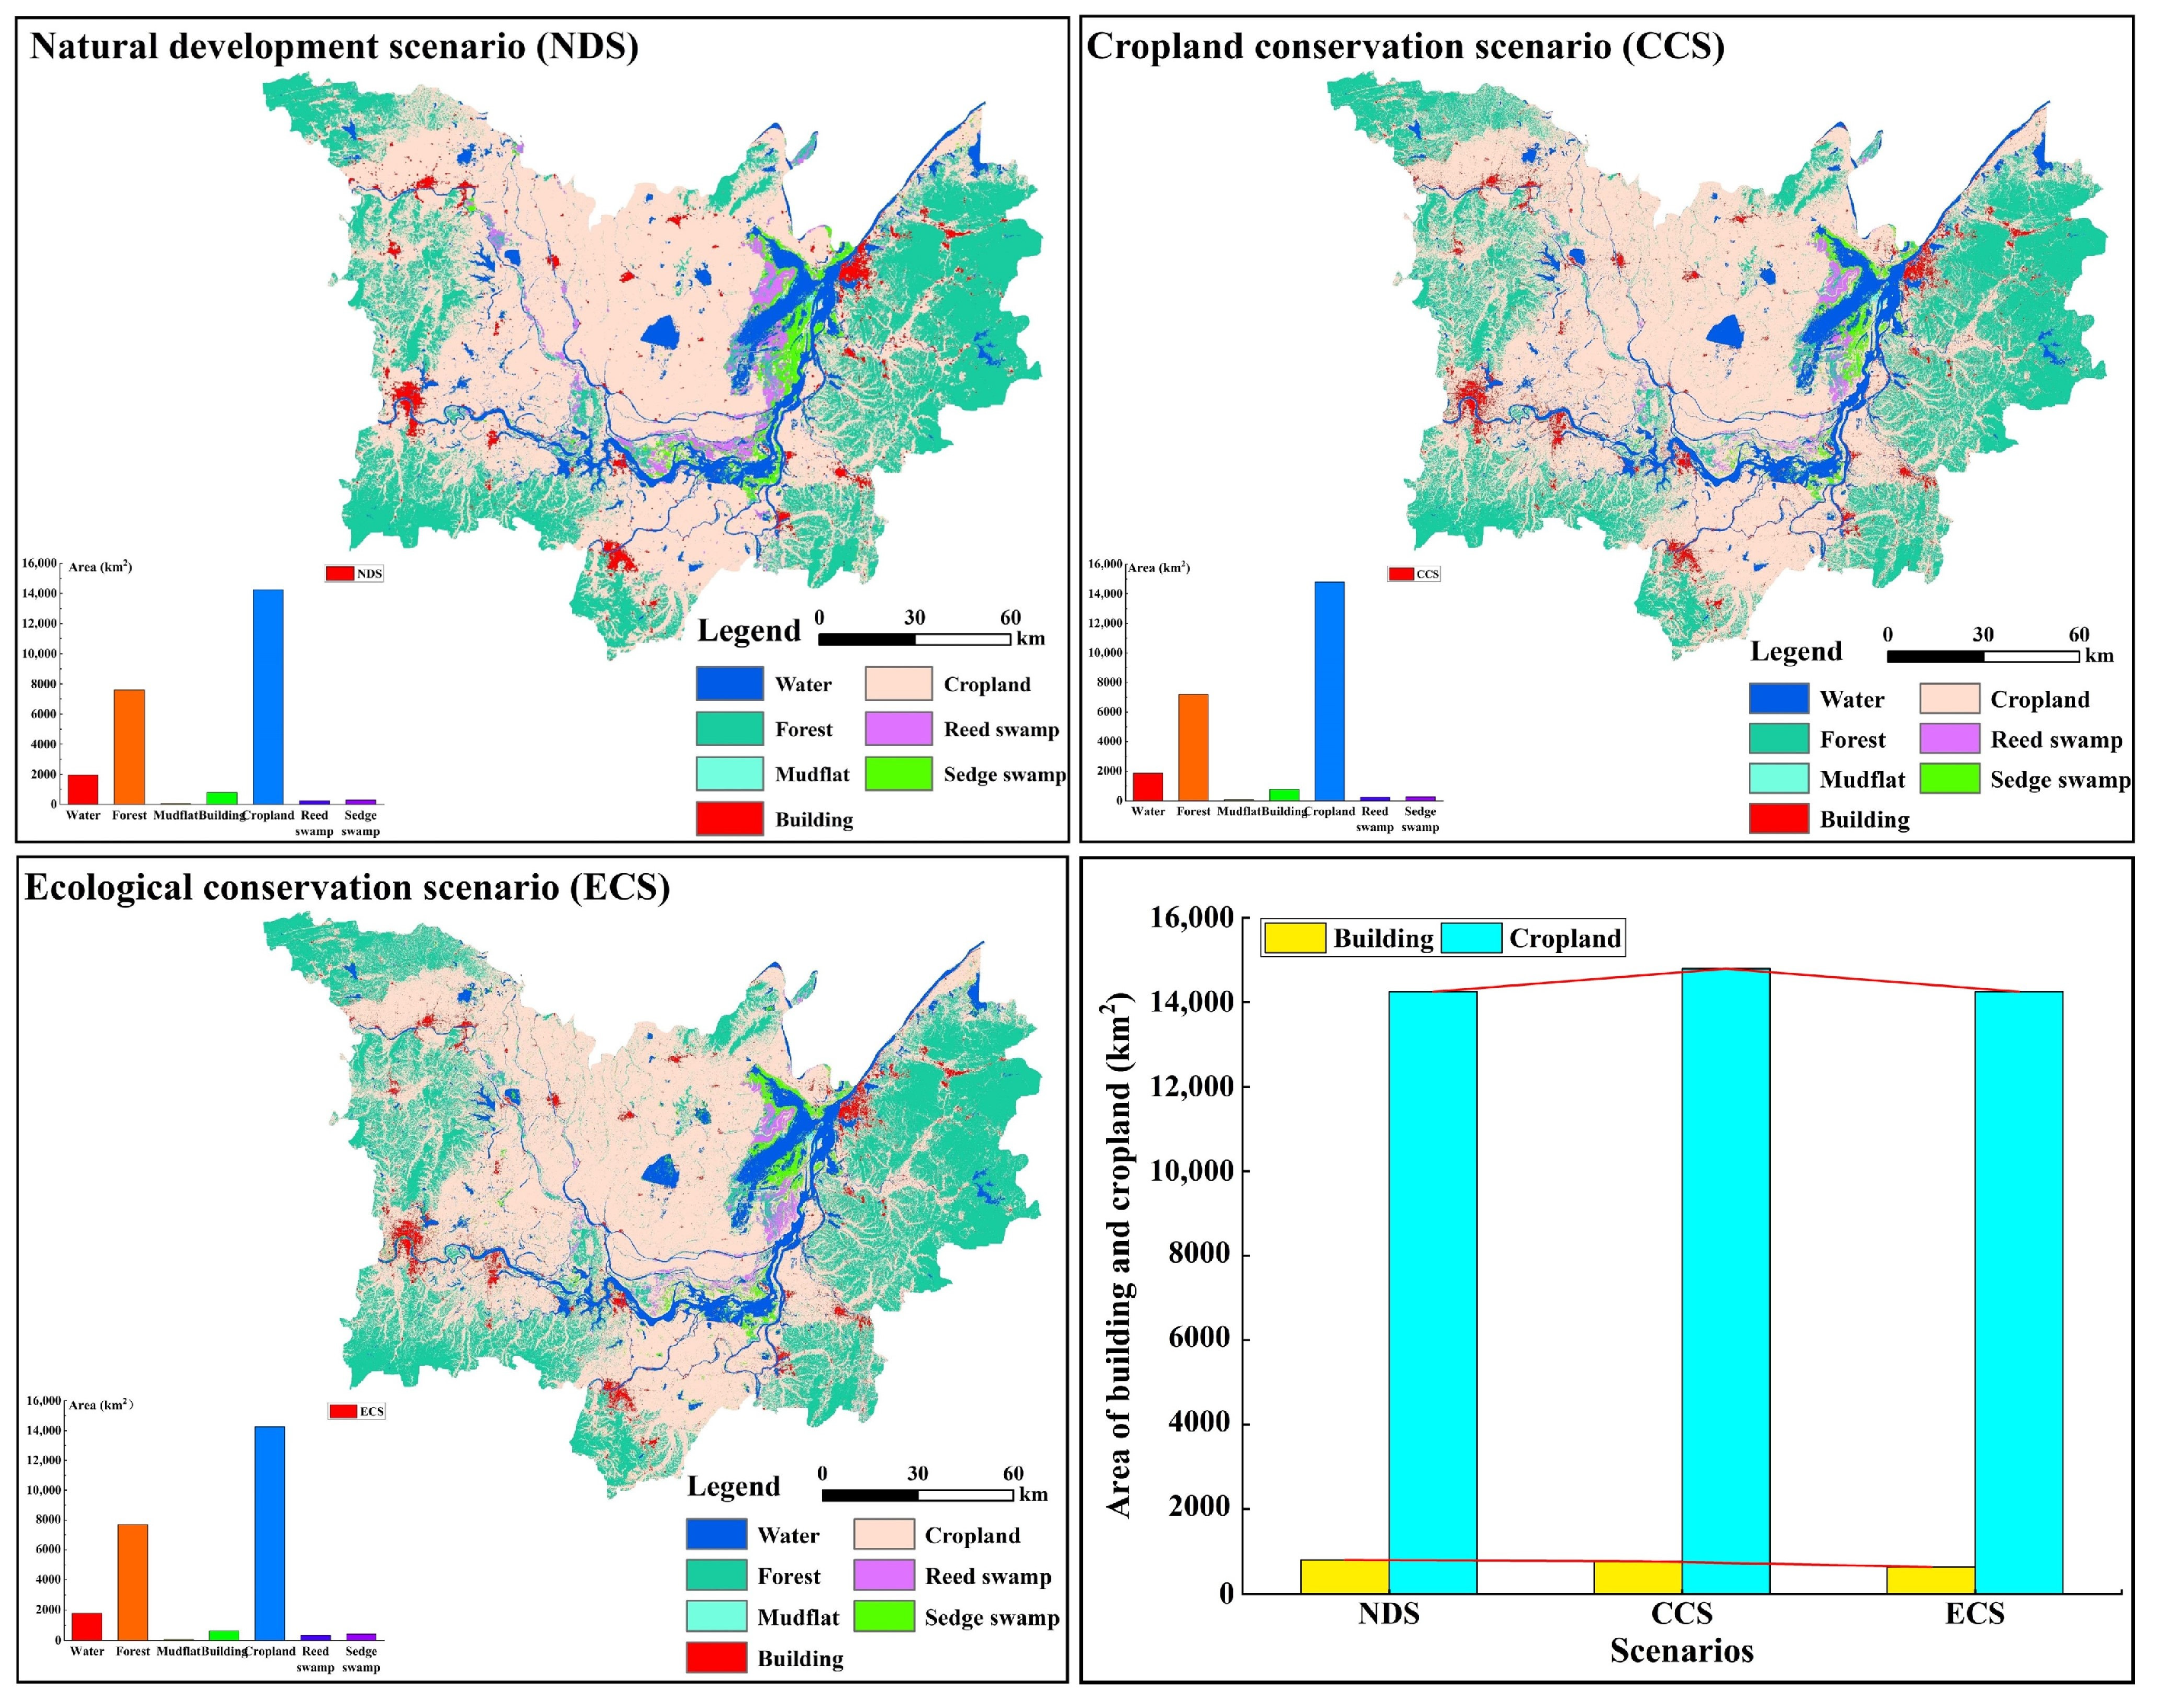
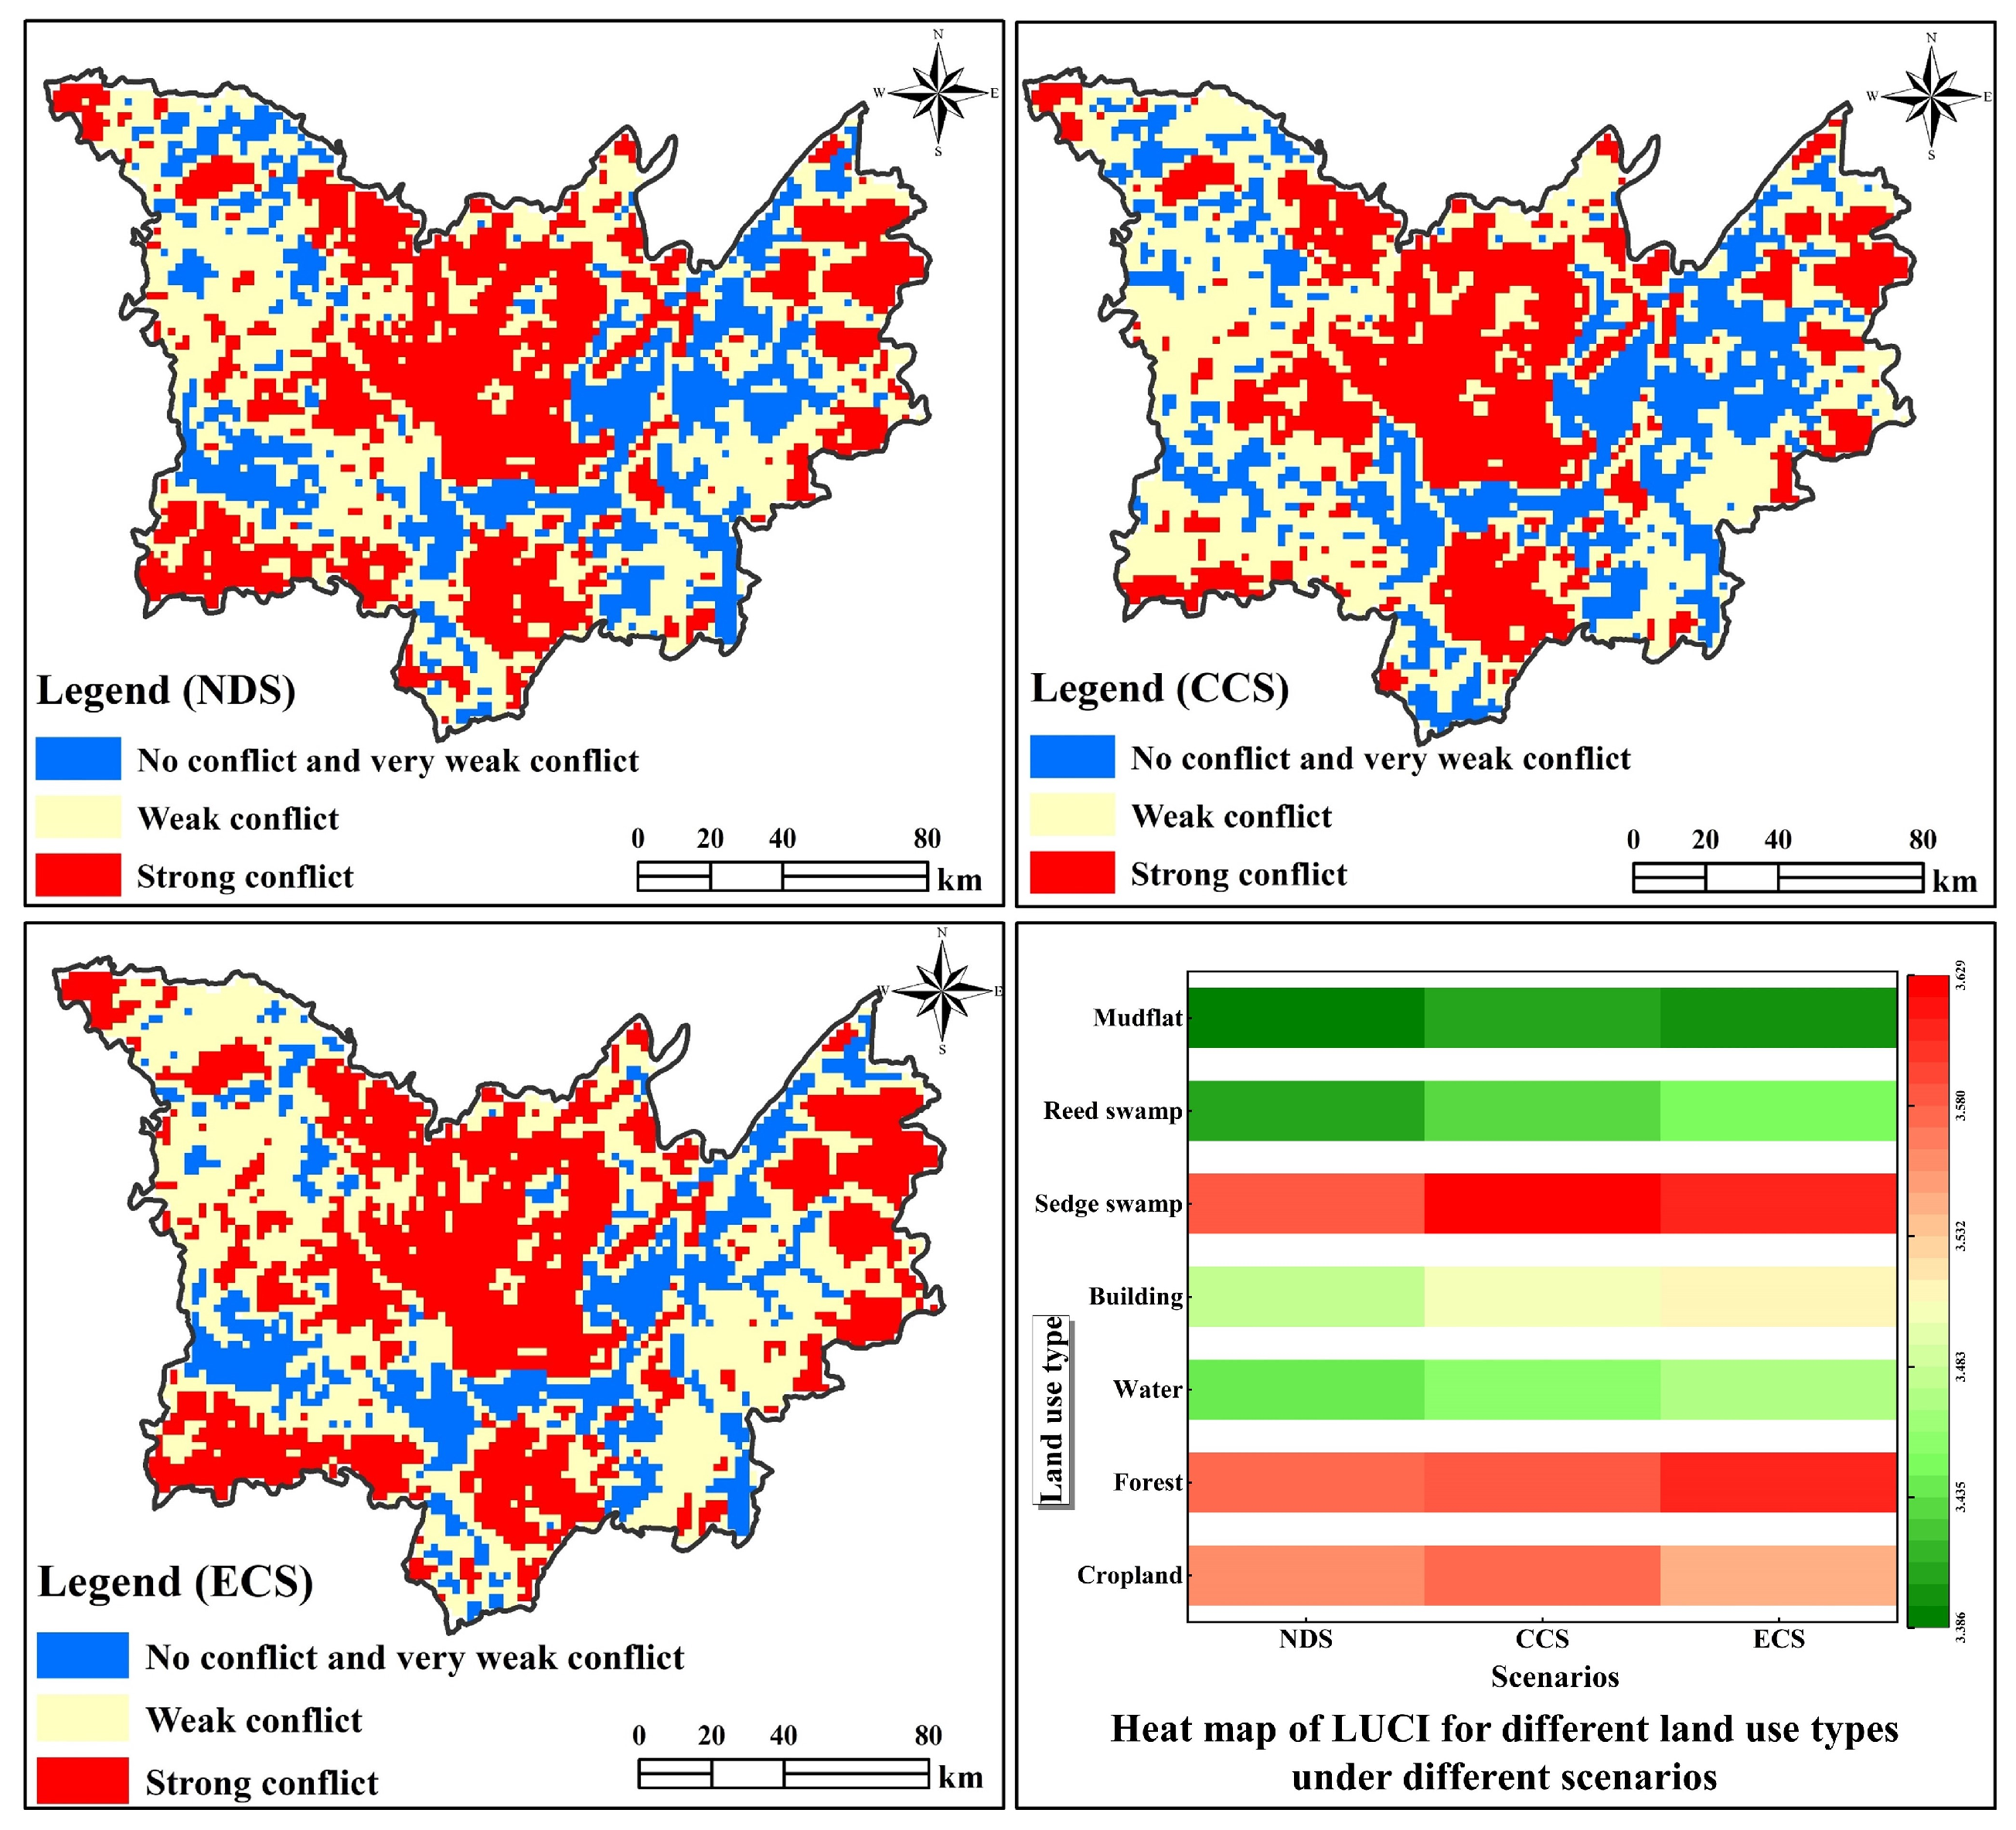
4.3. Spatial Distribution of Future Land Use and LUCF under Different Scenarios for Dongting Lake

In order to verify the advantages of the EnFK-PLUS model proposed in this study, the LULC results simulated by multiple models were compared with the actual LULC in 2020. The Kappa coefficient of the simulation results for the EnKF-PLUS model is 0.85, whereas the Kappa coefficients for the FLUS model and PLUS model are 0.79 and 0.82, respectively, demonstrating that the EnKF-PLUS model proposed in this paper has an advantage over the other two models. The simulation results of the FLUS and PLUS models indicate that the expansion of building area was obviously excessive and inconsistent with the actual situation, whereas the EnFK-PLUS model was able to continuously correct the parameters and accurately simulate the future land use with the assistance of data assimilation (Figure 11).
The spatial distribution patterns of LUCF under different scenarios for the Dongting Lake area in 2030 exhibit both commonalities and differences. In terms of commonalities, the distribution patterns of LUCF in the three simulation scenarios in 2030 are basically consistent with the distribution characteristics of the study area in the past 20 years, all presenting a distribution pattern of “the lower the terrain, the stronger the LUCF; the higher the terrain, the gentler the LUCF”, demonstrating that the evolution process of LUCF is path-dependent to a certain degree, with a lagging effect. Owing to the spatial proximity effect of human footprint and the limitations of topography and water sources, the high-conflict areas in the study area could not expand to the low-conflict areas such as hills and mountains but only spread around the existing conflict hot spots to the surrounding weakly conflicting plains and cropland in the vicinity. From a difference perspective, under the natural development scenario, LULC changes were not subject to external interference and constraints, and large amounts of cropland and forest were rapidly converted to building areas in accordance with the historical development trend, with a significant increase in the building area, which resulted in the expansion of high-conflict zones. Compared to the natural development scenario, in the cropland conservation scenario, the chances of conversion of cropland to other land types were reduced, and the conversion of cropland was constrained, which resulted in an increase in the area of cropland by 542.2365 km2. The degree of expansion of building area slowed down despite maintaining its growth trend. This result can be explained by the fact that the amount of basic cropland has been protected by the installation of protection measures; for example, the policy of balancing occupation and replenishment has been effectively carried out, responding to the needs of ecological development. On the contrary, under the ecological conservation scenario, owing to the adoption of forest conservation and adherence to the principle of ecological prioritization, the rate of expansion was effectively controlled, with the area reduced by 164.835 km2, and the region of weak conflict area was significantly enlarged, indicating the relative stability of LULC structure and conflicts under the cropland protection and ecological protection scenarios (Figure 12 and Figure 13). Regardless of the scenario, cropland (especially cropland in the periphery of the city) represents the largest area of land use and the main subject of competition among various interested partied owing to its natural and locational characteristics, such as flat and open topography and suitable climate and hydrological conditions. Therefore, the adoption of cropland protection and ecological protection measures balances the relationship between development and protection, which can not only satisfy the demand for land planning in the Dongting Lake area but also effectively alleviate the degree of LUCF, which is conducive to the realization of sustainable regional socioeconomic development.

5. Discussion

As a result of rapid population growth and urbanization, the LUCF situation is expected to become increasingly serious, representing a major obstacle to sustainable land use in future land planning. The results of our exploration of LUCF in the Dongting Lake area reveal that LUCF varies both spatially and in terms of intensity. Building areas correspond to high-value agglomeration of LUCF, whereas in cropland areas, the phenomenon of escalating LUCF is prevalent [31,32]. Thus, the ecological protection measures issued by the government in recent decades have not only mitigated LUCF but also satisfied the requirement of differentiated land use. Measures such as the “Deepening of the Ecological Protection Compensation System” in response to the statutes of “returning farmland to forest and grassland” and the “theme of high-quality development”, as well as the mechanism of compensating for the ecological protection of cropland, have led to an increased degree of protection of and an increase in the area of water, forest, wetland, cropland, and other important ecological and environmental elements, which has significantly accelerated the process of returning farmland to forests and restoring vegetation cover. LUCF changes are influenced by a complex combination of factors. We also analyzed the factors influencing changes in LUCF in Dongting Lake area during the period of 2000–2020 at the county scale using topographic factors, socioeconomic factors, and climate factors; the influence of these indicators on LUCF was found to be consistent with the results of previous studies [33,34]. In our subsequent study, we argue that the driving mechanisms of LUCF changes should be analyzed in terms of specific ecological issues and in the context of land use planning policies. We also projected the LULC changes under different scenarios for the Dongting Lake area in 2030. Under the natural development scenario, based on the development probabilities for 2000–2015, LULC changes further intensified, mainly in the form of uncontrolled expansion of building and increased occupation of cropland. On the contrary, with the adoption of the strategy of cropland conservation and ecological conservation, the expansion of building slowed down, with ecological land effectively protected and the land use pattern adjusted. Simulating LUCF can provide theoretical and methodological support for the prevention or resolution of land use management [35]. In conclusion, we suggest that a scientific and effective control program be developed based on the territoriality and availability of LULC, weighing the interests of stakeholders in the LULC process in order to control the intensity of LUCF. Supervision and management methods, as well as protection programs, also ought to be formulated, and a comprehensive ecological protection compensation mechanism must be strictly established and implemented to achieve ecological protection and restoration.
The results reported in this paper show that LUCFs are the result of a combination of factors. Moreover, it is impossible to solve LUCFs completely, although the occurrence of conflicts can be slowed to a certain extent, reducing the negative impacts of conflicts. Based on the premise of ensuring the sustainable use of land resources and not affecting the demand for other land types, scientific and rational planning and development can effectively avoid the waste of land resources while promoting the sustainable development of regional land, as well as socioeconomic development. Therefore, in areas with serious LUCF, the speed of urban expansion must be controlled in an orderly and reasonable manner, with a rational plan with respect to the demand for construction land. Secondly, the policy of “balance of arable land” should be strictly enforced with respect to cropland that has already been occupied, and reasonable measures should be taken to return construction land to cropland. Finally, in areas where LUCF is not serious, based on the premise of maintaining the sustainable utilization of land resources, rational development of land for construction should be carried out, avoiding exacerbation of land use conflict problems through measures such as scientific planning and the development of unutilized land.

6. Conclusions

In this study, we analyzed the driving mechanisms of the spatiotemporal evolution of LUCF in the Dongting Lake area and developed the EnKF-PLUS model to simulate future LUCF in 2030. The results reported above demonstrate that the Dongting Lake area generally shows a distribution pattern of high LUCF in the central part and low distribution in the surrounding area from 2000 to 2020. The high-value areas of LUCF are mainly located in zones with high levels of human activities with developed economies and desirable locations, whereas the low-value zones are concentrated in hilly and mountainous areas and regions with little human activity, where forest is the main land use type. Natural, socioeconomic, and topographical factors exhibit regional differences in LUCF changes. The predicted LUCF pattern of Dongting Lake area in 2030 under different scenarios is basically consistent with the distribution characteristics of the last 20 years. Under the natural development scenario, a considerable expansion of building area is observed, whereas under the scenario of cropland conservation and ecological conservation, the expansion of building area is effectively moderated, and the structure of land use and the degree of conflict under the two scenarios are relatively stable and moderate. The results of this study provide a basis and recommendations for the mitigation of LUCF and harmonization of the relationship between economic growth and land use.

Author Contributions

X.A.: conceptualization, methodology, software, formal analysis, project administration, funding acquisition, investigation, writing—original draft, and writing—review and editing; M.Z.: data curation, investigation, funding acquisition, and writing—original draft; Z.Z.: data curation, investigation, funding acquisition, and writing—original draft. All authors have read and agreed to the published version of the manuscript.

Funding

This study was funded by the National Natural Science Foundation of China (41901385) and the Natural Science Foundation of Hunan Province, China (2022JJ40873), and, in part, by the Education Department of Hunan Province, China (21A0177).

Data Availability Statement

Not applicable.

Conflicts of Interest

The authors declare no conflict of interest.

References

  1. Tan, J.; Yu, D.; Li, Q.; Tan, X.; Zhou, W. Spatial Relationship between Land-Use/Land-Cover Change and Land Surface Temperature in the Dongting Lake Area, China. Sci. Rep. 2020, 10, 9245. [Google Scholar] [CrossRef] [PubMed]
  2. Long, X.; Li, X.; Lin, H.; Zhang, M. Mapping the Vegetation Distribution and Dynamics of a Wetland Using Adaptive-Stacking and Google Earth Engine Based on Multi-Source Remote Sensing Data. Int. J. Appl. Earth Obs. Geoinf. 2021, 102, 102453. [Google Scholar] [CrossRef]
  3. An, X.; Jin, W.; Long, X.; Chen, S.; Qi, S.; Zhang, M. Spatial and Temporal Evolution of Carbon Stocks in Dongting Lake Wetlands Based on Remote Sensing Data. Geocarto Int. 2022, 37, 14983–15009. [Google Scholar] [CrossRef]
  4. Geng, M.; Wang, K.; Yang, N.; Li, F.; Zou, Y.; Chen, X.; Deng, Z.; Xie, Y. Evaluation and Variation Trends Analysis of Water Quality in Response to Water Regime Changes in a Typical River-Connected Lake (Dongting Lake), China; Elsevier Ltd.: Amsterdam, The Netherlands, 2021; Volume 268, ISBN 8673184615203. [Google Scholar]
  5. Zhang, M.; Lin, H.; Long, X.; Cai, Y. Analyzing the Spatiotemporal Pattern and Driving Factors of Wetland Vegetation Changes Using 2000–2019 Time-Series Landsat Data. Sci. Total Environ. 2021, 780, 146615. [Google Scholar] [CrossRef]
  6. Yuan, B.; Fu, L.; Zou, Y.; Zhang, S.; Chen, X.; Li, F.; Deng, Z.; Xie, Y. Spatiotemporal Change Detection of Ecological Quality and the Associated Affecting Factors in Dongting Lake Basin, Based on RSEI. J. Clean. Prod. 2021, 302, 126995. [Google Scholar] [CrossRef]
  7. Huang, C.; Huang, X.; Peng, C.; Zhou, Z.; Teng, M.; Wang, P. Land Use/Cover Change in the Three Gorges Reservoir Area, China: Reconciling the Land Use Conflicts between Development and Protection. Catena 2019, 175, 388–399. [Google Scholar] [CrossRef]
  8. Song, S.; He, C.; Liu, Z.; Qi, T. Evaluating the Influences of Urban Expansion on Multiple Ecosystem Services in Drylands. Landsc. Ecol. 2022, 37, 2783–2802. [Google Scholar] [CrossRef]
  9. Msofe, N.K.; Sheng, L.; Lyimo, J. Land Use Change Trends and Their Driving Forces in the Kilombero Valley Floodplain, Southeastern Tanzania. Sustainability 2019, 11, 505. [Google Scholar] [CrossRef]
  10. Zou, L.; Liu, Y.; Wang, Y. Research Progress and Prospect of Land-Use Conflicts in China. Prog. Geogr. 2020, 39, 298–309. [Google Scholar] [CrossRef]
  11. Gallaso, M.I.; Tan, S.; Maria, Q.Y. Urban Land Use Conflict in Expansion Areas of Wolayta Sodo Town, Snnpr, Ethiopia. J. Resour. Dev. Manag. 2019, 52, 1–21. [Google Scholar] [CrossRef]
  12. Zhang, J.; Chen, Y.; Chen, X.; Zhu, C.; Huang, B.; Gan, M. Identification of Potential Land-Use Conflicts between Agricultural and Ecological Space in an Ecologically Fragile Area of Southeastern China. Land 2021, 10, 1011. [Google Scholar] [CrossRef]
  13. Zhao, Y.; Zhao, X.; Huang, X.; Guo, J.; Chen, G. Identifying a Period of Spatial Land Use Conflicts and Their Driving Forces in the Pearl River Delta. Sustainability 2023, 15, 392. [Google Scholar] [CrossRef]
  14. Jiang, S.; Meng, J.; Zhu, L.; Cheng, H. Spatial-Temporal Pattern of Land Use Conflict in China and Its Multilevel Driving Mechanisms. Sci. Total Environ. 2021, 801, 149697. [Google Scholar] [CrossRef]
  15. Meimei, W.; Zizhen, J.; Tengbiao, L.; Yongchun, Y.; Zhuo, J. Analysis on Absolute Conflict and Relative Conflict of Land Use in Xining Metropolitan Area under Different Scenarios in 2030 by PLUS and PFCI. Cities 2023, 137, 104314. [Google Scholar] [CrossRef]
  16. Cai, W.; Wei, Z. Remote Sensing Image Classification Based on a Cross-Attention Mechanism and Graph Convolution. IEEE Geosci. Remote Sens. Lett. 2022, 19, 8002005. [Google Scholar] [CrossRef]
  17. Sohrabi, M.K.; Azgomi, H. A Survey on the Combined Use of Optimization Methods and Game Theory. Arch. Comput. Methods Eng. 2020, 27, 59–80. [Google Scholar] [CrossRef]
  18. Kangas, K.; Brown, G.; Kivinen, M.; Tolvanen, A.; Tuulentie, S.; Karhu, J.; Markovaara-Koivisto, M.; Eilu, P.; Tarvainen, O.; Similä, J.; et al. Land Use Synergies and Conflicts Identification in the Framework of Compatibility Analyses and Spatial Assessment of Ecological, Socio-Cultural and Economic Values. J. Environ. Manag. 2022, 316, 115174. [Google Scholar] [CrossRef] [PubMed]
  19. Lu, T.; Li, C.; Zhou, W.; Liu, Y. Fuzzy Assessment of Ecological Security on the Qinghai–Tibet Plateau Based on Pressure–State–Response Framework. Remote Sens. 2023, 15, 1293. [Google Scholar] [CrossRef]
  20. Lehto, C.; Hedblom, M.; Öckinger, E.; Ranius, T. Landscape Usage by Recreationists Is Shaped by Availability: Insights from a National PPGIS Survey in Sweden. Landsc. Urban Plan. 2022, 227, 104519. [Google Scholar] [CrossRef]
  21. Kacaw, L.; Tsai, B.W. The Application of PPGIS to Telecoupling Research: A Case Study of the Agricultural Landscape Transformation in an Indigenous Village in Taiwan. Sustainability 2023, 15, 1577. [Google Scholar] [CrossRef]
  22. Wang, C.; Huang, S.; Wang, J. Spatio-Temporal Dynamic Evolution and Simulation of Dike-Pond Landscape and Ecosystem Service Value Based on MCE-CA-Markov: A Case Study of Shunde, Foshan. Forests 2022, 13, 1241. [Google Scholar] [CrossRef]
  23. Cabaneros, S.M.S.; Calautit, J.K.S.; Hughes, B. A Review of Artificial Neural Network Models for Ambient Air Pollution Prediction. Environ. Model. Softw. 2019, 119, 1–50. [Google Scholar] [CrossRef]
  24. Huang, D.; Huang, J.; Liu, T. Delimiting Urban Growth Boundaries Using the CLUE-S Model with Village Administrative Boundaries. Land Use Policy 2019, 82, 422–435. [Google Scholar] [CrossRef]
  25. Lin, W.; Sun, Y.; Nijhuis, S.; Wang, Z. Scenario-Based Flood Risk Assessment for Urbanizing Deltas Using Future Land-Use Simulation (FLUS): Guangzhou Metropolitan Area as a Case Study. Sci. Total Environ. 2020, 739, 139899. [Google Scholar] [CrossRef] [PubMed]
  26. Liang, X.; Guan, Q.; Clarke, K.C.; Liu, S.; Wang, B.; Yao, Y. Understanding the Drivers of Sustainable Land Expansion Using a Patch-Generating Land Use Simulation (PLUS) Model: A Case Study in Wuhan, China. Comput. Environ. Urban Syst. 2021, 85, 101569. [Google Scholar] [CrossRef]
  27. Xu, L.; Abbaszadeh, P.; Moradkhani, H.; Chen, N.; Zhang, X. Continental Drought Monitoring Using Satellite Soil Moisture, Data Assimilation and an Integrated Drought Index. Remote Sens. Environ. 2020, 250, 112028. [Google Scholar] [CrossRef]
  28. Li, P.; Zha, Y.; Shi, L.; Tso, C.H.M.; Zhang, Y.; Zeng, W. Comparison of the Use of a Physical-Based Model with Data Assimilation and Machine Learning Methods for Simulating Soil Water Dynamics. J. Hydrol. 2020, 584, 124692. [Google Scholar] [CrossRef]
  29. Cheng, S.; Prentice, I.C.; Huang, Y.; Jin, Y.; Guo, Y.K.; Arcucci, R. Data-Driven Surrogate Model with Latent Data Assimilation: Application to Wildfire Forecasting. J. Comput. Phys. 2022, 464, 111302. [Google Scholar] [CrossRef]
  30. Zhang, G.; Zhou, H.; Wang, C.; Xue, H.; Wang, J.; Wan, H. Time Series High-Resolution Land Surface Albedo Estimation Based on the Ensemble Kalman Filter Algorithm. Remote Sens. 2019, 11, 753. [Google Scholar] [CrossRef]
  31. Ma, W.; Jiang, G.; Chen, Y.; Qu, Y.; Zhou, T.; Li, W. How Feasible Is Regional Integration for Reconciling Land Use Conflicts across the Urban–Rural Interface? Evidence from Beijing–Tianjin–Hebei Metropolitan Region in China. Land Use Policy 2020, 92, 104433. [Google Scholar] [CrossRef]
  32. Wang, L.; Zheng, W.; Tang, L.; Zhang, S.; Liu, Y.; Ke, X. Spatial Optimization of Urban Land and Cropland Based on Land Production Capacity to Balance Cropland Protection and Ecological Conservation. J. Environ. Manag. 2021, 285, 112054. [Google Scholar] [CrossRef] [PubMed]
  33. Zou, L.; Liu, Y.; Wang, J.; Yang, Y.; Wang, Y. Land Use Conflict Identification and Sustainable Development Scenario Simulation on China’s Southeast Coast. J. Clean. Prod. 2019, 238, 117899. [Google Scholar] [CrossRef]
  34. Froese, R.; Schilling, J. The Nexus of Climate Change, Land Use, and Conflicts. Curr. Clim. Change Reports 2019, 5, 24–35. [Google Scholar] [CrossRef]
  35. Li, J.; Ouyang, X.; Zhu, X. Land Space Simulation of Urban Agglomerations from the Perspective of the Symbiosis of Urban Development and Ecological Protection: A Case Study of Changsha-Zhuzhou-Xiangtan Urban Agglomeration. Ecol. Indic. 2021, 126, 107669. [Google Scholar] [CrossRef]
Figure 1. Location of the study area.
Remotesensing 15 04524 g001
Figure 2. Spatial distribution of driving factors.
Remotesensing 15 04524 g002
Figure 3. General structure of the research method.
Remotesensing 15 04524 g003
Figure 4. Classification of land use maps from 2000 to 2020.
Remotesensing 15 04524 g004
Figure 5. The framework of the EnKF-PLUS model.
Remotesensing 15 04524 g005
Figure 6. Percentage of area of different land use types (2000–2020).
Remotesensing 15 04524 g006
Figure 7. Spatial distribution of LUCFs in Dongting Lake in 2000–2020.
Remotesensing 15 04524 g007
Figure 8. Land use conflict indices for different land use types (a) and overall trends (b).
Remotesensing 15 04524 g008
Figure 9. Distribution of drivers of spatial changes in land use conflicts based on dynamic factors.
Remotesensing 15 04524 g009
Figure 10. Distribution of drivers of spatial changes in land use conflicts based on static factors (2000–2020).
Remotesensing 15 04524 g010
Figure 11. Accuracy comparison of different models (a,b) were localized maps of the Dongting Lake area.
Remotesensing 15 04524 g011
Figure 12. Spatial distribution of land use and area of land use types under different scenarios in 2030.
Remotesensing 15 04524 g012
Figure 13. Spatial LUCF under different scenarios in 2030.
Remotesensing 15 04524 g013
Table 1. Calculation of landscape pattern index.
Index NameCalculation FormulaVariable Meaning
Complexity Index C I = A W M P F D = i = 1 m j = 1 n 2 ln ( 0.25 P i j ) ln ( a i j ) a i j A Pij refers to the perimeter of the patch, aij is the area of the patch, A denotes the total area of the landscape, m is the total number of evaluation units in the study area, and n is the number of land use types.
Vulnerability Index V I = i = 1 n V i × a i S ( n = 7 ) Fi denotes the vulnerability index of each land type, calculated with reference to the literature; ai refers to the area with land use type classification; S is the total area; and n is the total number of land use types.
Stability Index S I = n i A ni is the number of patches of spatial type i in each spatial unit, and A denotes the area of each spatial unit.
Disclaimer/Publisher’s Note: The statements, opinions and data contained in all publications are solely those of the individual author(s) and contributor(s) and not of MDPI and/or the editor(s). MDPI and/or the editor(s) disclaim responsibility for any injury to people or property resulting from any ideas, methods, instructions or products referred to in the content.

