Technical Note

Automatic Identification of Earth Rock Embankment Piping Hazards in Small and Medium Rivers Based on UAV Thermal Infrared and Visible Images

1
National Institute of Natural Hazards, Ministry of Emergency Management of the People’s Republic of China, Beijing 100085, China
2
Key Laboratory of Compound and Chained Natural Hazards Dynamics, Ministry of Emergency Management of China, Beijing 100085, China
3
School of Geo-Science and Technology, Zhengzhou University, Zhengzhou 450001, China
4
College of Surveying and Geo-Informatics, North China University of Water Resources and Electric Power, Zhengzhou 450046, China
5
Hydraulics and Geotechnics Section, KU Leuven, Kasteelpark Arenberg 40, BE-3001 Leuven, Belgium
*
Author to whom correspondence should be addressed.
Remote Sens. 2023, 15(18), 4492; https://doi.org/10.3390/rs15184492
Submission received: 10 July 2023 / Revised: 29 August 2023 / Accepted: 3 September 2023 / Published: 12 September 2023
(This article belongs to the Special Issue Remote Sensing Applications in Flood Forecasting and Monitoring)

Abstract

:
Piping is a major factor contributing to river embankment breaches, particularly during flood season in small and medium rivers. To reduce the costs of earth rock embankment inspections, avoid the need for human inspectors and enable the quick and widespread detection of piping hazards, a UAV image-acquisition function was introduced in this study. Through the collection and analysis of thermal infrared and visible (TIR & V) images from several piping field simulation experiments, temperature increases, and diffusion centered on the piping point were discovered, so an automatic algorithm for piping identification was developed to capture this phenomenon. To verify the identification capabilities, the automatic identification algorithm was applied to detect potential piping hazards during the 2022 flooding of the Dingjialiu River, Liaoning, China. The algorithm successfully identified all five piping hazard locations, demonstrating its potential for detecting embankment piping.

1. Introduction

Based on river statistics, more than 420,000 small and medium rivers exist worldwide, with drainage areas ranging from 200 to 3000 km2, constituting approximately 49% of the total [1,2,3]. In China, these rivers account for 47% of all rivers, covering more than 85% of major urban areas and vast rural areas. Compared with big rivers, 2/3 of small and medium rivers do not yet meet the national flood control standards due to the lack of systematic reinforcement [4,5]. Dangerous situations such as piping, leakage, and soaking out frequently occur during flood season [6,7], which pose serious threats to the lives and property of local people and considerably restrict the sustainable development of the regional economy and society [8,9]. Embankment hazard inspection is important to avoid breaks in small and medium rivers [10]. The primary traditional inspection method necessitates manual labor (Figure 1). However, manual inspection is not only costly and inefficient but also increasingly challenging to sustain with China’s aging population and the growing migrant workforce [11,12]. Therefore, novel technical means as a substitute for manual inspection must be introduced and refined.
Among the many embankment hazards, piping is the most serious that leads to embankment breaks, so it is the most important hazard to detect during embankment inspections [13]. In recent years, researchers have proposed a variety of new methods for piping detection based on new equipment and platforms, including UAVs, robot dogs, manned vehicles, and ground monitoring equipment [14,15,16]. Xu (2019) et al. integrated ground-penetrating radar, originally used for geological environmental investigation, onto a manned measurement vehicle [17,18]. The vehicle vertically emits high-frequency electromagnetic pulse waves (20–40 m) downward from the top of the embankment. Image analysis determines the specific range of factors that induce pipe blockage, such as water leakage and pest infestation. This method can detect long-distance danger along the embankment, but the disadvantage is that the vehicle equipment is so large that it may cause congestion on the road. Chai et al. (2022) developed a bionic robot dog for emergency disposal [19], and this equipment has already been used for embankment danger inspections. This equipment effectively avoids the need for on-site inspectors to identify piping hazards, but the robot dog’s inspection range is limited to its command module. Jiang (2016) et al. integrated magnetotelluric technology equipment onto a tripod, which emitted radio frequency electromagnetic waves (0–50 m) underground in the area outside the embankment slope to capture the impedance of underground substances and explore the channel where piping hazards occur [20,21]. This method can accurately detect piping hazards and has considerable application prospects. However, due to the long monitoring time and small coverage area, it cannot be widely promoted. Compared with the above-described methods, UAV platforms are characterized by small size, lightweight and low cost [22,23]. UAVs can be equipped with visible light and thermal infrared detection equipment and perform near-real-time data transmission and processing, enabling rapid and large-scale inspection of embankment hazards.
Suppose a UAV is compared with the body of an embankment inspector. In that case, the thermal infrared and visible (TIR & V) cameras are equivalent to their eyes and limbs, and the applied intelligent identification algorithm is equivalent to the brain. The algorithm uses the image data collected by the UAV to investigate and determine the piping hazard situation. At present, the intelligent methods of identifying piping can be roughly divided into two types [6,24]: image identification technology based on machine learning, in which a piping identification model is constructed for danger discrimination through a large number of training and labeled samples, and image segmentation methods based on thermal imaging principles and the maximum interclass variance method. The application of the first type of method is limited by the lack of both the in-depth mining of the characteristics of piping mechanisms and a massive real sample library; the second type of method is restricted by the identification algorithm being unable to overcome the interference caused by various weather conditions and the complex ground object background during the identification of piping [25,26].
Given the above problems, a new target identification method for piping was developed in this study. This method integrates TIR & V images to capture the temperature and optical information of ground objects. The variations in the piping’s temperature field were investigated through field physics experiments utilizing a UAV equipped with a TIR & V load for rapid image acquisition. The developed identification algorithm was analyzed with small sample size, complex ground object background, and under multiple weather conditions. This study aimed to effectively address the issues of inadequate human resources, outdated detection methods, and low identification accuracy in inspecting medium and small river embankments. This approach will considerably enhance the emergency response capabilities for small and medium river embankments while providing timely and effective scientific and technological support for relevant departments to make informed decisions during emergencies. The remainder of this article is organized as follows: Section 2 briefly introduces the framework of automatic identification of earth rock embankment piping hazards and describes the developed method for identifying piping. Section 3 presents our key findings and analysis, focusing on field simulation experiments and field tests. Finally, Section 4 offers a discussion, conclusions, and future advances associated with this field.

2. Framework and Methods

2.1. Framework

To automatically identify piping outlets of earth rock embankment, the process shown in Figure 2 was adopted in this study. First, we designed a simulation experiment that could simulate the piping process in a natural environment. Then, we used this experiment to collect sufficient TIR & V images that contained multiple scenarios. Next, we analyzed the features of piping in these scenarios. Secondly, we trained a processing method for TIR & V images according to the piping features, and we developed an algorithm that can automatically identify areas with suspected piping from the superimposed images. Finally, we integrated the data processing function and automatically identification algorithms into an embankment inspection software system and deployed it on a UAV and ground station. The system provides real-time data transmission, hazard identification, and piping alarms to the emergency management department.

2.2. TIR & V-Images-Based Technical Route of Earth Rock Embankment Piping Identification

According to field experiment data, the thermal infrared images of piping hazards exhibit a temperature characteristic indicative of diffusion. The direction and extent of piping diffusion are influenced by the topographical conditions in which it occurs. In visible images, ground objects such as cultivated land, grassland, water bodies, forests, puddles, sandy terrain, residential structures, and roads are observed near piping locations. The complex background of these objects may hinder the identification of piping hazards [27]. The sole use of visible or thermal infrared images is constrained by the former’s unavailability during night-time and, with the latter, feature types cannot be differentiated [6,24,25]. Therefore, our study primarily relied on thermal infrared images with the supplementary use of visible images. The algorithm involves several key steps, including the determination of the reference temperature for each thermal infrared image, automatic interpretation of visible images, registration of TIR & V images, overlay analysis based on temperature diffusion effects, and filtering according to land-use types and terrain information. The specific technical process is shown in Figure 3.

2.3. Identification Method

2.3.1. Random Forest Classification of Visible Images

Random forest (RF) is an ensemble learning-based machine learning algorithm proposed by Breiman in 2001, which has been widely used for image classification tasks [28,29]. This study introduced the RF method to classify visible images captured by a UAV to minimize the influence caused by complex ground object backgrounds, assist with thermal infrared image identification, and filter out misjudged areas. Under normal circumstances, the study area could be divided into grassland, water, road, land, paddy fields, etc.

2.3.2. Determination of Reference Temperature of Ground Objects in Thermal Infrared Images

The temperature field of thermal infrared images displays varying colors for different ground objects, which is attributed to their distinct heat radiation absorption capacities [30,31,32]. However, a reference temperature needed to be determined for each image to avoid the impact of false color rendering. Under normal circumstances, the water temperature at the piping outlet in thermal infrared images is lower than that of the surrounding ground objects, but abnormal temperatures may be generated during image acquisition, storage, and data transmission [33]. To avoid interference by abnormal temperatures in the judgment of the temperature of a piping area, the Δ T i , j (temperature differences) of the adjacent pixels was calculated by using Formula (1), stipulating that T i , j should not exceed 10 °C.
T i , j = a b s ( T i , j + 1 T i , j )
To find a suitable reference temperature for each image, we selected the median of the lowest value of all rows and columns from the thermal infrared image matrix. Then, we computed their average as the reference temperature (Formula (2)). The pixels with temperatures below a certain threshold of the reference temperature were classified as suspected piping outlets, and the area consisting of these pixels was recorded as a level 1 suspected piping area. The calculation method is shown in Formula (3).
min = T 1,1 T 1,2 T 1 , n T 2,1 T 2,2 T 2 , n T m , 1 T m , 2 T m , n
T i , j < = T m i n + T t h r e s h o l d
Here, T threshold represents the temperature threshold.

2.3.3. Registration and Automatic Identifications

Due to the large radiation, shape, and texture gaps between TIR & V images, achieving good registration using traditional methods, such as area-based and unsupervised machine learning, is difficult [34]. The area-based approach fails to achieve location accuracy and robustness simultaneously, whereas the machine-learning-based method requires excessive computation [35,36,37]. To solve these problems, we referred to Meng et al. (2022), who used the template matching with weights, multilevel local max-pooling and max index backtracking (TWMM) method to register the TIR & V images taken by the UAV equipped with a TIR & V sensor [38]. As a result, the correct matching rate for 1000 image groups was 96%.
After obtaining the registered TIR & V images, they were superimposed for analysis, and the suspected piping areas above non-piping areas, such as houses and roads, were disregarded. However, multiple piping areas may exist in a superimposed image. We further divided the superimposed image into 4*4 blocks and determined whether real piping existed in each block separately. Using the temperature diffusion identification algorithm (Formulas (4)–(7)) in each block, we set the suspected piping outlets of this block in the superimposed image as the center of the piping with coordinates [I, j]. The pixels within a radius of 5 constitute the inner ring, the rings within a radius of 5 to 10 constitute the middle ring, and within a radius of 10 to 15, they constitute the outer ring.
Δ T = T o u t s i d e T i n s i d e
T i n s i d e = y = 5 5 x = 5 5 T i + x , j + y 25
T m i d d l e = y = 10 10 x = 10 10 T i + x , j + y y = 5 5 x = 5 5 T i + x , j + y 75
T o u t s i d e = y = 15 15 x = 15 15 T i + x , j + y y = 10 10 x = 10 10 T i + x , j + y 125

2.4. Evaluation Metrics for Piping Image Identification

The Confusion Matrix (Figure 4) is a fundamental visualization tool for evaluating image accuracy [39,40]. It provides more advanced classification metrics, such as accuracy, precision, and recall rate [41]. These can be calculated using the corresponding formulas:
(1)
Confusion Matrix
Each column in the confusion matrix represents a predicted class; its sum indicates the number of data points for that class. Each row represents the actual data class, with the total number of instances indicating its quantity. The images within each column denote the count of correctly predicted data for that particular class.
Here, TP is true positive, which refers to the number of positive classes predicted as positive; TN is true negative, which refers to the number of negative classes predicted as the negative classes; FP is false positive, which refers to the number of negative classes predicted as the positive classes; and FN is false negative, which refers to the number of positive classes predicted as the negative classes.
(2)
Accuracy
The accuracy rate serves as a metric for the performance of the identification algorithm, indicating the number of correctly recognized samples out of the total.
A c c u r a c y = ( T P + T N ) / ( T P + F N + F P + T N )
(3)
Precision
The precision rate represents the proportion of samples that are truly positive among the samples recognized as the positive class by the identification algorithm.
P r e c i s i o n = T P / ( T P + F P )
(4)
Recall
The recall rate denotes the proportion of positive samples correctly identified by the identification algorithm to the total number of positive samples.
R e c a l l = T P / ( T P + F N )

3. Results and Analysis

This section presents the results of field experiments involving UAV detection and an analysis of the characteristics of piping based on TIR & V data. The proposed identification algorithm was verified regarding practicability and generalization performance in real piping situations.

3.1. Field Simulation Experiment

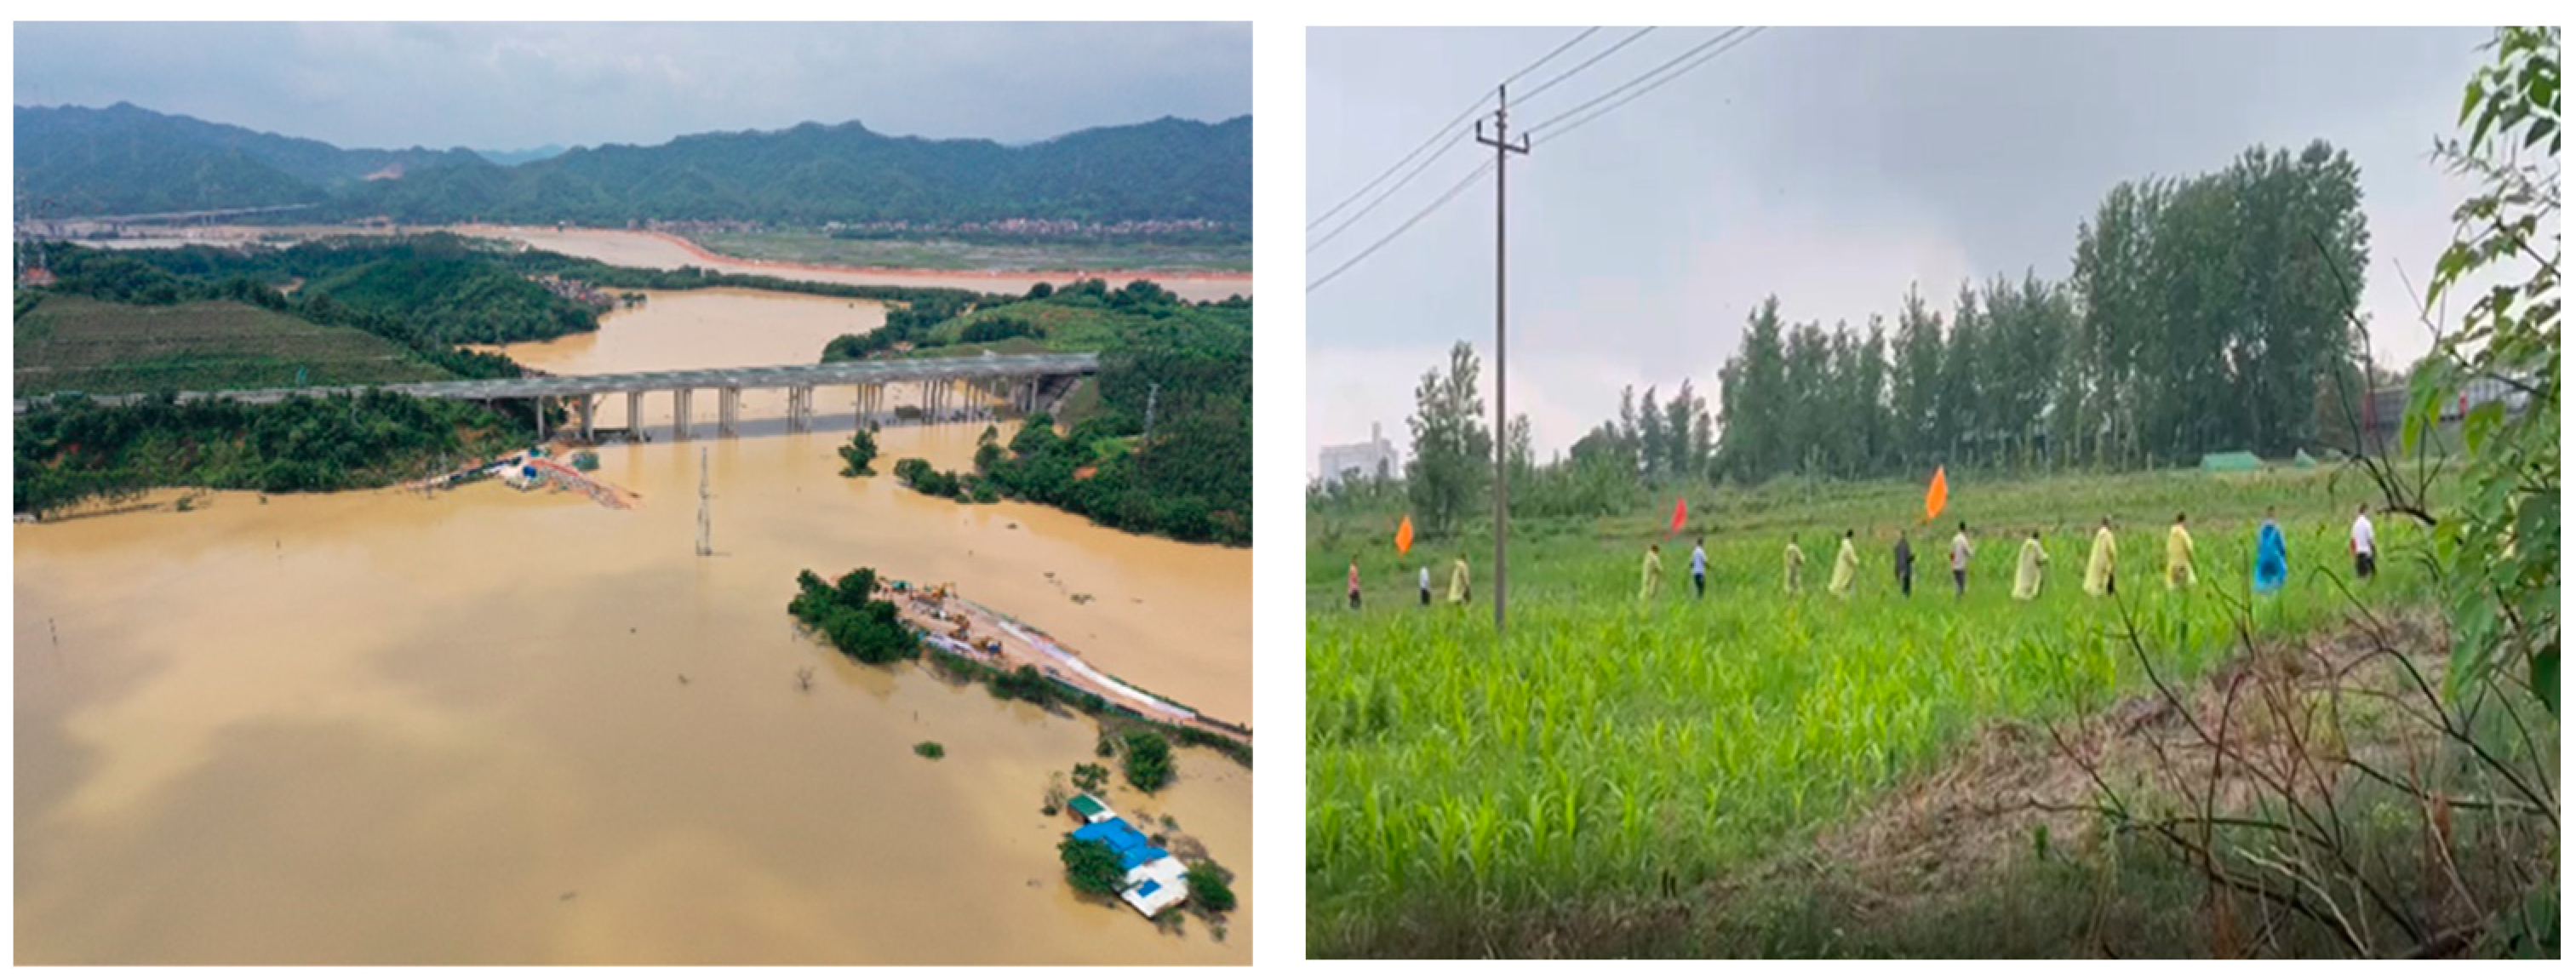
3.1.1. Piping Simulation Experiment Preparation and Data Acquisition

Most previous studies on piping have focused on simulating its dynamic development process, but the results of field investigations have revealed that the manual exploration of piping is primarily based on low-temperature considerations [42,43]. Artificial piping field simulation experiments were conducted in Dongsha River, Beijing, in May 2022 to study the characteristics of piping, building upon the experimental findings of Yao et al. (2014) and Su et al. (2022) [25,44]. The experimental equipment shown in Figure 5 included submersible pumps, a water hose, gasoline generators, and a thermometer. The UAV used for this experiment, and subsequent tests was a DJI M300 industrial-grade version (Figure 6), which integrated a Zenmuse high-definition visible sensor and a coin612 GUIDE infrared thermal sensor. The specific product parameters of the visible and infrared thermal sensors are shown in Table 1 and Table 2, respectively.
Powered by the gasoline generator, shallow water (from 0.3 m under the river surface) was pumped out from the channel and carried by a 40 mm diameter water conveyor belt over the earth rock embankment to the mouth of the pipe (Figure 7). During the experiment, temperature readings were recorded at both the piping outlet and ground surface features using a thermometer. To ensure optimal image quality, the UAV utilized a hovering and vertical acquisition method at a flight altitude of 30–120 m.

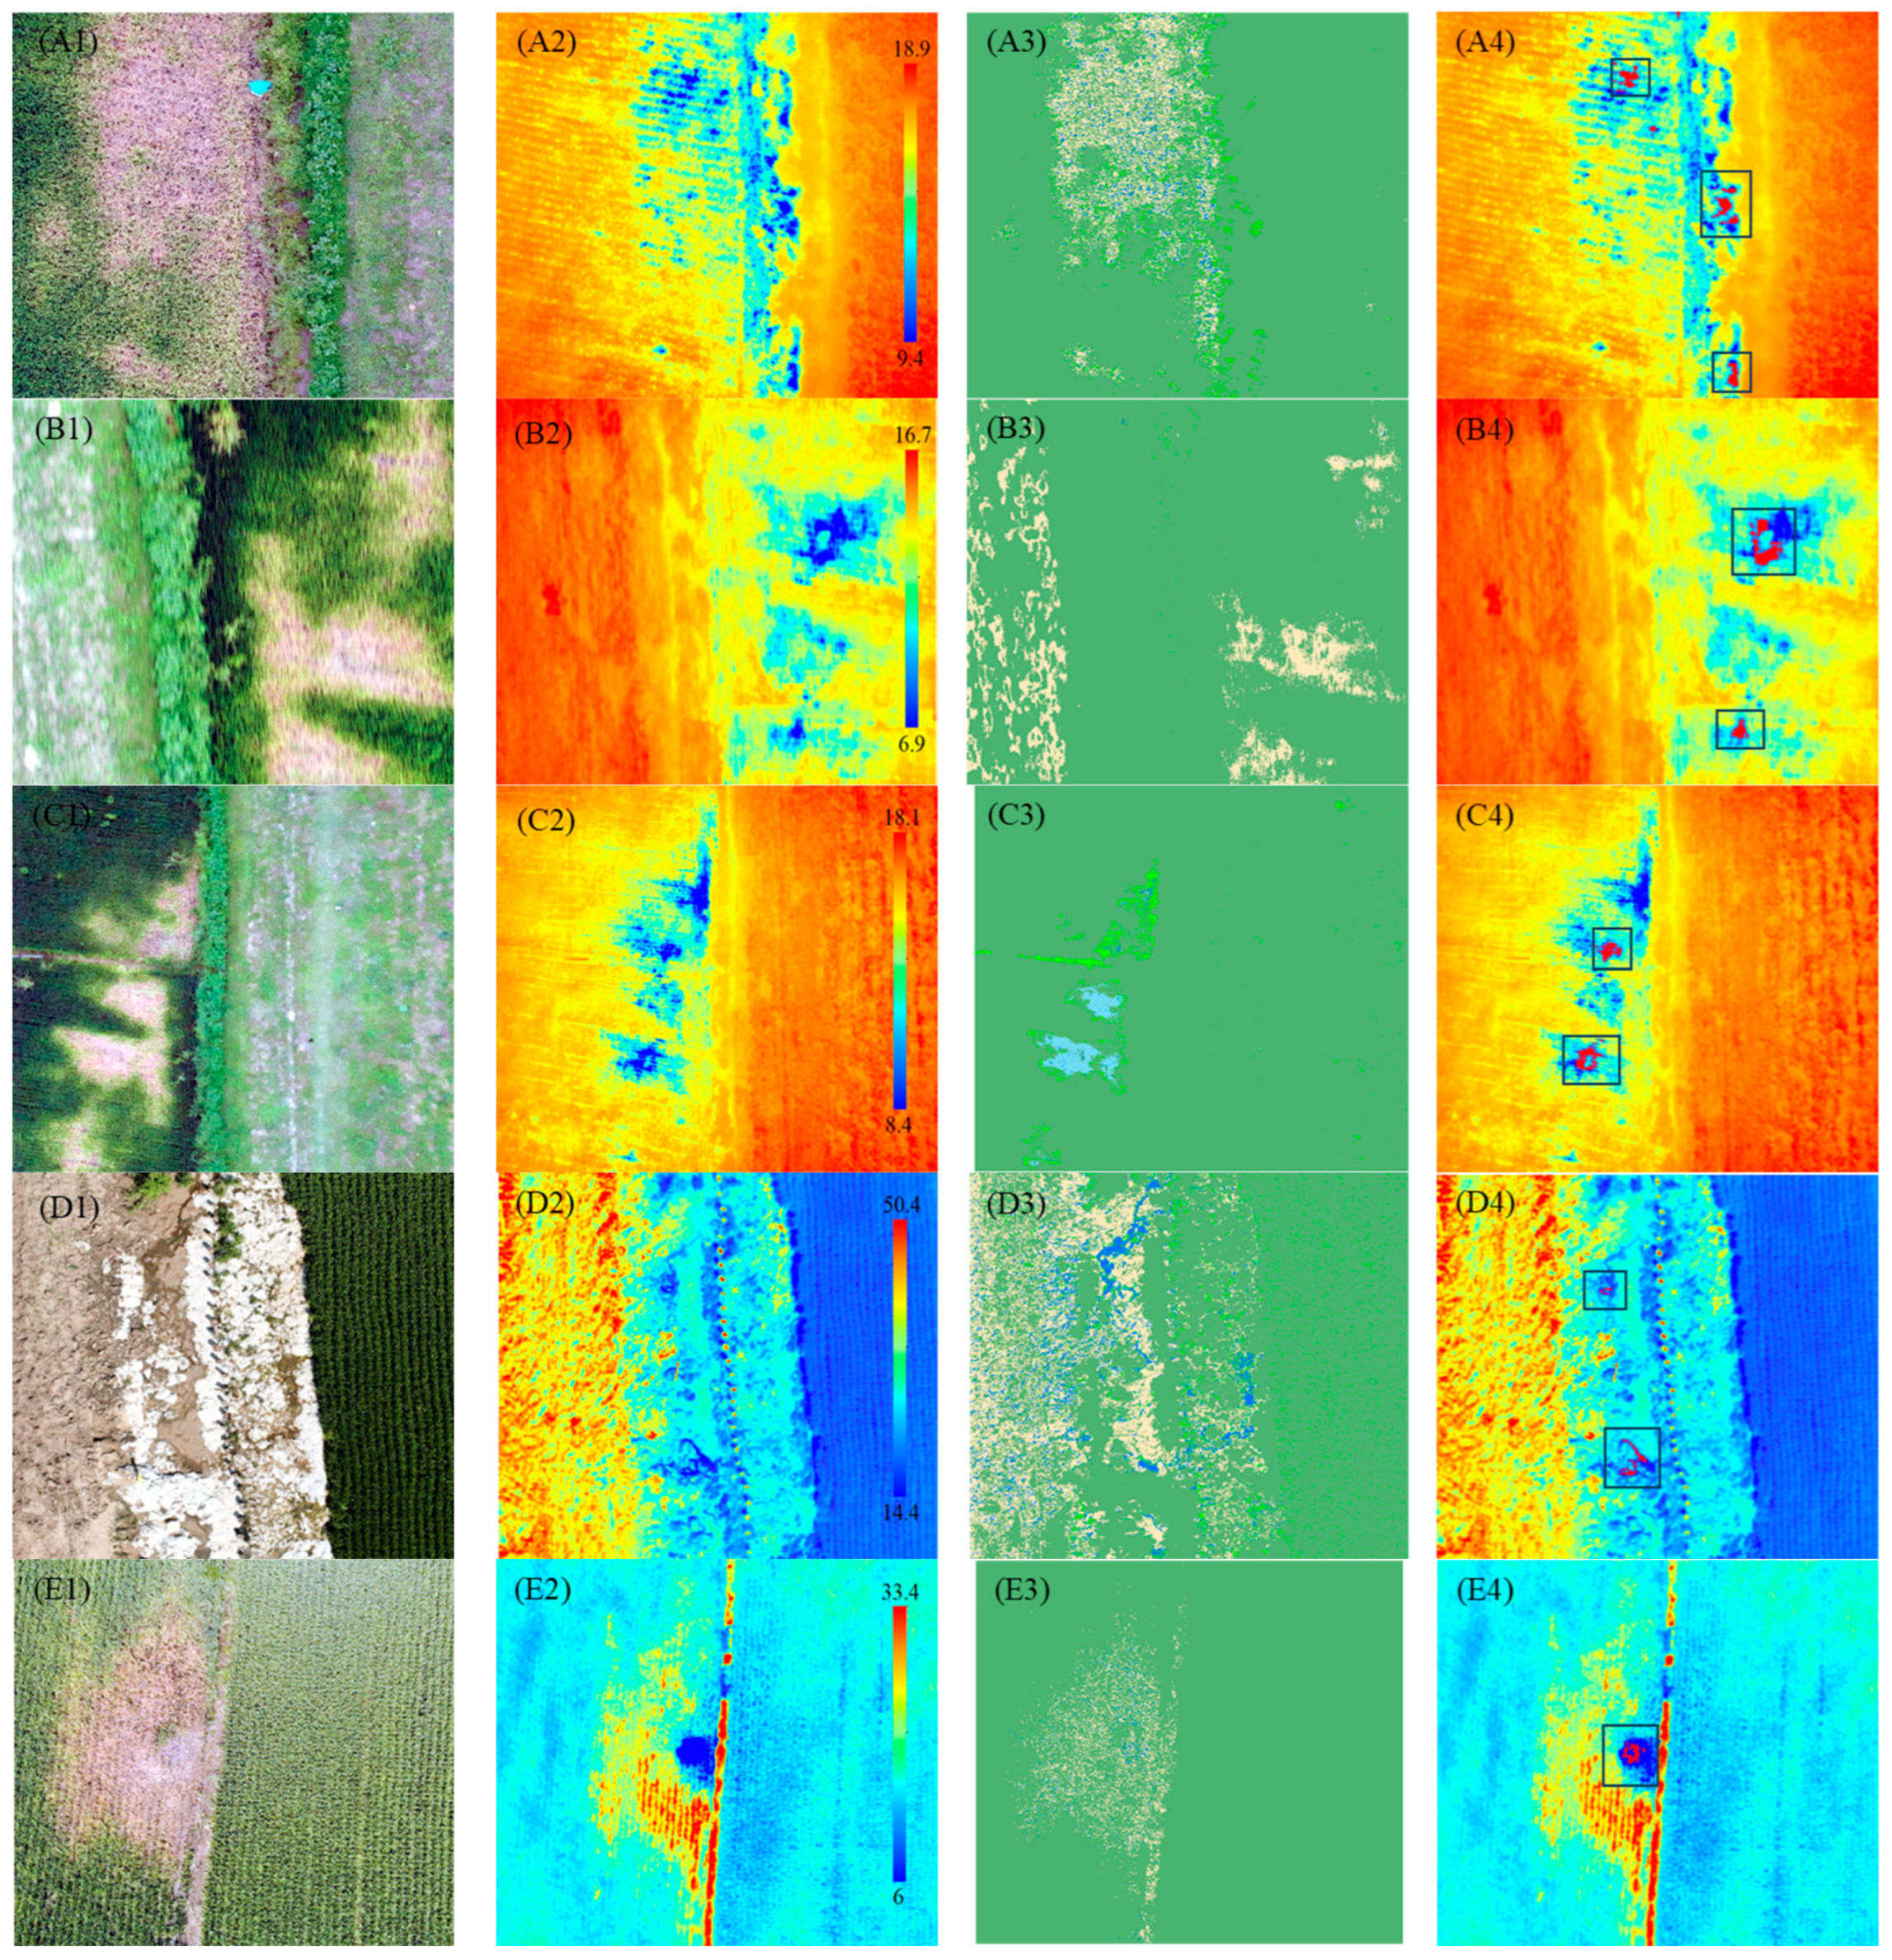
3.1.2. Analysis of Characteristics of Piping Temperature Field and Classification Images

The temperature field images of the piping outlets and their corresponding visible images are presented in Figure 8, with case A captured at 11:30 a.m. on a sunny day and case B captured at 16:00 p.m. after some rain at the same location. During data acquisition, the air temperature during the detection period was approximately 33 °C in case A and 31 °C in case B; the river temperature was steady at 25 and 24 °C, respectively. By examining the temperature fields in both images, we observed a phenomenon of increasing diffusion toward the periphery from the center of the piping image. As this diffusion distance increased, water flowing out of the piping outlet gradually approached the temperature of surrounding ground objects. Furthermore, this temperature diffusion had the potential to propagate throughout the plane and also exhibited directional propagation in response to changes in terrain. Additionally, the temperature diffusion occurred in shaded areas of trees, puddles, and regions with temperature anomalies. Based on these findings, a temperature diffusion identification algorithm was designed.

3.2. Field Test

To validate the temperature diffusion observed in the artificial simulation experiments in earth rock embankment piping hazards and to assess the effectiveness of the automatic identification algorithm, field piping tests were conducted in Panjin, Liaoning Province, China. In July 2022, the accumulated precipitation in the northern part of Panjin, Liaoning Province, reached 503.6~664.0 mm, which was substantially higher than received by most of the other areas in Liaoning and several days of precipitation resulted in the water level of both the Raoyang River and its main tributary, Dingjialiu River, surpassing the safe water level of 0.08 m. In this particular case, the embankment located in the section between the Lianhe and Dingjialiu River Bridges (3.7 km) of Dingjialiu River in Panjin City, Liaoning, was selected for a piping field test during the high-water period. Before conducting a UAV inspection on this section of the embankment, the local government organized a preliminary manual inspection by selected villagers. The precise locations of potential piping hazards were unknown before the UAV inspection.

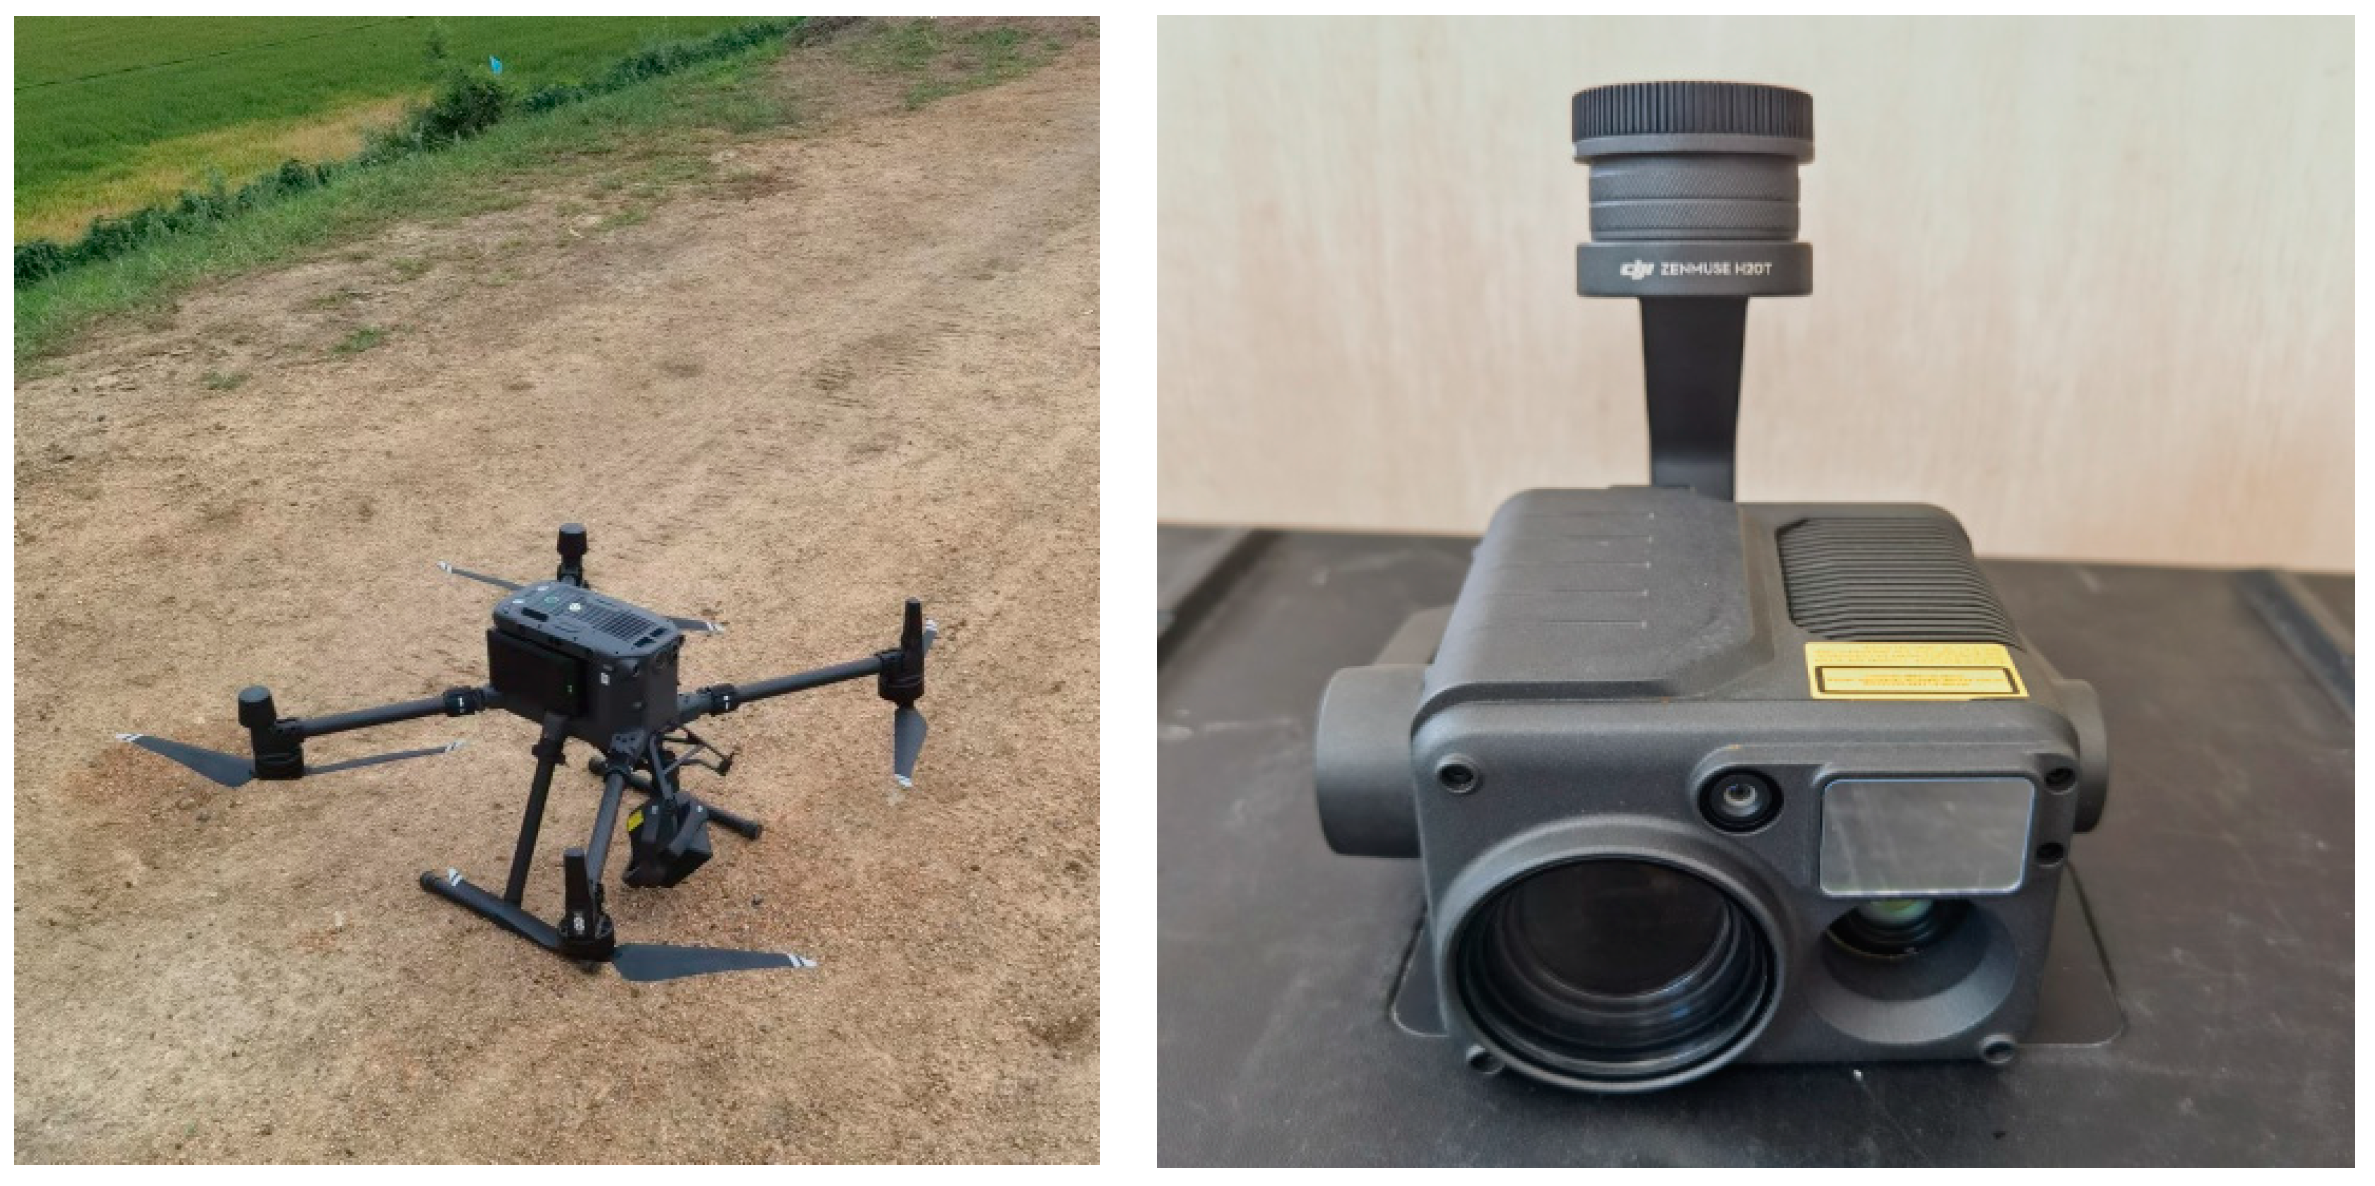
3.2.1. UAV Data Acquisition and Preprocessing

The water level in the Dingjialiu River is usually as high as the embankment toe during dry seasons, but it rose 1–2 m above this level during the flood season in August 2022. To prevent embankment failure, the local government organized villagers to conduct several hazard investigations in the vicinity of the embankment. Additionally, the UAV, TIR & V sensor equipment and automatic identification algorithm configured in the ground station were used for data acquisition and identification. The height of the embankment from top to toe was approximately 7 m. The wires near it did not exceed a height of 20 m, to ensure safety during flight operations with a maximum endurance time of 45 min, The UAV flight altitude was maintained at 30m above the embankment, and its flight distance was limited to below 10 km for a round-trip flight. In addition, the overlap rate exceeded 40% in the vertical view along the toe of the embankment.
The field tests were conducted along the embankment on sunny and rainy days, covering an inspection distance of 7.4 km and generating 416 groups of TIR & V data (Table 3). The images were transmitted to the ground station via near-real-time transmission and processed and identified in real-time, which took 37 min, slightly longer than UAV data acquisition. Based on the preprocessing method described in Section 2.3, the visible images were automatically interpreted (Figure 9), and the reference temperatures of the thermal infrared images were determined, subsequently leading to the determination of level 1 suspected piping areas. After registering and overlaying the TIR & V images (Figure 10), the temperature diffusion effect method was utilized to obtain the level 2 suspected piping area.

3.2.2. Identification and Analysis of Field Test Results for Piping Hazards

The UAV inspection process for two complete flights of the embankment is presented in rows 1 and 2 in Table 3; the original visible images (A1) to (E1), original thermal infrared images (A2) to (E2), the classification results (A3) to (E3). The identification results (A4) to (E4) are shown in Figure 11. After automatic interpretation, registration, overlay analysis, identification, and filtering of 416 TIR & V images per flight, we discovered that piping phenomena were present in 10 groups (Table 3), with 5 of these groups featuring the same piping location. This indicated that the automatic identification algorithm recognized five suspected piping areas where the hazards occurred from the images. To verify the identification results, we collaborated with inspectors to manually inspect the five suspected areas based on their coordinates. After a thorough investigation, we confirmed that these five suspected piping areas were genuine pipings. Among them, four (Figure 11A–D) areas were already manually flagged during the previous inspection, whereas the remaining one (Figure 11E) was a piping area newly identified by the automatic identification algorithm.
These identification tests achieved no omissions in detecting piping hazards, with a 100% recall rate identified under sunny and rainy conditions. The accuracy of the tests exceeded 97%, although the precision rate was slightly low.

4. Discussion and Conclusions

4.1. Discussion on Uncertainty of Test Results

The uncertainty of the piping identification results primarily stems from three factors. First, the acquisition process introduces variability due to parameters such as the UAV flight altitude and speed. Second, complex background objects with varying reflectance properties under solar radiation pose challenges in distinguishing different ground object types. Lastly, diverse weather conditions impact image quality: insufficient lighting may result in difficulties with image identification. Considering the aforementioned factors, comparative tests were conducted with set cruising and hovering (speed = 0) image acquisition modes with a maximum flight altitude of 120 m for civil aircraft. The tests were conducted under varying weather conditions, including sunny, cloudy, and light rain (Table 3).
During UAV cruise photography, all piping hazards were accurately identified under weather conditions, including sunny, cloudy, or drizzly, when the flight speed was below 11m/s. However, identification precision was compromised under cloudy and drizzly conditions, which implies the existence of instances where non-piping images are mistakenly identified as piping images. In the extreme case, a flight velocity of 15 m/s was employed to identify pre-existing piping hazards. Under optimal lighting conditions, the image quality remains satisfactory until the flight altitude exceeds 110 m; however, under suboptimal conditions, image quality noticeably deteriorates beyond 60 m, resulting in overall decreases in identification accuracy, precision, and recall rate.
During hovering photography, the detailed impact of each 10-m increase in flight altitude on UAV image identification is described in rows 6–8 in Table 3 and Table 4. Although the identification algorithm demonstrates favorable applicability, at a flight height of 120 m, the ground sampling distance (GSD) decreased to only 87 pixels per square meter based on the formula GSD = aH/f, where f is the focal length, and a is the pixel size. The available data were insufficient to fully support the identification of temperature diffusion effects (≤225 pixels). Therefore, we do not recommend conducting detection at heights exceeding 70 m in hovering photography mode.
In summary, the accuracy of this identification algorithm is strongly impacted by adverse weather conditions, such as rainfall, as well as flight parameters exceeding 70 m in altitude and 11 m/s in speed.

4.2. Conclusions and Future Work

We studied technology for automatically identifying piping hazards in earth rock embankments based on TIR & V images captured by UAVs along small and medium rivers. Through piping field simulation experiments, temperature increase and diffusion centered on the piping point were discovered, and an automatic algorithm for piping identification was developed to capture this phenomenon. The algorithm was integrated with a UAV to achieve efficient identification of piping hazards over a wide area, which was successfully implemented and validated in Panjin, Liaoning Province, China, in August 2022. When the lighting conditions were optimal, with a flight altitude not exceeding 70 m and a speed less than 11 m/s, the accuracy of cruise recognition surpassed 97.6%.
However, data classification and identification may be seriously affected by variable weather conditions, complex ground objects, and the settings of UAV acquisition modes. Therefore, a set of standards suitable for UAV data acquisition and identification in embankment scenarios must be determined. Moreover, electromagnetic radiation and noise interference can impact the image quality and temperature sensing accuracy of TIR & V sensors, decreasing identification accuracy. In the subsequent stage, more monitoring equipment should be introduced to quantitatively analyze the impact of each influencing factor. Furthermore, further data acquisition and testing are essential for continuously enhancing the technology’s capability to aid in natural disaster emergency detection.

Author Contributions

Conceptualization, R.L. and Z.W.; methodology, R.L. and S.Z.; software, R.L., S.Z. and J.L.; validation, R.L. and Y.L.; formal analysis, R.L., Z.W. and H.S.; investigation, R.L., H.S. and Y.L.; resources, H.S. and J.L.; data curation, R.L.; writing—original draft preparation, R.L.; writing—review and editing, R.L. and H.S.; visualization, R.L., Z.W. and S.Z.; supervision, Z.W. and H.S.; project administration, Z.W. and H.S.; funding acquisition, Z.W. and H.S. All authors have read and agreed to the published version of the manuscript.

Funding

This research was funded by the National Key Research and Development Project, grant number 2021YFB3901203.

Data Availability Statement

The data used in this paper belong to the National Institute of Natural Hazards, Ministry of Emergency Management of the People’s Republic of China and can be made available upon request to the authors.

Conflicts of Interest

The authors declare that they have no known competing financial interest or personal relationships that could have appeared to influence the work reported in this paper.

References

  1. Lehner, B.; Grill, G. Global river hydrography and network routing: Baseline data and new approaches to study the world’s large river systems. Hydrol. Process. 2013, 27, 2171–2186. [Google Scholar] [CrossRef]
  2. Su, Y.; Li, W.; Liu, L.; Hu, W.; Li, J.; Sun, X.; Li, Y. Health assessment of small-to-medium sized rivers: Comparison between comprehensive indicator method and biological monitoring method. Ecol. Indic. 2021, 126, 107686. [Google Scholar] [CrossRef]
  3. Zhang, X.-R.; Zhang, D.-R.; Ding, Y. An environmental flow method applied in small and medium-sized mountainous rivers. Water Sci. Eng. 2021, 14, 323–329. [Google Scholar] [CrossRef]
  4. Jia, H.; Chen, F.; Pan, D.; Du, E.; Wang, L.; Wang, N.; Yang, A. Flood risk management in the Yangtze River basin—Comparison of 1998 and 2020 events. Int. J. Disaster Risk Reduct. 2022, 68, 102724. [Google Scholar] [CrossRef]
  5. Kong, F.; Sun, S. Better understanding the catastrophe risk in interconnection and comprehensive disaster risk defense capability, with special reference to China. Sustainability 2021, 13, 1793. [Google Scholar] [CrossRef]
  6. Zhou, R.; Wen, Z.; Su, H. Automatic recognition of earth rock embankment leakage based on UAV passive infrared thermography and deep learning. ISPRS J. Photogramm. Remote Sens. 2022, 191, 85–104. [Google Scholar] [CrossRef]
  7. Zhou, R.; Wen, Z.; Su, H. Detect submerged piping in river embankment by passive infrared thermography. Measurement 2022, 202, 111873. [Google Scholar] [CrossRef]
  8. Cramer, W.; Guiot, J.; Fader, M.; Garrabou, J.; Gattuso, J.P.; Iglesias, A.; Xoplaki, E. Climate change and interconnected risks to sustainable development in the Mediterranean. Nat. Clim. Change 2018, 8, 972–980. [Google Scholar] [CrossRef]
  9. Adedeji, O.H.; Odufuwa, B.O.; Adebayo, O.H. Building capabilities for flood disaster and hazard preparedness and risk reduction in Nigeria: Need for spatial planning and land management. J. Sustain. Dev. Afr. 2012, 14, 45–58. [Google Scholar]
  10. Cafiso, S.; Pappalardo, G.; Kiec, M. Innovative methods for improving the effectiveness of road safety inspection. In Proceedings of the VI International Symposium of Transport and Communications, New Horizons, Doboj, Bosnia and Herzegovina, 17–18 November 2017. [Google Scholar]
  11. Gu, D.; Andreev, K.; Dupre, M.E. Major Trends in Population Growth Around the World. China CDC Wkly. 2021, 3, 604–613. [Google Scholar] [CrossRef]
  12. Banister, J.; Bloom, D.E.; Rosenberg, L. Population aging and economic growth in China. 2012. Available online: https://www.hsph.harvard.edu/wp-content/uploads/sites/1288/2013/10/PGDA_WP_53.pdf (accessed on 9 July 2023).
  13. Fujisawa, K.; Murakami, A.; Nishimura, S.-I. Numerical analysis of the erosion and the transport of fine particles within soils leading to the piping phenomenon. Soils Found. 2010, 50, 471–482. [Google Scholar] [CrossRef]
  14. Ghazali, M.H.M.; Rahiman, W. An investigation of the reliability of different types of sensors in the real-time vibration-based anomaly inspection in drone. Sensors 2022, 22, 6015. [Google Scholar] [CrossRef] [PubMed]
  15. Zhang, Z.; Duan, Y. Design and research of substation inspection mode based on digital twins. In Proceedings of the 2023 2nd International Conference on Big Data, Information and Computer Network (BDICN), Xishuangbanna, China, 6–8 January 2023; pp. 53–57. [Google Scholar]
  16. Khan, A.A.; Vrabie, V.; Mars, J.I.; Girard, A.; d’Urso, G. Automatic monitoring system for singularity detection in dikes by DTS data measurement. IEEE Trans. Instrum. Meas. 2009, 59, 2167–2175. [Google Scholar] [CrossRef]
  17. Xu, X.; Peng, S.; Xia, Y.; Ji, W. The development of a multi-channel GPR system for roadbed damage detection. Microelectron. J. 2014, 45, 1542–1555. [Google Scholar] [CrossRef]
  18. Xu, X.; Peng, S.; Yang, F. Development of a ground penetrating radar system for large-depth disaster detection in coal mine. J. Appl. Geophys. 2018, 158, 41–47. [Google Scholar] [CrossRef]
  19. Chai, H.; Li, Y.; Song, R.; Zhang, G.; Zhang, Q.; Liu, S.; Yang, Z. A survey of the development of quadruped robots: Joint configuration, dynamic locomotion control method and mobile manipulation approach. Biomim. Intell. Robot. 2022, 2, 100029. [Google Scholar] [CrossRef]
  20. Jiang, F.; Chen, X.; Zhan, Y.; Zhao, G.; Yang, H.; Zhao, L.; Qiao, L.; Wang, L. Shifting Correlation Between Earthquakes and Electromagnetic Signals: A Case Study of the 2013 Minxian–Zhangxian ML 6.5 (MW 6.1) Earthquake in Gansu, China. Pure Appl. Geophys. 2016, 172, 269–284. [Google Scholar] [CrossRef]
  21. Jiang, F.; Chen, X.; Chen, C.C.; Chen, H.J. Relationship between seismic electric signals and tectonics derived from dense geoelectric observations in Taiwan. Pure Appl. Geophys. 2020, 177, 441–454. [Google Scholar] [CrossRef]
  22. Fumian, F.; Di Giovanni, D.; Martellucci, L.; Rossi, R.; Gaudio, P. Application of miniaturized sensors to unmanned aerial systems, a new pathway for the survey of polluted areas: Preliminary results. Atmosphere 2020, 11, 471. [Google Scholar] [CrossRef]
  23. Berni, J.A.J.; Zarco-Tejada, P.J.; Suarez, L.; González-Dugo, V.; Fereres, E. Remote sensing of vegetation from UAV platforms using lightweight multispectral and thermal imaging sensors. Int. Arch. Photogramm. Remote Sens. Spat. Inform. Sci. 2009, 38, 6. [Google Scholar]
  24. Su, H.; Ma, J.; Zhou, R.; Wen, Z. Detect and identify earth rock embankment leakage based on UAV visible and infrared images. Infrared Phys. Technol. 2022, 122, 104105. [Google Scholar] [CrossRef]
  25. Zhou, R.; Su, H.; Wen, Z. Experimental study on leakage detection of grassed earth dam by passive infrared thermography. NDT E Int. 2022, 126, 102583. [Google Scholar] [CrossRef]
  26. Ngugi, L.C.; Abelwahab, M.; Abo-Zahhad, M. Recent advances in image processing techniques for automated leaf pest and disease recognition–A review. Inf. Process. Agric. 2021, 8, 27–51. [Google Scholar] [CrossRef]
  27. Boulent, J.; Foucher, S.; Théau, J.; St-Charles, P.L. Convolutional neural networks for the automatic identification of plant diseases. Front. Plant Sci. 2019, 10, 941. [Google Scholar] [CrossRef]
  28. Speiser, J.L.; Miller, M.E.; Tooze, J.; Ip, E. A comparison of random forest variable selection methods for classification prediction modeling. Expert Syst. Appl. 2019, 134, 93–101. [Google Scholar] [CrossRef] [PubMed]
  29. Zafari, A.; Zurita-Milla, R.; Izquierdo-Verdiguier, E. Evaluating the performance of a random forest kernel for land cover classification. Remote Sens. 2019, 11, 575. [Google Scholar] [CrossRef]
  30. Kuenzer, C.; Dech, S. Theoretical background of thermal infrared remote sensing. In Thermal Infrared Remote Sensing: Sensors, Methods, Applications; Springer: Dordrecht, The Netherlands, 2013; pp. 1–26. [Google Scholar]
  31. Aggarwal, S. Principles of remote sensing. Satell. Remote Sens. GIS Appl. Agric. Meteorol. 2004, 23, 23–28. [Google Scholar]
  32. Fillion, M.H.; Côté, J.; Konrad, J.M. Thermal radiation and conduction properties of materials ranging from sand to rock-fill. Can. Geotech. J. 2011, 48, 532–542. [Google Scholar] [CrossRef]
  33. Liao, K.C.; Wu, H.Y.; Wen, H.T. Using Drones for Thermal Imaging Photography and Building 3D Images to Analyze the Defects of Solar Modules. Inventions 2022, 7, 67. [Google Scholar] [CrossRef]
  34. Gruen, A. Development and Status of Image Matching in Photogrammetry: Development and status of image matching in photogrammetry. Photogramm. Rec. 2012, 27, 36–57. [Google Scholar] [CrossRef]
  35. Shen, X.; Darmon, F.; Efros, A.A.; Aubry, M. Ransac-flow: Generic two-stage image alignment. In Proceedings of the Computer Vision–ECCV 2020: 16th European Conference, Glasgow, UK, 23–28 August 2020; Proceedings Part IV 16. pp. 618–637. [Google Scholar]
  36. Ye, Y.; Shan, J.; Bruzzone, L.; Shen, L. Robust Registration of Multimodal Remote Sensing Images Based on Structural Similarity. IEEE Trans. Geosci. Remote Sens. 2017, 55, 2941–2958. [Google Scholar] [CrossRef]
  37. Ye, Y.; Bruzzone, L.; Shan, J.; Bovolo, F.; Zhu, Q. Fast and Robust Matching for Multimodal Remote Sensing Image Registration. IEEE Trans. Geosci. Remote Sens. 2019, 57, 9059–9070. [Google Scholar] [CrossRef]
  38. Meng, L.; Zhou, J.; Liu, S.; Wang, Z.; Zhang, X.; Ding, L.; Wang, S. A robust registration method for UAV thermal infrared and visible images taken by dual-cameras. ISPRS J. Photogramm. Remote Sens. 2022, 192, 189–214. [Google Scholar] [CrossRef]
  39. Lewis, H.G.; Brown, M. A generalized confusion matrix for assessing area estimates from remotely sensed data. Int. J. Remote Sens. 2001, 22, 3223–3235. [Google Scholar] [CrossRef]
  40. Valero-Carreras, D.; Alcaraz, J.; Landete, M. Comparing two SVM models through different metrics based on the confusion matrix. Comput. Oper. Res. 2023, 152, 106131. [Google Scholar] [CrossRef]
  41. Jake, L. Classification evaluation: It is important to understand both what a classification metric expresses and what it hides. Nat. Methods 2016, 13, 603–605. [Google Scholar]
  42. Wang, Y.; Guo, N.; Wang, S.; Gu, Y. Detection of Internal Erosion and Piping in Embankment Dams. In Proceedings of the 2016 International Forum on Energy, Environment and Sustainable Development, Shenzhen, China, 16–17 April 2016. [Google Scholar]
  43. Liang, Y.; Chen, J.; Chen, L.; Shen, J. Laboratory tests and analysis on piping in two-stratum dike foundation. Chin. J. Geotech. Eng. 2011, 33, 624–629. [Google Scholar]
  44. Yao, Q.; Liu, C.; Ding, L.; Zhang, S. Experimental study on the microcosmic mechanism of backward piping in dike foundations. J. China Inst. Water Resour. Hydropower Res. 2014, 12, 7. [Google Scholar] [CrossRef]
Figure 1. The breached embankment and the manual inspection in small and medium rivers.
Remotesensing 15 04492 g001
Figure 2. Flowchart for automatic identification of earth rock embankment piping hazard. No. 1 simulation experiment, No. 2 data processing, No. 3 identification algorithm, No. 4 evaluation and improvement, No. 5 deployment and application, No. 6 display system, No. 7 alarm.
Remotesensing 15 04492 g002
Figure 3. Technical route of earth rock embankment piping identification.
Remotesensing 15 04492 g003
Figure 4. Confusion matrix for evaluation of piping image identification.
Remotesensing 15 04492 g004
Figure 5. (A) Submersible pump and water hose; (B) gasoline engine generator; (C) probe thermometer.
Remotesensing 15 04492 g005
Figure 6. UAV and thermal infrared and visible sensors.
Remotesensing 15 04492 g006
Figure 7. Artificial simulated piping outlet device.
Remotesensing 15 04492 g007
Figure 8. Temperature field of piping outlet. (A1,A2) Images captured on a sunny day; (B1,B2) images captured after rain.
Remotesensing 15 04492 g008
Figure 9. Classification and interpretation of visible images.
Remotesensing 15 04492 g009
Figure 10. Registration and overlaying of thermal infrared and visible images.
Remotesensing 15 04492 g010
Figure 11. (A1E1) Original visible images; (A2E2) original thermal infrared images; (A3E3) classification results obtained with RF method; (A4E4) identification results obtained with automatic identification algorithm of piping in the field test. In the classification map (A3E3), dark green represents farmland. Light green represents grassland, dark blue represents waterbodies, light blue represents wet soil, and yellow represents soil types. In the identification result map (A4E4), black boxes represent the piping areas.
Remotesensing 15 04492 g011
Table 1. Main specifications of an infrared camera.
FeatureSpecifications
Thermal image resolution640 × 512 pixels
NETD 1 ≤50 mK @ f/1.0
Phase element spacing of the sensor12 μm
Field of view40.6°; focal length 13.5 mm
Image formatR-JPEG 2 (16-bit)
Spectral range8–14 μm
1 Noise Equivalent Temperature Difference. 2 R-JPEG are short for Radiometric JPEG.
Table 2. Main specifications of visible camera.
FeatureSpecifications
Image resolution12 million pixels
Field of view82.9°; focal length 4.5 mm
Maximum photo size 4056 × 3040
Sensor1/2.3″ CMOS
Image formatJPEG
Table 3. Results of piping identification tests.
No.WeatherHeightSpeedAccuracyPrecisionRecallSample
1Sunny & breeze30 m8 m/s(410/416) 98.6%(10/16) 67%(10/10) 100%416
2Drizzly & windy30 m11 m/s(406/416) 97.6%(10/20) 50%(10/10) 100%416
3Cloudy &breeze60 m11 m/s(130/160) 81%(18/30) 60%(18/18) 100%160
4Sunny & breeze30–120 m15 m/s(18/20) 90%(18/18) 100%(18/20) 90%20
5Drizzly &windy30–120 m15 m/s(8/20) 40%(8/8) 100%(8/20) 40%20
6Sunny30–120 m0 m/s(20/20) 100%(20/20) 100% (20/20) 100%20
7Cloudy30–120m0 m/s(20/20) 100%(20/20) 100%(20/20) 100%20
8Drizzly30–120 m0 m/s(20/20) 100%(20/20) 100%(20/20) 100%20
Table 4. GSD values and comparison test results.
Relative Altitude
(m)
Pixels per Square Meter (units)GSD
(m)
Speed = 15 m/s
Sunny and Breeze
Speed = 15 m/s
Drizzly and Windy
3010890.027Y 1Y
407720.036YY
505160.044YY
603550.053YY
702600.062YN
801980.071YN
901560.080YN
1001260.089YN
1101040.098YN
120870.107N 2N
1 Y = Yes, piping area was identified. 2. N = No, piping area was not identified.
Disclaimer/Publisher’s Note: The statements, opinions and data contained in all publications are solely those of the individual author(s) and contributor(s) and not of MDPI and/or the editor(s). MDPI and/or the editor(s) disclaim responsibility for any injury to people or property resulting from any ideas, methods, instructions or products referred to in the content.

