Article

Light Absorption by Optically Active Components in the Arctic Region (August 2020) and the Possibility of Application to Satellite Products for Water Quality Assessment

by
Tatiana Efimova
1,
Tatiana Churilova
1,*,
Elena Skorokhod
1,
Vyacheslav Suslin
2,
Anatoly S. Buchelnikov
1,3,
Dmitry Glukhovets
4,5,
Aleksandr Khrapko
4 and
Natalia Moiseeva
1
1
A. O. Kovalevsky Institute of Biology of the Southern Seas (IBSS), Russian Academy of Sciences, 299011 Sevastopol, Russia
2
Marine Hydrophysical Institute Russian Academy of Sciences, 299011 Sevastopol, Russia
3
Laboratory of Molecular and Cellular Biophysics, Sevastopol State University, 299053 Sevastopol, Russia
4
Shirshov Institute of Oceanology, Russian Academy of Sciences, 117997 Moscow, Russia
5
Moscow Institute of Physics and Technology, 141700 Dolgoprudny, Russia
*
Author to whom correspondence should be addressed.
Remote Sens. 2023, 15(17), 4346; https://doi.org/10.3390/rs15174346
Submission received: 19 June 2023 / Revised: 26 July 2023 / Accepted: 30 August 2023 / Published: 4 September 2023

Abstract

:
In August 2020, during the 80th cruise of the R/V “Akademik Mstislav Keldysh”, the chlorophyll a concentration (Chl-a) and spectral coefficients of light absorption by phytoplankton pigments, non-algal particles (NAP) and colored dissolved organic matter (CDOM) were measured in the Norwegian Sea, the Barents Sea and the adjacent area of the Arctic Ocean. It was shown that the spatial distribution of the three light-absorbing components in the explored Arctic region was non-homogenous. It was revealed that CDOM contributed largely to the total non-water light absorption (atot(λ) = aph(λ) + aNAP(λ) + aCDOM(λ)) in the blue spectral range in the Arctic Ocean and the Barents Sea. The fraction of NAP in the total non-water absorption was low (less than 20%). The depth of the euphotic zone depended on atot(λ) in the surface water layer, which was described by a power equation. The Arctic Ocean, the Norwegian Sea and the Barents Sea did not differ in the Chl-a-specific light absorption coefficients of phytoplankton. In the blue maximum of phytoplankton absorption spectra, Chl-a-specific light absorption coefficients of phytoplankton in the upper mixed layer (UML) were higher than those below the UML. Relationships between phytoplankton absorption coefficients and Chl-a were derived by least squares fitting to power functions for the whole visible domain with a 1 nm interval. The OCI, OC3 and GIOP algorithms were validated using a database of co-located results (day-to-day) of in situ measurements (n = 63) and the ocean color scanner data: the Moderate Resolution Imaging Spectroradiometer (MODIS) onboard the Terra (EOS AM) and Aqua (EOS PM) satellites, the Visible and Infrared Imager/Radiometer Suite (VIIRS) onboard the Suomi National Polar-orbiting Partnership (S-NPP) and JPSS-1 satellites (also known as NOAA-20), and the Ocean and the Land Color Imager (OLCI) onboard the Sentinel-3A and Sentinel-3B satellites. The comparison showed that despite the technological progress in optical scanners and the algorithms refinement, the considered standard products (chlor_a, chl_ocx, aph_443, adg_443) carried little information about inherent optical properties in Arctic waters. Based on the statistic metrics (Bias, MdAD, MAE and RMSE), it was concluded that refinement of the algorithm for retrieval of water bio-optical properties based on remote sensing data was required for the Arctic region.

Graphical Abstract

1. Introduction

At present, the global ocean, covering about 70 percent of the Earth’s surface, is affected by climate change [1], which can significantly affect the physical and biological parameters of the ocean. Numerous recent studies have reported that the Arctic region was warming two-to-three times as fast as the global average [2,3,4]. According to present data, for the last 43 years (since 1979), the Arctic has been warming nearly four times faster than the globe [5]. Since 1999, the Arctic Ocean has experienced rapid sea ice loss [6]. The permanent loss of multiyear sea ice has resulted in an increase of sea surface temperature [7] and cloudiness [8], which has caused a decrease in photosynthetically active radiation (PAR) incident on the sea surface [9]. Moreover, changes in nutrient cycling [10], in phytoplankton composition [11] and in net primary production [12] occurred due to global warming in the Arctic region. Climate change is a serious threat to Arctic biodiversity: the potential of introducing nonindigenous species to Arctic seas is increasing, but many native polar species may not be able to tolerate warming [13]. In this regard, operative monitoring and understanding of the current state of the water ecosystem in the Arctic region is necessary.
Phytoplankton are the base of the food webs of the oceanic ecosystems. The rate of primary production of phytoplankton controls the chemical energy flow to higher trophic levels [14]. Water productivity indicators such as chlorophyll a and primary production can be assessed by ocean color remote sensing from satellites. Remote assessment of the primary production is used widely [15,16,17] due to unique opportunities of the remote approach, which provides a great spatial and temporal coverage. However, standard ocean color algorithms do not work well in the Arctic waters [18,19,20] due to a number of difficulties and intrinsic limitations, including higher concentrations of colored dissolved organic matter (CDOM) caused mostly by river runoff [21,22,23] and lower chlorophyll-a-specific absorption coefficients [24,25]. CDOM and non-algal particles (NAP) are poorly correlated to chlorophyll a in the Arctic [21], justifying that Arctic waters can be optically complex and the assumption for Case 1 waters are often not met [15].
Because of this, assessment of water productivity based on satellite data requires the development of regional Arctic algorithms based on regional peculiarities in inherent optical property (IOP) values and large solar zenith angles [16,26,27]. Thence, the IOPs, in particular, light absorption by optically significant substances (phytoplankton, NAP and CDOM [28]) are required to be measured and analyzed for the retrieval of empirical regularities of spatial and temporal variability of the spectral light absorption coefficient of the phytoplankton, NAP and CDOM. These regularities are necessary to assess the primary production by a full spectral approach [29] which takes into account the effect of spectral characteristics of both downwelling irradiance and phytoplankton absorption coefficients (aph(λ)) on the primary production.
Up to now, bio-optical data for the Arctic Ocean are not well documented [15]. In recent times, the IOPs of the western Arctic Ocean were analyzed in detail by Matsuoka et al. [30]. It was shown that values of the aph(λ) and the NAP absorption coefficient (aNAP(λ)) at a wavelength of 440 nm varied widely from 0.001 to 0.2 m−1 [30]. It was found [30] that values of the CDOM absorption coefficient (aCDOM(440)) (0.005 to 0.5 m−1) exceeded the aph(λ) and aNAP(λ) values. The aCDOM(440) observed in the Arctic region fell within the range obtained for coastal waters around Europe [28], with the exception of the lowest values, which were consistent with open oceanic waters [31]. Other published data, which were obtained in the Arctic region up to 2011 [22,32,33,34,35,36], confirmed the results of the study by Matsuoka et al. (2011) [30].
However, the bio-optical properties of Arctic waters are rapidly changing due to climatic effects. Sea ice melting releases an appreciable quantity of organic particles [37]. High loads of organic and inorganic dissolved and particulate matter are introduced in Arctic waters with river runoff through the Siberian continental shelves [38,39,40]. Changes in the composition and concentration of particulate and dissolved matter affect the propagation of spectral downwelling irradiance through the water column [26]. NAP absorption is strongest in the blue spectrum range, decreasing exponentially to the red spectrum range. CDOM absorption is similar to that of NAP due to the similarity in composition (organic matter) but exhibits a steeper exponential slope [26]. It was shown that in the Beaufort Sea, the particle enrichment flattened a remote sensing reflectance (Rrs) spectrum by reducing the Rrs by up to 20% in the spectral range from 400 to 550 nm [37]. Due to the dependence of apparent optical properties, including spectral Rrs, on the IOPs [26], the assessment of the current state and spatial variability of the IOPs in Arctic waters is especially relevant for remote sensing algorithm development [41].
The aim of this research was to assess the spatial distribution of spectral light absorption coefficients by optically active components (phytoplankton, NAP and CDOM) and their contribution to total non-water absorption in the Norwegian Sea, Barents Sea and the Arctic Ocean in August 2020.

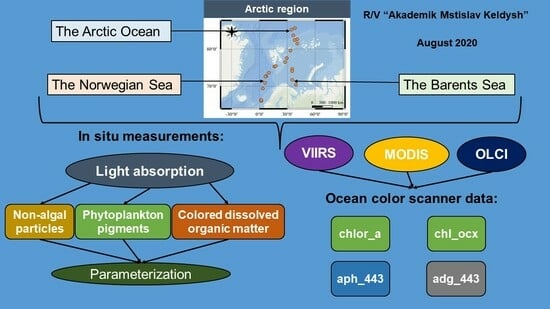
2. Materials and Methods

2.1. Water Sampling

Bio-optical data were collected in August 2020 in the Barents Sea, the Norwegian Sea and the Arctic Ocean during the 80th cruise of the R/V “Akademik Mstislav Keldysh” [42] (Figure 1). Water sampling was carried out during daylight hours. Water samples were collected at 5 to 7 depths of the euphotic zone (Zeu), depending on the hydrological water structure. Water sampling and CTD sounding were done with SBE oceanographic complex. Zeu was defined as the depth of the 1% surface PAR level. PAR was measured with the LI-COR device, consisting of photodiode sensors LI-192 (for measuring underwater irradiance) and LI-190SA (for monitoring the level of PAR incident on the sea surface). Also, water transparency was assessed by Secchi disk depth (Zs).
The upper mixed layer (UML) depth was calculated as the depth at which potential density was different from the sea surface density by 0.05 kgm−3.
PAR in the UML (PARUML) was calculated in accordance with [43]:
PARUML = PAR0 × (1 − e(−4.6 ZUML/Zeu))/(4.6 ZUML/Zeu),
where PAR0 is daily PAR incident on the sea surface and ZUML is the depth of the upper mixed layer.

2.2. Pigment Analysis

The sum of chlorophyll a and phaeopigment concentrations (Chl-a) was determined by the spectrophotometric method [44,45] using a dual-beam spectrophotometer LAMBDA 35 (PerkinElmer, Waltham, MA, USA). Water samples (1–2 L) were filtered through Whatman GF/F filters (filter diameter −25 mm) with a pore diameter of 0.7 μm under low vacuum (<25 kPa). After the filtration, filters were wrapped in aluminum foil, flash-frozen in liquid nitrogen and kept at −80 °C until analysis in a laboratory. In the laboratory, filters were placed in 5 mL of 90% acetone in a glass centrifuge tube, then treated with vibration for 20 s using a vibration mixer (FALK instruments, Treviglio, Italy), kept at 5 °C for 10 h and then centrifuged. For a more complete extraction of phytoplankton pigments, the procedure was repeated.

2.3. Absorption Measurements

The particulate absorption coefficients were measured by the “quantitative techniques on wet filters” [24] in accordance with [46]. A quantity of 1–2 L of seawater was filtered through glass-fiber filters (Whatman GF/F) (filter diameter 25 mm) with a pore diameter of 0.7 μm under low vacuum (<25 kPa) shortly after sampling (<2 h). The spectral optical density (ODp(λ)) of the particles on the filter was measured using a dual-beam spectrophotometer, LAMBDA 35 (PerkinElmer), equipped with a Spectralon integrating sphere, from 400–750 nm in 1 nm increments. The ODp(λ) was converted to the spectral particulate absorption coefficient (ap(λ)):
ap(λ) = 2.303 × ODp(λ)/(V/S),
where 2.303 = ln10, V is the water filtration volume (in m3), and S is the filter clearance area (in m2).
Then phytoplankton pigments were extracted in hot methanol [47], and the ODNAP(λ) of non-algal particles was measured and converted to aNAP(λ):
aNAP(λ) = 2.303 × ODNAP(λ)/(V/S).
The absorption coefficient of phytoplankton (aph(λ)) was obtained by subtracting aNAP(λ) from ap(λ). The path length amplification factor (β-correction) was estimated applying the quadratic equation described in [48]. To get the Chl-a-specific light absorption coefficient of phytoplankton ( a p h * ( λ ) ) the values of aph(λ) were divided by Chl-a. Relationships between aph(λ) and Chl-a were derived by least squares fitting to power functions for the visible spectral domain (from 400 to 700 nm) in 1 nm increments. Spectral distributions of aNAP(λ) coefficients were described with an exponential function [28]. Variations in the spectral shape of NAP absorption were described using the spectral slope (SNAP). The SNAP was calculated by fitting data to the exponential function for the visible spectral domain (from 400 to 700 nm).
CDOM light absorption coefficients (aCDOM(λ)) were measured in accordance with modern NASA protocol [46]. Water samples were filtered through a nucleopore filter (Sartorius) with a pore diameter of 0.2 μm, using GF/F filters for prefiltration. The filters were pre-washed with ~50 mL of deionized water. The sample OD(λ) was measured opposite deionized water using quartz cuvettes with an optical path length of 0.1 m. The OD(λ) was also measured from 250 to 750 nm in 1 nm increments using a dual-beam spectrophotometer, LAMBDA 35 (Perkin Elmer). Spectral distributions of aCDOM(λ) were described by an exponential function [28]. Slope coefficient (SCDOM) was calculated by fitting data to the exponential function for the wavelength range from 350 to 500 nm.

2.4. Satellite Data

We used Level-2 Moderate Resolution Imaging Spectroradiometer (MODIS), Visible and Infrared Imager/Radiometer Suite (VIIRS) and Ocean and Land Color Imager (OLCI) satellite data from OceanColor Web (https://oceancolor.gsfc.nasa.gov/, accessed on 22 June 2021 (MODIS and VIIRS) and 20 April 2023 (OLCI)). The satellite data were chosen day-to-day with in situ measurements.
chlor_a (mg m−3)—chlorophyll concentration, OCI algorithm [49].
chl_ocx (mg m−3)—chlorophyll concentration, OC3 algorithm [50].
aph_443 (m−1)—light absorption by phytoplankton at 443 nm, calculated using the default global configuration of the Generalized Inherent Optical Property (GIOP) model [51,52].
adg_443 (m−1)—light absorption by NAP plus CDOM at 443 nm, calculated using GIOP model [51,52].

2.5. Statistical Analysis

Mapping and graph plotting were performed using QGIS desktop 3.8.0 and Grapher v.11 software, respectively. Statistical analyses were performed using the Microsoft Excel software package. The correlation analysis was performed with confidence probability of 0.05. To determine whether there was a statistically significant difference between the means in two unrelated data groups, the independent samples t-test with the significance level α = 0.05 was used. The criterion of signs (p-value) of less than 0.05 was considered statistically significant.
Systemic bias was calculated as:
b i a s = 10 ^ i = 1 n log 10 ( S a t i ) log 10 ( I n S i t u i ) n .
Median Absolute Difference was calculated as:
M d A D = 10 M e d i a n log 10 S a t i log 10 I n S i t u i
Mean Absolute Error was calculated as:
M A E = 10 ^ i = 1 n l o g 10 S a t i l o g 10 I n S i t u i n
The parameter of a linear regression fitting, Root Mean Square Error, was calculated as:
R M S E = i = 1 n S a t i I n S i t u i 2 n
where n is the number of samples, Sati is the satellite data and InSitui is the in situ measured data. The best result is considered when bias, MdAD and MAE are equal to 1 and RMSE is equal to 0.
The statistical parameters for the products Chl-a and colored detrital matter (CDM) were computed following a log-normal hypothesis.

3. Results

3.1. Pigment Concentration

In the Arctic Ocean (16–19 August 2020), surface water temperature varied from −1.4 to 3.3 °C. The Chl-a values in the UML (Figure 2) varied between stations over a wide range (0.0066–1.3 mg m−3) and were, on average, 0.43 ± 0.54 mg m−3. The UML was in a range from 2 to 20 with mean equal to 10 ± 6 m. The maximum temperature gradient in the Arctic Ocean varied from 0.080 to 1.0 °C m−1 and was, on average, 0.56 °C m−1. The temperature gradient was located at 3.5–21 m (at 13 ± 6 m on average). Zeu values varied from 29 to 60 m with mean equal to 43 ± 10 m. At some stations, the deep Chl-a maximum was observed in the thermocline, located within the euphotic zone (Figure 2).
During the first leg of the expedition (16–19 August), water temperatures in the surface layer of the Barents Sea were lower (3.7–5.7 °C) than temperatures on 21–23 August (5.7–11 °C). The UML was located at 6–24 m (mean depth of 15 ± 5 m), which was deeper than in the Arctic Ocean. The Chl-a values in the UML (Figure 2) changed within a narrower range (from 0.071 to 0.73 mg m−3 with mean 0.41 ± 0.26 mg m−3) than in the Arctic Ocean. In the Barents Sea, the seasonal thermocline was well developed, with a temperature gradient from 0.68 °C m−1 to 1.5 °C m−1 (on average 0.87 °C m−1). The thermocline was located at 13–35 m (mean 23 ± 7 m) depth, while Zeu values varied from 21 to 50 m (mean equal to 36 ± 11 m). Similarly to the Arctic Ocean, in the Barents Sea, the deep Chl-a maximum at some stations was located below the thermocline.
In the Norwegian Sea (5–13 August 2020), surface water temperature values were the highest (8.0–13 °C) among the study water areas. The UML was in a range 11–22 m, with 14 ± 4 m on average. The Chl-a values in the UML (0.54–2.0 mg m−3) were highest in comparison with the Barents Sea and the Arctic Ocean (Figure 2). The average Chl-a value (1.0 ± 0.44 mg m−3) in the Norwegian Sea was about twice as high as in both the Barents Sea and the Arctic Ocean. The maximum temperature gradient varied from 0.31 °C m−1 to 1.3 °C m−1 (on average, 0.74 °C m−1) and was similar to that observed in the Barents Sea. The temperature gradient was located at 12–30 m (mean 19 ± 8 m). Water transparency in the Norwegian Sea was comparable with water transparency in the Arctic Ocean and the Barents Sea: Zeu varied from 26 to 35 m and the mean was equal to 31 ± 4 m.

3.2. Light Absorption by Phytoplankton

Results were grouped into two datasets: (1) UML dataset and (2) below UML dataset within the euphotic zone, because seasonal water stratification divided the euphotic zone into two quasi-isolated layers. The variability of the spectral light absorption coefficients of phytoplankton, NAP and CDOM were analyzed for these two layers. The blue wavelength 438 nm was chosen for analysis because all three optically active components absorbed light significantly at the blue spectrum range and because this wavelength corresponded to the phytoplankton absorption maximum.
The aph(λ) spectrum shape was characterized by two main peaks: the blue maximum at a wavelength of ~438 nm and the red maximum at ~678 nm (Figure 3). In the UML, the aph(λ) values at wavelengths of 438 nm (aph(438)) and 678 nm (aph(678)) in the Norwegian Sea varied from 0.027 to 0.12 m−1 and from 0.012 ± 0.051 m−1, respectively. In the Norwegian Sea, aph(438) and aph(678) were higher than in both the Barents Sea and the Arctic Ocean. In the Barents Sea, the aph(438) and aph(678) values were in a range from 0.0030 to 0.049 m−1 and from 0.0012 to 0.021 m−1, respectively. In the Arctic Ocean, the aph(438) and aph(678) values varied from 0.0034 to 0.069 m−1 and from 0.0016 to 0.041 m−1, respectively. In the vertical profile of aph(λ), the highest values were associated with the deep Chl-a maximum located below UML (Figure 3).
Despite the marked difference in absorption coefficients between the seas, the shape of the spectrum, which was estimated by the ratio between absorption at the blue and red peaks (Rph), was not different between the seas. The Rph values decreased with depth from average 2.3 ± 0.35 in the UML to 2.0 ± 0.24 below the UML. This difference in the Rph values between the UML and below UML was statistically significant (p < 0.00001).
The aph(λ) was strongly correlated to Chl-a. The relationship between the aph(438) and aph(678) coefficients and Chl-a is described by a power function:
aph(λ) = A(λ) × Chl-a B(λ),
where A(λ) is the spectral coefficient, equal to a p h * ( λ ) ) when Chl-a equal to 1 mg m−3; and B(λ) is the spectral power coefficient (in related unit).
The obtained A(λ) and B(λ) coefficients in the relationship linking the light absorption coefficients aph(438) and aph(678) with Chl-a (Equation (1)) turned out to be the same for the Arctic Ocean, the Norwegian Sea and the Barents Sea. But these coefficients differed between the water layers of the euphotic zone: UML and below UML (Figure 4).
To retrieve spectral distribution of aph(λ) coefficients from Chl-a, the relationship between these parameters needs to be determined for the visible domain of radiance (from 400 to 700 nm). The aph(λ) vs. Chl-a dependencies for the UML and below UML datasets were parameterized with 1 nm spectral resolution using Equation (1) for the Arctic region in summer. The results of the parameterization are presented in Figure 5 and in Table 1 and Table 2.

3.3. Light Absorption by Non-Algal Particles

Light absorption by NAP in all investigated areas in the Arctic region co-varied with phytoplankton light absorption. In the UML, values of the aNAP(438) in the Norwegian Sea varied from 0.011 to 0.039 m−1, and were higher than in the Barents Sea (0.0036–0.032 m−1) and the Arctic Ocean (0.0037–0.023 m−1) (Figure 3). The differences in the NAP contribution to particulate light absorption between the water layers (UML and below UML) were not statistically significant (p = 0.22). At the wavelength of the blue maximum of phytoplankton absorption spectra, the contribution of aNAP(438) to the ap(438) was, on average, 29 ± 12%. In all investigated areas, spectral slope (SNAP) varied in almost the same range (from 0.005 to 0.018 nm−1) and was equal to 0.011 ± 0.003 nm−1 on average.

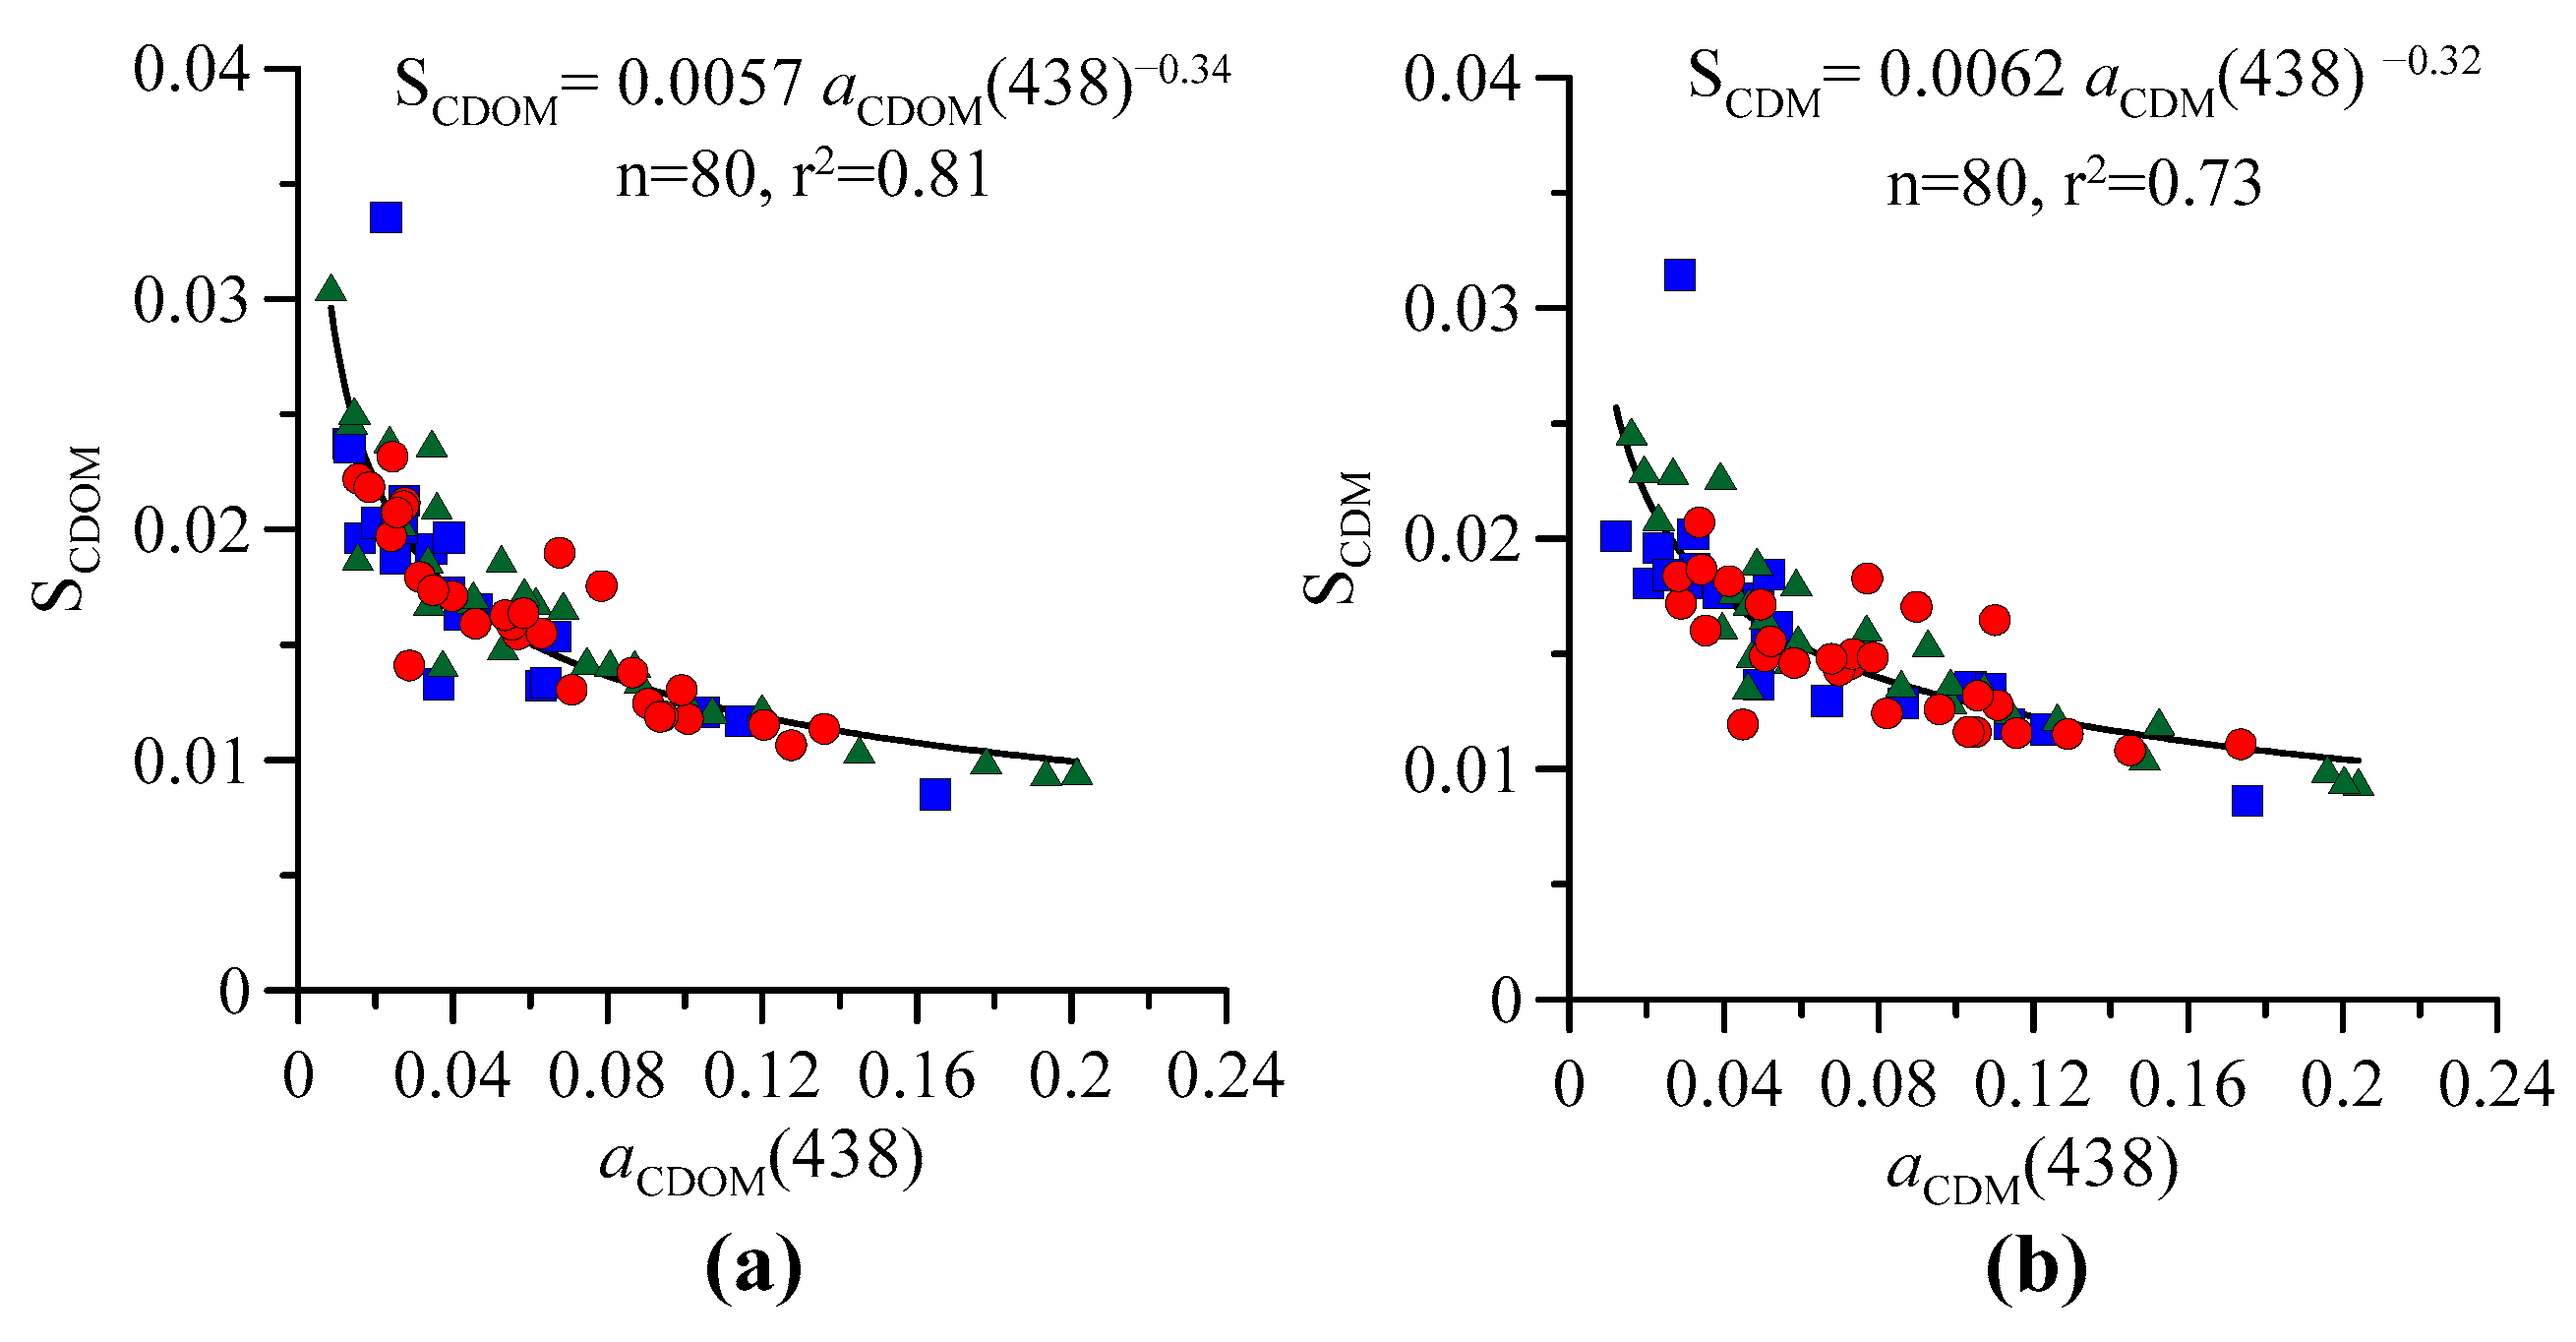
3.4. Light Absorption by Colored Dissolved Organic Matter

The optical properties of the UML in the Arctic Ocean were characterized by lower CDOM absorption (aCDOM(438)) values (0.013–0.063 m−1) than in the Norwegian Sea (0.016–0.14 m−1) and the Barents Sea (from 0.014 to 0.18 m−1) (Figure 3). Below the UML, in the Arctic Ocean, the CDOM absorption coefficients (0.013–0.16 m−1) were higher than in the UML (0.013–0.063 m−1) (p = 0.025). In the Norwegian Sea and the Barents Sea, the values of aCDOM(438) below the UML varied from 0.018 to 0.12 m−1 and from 0.0085 to 0.20 m−1, respectively (Figure 3). The aCDOM(438) varied by more than an order of magnitude in all investigated areas with an exception of the the UML in the Arctic Ocean, where aCDOM(438) changed less (about four times).
The SCDOM values varied from 0.0085 to 0.034 nm−1 (0.017 ± 0.005 nm−1 on average) and did not differ statistically (p = 0.19) between the UML and below the UML.
In the Arctic Ocean, the Barents Sea and the Norwegian Sea, the CDOM absorption did not co-vary with Chl-a (Figure 6) and consequently, also did not co-vary with phytoplankton absorption.
An inverse relationship was revealed between the aCDOM(438) and the SCDOM. The relationship was described by the power function (y = A xB). (Figure 7). Absorption by CDM at 438 nm (aCDM(438) = aCDOM(438) + aNAP(438)) varied in the range 0.012–0.020 m−1 (on average, 0.075 ± 0.046 m−1). The CDM absorption slope coefficient (SCDM) changed from 0.009 to 0.031 nm−1 (on average 0.016 ± 0.0038 nm−1). Between the aCDM(438) and SCDM, a relationship was revealed (Figure 7). Values of the power coefficient (B) of SCDOMaCDOM(438) and SCDMaCDM(438) relationships were almost the same (−0.34 and −0.32), but values of the A coefficient were different (0.0057 and 0.0062), which was related by a ratio between CDOM and CDM absorption coefficients.

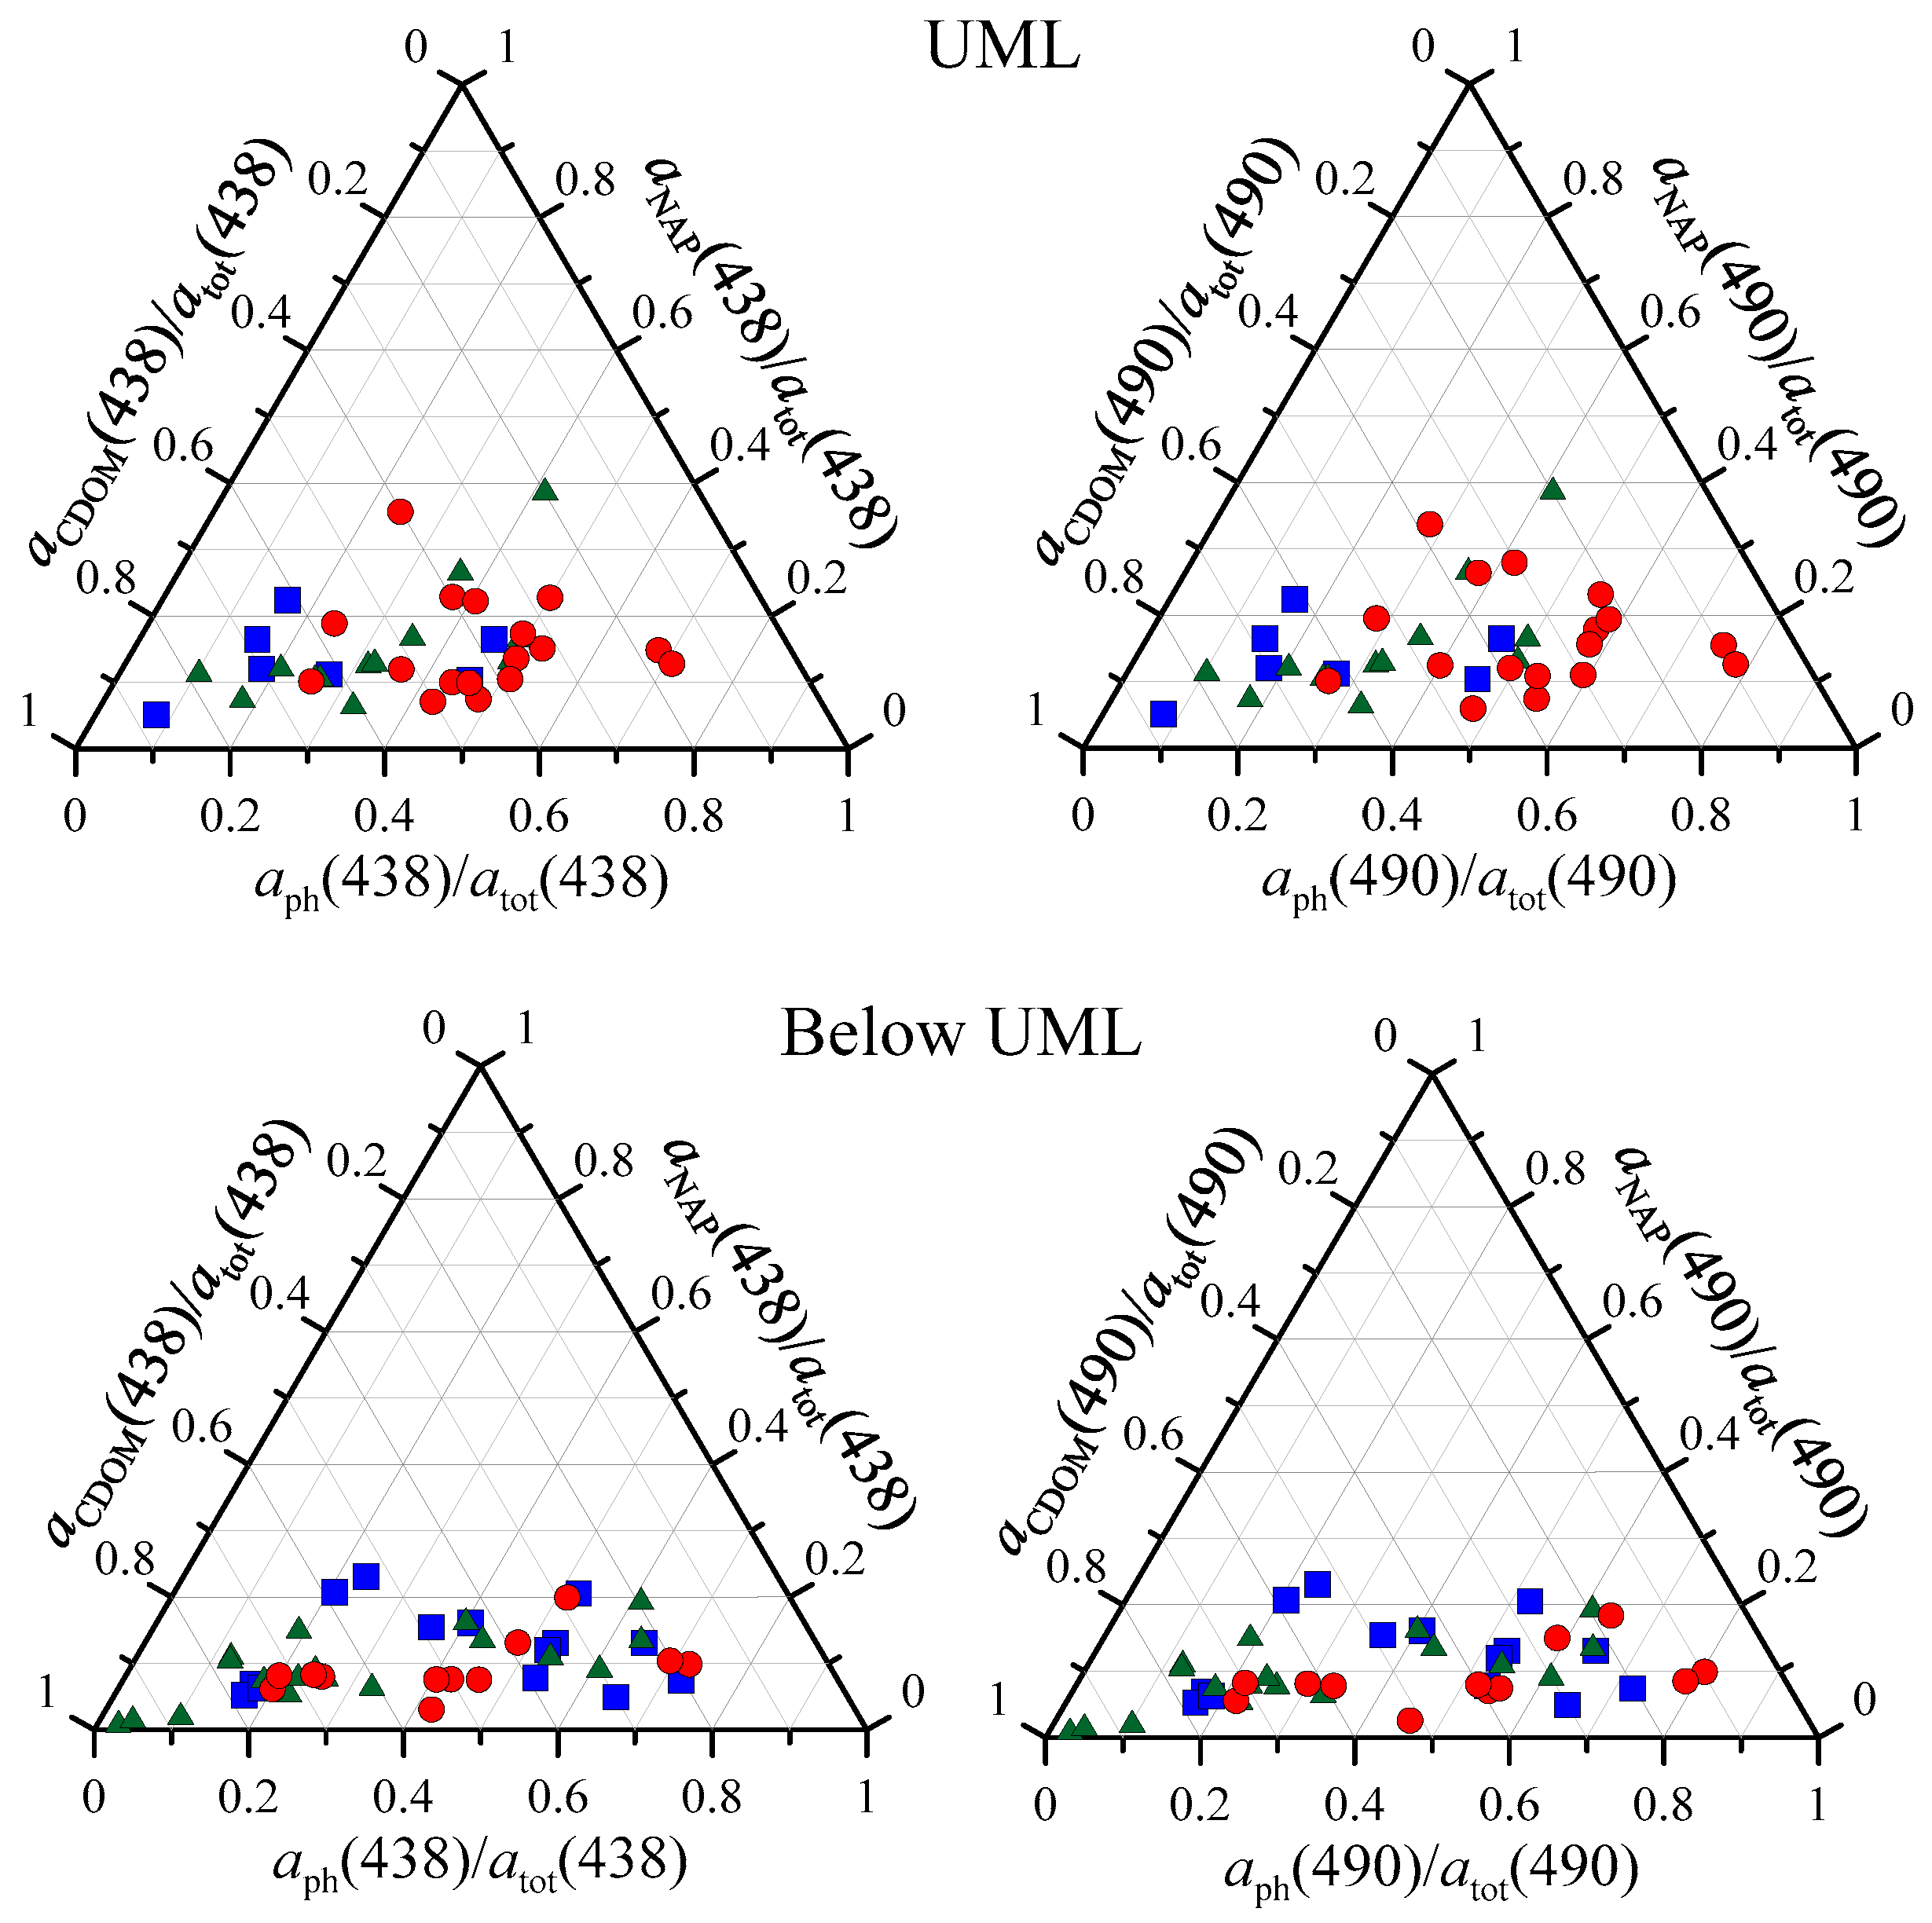
3.5. Total Non-Water Light Absorption Budget

In the Arctic region, values of the total non-water light absorption coefficients by suspended and dissolved organic substances (atot(λ) = ap(λ) + aCDOM(λ)) were calculated for wavelengths of 438 nm (atot(438)) and 490 nm (atot(490)). These wavelengths were chosen because 438 nm corresponds to maximum of phytoplankton absorption and 490 nm corresponds to a channel used by almost all remote sensing optical scanners [55]. Values of the atot(438) varied from 0.021 to 0.25 m−1 in the UML, and from 0.043 to 0.45 m−1 in the layer below the UML. Values of the atot(490) were in range from 0.0086 to 0.16 m−1 in the UML, and from 0.019 to 0.24 m−1 below the UML. Absorption budgets for the UML and below UML layers are presented in Figure 8, using ternary plots that illustrate the relative contribution of each light-absorbing component to atot(438) and atot(490).
In the UML, the highest phytoplankton contribution to the total non-water absorption was obtained in the Norwegian Sea, bordering the Atlantic Ocean: on average, the aph(438) contribution was 45 ± 13% and that of aph(490) was 50 ± 15%. The lowest phytoplankton share in total absorption was detected in in the Arctic Ocean (25 ± 15% and 29 ± 19%, respectively) and in the Barents Sea (31 ± 12% and 33 ± 14%, respectively).
The average contributions of NAP to atot(438) and atot(490) in the UML of all investigated regions (in the Barents Sea, the Norwegian Sea and the Arctic Ocean) were 15 ± 7% and 18 ± 9%, respectively.
CDOM dominated the light absorption in the UML of the Arctic Ocean and the Barents Sea. The CDOM contributions at 438 and 490 nm were 61 ± 17% and 50 ± 20%, respectively, in the Arctic Ocean and 53 ± 17% and 49 ± 20%, respectively, in the Barents Sea. the contribution of CDOM to total light absorption was lowest in the Norwegian Sea: the aCDOM(438) values were, on average, 40 ± 13%, and aCDOM(490) values were, on average, 34 ± 14% (Figure 8).
The absorption budget in the layer below the UML differed from that of the UML in the phytoplankton and NAP contribution to total non-water light absorption. The phytoplankton dominated in the light absorption at 438 and 490 nm in the Arctic Ocean (42 ± 20% and 47 ± 21%, respectively) and in the Norwegian Sea (42 ± 17% and 50 ± 20%, respectively). The phytoplankton share reached ~60–70% in the deep Chl-a maximum in the Arctic Ocean. In the Barents Sea, phytoplankton contributed less at 438 and at 490 nm (29 ± 20% and 35 ± 24%, respectively) than in the Arctic Ocean and in the Norwegian Sea. But CDOM in the Barents Sea largely dominated in total non-water absorption at 438 nm 61 ± 24%) and at 490 nm (54 ± 27%). The NAP contribution to total absorption in the Barents Sea, the Norwegian Sea and the Arctic Ocean below the UML was generally low: the contributions at 438 and at 490 were 10 ± 5% and 11 ± 6%, respectively (Figure 8).
The variability in total non-water absorption resulted in a variation in water transparency by a factor of 2. An analysis of the dependence of water transparency on the water bio-optical properties revealed a relationship between Zeu and total non-water light absorption in the surface layer. The relationship was described by a power equation (Figure 9).

3.6. Satellite Data

The ocean color scanner MODIS provided the most accurate retrievals of Chl-a (Table 3, Figure 10). There was practically no difference between chlor_a and chl_ocx: the RMSE was 0.2 mg m−3 and was equal in both directions (bias = 1.0). The least accurate Chl-a retrievals were obtained from the VIIRS scanner: the chlor_a and chl_ocx were significantly lower than the in situ Chl-a (bias varied from 0.66 to 0.74), and the RMSE varied from 0.45 to 0.48 mg m−3, with the average value of retrieved Chl-a equal to 0.34 mg m−3.
The phytoplankton light absorption coefficients at a wavelength of 443 nm were underestimated for the VIIRS and OLCI scanners (bias 0.58 and 0.89) and overestimated for MODIS (bias 1.4) (Table 3, Figure 10). For all color scanners, the RMSE ranged from 0.07 to 0.09 m−1, with mean aph_443 values of 0.032, 0.016 and 0.021 m−1 for MODIS, VIIRS and OLCI, respectively.
All algorithms tended to significantly underestimate CDM retrievals (Figure 10). Bias for adg_443 varied from 0.20 to 0.34, and RMSE varied from 0.02 to 0.03 m−1 (Table 3).

4. Discussion

The investigations were carried out in the Barents Sea, the Norwegian Sea and the Arctic Ocean in summer 2020 in the post-bloom period of the year [56]. The obtained Chl-a values were typical for these Arctic regions in this season [56]. Within the UML, the Chl-a was distributed homogeneously. Spatial distribution of surface Chl-a was heterogeneous. The lowest Chl-a values were observed in the Arctic Ocean, and the highest Chl-a values were observed in the Norwegian Sea. Extremely low water temperatures (from −1.4 to 3.3 °C) were observed in the Arctic Ocean, and the highest water temperatures (from 8 to 13 °C) were observed in the Norwegian Sea. The spatial Chl-a co-varied with surface temperature. The temperature was likely to be crucial environment factor determining phytoplankton growth [57,58,59] and as result the Chl-a content in the Arctic region.
Phytoplankton absorption in all investigated area (the Arctic Ocean, the Barents Sea and the Norwegian Sea) in the UML and below UML co-varied with Chl-a. Despite the difference in Chl-a values between stations, the relation between Chl-a and aph(λ) was described by a power function with the same coefficients for the Arctic Ocean, the Norwegian Sea and the Barents Sea (Figure 4). Analysis of the link between phytoplankton light absorption coefficients and Chl-a revealed difference in chlorophyll-a-specific phytoplankton light absorption coefficient ( a p h * ( λ ) )) in the blue peak between layers: UML and below UML.
The A(438) coefficient in the power function (1) linking aph(438) with Chl-a in the UML and below UML were equal to 0.056 m2 mg−1 (Table 1) and 0.045 m2 mg−1 (Table 2), respectively. The difference between obtained coefficients was statistically significant (p = 0.0003). In the red peak of aph(λ) (at 678 nm), A(678) was equal to 0.024 m2 mg−1 in the UML (Table 1) and 0.023 m2 mg−1 below the UML (Table 2). The difference in A(678) between layers was insignificant (p = 0.09). The A(λ) values (Equation (1)) correspond to the a p h * ( λ ) when Chl-a was equal to 1 mg m−3. Thus, A(λ) changes reflect variability in a p h * ( λ ) ) that is highly variable due to phytoplankton acclimation to environmental factors [54,60]. In the Arctic region during the cruise (in August 2020), PAR0 was, on average, 15 ± 4.7 E m−2 day−1. PAR profiles indicated that more than 80% of the PAR0 attenuated within the UML. As a result, the PAR available for phytoplankton in the layer below the UML decreased. PARUML depends on PAR0, water transparency and the ratio between ZUML and Zeu. PARUML was equal to 7.3 ± 2.3 E m−2 day−1. Below the UML, the maximum values of PAR were 2.8 ± 1.9 E m−2 day−1 and decreased to 0.15 ± 0.047 E m−2 day−1 with deepening to the bottom boundary of the Zeu. Thus, the layers of the euphotic zone differed by almost an order of the PAR magnitude. The observed decrease in a p h * ( λ ) with depth was more pronounced in the blue peak of a p h * ( λ ) (at 438 nm) in comparison with the red peak (Figure 4). It resulted in Rph decreasing with depth within the euphotic zone. It was shown that the variability of Rph correlated with the intracellular relative (relatively to Chl-a) concentration of non-photosynthetic pigments absorbing light photons in the blue range [60].
The quota of photoprotective (non-photosynthetic) pigments increases due to algae photoacclimation to increasing PAR [61]. Moreover, it was found that, in the surface waters, an intracellular concentration of the photoprotective pigments tends to be greater at latitudes where PAR0 is relatively high [62,63]. Consequently, the differences in A(438) values reflecting differences in a p h * ( 438 ) are likely to be caused by phytoplankton acclimation (variation of pigment concentration and composition in the cells) to ambient light in the UML and below the UML [61,64]. The observed difference in A(438) and in a p h * ( 438 ) between layers within the euphotic zone was in a good agreement with results obtained in the Black Sea in summer [53,65]. In the UML of the Black Sea, the A(440) (0.076 m2 mg−1) was about 1.6 times higher than that for the deep chlorophyll maximum (0.049 m2 mg−1) (Figure 5) [53,65].
The insignificant depth-dependent variability in   a p h * ( 678 ) observed in our research was likely related to the fact that the “pigment package effect”, associated with both intracellular pigment concentration and cell size (shift in phytoplankton species composition) [54,64,66,67,68,69], was invariable with depth. A decrease in the cell size of phytoplankton in the layer below the UML could compensate for the negative effect of an increase in the intracellular pigment concentration on a p h * ( 438 ) [66]. Such an effect was observed in the Black Sea [53,65]. In general, the obtained a p h * ( λ ) values were within the range of previous reports for the Arctic region [33,37,70] and for global ocean [54].
The results showed a heterogeneity of the investigated water area in terms of spectral light absorption coefficients of optically active components and the ratio between them (Figure 3 and Figure 8). In general, the observed values of inherent optical properties of dissolved and suspended substances are in good agreement with the results obtained in the western Arctic region in summer by other researchers [30]. Total non-water absorption at 438 nm in the UML was dominated by CDOM in the Arctic Ocean and in the Barents Sea. Phytoplankton also contributed significantly and dominated in absorption in the Norwegian Sea.
The variability of the CDOM fraction in total non-water absorption was related to both the ice melting effect [37] and the phytoplankton abundance. Thus, in the most trophic Norwegian Sea, the average contribution of aCDOM(438) (40%) was relatively less than those in the Arctic Ocean (56%) and the Barents Sea (55%). Nevertheless, our results confirm earlier observations in the Arctic region that CDOM is the dominant light-absorbing component almost everywhere [21,34,35] and not co-varying with Chl-a [37,71]. Based on all the results obtained in the Barents Sea, the Norwegian Sea and the Arctic Ocean, a link between the aCDOM(438) (and aCDM(438)) and SCDOM (and SCDM) values was revealed and described by a common exponential relationship (Figure 7). The relationship between aCDOM(438) and the SCDOM is in good agreement with observations in other regions of global oceans [72]. This negative relationship between aCDOM(438) and SCDOM is associated with a change in the relative composition of CDOM, namely, in the ratio between high-molecular-weight CDOM compounds and low-molecular-weight CDOM compounds, which resulted in the change in the SCDOM [72]. The relationships between aCDOM(438) (and aCDM(438)) and the SCDOM (and SCDM) will allow retrieval of CDOM and CDM light absorption spectra based on the absorption coefficient at 438 nm. It could be used in development of a regional satellite algorithm using a three-band approach [73] successful in optically complex waters, as it was shown in the Black Sea examples [74].
The NAP contribution to total non-water absorption was generally low (less than 20%) (Figure 8). The low relative absorptions by NAP are typical for offshore regions of the world ocean which are not affected by coastal runoff [28,75]. The values of SNAP slope were in good agreement with known data for different regions of the world ocean [28], including the Arctic region [30], which indicated a high degree of conservatism of SNAP values.
A negative correlation between non-water total light absorption (phytoplankton, NAP and CDOM) in the surface layer and euphotic zone was revealed (Figure 9). The obtained relationship agreed with those for the Black Sea [76]. This relationship can be used for assessment of the euphotic zone based on the remote sensing data, if the three-band bio-optical algorithm [73] is applied for the Arctic region.
That parameterization of the light absorption by optically active components showed the high variability of CDM absorption and its domination in total non-water absorption. Consequently, Arctic waters are optically complex waters, where high uncertainty on Chl-a and IOP retrievals [16] is caused by the prevailing effect of the CDM on the remote sensing reflectance spectrum [77,78].
Due to the fact that the environment in the Arctic region is rapidly changing due to climatic effects [7,8,9,10,11,12], remote sensing data are required for operative tracking of changes in aquatic ecosystems. Using the obtained dataset, satellite data were compared with in situ data in order to assess the possibility of standard satellite products for assessment of water quality and productivity indicators in the Arctic waters. The comparison of coincident in situ measurements of Chl-a, aCDM(443) and aph(443) with MODIS (Aqua and Terra), VIIRS (Suomi-NPP and NOAA-20 (JPSS-1)) and OLCI (Sentinel-3A and Sentinel-3B) satellite data showed slight agreement, indicating that the present algorithms carried little information about water quality and productivity indicators in the Arctic region (Figure 10, Table 3).
Correct assessment of the Chl-a in optically contrasting waters could be provided by the three-band algorithm [73], separating the light absorption by CDM and by phytoplankton following retrievals of Chl-a based on revealed link between aph(λ) and Chl-a [53]. The obtained parameterization of light absorption by optically active components can be used to adapt this three-band algorithm [73] for the Arctic waters to retrieve the bio-optical properties aCDM(λ) and aph(λ). The relationship between the phytoplankton absorption coefficients and the Chl-a values revealed for the visible range with 1 nm increment (Table 1 and Table 2) can be used to retrieve Chl-a based on aph(λ). The aph(λ)-Chl-a parameterization can also be used in bio-optical models assessing downwelling irradiance and primary production using a full spectral approach [29,32].

5. Conclusions

In the Barents Sea, the Norwegian Sea and the Arctic Ocean, new data on the spatial distribution of chlorophyll a concentration (indicator of phytoplankton biomass and water productivity), spectral coefficients of light absorption by optically active components were obtained in summer (August 2020). Light absorption by optically active components was parameterized. The relationship between Chl-a and aph(λ) was revealed for the UML and the layer below the UML for the visible spectral domain (from 400 to 700 nm) with a 1 nm increment (Table 1 and Table 2). The Chl-aaph(λ) relationship was described by a power function. The coefficients of this parameterization, in particular, the A(λ) coefficient, differed between layers in the euphotic zone due to phytoplankton photoacclimation (intracellular pigment concentration and composition). It should be noted that aph(λ) parametrization was revealed for a rather wide range of Chl-a: from 0.066 to 2.2 mg m−3 in the UML and from 0.14 to 4.6 mg m3 below the UML.
Values of Zeu depended on total non-water light absorption in the surface layer, which was described by a power equation. The light absorption by phytoplankton was relatively high in the Norwegian Sea and the lowest in the Arctic Ocean. The colored dissolved organic matter mainly dominated in the total non-water absorption in the Arctic region, with the exception of the Norwegian Sea.
The OCI, OC3 and GIOP algorithms carried little information about Chl-a, aCDM(λ) and aph(λ) in the Arctic waters. The parameterization of the light absorption by optically active components will allow the adaptation of the three-band algorithm developed for the retrieval of IOPs of the Black sea [73] to the Arctic. The revealed differences in the parametrization between two layers (UML dataset and below UML dataset) within the euphotic zone will provide more correct retrieval of the water productivity indicators. The development of such algorithms is relevant for prompt assessment of the Arctic ecosystem state under global climate change. The spectral approach to the assessment of phytoplankton photosynthesis rate will allow the assessment of the impact of ice melting on primary production, which determines the productivity of the pelagic ecosystem in general.

Author Contributions

Conceptualization, T.C., T.E., V.S. and E.S.; methodology and validation, T.E., T.C., E.S., V.S. and A.S.B.; investigation, E.S., D.G. and A.K.; formal analysis and writing—original draft preparation, T.E., T.C., A.S.B., E.S., D.G. and N.M.; writing—review and editing, T.E., T.C., A.S.B. and D.G.; funding acquisition, T.C. and D.G. All authors have read and agreed to the published version of the manuscript.

Funding

The sampling of the bio-optical data in the expedition and laboratory processing of samples were conducted within the framework of the research topic of IBSS (No. 121040100327-3). The analysis of the variability of spectral light absorption and parameterization of light absorption by all optically active components was supported by the Russian Science Foundation (grant No. 22-27-00790). The shipboard PAR measurements were carried out as part of the state assignment of SIO RAS (theme No. FMWE-2021-0001), and its processing was performed with financial support through a grant from the Ministry of Education and Science of Russia (No. 075-15-2021-934) (The study of anthropogenic and natural factors of changes in the composition of air and environmental objects in Siberia and the Russian sector of the Arctic in conditions of rapid climate change was carried out using the Tu-134 Optik flying laboratory).

Data Availability Statement

Not applicable.

Acknowledgments

We are grateful to the captain and crew of the Research Vessel “Akademik Mstislav Keldysh” for their qualified help in the expeditionary work. We thank Klyuvitkin A.A. (IO RAS), and Kravchishina M.D. and Novigatsky A.N. (IO RAS), for the organization of this scientific research. Special thanks go to the Zemlianskaia E.A. for help in sampling and the laboratory processing of samples. We are grateful to anonymous referees for their constructive comments on the manuscript.

Conflicts of Interest

The authors declare no conflict of interest.

References

  1. Morley, S.A.; Abele, D.; Barnes, D.K.; Cardenas, C.A.; Cotte, C.; Gutt, J.; Henley, S.F.; Hofer, J.; Hughes, K.A.; Martin, S.M.; et al. Global drivers on Southern Ocean ecosystems: Changing physical environments and anthropogenic pressures in an Earth system. Front. Mar. Sci. 2020, 7, 547188. [Google Scholar] [CrossRef]
  2. Walsh, J.E. Intensified Warming of the Arctic: Causes and impacts on middle latitudes. Glob. Planet. Chang. 2014, 117, 52–63. [Google Scholar] [CrossRef]
  3. Jansen, E.; Christensen, J.H.; Dokken, T.; Nisancioglu, K.H.; Vinther, B.M.; Capron, E.; Guo, C.; Jensen, M.F.; Langen, P.L.; Pedersen, R.A.; et al. Past perspectives on the present era of abrupt Arctic climate change. Nat. Clim. Chang. 2020, 10, 714–721. [Google Scholar] [CrossRef]
  4. Yu, L.; Zhong, S.; Vihma, T.; Sun, B. Attribution of late summer early autumn Arctic Sea ice decline in recent decades. NPJ Clim. Atmos. Sci. 2021, 4, 3. [Google Scholar] [CrossRef]
  5. Rantanen, M.; Karpechko, A.Y.; Lipponen, A.; Nordling, K.; Hyvärinen, O.; Ruosteenoja, K.; Vihma, T.; Laaksonen, A. The Arctic has warmed nearly four times faster than the globe since 1979. Commun. Earth Environ. 2022, 3, 168. [Google Scholar] [CrossRef]
  6. Stroeve, J.C.; Serreze, M.C.; Holland, M.M.; Kay, J.E.; Malanik, J.; Barrett, A.P. The Arctic’s rapidly shrinking sea ice cover: A research synthesis. Clim. Chang. 2012, 110, 1005–1027. [Google Scholar] [CrossRef]
  7. Comiso, J.C.; Yang, J.; Honjo, S.; Krishfield, R.A. Detection of change in the Arctic using satellite and in situ data. J. Geophys. Res. 2003, 108, 3384. [Google Scholar] [CrossRef]
  8. Palm, S.P.; Strey, S.T.; Spinhirne, J.; Markus, T. Influence of Arctic Sea ice extent on polar cloud fraction and vertical structure and implications for regional climate. J. Geophys. Res. 2010, 115, D21209. [Google Scholar] [CrossRef]
  9. Bélanger, S.; Babin, M.; Tremblay, J.-É. Increasing cloudiness in Arctic damps the increase in phytoplankton primary production due to sea ice receding. Biogeosciences 2013, 10, 4087–4101. [Google Scholar] [CrossRef]
  10. Tremblay, J.-É.; Gagnon, J. The effects of irradiance and nutrient supply on the productivity of Arctic waters: A perspective on climate change. In Influence of Climate Change on the Changing Arctic and Sub-Arctic Conditions; Springer: Dordrecht, The Netherlands, 2009; pp. 73–93. [Google Scholar]
  11. Li, W.K.W.; McLaughlin, F.A.; Lovejoy, C.; Carmack, E.C. Smallest algae thrive as the Arctic Ocean freshens. Science 2009, 326, 539. [Google Scholar] [CrossRef]
  12. Arrigo, K.R.; van Dijken, G.L. Secular trends in Arctic Ocean net primary production. J. Geophys. Res. 2011, 116, C09011. [Google Scholar] [CrossRef]
  13. Chan, F.T.; Stanislawczyk, K.; Sneekes, A.C.; Dvoretsky, A.; Gollasch, S.; Minchin, D.; David, M.; Jelmert, A.; Albretsen, J.; Bailey, S.A. Climate change opens new frontiers for marine species in the Arctic: Current trends and future invasion risks. Glob. Chang. Biol. 2019, 25, 25–38. [Google Scholar] [CrossRef] [PubMed]
  14. Falkowski, P.G.; Raven, J.A. Aquatic Photosynthesis, 3rd ed.; Princeton University Press: Princeton, NJ, USA, 2007. [Google Scholar]
  15. Babin, M.; Arrigo, K.; Bélanger, S.; Forget, M.H. Ocean colour remote sensing in polar seas. IOCCG Rep. Ser. 2015, 16, 130. [Google Scholar]
  16. Melin, F.; Wang, M.; Werdell, J.; Hiroshi, K. Uncertainties in Ocean Colour Remote Sensing. IOCCG Rep. Ser. 2019, 18, 164. [Google Scholar]
  17. Demidov, A.B.; Kopelevich, O.V.; Mosharov, S.A.; Sheberstov, S.V.; Vazyulya, S.V. Modelling Kara Sea phytoplankton primary production: Development and skill assessment of regional algorithms. J. Sea Res. 2017, 125, 1–17. [Google Scholar] [CrossRef]
  18. Glukhovets, D.; Kopelevich, O.; Yushmanova, A.; Vazyulya, S.; Sheberstov, S.; Karalli, P.; Sahling, I. Evaluation of the CDOM absorption coefficient in the Arctic seas based on Sentinel-3 OLCI data. Remote Sens. 2020, 12, 3210. [Google Scholar] [CrossRef]
  19. Glukhovets, D.; Sheberstov, S.; Vazyulya, S.; Yushmanova, A.; Salyuk, P.; Sahling, I.; Aglova, E. Influence of the accuracy of chlorophyll-retrieval algorithms on the estimation of solar radiation absorbed in the Barents Sea. Remote Sens. 2022, 14, 4995. [Google Scholar] [CrossRef]
  20. Yushmanova, A.V.; Vazyulya, S.V. Validation of satellite algorithms for calculating the absorption coefficient of colored dissolved organic matter in the Barents Sea. Curr. Probl. Remote Sens. Earth Space 2022, 19, 28–39. [Google Scholar] [CrossRef]
  21. Matsuoka, A.; Huot, Y.; Shimada, K.; Saitoh, S.-I.; Babin, M. Bio-optical characteristics of the western Arctic Ocean: Implications for ocean color algorithms. Can. J. Remote Sens. 2007, 33, 503–518. [Google Scholar] [CrossRef]
  22. Mitchell, B.G. Predictive Bio-optical relationships for polar oceans and marginal ice zones. J. Mar. Syst. 1992, 3, 91–105. [Google Scholar] [CrossRef]
  23. Glukhovets, D.I.; Goldin, Y.A. Surface desalinated layer distribution in the Kara Sea determined by shipboard and satellite data. Oceanologia 2020, 62, 364–373. [Google Scholar] [CrossRef]
  24. Mitchell, B.G.; Kiefer, D. A Chlorophyll α specific absorption and fluorescence excitation spectra for light-limited phytoplankton. Deep Sea Res. Part A Oceanogr. Res. Pap. 1988, 35, 639–663. [Google Scholar] [CrossRef]
  25. Wang, J.; Cota, G.F.; Ruble, D.A. Absorption and backscattering in the Beaufort and Chukchi Seas. J. Geophys. Res. Oceans 2005, 110, 1–12. [Google Scholar] [CrossRef]
  26. Mobley, C.D. (Ed.) The Oceanic Optics Book; International Ocean Colour Co-ordinating Group (IOCCG): Dartmouth, NS, Canada, 2022; 924p. [Google Scholar] [CrossRef]
  27. Kopelevich, O.V.; Burenkov, V.I.; Ershova, S.V.; Sheberstov, S.V.; Evdoshenko, M.A. Application of SeaWiFS Data for Studying Variability of bio-optical characteristics in the Barents, Black and Caspian Seas. Deep Sea Res. Part II Top. Stud. Oceanogr. 2004, 51, 1063–1091. [Google Scholar] [CrossRef]
  28. Babin, M.; Stramski, D.; Ferrari, G.M.; Claustre, H.; Bricaud, A.; Obolensky, G.; Hoepffner, N. Variations in the light absorption coefficients of phytoplankton, nonalgal particles, and dissolved organic matter in coastal waters around Europe. J. Geophys. Res. Oceans 2003, 108, C7. [Google Scholar] [CrossRef]
  29. Churilova, T.; Suslin, V.; Krivenko, O.; Efimova, T.; Moiseeva, N. Spectral approach to assessment of phytoplankton photosynthesis rate in the Black Sea based on satellite information: Methodological aspects of the regional model development. J. Sib. Fed. Univ. Biol. 2016, 9, 367–384. (In Russian) [Google Scholar] [CrossRef]
  30. Matsuoka, A.; Hill, V.; Huot, Y.; Babin, M.; Bricaud, A. Seasonal variability in the light absorption properties of Western Arctic waters: Parameterization of the individual components of absorption for ocean color applications. J. Geophys. Res. Oceans 2011, 116, C2. [Google Scholar] [CrossRef]
  31. Kirk, J.T.O. Light and Photosynthesis in Aquatic Ecosystems; Cambridge University Press: Cambridge, UK, 1994. [Google Scholar]
  32. Wang, J.; Cota, J.F. Remote-sensing reflectance in the Beaufort and Chukchi Seas: Observations and models. Appl. Opt. 2003, 42, 2754–2765. [Google Scholar] [CrossRef]
  33. Brunelle, C.B.; Larouche, P.; Gosselin, M. Variability of phytoplankton light absorption in Canadian Arctic Seas. J. Geophys. Res. Oceans 2012, 117, C9. [Google Scholar] [CrossRef]
  34. Mustapha, S.B.; Bélanger, S.; Larouche, P. Evaluation of ocean color algorithms in the Southeastern Beaufort Sea, Canadian Arctic: New parameterization using SeaWiFS, MODIS, and MERIS spectral bands. Can. J. Remote Sens. 2012, 38, 535–556. [Google Scholar] [CrossRef]
  35. Gonçalves-Araujo, R.; Rabe, B.; Peeken, I.; Bracher, A. High colored dissolved organic matter (CDOM) absorption in surface waters of the Central-Eastern Arctic Ocean: Implications for biogeochemistry and ocean color algorithms. PLoS ONE 2018, 13, e0190838. [Google Scholar] [CrossRef]
  36. Neukermans, G.; Reynolds, R.A.; Stramski, D. Contrasting Inherent optical properties and particle characteristics between an under-ice phytoplankton bloom and open water in the Chukchi Sea. Deep Sea Res. Part II Top. Stud. Oceanogr. 2014, 105, 59–73. [Google Scholar] [CrossRef]
  37. Bélanger, S.; Cizmeli, S.A.; Ehn, J.; Matsuoka, A.; Doxaran, D.; Hooker, S.; Babin, M. Light absorption and partitioning in Arctic Ocean surface waters: Impact of multiyear ice melting. Biogeosciences 2013, 10, 6433–6452. [Google Scholar] [CrossRef]
  38. Sánchez-García, L.; Alling, V.; Pugach, S.; Vonk, J.; van Dongen, B.; Humborg, C.; Dudarev, O.; Semiletov, I.; Gustafsson, Ö. Inventories and behavior of particulate organic carbon in the Laptev and East Siberian Seas. Glob. Biogeochem. Cycles 2011, 25, 1–13. [Google Scholar] [CrossRef]
  39. Fichot, C.G.; Kaiser, K.; Hooker, S.B.; Amon, R.M.W.; Babin, M.; Bélanger, S.; Walker, S.A.; Benner, R. Pan-Arctic distributions of continental runoff in the Arctic Ocean. Sci. Rep. 2013, 3, 1053. [Google Scholar] [CrossRef] [PubMed]
  40. Zatsepin, A.G.; Zavialov, P.O.; Kremenetskiy, V.V.; Poyarkov, S.G.; Soloviev, D.M. The upper desalinated layer in the Kara Sea. Oceanology 2010, 50, 657–667. [Google Scholar] [CrossRef]
  41. Glukhovets, D. An Overview of the special issue on seawater bio-optical characteristics from satellite ocean color data. Remote Sens. 2023, 15, 1094. [Google Scholar] [CrossRef]
  42. Klyuvitkin, A.A.; Politova, N.V.; Novigatsky, A.N.; Kravchishina, M.D. Studies of the European Arctic on cruise 80 of the R/V Akademik Mstislav Keldysh. Oceanology 2021, 61, 139–141. [Google Scholar] [CrossRef]
  43. Babin, M.; Morel, A.; Claustre, H.; Bricaud, A.; Kolber, Z.; Falkowski, P.G. Nitrogen- and irradiance-dependent variations of the maximum quantum yield of carbon fixation in eutrophic, mesotrophic and oligotrophic marine systems. Deep Sea Res. Part I Oceanogr. Res. Pap. 1996, 43, 1241–1272. [Google Scholar] [CrossRef]
  44. Jeffrey, S.W.; Humphrey, G.F. New Spectrophotometric equations for determining chlorophylls a, b, c1 and c2 in higher plants, algae and natural phytoplankton. Biochem. Physiol. Pflanz. 1975, 167, 191–194. [Google Scholar] [CrossRef]
  45. Lorenzen, C.J. Determination of chlorophyll and pheo-pigments: Spectrophotometric equations. Limnol. Oceanogr. 1967, 12, 343–346. [Google Scholar] [CrossRef]
  46. Neeley, A.R.; Mannino, A.; Boss, E.; D’sa, E.J.; Freeman, S.; Fry, E.; Mueller, J.L.; Pegau, S.; Reynolds, R.A.; Roesler, C.; et al. Inherent Optical Property Measurements and Protocols: Absorption Coefficient (vl.0); International Ocean-Colour Coordinating Group: Dartmouth, NS, Canada, 2018; Volume 1. [Google Scholar]
  47. Kishino, M.; Takahashi, M.; Okami, N.; Ichimura, S. Estination of the spectral absorption coefficients of phytoplankton in the sea. Bull. Mar. Sci. 1985, 37, 634–642. [Google Scholar]
  48. Mitchell, B.G. Algorithms for determining the absorption coefficient for aquatic particulates using the quantitative filter technique. Ocean. Optics X 1990, 1302, 137–148. [Google Scholar] [CrossRef]
  49. Hu, C.; Lee, Z.; Franz, B. Chlorophyll a algorithms for oligotrophic oceans: A novel approach based on three-band reflectance difference. J. Geophys. Res. Oceans 2012, 117, C1. [Google Scholar] [CrossRef]
  50. O’Reilly, J.E. SeaWiFS Postlaunch calibration and validation analyses. NASA Tech. Memo. 2000, 11, 49. [Google Scholar]
  51. Inherent Optical Properties (IOPs). Available online: https://oceancolor.gsfc.nasa.gov/atbd/giop/ (accessed on 14 April 2023).
  52. Franz, B.A.; Werdell, P.J. A Generalized framework for modeling of inherent optical properties in remote sensing applications. In Proceedings of the Ocean Optics XX Conference, Anchorage, AK, USA, 27 September–1 October 2010; p. 13. [Google Scholar]
  53. Churilova, T.; Suslin, V.; Krivenko, O.; Efimova, T.; Moiseeva, N.; Mukhanov, V.; Smirnova, L. Light absorption by phytoplankton in the upper mixed layer of the Black Sea: Seasonality and parametrization. Front. Mar. Sci. 2017, 4, 90. [Google Scholar] [CrossRef]
  54. Bricaud, A.; Babin, M.; Morel, A.; Claustre, H. Variability in the chlorophyll-specific absorption coefficients of natural phytoplankton: Analysis and parameterization. J. Geophys. Res. 1995, 100, 13321–13332. [Google Scholar] [CrossRef]
  55. Kopelevich, O.V.; Sahling, I.V.; Vazyulya, S.V.; Glukhovets, D.I.; Sheberstov, S.V.; Burenkov, V.I.; Karalli, P.G.; Yushmanova, A.V. Bio-Optical Characteristics of the Seas, Surrounding the Western Part of Russia, from Data of the Satellite Ocean Color Scanners of 1998–2017; OOO VASH FORMAT: Moscow, Russia, 2018. [Google Scholar]
  56. Ardyna, M.; Babin, M.; Gosselin, M.; Devred, E.; Bélanger, S.; Matsuoka, A.; Tremblay, J.E. parameterization of vertical chlorophyll a in the Arctic Ocean: Impact of the subsurface chlorophyll maximum on regional, seasonal, and annual primary production estimates. Biogeosciences 2013, 10, 4383–4404. [Google Scholar] [CrossRef]
  57. Tilzer, M.M.; Elbrächter, M.; Gieskes, W.W.; Beese, B. Light-temperature interactions in the control of photosynthesis in Antarctic phytoplankton. Polar Biol. 1986, 5, 105–111. [Google Scholar] [CrossRef]
  58. Sosik, H.M.; Mitchell, B.G. Effects of temperature on growth, light absorption, and quantum yield in Dunaliella tertiolecta (chlorophyceae). J. Phycol. 1994, 30, 833–840. [Google Scholar] [CrossRef]
  59. Berges, J.; Varela, D.; Harrison, P. Effects of temperature on growth rate, cell composition and nitrogen metabolism in the marine diatom Thalassiosira pseudonana (Bacillariophyceae). Mar. Ecol. Prog. Ser. 2002, 225, 139–146. [Google Scholar] [CrossRef]
  60. Lutz, V.; Sathyendranath, S.; Head, E.; Li, W. Variability in pigment composition and optical characteristics of phytoplankton in the Labrador Sea and the Central North Atlantic. Mar. Ecol. Prog. Ser. 2003, 260, 1–18. [Google Scholar] [CrossRef]
  61. Grant, C.; Louda, J. Microalgal pigment ratios in relation to light intensity: Implications for chemotaxonomy. Aquat. Biol. 2010, 11, 127–138. [Google Scholar] [CrossRef]
  62. Barlow, R.; Aiken, J.; Moore, G.; Holligan, P.; Lavender, S. pigment adaptations in surface phytoplankton along the eastern boundary of the Atlantic Ocean. Mar. Ecol. Prog. Ser. 2004, 281, 13–26. [Google Scholar] [CrossRef]
  63. Sathyendranath, S.; Stuart, V.; Platt, T.; Bouman, H.; Ulloa, O.; Maass, H. Remote sensing of ocean colour: Towards algorithms for retrieval of pigment composition. Indian J. Mar. Sci. 2005, 34, 333–340. [Google Scholar]
  64. Fujiki, T. Variability in chlorophyll a specific absorption coefficient in marine phytoplankton as a function of cell size and irradiance. J. Plankton Res. 2002, 24, 859–874. [Google Scholar] [CrossRef]
  65. Churilova, T.; Suslin, V.; Sosik, H.M.; Efimova, T.; Moiseeva, N.; Moncheva, S.; Mukhanov, V.; Rylkova, O.; Krivenko, O. Phytoplankton light absorption in the deep chlorophyll maximum layer of the Black Sea. Eur. J. Remote Sens. 2019, 52, 123–136. [Google Scholar] [CrossRef]
  66. Morel, A.; Bricaud, A. Theoretical results concerning light absorption in a discrete medium, and application to specific absorption of phytoplankton. Deep Sea Res. Part A Oceanogr. Res. Pap. 1981, 28, 1375–1393. [Google Scholar] [CrossRef]
  67. Millán-Núñez, E.; Sieracki, M.E.; Millán-Núñez, R.; Lara-Lara, J.R.; Gaxiola-Castro, G.; Trees, C.C. Specific absorption coefficient and phytoplankton biomass in the southern region of the California current. Deep Sea Res. Part II Top. Stud. Oceanogr. 2004, 51, 817–826. [Google Scholar] [CrossRef]
  68. Pautova, L.; Silkin, V.; Kravchishina, M.; Klyuvitkin, A.; Kudryavtseva, E.; Glukhovets, D.; Chultsova, A.; Politova, N. Phytoplankton of the high-latitude Arctic: Intensive growth large diatoms porosira glacialis in the Nansen Basin. J. Mar. Sci. Eng. 2023, 11, 453. [Google Scholar] [CrossRef]
  69. Kudryavtseva, E.A.; Kravchishina, M.D.; Pautova, L.A.; Rusanov, I.I.; Silkin, V.A.; Glukhovets, D.I.; Torgunova, N.I.; Netsvetaeva, O.P.; Politova, N.V.; Klyuvitkin, A.A.; et al. Size structure of primary producers in the marginal ice zone of the European Arctic in summer. Dokl. Earth Sci. 2022, 507, S313–S318. [Google Scholar] [CrossRef]
  70. Glukhovets, D.I.; Kopelevich, O.V.; Sahling, I.V.; Artemiev, V.A.; Pautova, L.A.; Lange, E.K.; Kravchishina, M.D. Biooptical characteristics of the surface layer of the Baltic, Norwegian, and Barents Seas in summer 2014–2016 from shipboard and satellite data. Oceanology 2017, 57, 410–418. [Google Scholar] [CrossRef]
  71. Matsuoka, A.; Babin, M.; Doxaran, D.; Hooker, S.B.; Mitchell, B.G.; Bélanger, S.; Bricaud, A. A Synthesis of light absorption properties of the Arctic Ocean: Application to semianalytical estimates of dissolved organic carbon concentrations from space. Biogeosciences 2014, 11, 3131–3147. [Google Scholar] [CrossRef]
  72. Nelson, N.B.; Siegel, D.A. The global distribution and dynamics of chromophoric dissolved organic matter. Annu. Rev. Mar. Sci. 2013, 5, 447–476. [Google Scholar] [CrossRef]
  73. Suslin, V.; Churilova, T. A regional algorithm for separating light absorption by chlorophyll-a and coloured detrital matter in the Black Sea, using 480–560 nm bands from ocean colour scanners. Int. J. Remote Sens. 2016, 37, 4380–4400. [Google Scholar] [CrossRef]
  74. Suslin, V.; Pryahina, S.; Churilova, T.; Slabakova, V. The Black Sea IOPs based on SeaWiFS data. In Proceedings of the 22nd International Symposium on Atmospheric and Ocean Optics: Atmospheric Physics, Tomsk, Russia, 30 June–3 July 2016; p. 1003531. [Google Scholar]
  75. Bricaud, A.; Morel, A.; Babin, M.; Allali, K.; Claustre, H. Variations of light absorption by suspended particles with chlorophyll a concentration in oceanic (case 1) waters: Analysis and implications for bio-optical models. J. Geophys. Res. Oceans 1998, 103, 31033–31044. [Google Scholar] [CrossRef]
  76. Churilova, T.Y.; Buchelnikova, V.A.; Efimova, T.V.; Moiseeva, N.A.; Skorokhod, E.Y. Spectral Bio-Optical Properties and Phytoplankton Productivity in the Black Sea Coastal Waters Near Sevastopol. In Proceedings of the XI All-Russian Conference with International Participation “Current Problems in Optics of Natural Waters”, St. Petersburg, Russia, 29 September–1 October 2021; pp. 88–93. [Google Scholar]
  77. Mobley, C.D.; Stramski, D.; Bissett, W.P.; Boss, E. Optical modeling of ocean waters: Is the Case 1–Case 2 classification still useful? Oceanography 2004, 17, 60–67. [Google Scholar] [CrossRef]
  78. Schofield, O.; Arnone, R.A.; Bissett, W.P.; Dickey, T.D.; Davis, C.O.; Finkel, Z.; Oliver, M.; Moline, M.A. Watercolors in the coastal zone: What can we see? Oceanography 2004, 17, 24–31. [Google Scholar] [CrossRef]
Figure 1. The map of location of bio-optical stations in the Norwegian Sea (circles), the Barents Sea (triangles) and the Arctic Ocean (squares) in the 80th cruise of R/V “Akademik Mstislav Keldysh”, August 2020.
Remotesensing 15 04346 g001
Figure 2. Examples of vertical profiles of temperature (T, °C, blue line), density (ρ, kg∙m−3, black line), photosynthetically available radiation (PAR, μE m−2 s−1, red line) and the sum of chlorophyll a and phaeopigment (Chl-a, mg m−3, green circles) in August 2020.
Remotesensing 15 04346 g002
Figure 3. Spectral light absorption coefficients of phytoplankton (aph(λ), m−1), non-algal particles (aNAP(λ), m−1) and colored dissolved organic matter (aCDOM(λ), m−1), measured in August 2020 in the Norwegian Sea (red line), the Barents Sea (green line), the Arctic Ocean (blue line).
Remotesensing 15 04346 g003
Figure 4. Dependence of light absorption coefficients of phytoplankton at 438 nm (aph(438), m−1) and 678 nm (aph(678), m−1) on chlorophyll a concentration in sum with phaeopigments (Chl-a, mg m−3) in the Norwegian Sea (circles), the Barents Sea (triangles) and the Arctic Ocean (squares) in August 2020.
Remotesensing 15 04346 g004
Figure 5. Spectral values of the constants (a) A(λ) (m2 mg−1) and (b) B(λ) obtained when fitting the variations of phytoplankton light absorption coefficients (aph(λ)) vs. the sum of chlorophyll a and phaeopigments concentration (Chl-a) to power laws of the form aph(λ) = A(λ) × (Chl-a)B(λ): upper mixed layer (black line) and below upper mixed layer (within euphotic zone) of the Arctic region in summer (green line) in comparison with upper mixed layer of the Black Sea in summer (red line) and in winter (blue line) [53], and global ocean data (gray line) following Bricaud et al. (1995) [54].
Remotesensing 15 04346 g005
Figure 6. Dependence of light absorption coefficients of colored dissolved organic matter at 438 nm (aph(438), m−1) on chlorophyll a concentration in sum with phaeopigments (Chl-a, mg m−3) in the Norwegian Sea (circles), the Barents Sea (triangles) and the Arctic Ocean (squares) in August 2020.
Remotesensing 15 04346 g006
Figure 7. Dependence of (a) spectral slope of colored dissolved organic matter (SCDOM, nm−1) on CDOM light absorption coefficient at 438 nm (aCDOM(438), m−1) and (b) spectral slope of colored detrital maters (SCDM, nm−1) on CDM light absorption coefficient at 438 nm (aCDM(438), m−1): in the Norwegian Sea (circles), the Barents Sea (triangles) and the Arctic Ocean (squares) from in August 2020.
Remotesensing 15 04346 g007
Figure 8. Ternary plot illustrating the relative contribution of phytoplankton (aph(438) and aph(490)), non-living suspended matter (aNAP(438) and aNAP(490)) and colored dissolved organic matter (aCDOM(438) and aCDOM(490)) to the total light absorption at wavelengths of 438 nm and 490 nm in the Norwegian Sea (circles), the Barents Sea (triangles) and the Arctic Ocean (squares) in August 2020.
Remotesensing 15 04346 g008
Figure 9. The influence of the total non-water light absorption by suspended and dissolved matter at wavelengths of 438 nm (atot(438), m−1) and 490 nm (atot(490), m−1) in the surface layer in August 2020 on the photosynthesis zone (Zeu, m): circles—the Norwegian Sea, triangles—the Barents Sea, squares—the Arctic Ocean.
Remotesensing 15 04346 g009
Figure 10. (a) Comparison of chlorophyll-a concentration (Chl-a), (b) light absorption coefficient by phytoplankton at 443 nm (aph(443)), (c) light absorption coefficient by colored detrital matter at 443 nm (aCDM(443)) and (d) total non-water light absorption at 443 nm (atot(443) = aCDM(443) + aph(443)) retrieved by satellite algorithms with in situ data.
Remotesensing 15 04346 g010
Table 1. Spectral values of the constants A(λ) and B(λ) obtained when fitting the variations of aph(λ) vs. the sum of chlorophyll a and phaeopigment concentration (Chl-a) to power laws of the form aph(λ) = A(λ) × (Chl-a)B(λ) in the UML of the Arctic region in summer.
λA(λ)B(λ)λA(λ)B(λ)λA(λ)B(λ)λA(λ)B(λ)
4000.03670.77474760.04380.97755510.00760.89666260.00710.8567
4010.03710.77804770.04310.98195520.00730.89476270.00720.8585
4020.03760.78684780.04240.98395530.00710.88536280.00730.8547
4030.03810.78704790.04150.98585540.00690.87976290.00740.8627
4040.03880.79404800.04080.98885550.00670.88266300.00750.8632
4050.03930.79634810.04010.99125560.00650.88016310.00760.8660
4060.04000.80154820.03940.99545570.00630.87326320.00770.8656
4070.04060.80894830.03860.99545580.00620.86476330.00780.8718
4080.04140.80924840.03790.99565590.00600.86426340.00790.8710
4090.04210.81194850.03710.99805600.00590.85596350.00800.8731
4100.04280.81334860.03630.99955610.00570.85236360.00810.8775
4110.04340.81724870.03560.99925620.00560.84726370.00820.8810
4120.04380.82074880.03480.99815630.00550.85036380.00830.8869
4130.04450.82074890.03400.99785640.00540.85436390.00830.8876
4140.04490.82324900.03330.99815650.00540.84366400.00840.8948
4150.04530.82674910.03250.99615660.00530.84096410.00840.8971
4160.04580.82694920.03170.99565670.00530.84556420.00840.9046
4170.04600.82794930.03090.99345680.00530.84666430.00840.9000
4180.04640.82874940.03020.99185690.00530.84596440.00840.9043
4190.04660.83234950.02940.98975700.00530.84826450.00840.9105
4200.04690.83204960.02860.98445710.00530.84596460.00840.9133
4210.04720.83284970.02790.98455720.00530.85006470.00840.9097
4220.04710.82714980.02720.98235730.00540.84856480.00840.9082
4230.04760.83294990.02650.98185740.00540.84996490.00840.9040
4240.04790.84125000.02580.97765750.00550.85306500.00850.8998
4250.04840.84025010.02510.97765760.00560.85446510.00850.8943
4260.04880.83885020.02450.97695770.00560.85846520.00870.8917
4270.04950.84355030.02390.97555780.00570.85256530.00880.8846
4280.05000.84425040.02330.97165790.00580.85766540.00900.8799
4290.05070.84255050.02270.97245800.00590.86626550.00930.8648
4300.05130.84385060.02220.96855810.00600.86676560.00970.8572
4310.05210.84805070.02160.97115820.00610.86736570.01020.8560
4320.05280.85315080.02120.97075830.00620.87356580.01070.8520
4330.05350.85285090.02070.97005840.00630.87726590.01140.8436
4340.05420.85025100.02020.96915850.00640.88406600.01220.8432
4350.05460.85785110.01980.96995860.00650.88436610.01300.8420
4360.05500.85455120.01930.97285870.00660.89386620.01400.8446
4370.05530.85985130.01890.97445880.00660.89616630.01510.8465
4380.05550.85745140.01850.97595890.00670.90136640.01620.8506
4390.05550.86205150.01810.97725900.00670.90326650.01740.8577
4400.05520.86535160.01770.97325910.00670.90586660.01850.8638
4410.05510.86505170.01730.97745920.00670.90776670.01970.8701
4420.05460.86985180.01700.97655930.00670.91026680.02080.8719
4430.05410.87255190.01660.97855940.00670.91286690.02180.8825
4440.05370.87305200.01630.97825950.00660.91386700.02280.8832
4450.05300.87755210.01590.97655960.00650.90796710.02350.8887
4460.05250.88465220.01560.97525970.00640.90766720.02410.8919
4470.05190.88645230.01530.97695980.00640.91106730.02450.8962
4480.05160.89415240.01490.97665990.00630.90496740.02460.9013
4490.05110.89595250.01460.97896000.00620.90356750.02450.8996
4500.05070.90135260.01430.97656010.00610.90486760.02420.9006
4510.05040.90275270.01400.97606020.00610.89836770.02370.9005
4520.05020.91085280.01370.97326030.00600.89456780.02290.9029
4530.05010.91295290.01330.97336040.00600.88976790.02200.9012
4540.04990.91215300.01310.96786050.00590.88516800.02070.9007
4550.04990.92045310.01270.96356060.00590.88096810.01940.8911
4560.05000.92285320.01240.95956070.00590.88156820.01790.8855
4570.04990.92235330.01210.96216080.00600.87846830.01630.8736
4580.05000.92545340.01180.95726090.00600.87846840.01470.8636
4590.05000.92835350.01150.95646100.00600.87936850.01310.8527
4600.05000.93205360.01130.95246110.00610.86736860.01160.8395
4610.05000.93355370.01100.94816120.00620.86866870.01020.8256
4620.04980.93785380.01070.94706130.00630.86366880.00890.8169
4630.04980.93845390.01050.93996140.00630.85916890.00780.8001
4640.04970.93925400.01020.93536150.00640.86216900.00670.7887
4650.04950.94315410.00990.93246160.00650.85886910.00580.7776
4660.04920.94445420.00970.92976170.00650.85996920.00500.7628
4670.04890.94645430.00940.92896180.00660.85856930.00430.7521
4680.04850.95125440.00920.92586190.00670.86116940.00380.7460
4690.04810.95225450.00900.91346200.00680.86026950.00330.7305
4700.04760.95905460.00870.91466210.00680.85796960.00290.7268
4710.04700.95855470.00850.90946220.00690.85526970.00260.7201
4720.04650.96345480.00830.90686230.00690.85846980.00230.7087
4730.04580.96655490.00800.90036240.00700.85636990.00200.6984
4740.04520.97035500.00780.89766250.00710.85347000.00180.6933
4750.04450.9739
Table 2. Spectral values of the constants A(λ) and B(λ) obtained when fitting the variations of aph(λ) vs. the sum of chlorophyll a and phaeopigment concentration (Chl-a) to power laws of the form aph(λ) = A(λ) × (Chl-a)B(λ) below UML (within euphotic zone) of the Arctic region in summer.
λA(λ)B(λ)λA(λ)B(λ)λA(λ)B(λ)λA(λ)B(λ)
4000.03110.99754760.03740.85715510.00850.96516260.00711.0237
4010.03150.99564770.03690.85685520.00820.97076270.00731.0166
4020.03210.98774780.03650.85035530.00800.97996280.00731.0143
4030.03250.98814790.03600.84815540.00770.98576290.00741.0114
4040.03290.98534800.03550.84405550.00750.98946300.00751.0078
4050.03350.98054810.03500.84145560.00730.99666310.00771.0011
4060.03410.97554820.03450.83675570.00711.00166320.00770.9992
4070.03460.97374830.03400.83485580.00691.00796330.00780.9933
4080.03520.97024840.03350.83125590.00661.02086340.00800.9868
4090.03570.96774850.03300.82835600.00641.02776350.00800.9870
4100.03620.96324860.03240.82715610.00621.03706360.00810.9791
4110.03670.95954870.03180.82425620.00611.04406370.00820.9741
4120.03710.95784880.03130.82165630.00601.04936380.00820.9697
4130.03750.95414890.03070.82115640.00581.05886390.00830.9628
4140.03780.95294900.03010.81975650.00571.06186400.00830.9575
4150.03820.94804910.02950.81845660.00561.06726410.00840.9497
4160.03840.94864920.02900.81935670.00561.07226420.00840.9458
4170.03870.94554930.02840.81935680.00551.07756430.00830.9421
4180.03890.94374940.02780.82035690.00551.08326440.00840.9368
4190.03900.94144950.02720.82025700.00541.08576450.00840.9344
4200.03920.94044960.02660.82145710.00541.08716460.00830.9327
4210.03940.93434970.02600.82295720.00541.09016470.00830.9305
4220.03980.93534980.02550.82505730.00551.08776480.00830.9313
4230.03980.93754990.02500.82405740.00551.09036490.00830.9334
4240.04010.93275000.02440.82695750.00551.09296500.00840.9354
4250.04030.93215010.02390.82845760.00561.09306510.00850.9387
4260.04070.92775020.02340.83035770.00561.09246520.00860.9424
4270.04100.92735030.02300.83105780.00571.08916530.00880.9470
4280.04130.92635040.02250.83245790.00581.08586540.00900.9539
4290.04170.92645050.02200.83495800.00591.08506550.00930.9575
4300.04220.92345060.02160.83605810.00591.08426560.00960.9611
4310.04260.92145070.02120.83725820.00611.08106570.01010.9635
4320.04340.91415080.02080.83835830.00621.07766580.01070.9635
4330.04370.91555090.02040.84115840.00631.07276590.01130.9639
4340.04410.91315100.02010.84245850.00631.07146600.01200.9619
4350.04450.90805110.01970.84265860.00641.06736610.01280.9563
4360.04450.91505120.01940.84255870.00651.06286620.01370.9513
4370.04490.90885130.01910.84515880.00661.06056630.01470.9435
4380.04480.91095140.01880.84555890.00661.05776640.01580.9362
4390.04500.90705150.01840.84695900.00671.05376650.01680.9283
4400.04470.90785160.01810.84765910.00671.05126660.01790.9219
4410.04460.90805170.01780.84945920.00671.04916670.01900.9122
4420.04430.90685180.01750.85095930.00671.04676680.02000.9054
4430.04390.90845190.01720.85195940.00671.04766690.02090.8975
4440.04350.90975200.01700.85215950.00661.04536700.02160.8920
4450.04310.91125210.01670.85425960.00651.04746710.02230.8878
4460.04270.90945220.01640.85505970.00651.04676720.02270.8840
4470.04230.91045230.01610.85845980.00641.04866730.02310.8785
4480.04190.91145240.01580.86025990.00631.04996740.02310.8784
4490.04140.91475250.01560.86106000.00621.05016750.02300.8753
4500.04110.91515260.01530.86416010.00611.05336760.02270.8743
4510.04090.91505270.01500.86636020.00611.05266770.02220.8740
4520.04070.91545280.01470.86856030.00611.05416780.02150.8751
4530.04060.91575290.01440.87186040.00601.05456790.02070.8757
4540.04050.91735300.01410.87396050.00601.05456800.01960.8810
4550.04060.91295310.01380.87906060.00601.05336810.01840.8838
4560.04040.91725320.01360.88026070.00601.05306820.01710.8921
4570.04050.91325330.01330.88396080.00611.05366830.01580.8991
4580.04050.91245340.01300.88916090.00611.05336840.01430.9083
4590.04050.91365350.01270.89266100.00621.04976850.01300.9178
4600.04050.91175360.01240.89676110.00621.04716860.01160.9315
4610.04060.90795370.01220.89966120.00631.04596870.01030.9424
4620.04060.90735380.01190.90416130.00641.04436880.00910.9572
4630.04060.90395390.01160.90966140.00651.04086890.00800.9731
4640.04050.90255400.01140.91286150.00651.03886900.00700.9898
4650.04050.89665410.01110.91786160.00661.03986910.00611.0093
4660.04030.89645420.01080.92246170.00671.03646920.00531.0270
4670.04020.89155430.01050.92776180.00671.03376930.00461.0506
4680.04000.88865440.01030.93016190.00681.03456940.00401.0750
4690.03980.88455450.01000.93676200.00691.02876950.00351.0980
4700.03960.88215460.00980.94226210.00691.03026960.00311.1203
4710.03930.87725470.00950.94516220.00691.02896970.00271.1443
4720.03900.87285480.00920.95056230.00701.02996980.00241.1767
4730.03860.86965490.00900.95246240.00701.02546990.00221.1987
4740.03820.86645500.00870.95946250.00711.02267000.00191.2246
4750.03780.8622
Table 3. Validation of satellite retrieval Chl-a and light absorption coefficients: light absorption by phytoplankton pigments (aph_443) and colored detrital matter at 443 nm (adg_443). The bold font indicates the best results for each statistical metric.
Statistical MetricMODISVIIRSOLCI
chlor_achl_ocxaph_443adg_443chlor_achl_ocxaph_443adg_443chlor_aaph_443adg_443
n2222221621212121202020
Bias1.01.01.40.200.660.740.580.340.880.890.33
MAE1.51.52.05.02.22.02.73.01.62.03.1
MdAD1.31.31.55.72.02.12.42.61.51.82.4
RMSE0.200.200.030.090.480.450.030.070.260.020.08
Disclaimer/Publisher’s Note: The statements, opinions and data contained in all publications are solely those of the individual author(s) and contributor(s) and not of MDPI and/or the editor(s). MDPI and/or the editor(s) disclaim responsibility for any injury to people or property resulting from any ideas, methods, instructions or products referred to in the content.

