
Retrieving Surface Deformation of Mining Areas Using ZY-3 Stereo Imagery and DSMs

Abstract
:
1. Introduction
2. Study Area and Data
2.1. Study Area
2.2. Data
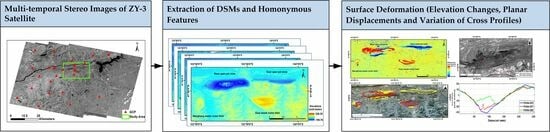
3. Methodology
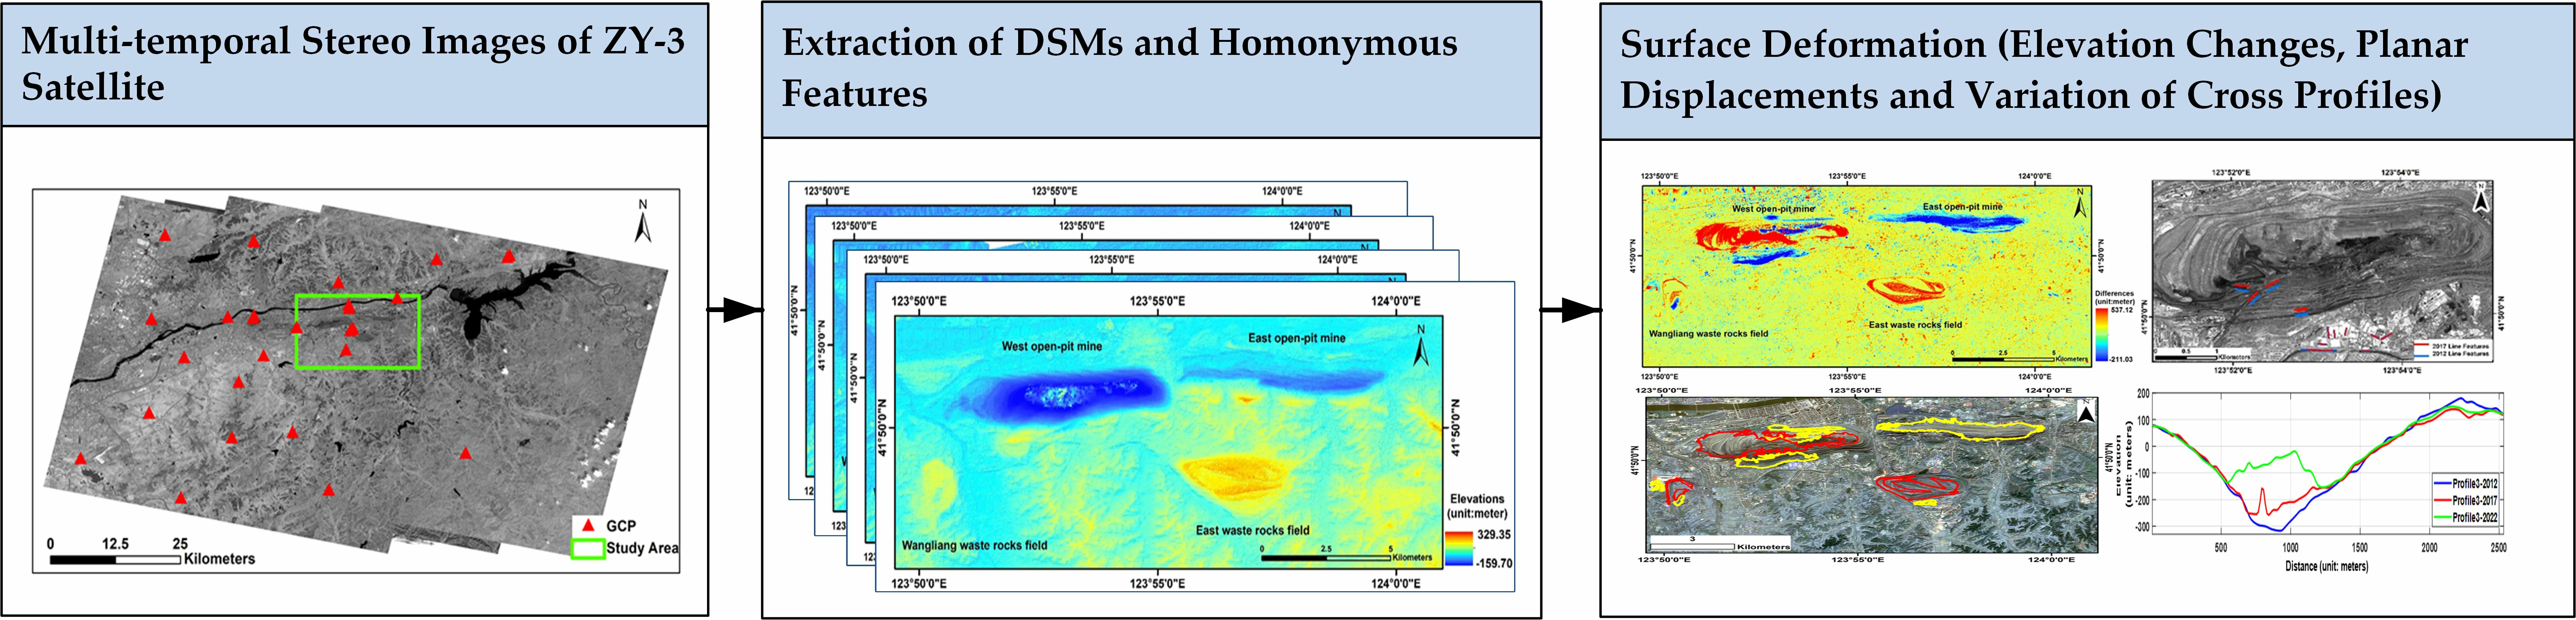
3.1. DSM and DOM Generation
3.2. Elevation Changes from Difference of DSMs
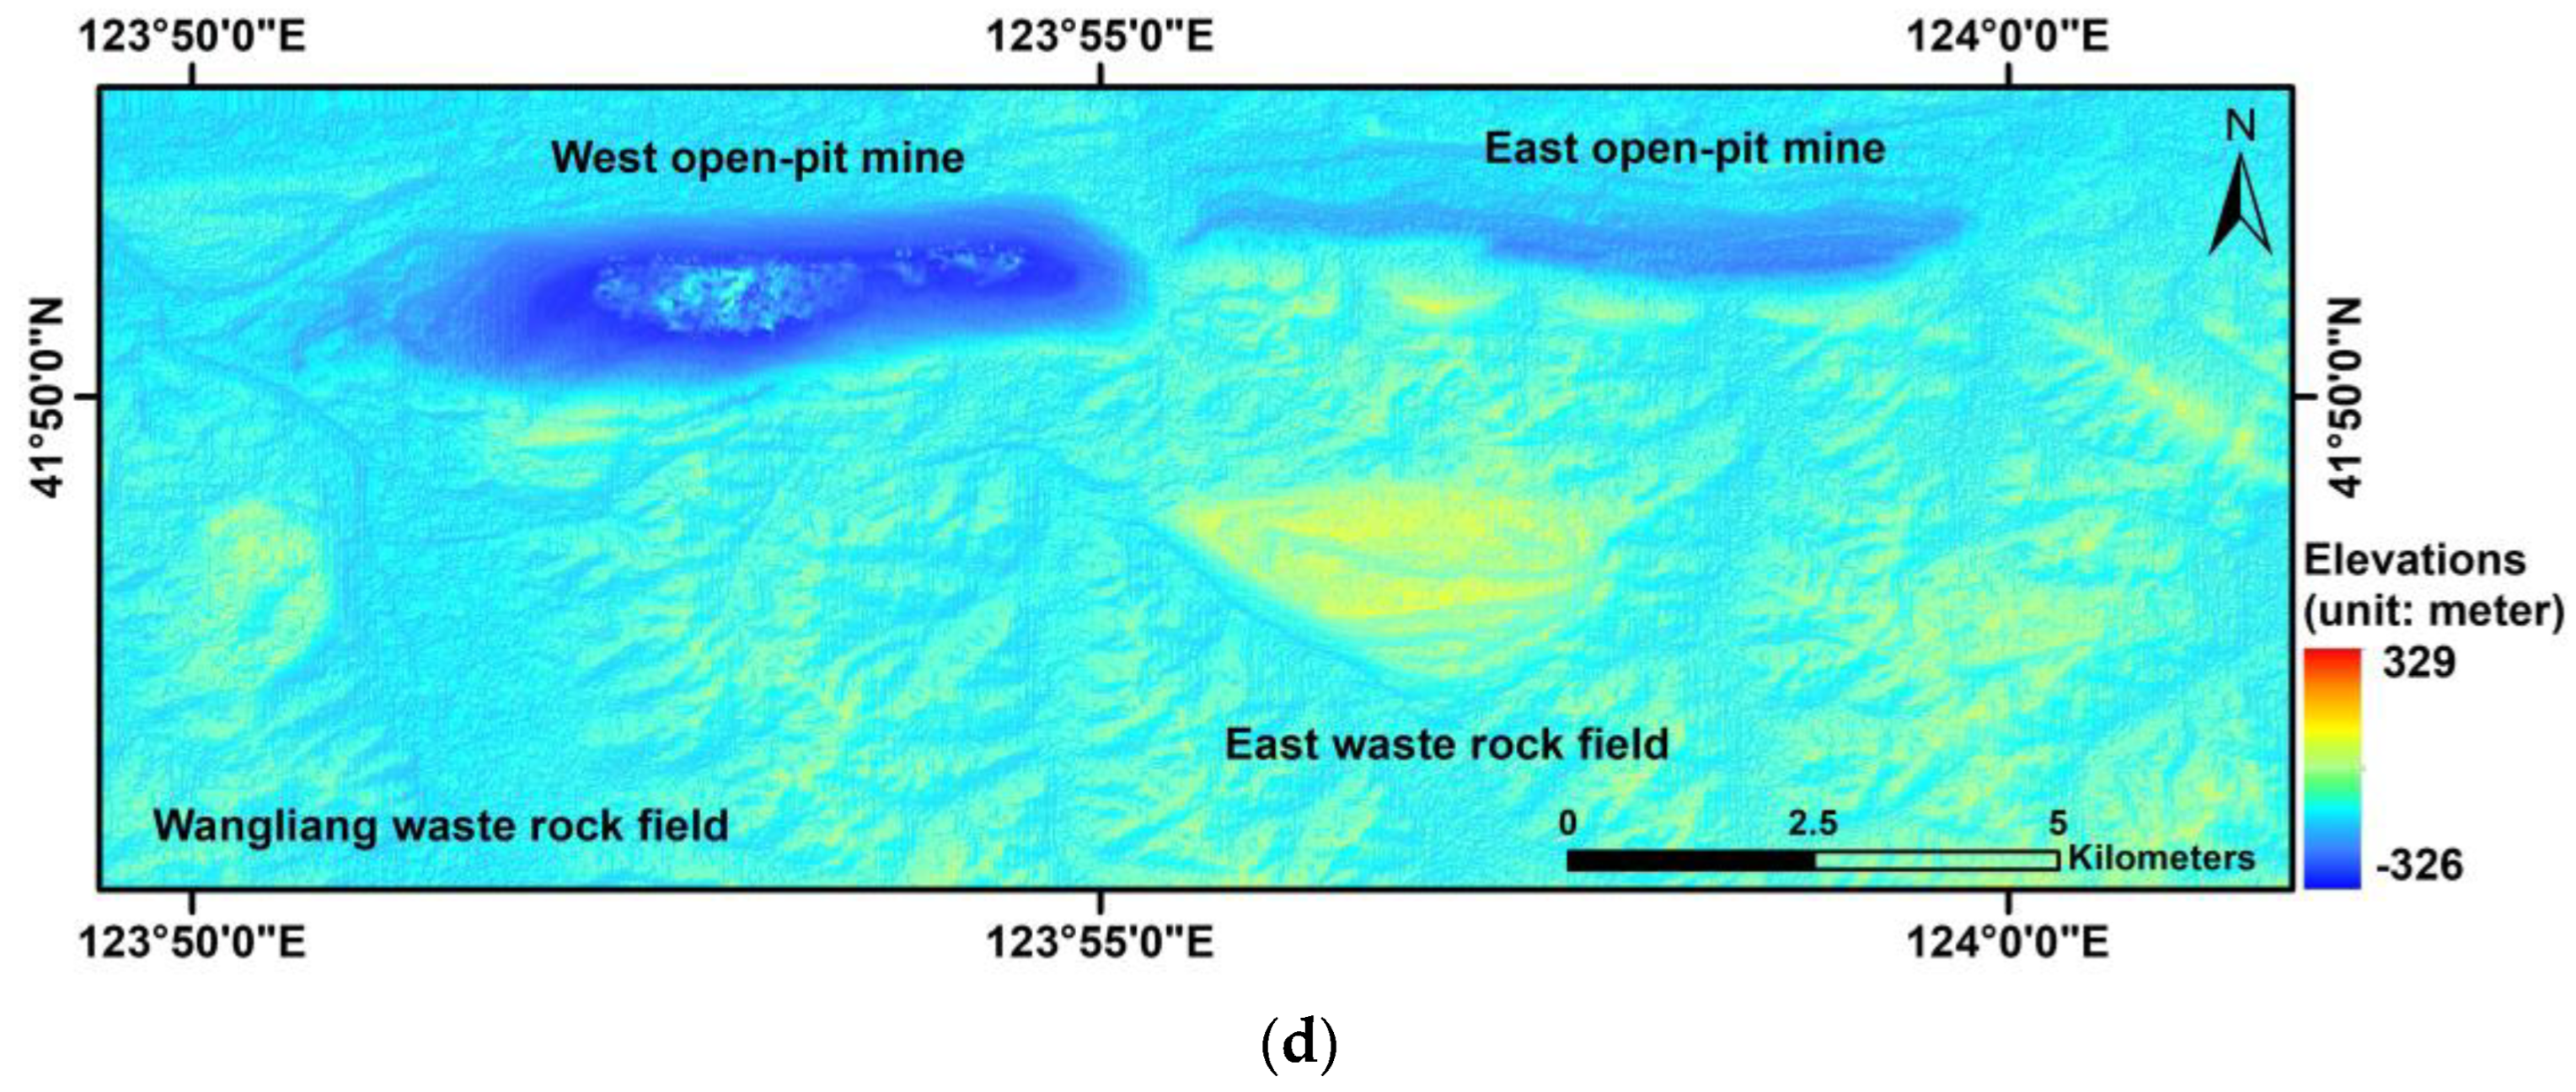
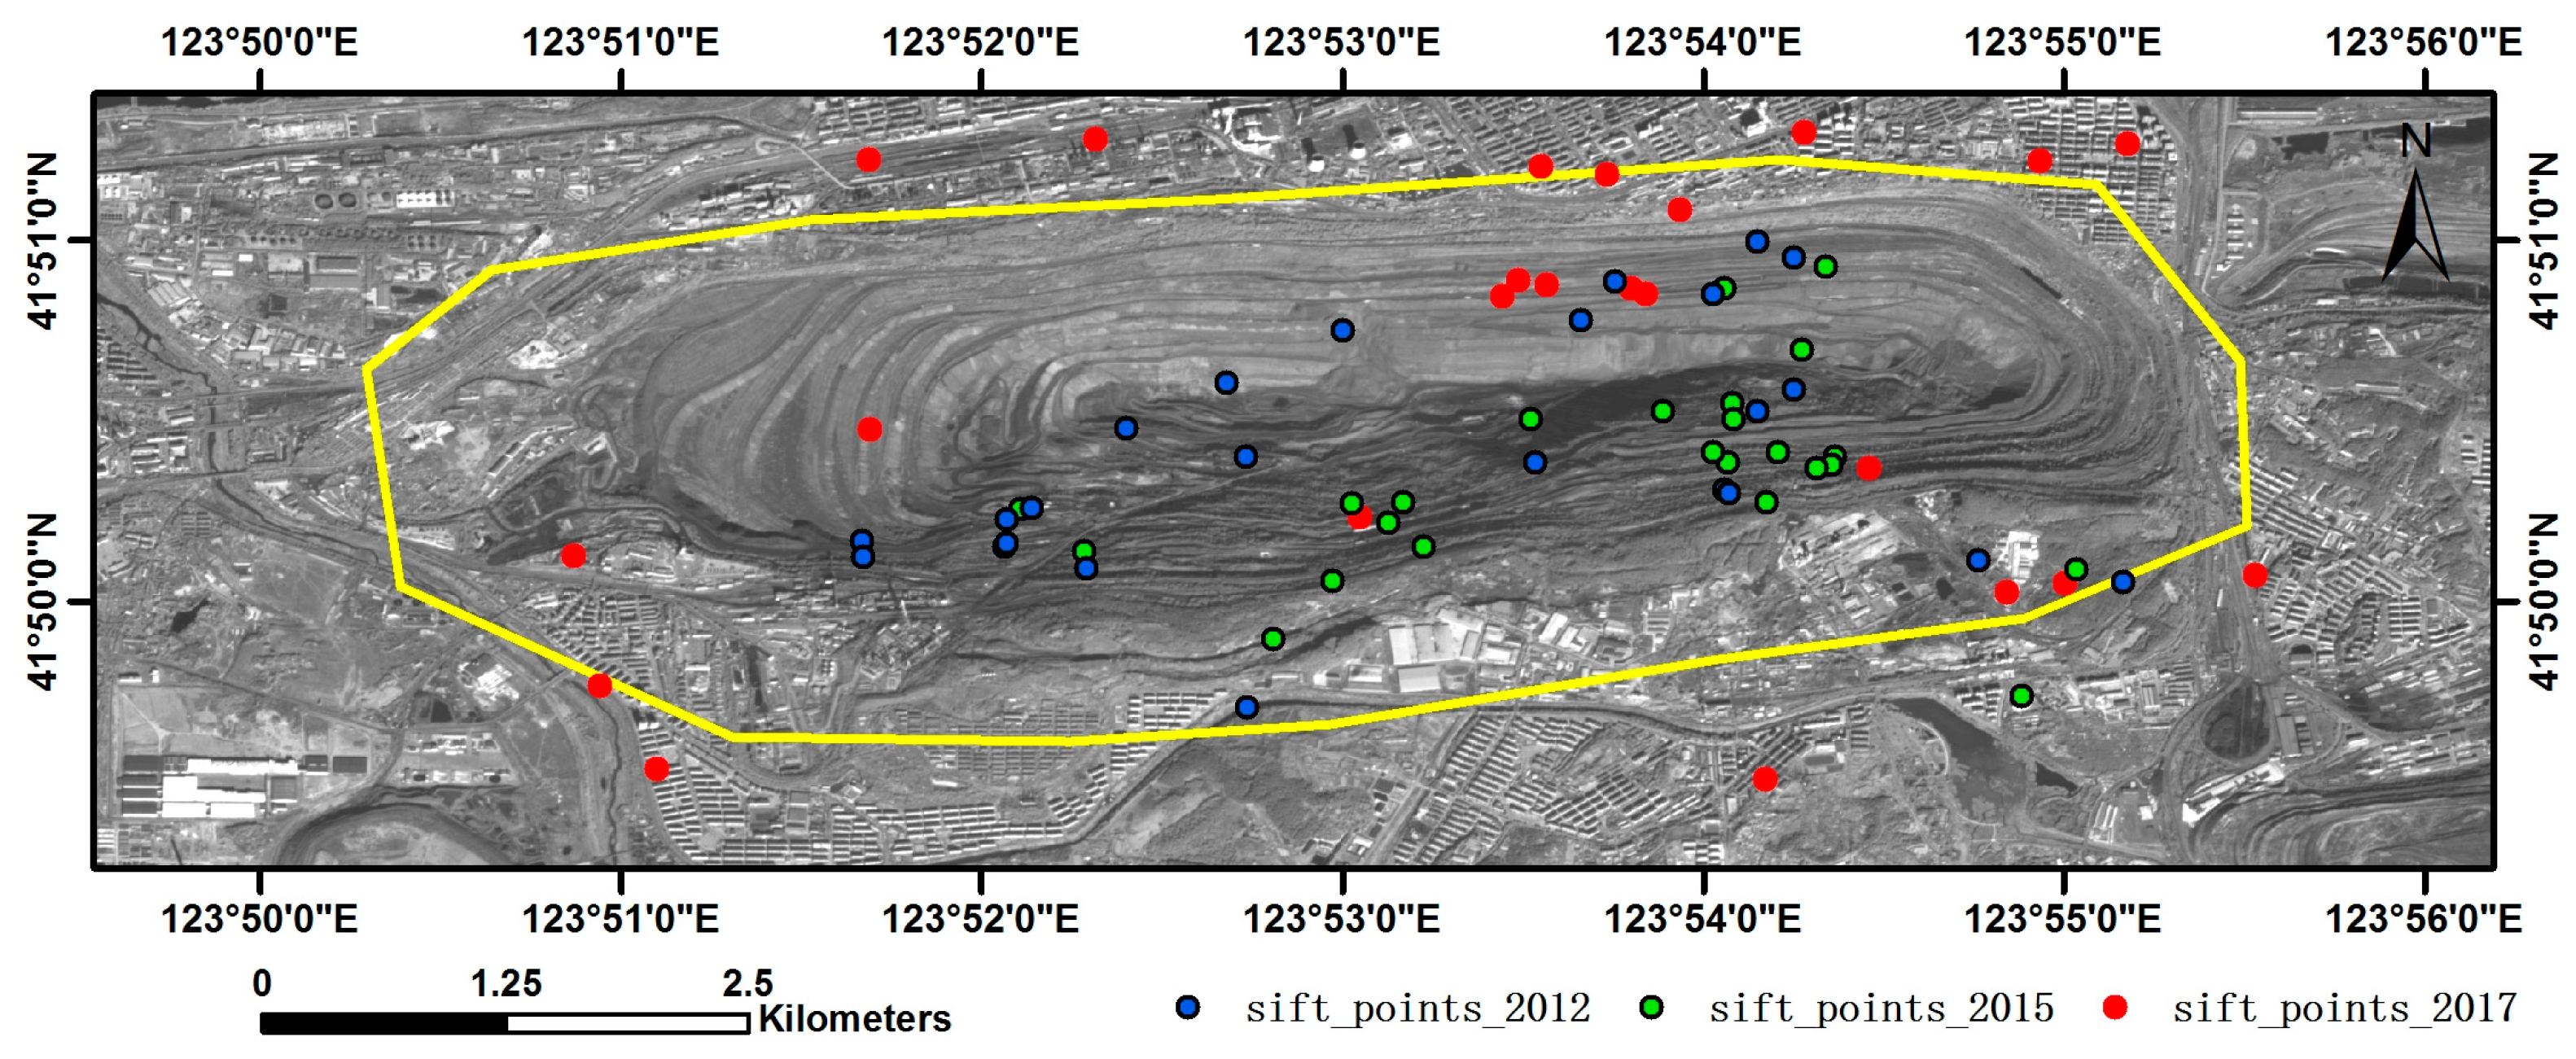
3.3. Surface Planar Displacements from Image Homonymous Features
4. Results
4.1. DSM and Surface Elevation Changes
4.2. Planar Displacement from Image Homonymous Features
4.3. Surface Deformation from Profiles
5. Discussion
5.1. Uncertainties of Extracted Deformation
5.2. Long-Term Monitoring of Deformation in Mining Areas
6. Conclusions
Author Contributions
Funding
Data Availability Statement
Acknowledgments
Conflicts of Interest
References
- Camacho, A.G.; Fernández, J.; Samsonov, S.V.; Tiampo, K.F.; Palano, M. 3D multi-source model of elastic volcanic ground deformation. Earth Planet. Sci. Lett. 2020, 547, 116445. [Google Scholar] [CrossRef]
- Huang, Q.; Wang, Y.; Xu, J.; Nishyirimbere, A.; Li, Z. Geo-hazard detection and monitoring using SAR and optical images in a snow-covered area: The Menyuan (China) test site. ISPRS Int. J. Geo-Inf. 2017, 6, 293. [Google Scholar] [CrossRef]
- Qin, R.; Tian, J.; Reinartz, P. 3D change detection—Approaches and applications. ISPRS-J. Photogramm. Remote Sens. 2016, 122, 41–56. [Google Scholar] [CrossRef]
- Samsonov, S.; Dille, A.; Dewitte, O.; Kervyn, F.; d’Oreye, N. Satellite interferometry for mapping surface deformation time series in one, two and three dimensions: A new method illustrated on a slow-moving landslide. Eng. Geol. 2020, 266, 105471. [Google Scholar] [CrossRef]
- Yang, Z.F.; Li, Z.W.; Zhu, J.J.; Wang, Y.D.; Wu, L.X. Use of SAR/InSAR in mining deformation monitoring, parameter inversion, and forward predictions: A review. IEEE Geosci. Remote Sens. Mag. 2020, 8, 71–90. [Google Scholar] [CrossRef]
- Lu, Y.; Zhang, Z.; Kong, Y.; Hu, K. Integration of optical, SAR and DEM data for automated detection of debris-covered glaciers over the western Nyainqentanglha using a random forest classifier. Cold Reg. Sci. Technol. 2022, 193, 103421. [Google Scholar] [CrossRef]
- Bhambri, R.; Schmidt, S.; Chand, P.; Nüsser, M.; Haritashya, U.; Sain, K.; Tiwari, S.K.; Yadav, J.S. Heterogeneity in glacier thinning and slowdown of ice movement in the Garhwal Himalaya, India. Sci. Total Environ. 2023, 875, 162625. [Google Scholar] [CrossRef]
- Singh, A.K.; Kumar, D.; Kumar, V.; Singh, D.S. Study of temporal response (1976–2019) and associated mass movement event (during 2017) of Meru glacier, Bhagirathi valley, Garhwal Himalaya, India. Quat. Int. 2020, 565, 12–21. [Google Scholar] [CrossRef]
- Hu, J.; Li, Z.W.; Li, J.; Zhang, L.; Ding, X.L.; Zhu, J.J.; Sun, Q. 3-D movement mapping of the alpine glacier in Qinghai-Tibetan Plateau by integrating D-InSAR, MAI and Offset-Tracking: Case study of the Dongkemadi Glacier. Glob. Planet. Change 2014, 118, 62–68. [Google Scholar] [CrossRef]
- Frey, H.; Paul, F. On the suitability of the SRTM DEM and ASTER GDEM for the compilation of topographic parameters in glacier inventories. Int. J. Appl. Earth Obs. Geoinf. 2012, 18, 480–490. [Google Scholar] [CrossRef]
- Liu, Y.; Xu, C.; Huang, B.; Ren, X.; Liu, C.; Hu, B.; Chen, Z. Landslide displacement prediction based on multi-source data fusion and sensitivity states. Eng. Geol. 2020, 271, 105608. [Google Scholar] [CrossRef]
- Wolter, A.; Roques, C.; Gröble, J.; Ivy-Ochs, S.; Christl, M.; Loew, S. Integrated multi-temporal analysis of the displacement behaviour and morphology of a deep-seated compound landslide (Cerentino, Switzerland). Eng. Geol. 2020, 270, 105577. [Google Scholar] [CrossRef]
- Xie, S.; Liang, Y.; Zheng, Z.; Liu, H. Combined forecasting method of landslide deformation based on MEEMD, approximate entropy, and WLS-SVM. ISPRS Int. J. Geo-Inf. 2017, 6, 5. [Google Scholar] [CrossRef]
- Han, J.; Lu, P. Retrieving surface deformation of the Qinghai-Tibet railway across permafrost areas from InSAR. In Proceedings of the IGARSS 2020—2020 IEEE International Geoscience and Remote Sensing Symposium, Waikoloa, HI, USA, 26 September–2 October 2020; pp. 3074–3077. [Google Scholar]
- Tang, W.; Zhao, X.; Motagh, M.; Bi, G.; Li, J.; Chen, M.; Chen, H.; Liao, M. Land subsidence and rebound in the Taiyuan basin, northern China, in the context of inter-basin water transfer and groundwater management. Remote Sens. Environ. 2022, 269, 112792. [Google Scholar] [CrossRef]
- Ren, C.J.; Chen, H.X.; Bai, C.W.; Yan, L.L. Surface deformation detection method in mining subsidence based on GCP quadratic surface correction model in InSAR. In Proceedings of the 2022 IEEE International Geoscience and Remote Sensing Symposium (IGARSS 2022), Kuala Lumpur, Malaysia, 17–22 July 2022; pp. 2554–2557. [Google Scholar]
- Hu, W.M.; Wu, L.X.; Zhang, W.; Liu, B.; Xu, J.X. Ground deformation detection using China’s ZY-3 stereo imagery in an opencast mining area. ISPRS Int. J. Geo-Inf. 2017, 6, 361. [Google Scholar] [CrossRef]
- Zhao, J.; Konietzky, H. Numerical analysis and prediction of ground surface movement induced by coal mining and subsequent groundwater flooding. Int. J. Coal Geol. 2020, 229, 103565. [Google Scholar] [CrossRef]
- Shi, S.; Guo, Z.; Ding, P.; Tao, Y.; Mao, H.; Jiao, Z. Failure mechanism and stability control technology of slope during open-pit combing underground extraction: A case study from Shanxi province of China. Sustainability 2022, 14, 8939. [Google Scholar] [CrossRef]
- Zhao, B.C.; Yu, X.Y.; Wang, J.D. Study on surface movement and deformation by mining in loess gully region. In Proceedings of the International Conference on Sustainable Energy and Environmental Engineering (ICSEEE 2012), Guangzhou, China, 29–30 December 2012; pp. 3005–3009. [Google Scholar]
- Tang, C.; Tanyas, H.; van Westen, C.J.; Tang, C.; Fan, X.; Jetten, V.G. Analysing post-earthquake mass movement volume dynamics with multi-source DEMs. Eng. Geol. 2019, 248, 89–101. [Google Scholar] [CrossRef]
- Liu, K.; Ding, H.; Tang, G.; Song, C.; Liu, Y.; Jiang, L.; Zhao, B.; Gao, Y.; Ma, R. Large-scale mapping of gully-affected areas: An approach integrating Google Earth images and terrain skeleton information. Geomorphology 2018, 314, 13–26. [Google Scholar] [CrossRef]
- Wang, R.; Zhang, S.; Pu, L.; Yang, J.; Yang, C.; Chen, J.; Guan, C.; Wang, Q.; Chen, D.; Fu, B.; et al. Gully erosion mapping and monitoring at multiple scales based on multi-source remote sensing data of the Sancha river catchment, Northeast China. ISPRS Int. J. Geo-Inf. 2016, 5, 200. [Google Scholar] [CrossRef]
- Cimoli, E.; Marcer, M.; Vandecrux, B.; Bøggild, C.E.; Williams, G.; Simonsen, S.B. Application of low-cost UASs and digital photogrammetry for high-resolution snow depth mapping in the Arctic. Remote Sens. 2017, 9, 1144. [Google Scholar] [CrossRef]
- Nemmaoui, A.; Aguilar, F.J.; Aguilar, M.A.; Qin, R. DSM and DTM generation from VHR satellite stereo imagery over plastic covered greenhouse areas. Comput. Electron. Agric. 2019, 164, 104903. [Google Scholar] [CrossRef]
- Xiao, W.; Cao, H.; Tang, M.; Zhang, Z.; Chen, N. 3D urban object change detection from aerial and terrestrial point clouds: A review. Int. J. Appl. Earth Obs. Geoinf. 2023, 118, 103258. [Google Scholar] [CrossRef]
- Yousif, A.M.; Dimitri, B.; Fanar, M.A.; Petra, H. DTM Extraction and building detection in DSMs having large holes. In Proceedings of the Conference on Remote Sensing Technologies and Applications in Urban Environments VI, Online, 13–17 September 2021; p. 118640H. [Google Scholar]
- Li, D.R.; Wang, M. A review of high resolution optical satellite surveying and mapping technology. Spacecr. Recovery Remote Sens. 2020, 41, 1–11. [Google Scholar]
- Wei, H.; Li, S.; Li, C.; Zhao, F.; Xiong, L.; Tang, G. Quantification of Loess Landforms from Three-Dimensional Landscape Pattern Perspective by Using DEMs. ISPRS Int. J. Geo-Inf. 2021, 10, 693. [Google Scholar] [CrossRef]
- James, L.A.; Hodgson, M.E.; Ghoshal, S.; Latiolais, M.M. Geomorphic change detection using historic maps and DEM differencing: The temporal dimension of geospatial analysis. Geomorphology 2012, 137, 181–198. [Google Scholar] [CrossRef]
- Yue, Z.; Hu, W.; Liu, B.; Liu, Y.; Sun, X.; Zhao, Q.; Di, K. Quantitative analysis of the morphology of martian gullies and insights into their formation. Icarus 2014, 243, 208–221. [Google Scholar] [CrossRef]
- Lv, G.; Xiong, L.; Chen, M.; Tang, G.; Sheng, Y.; Liu, X.; Song, Z.; Lu, Y.; Yu, Z.; Zhang, K.; et al. Chinese progress in geomorphometry. J. Geogr. Sci. 2017, 27, 1389–1412. [Google Scholar] [CrossRef]
- Tang, X.M.; Wang, H.Y.; Zhou, P.; Ouyang, S.D.; Yue, Q.X. Data and product system of ZY-3 satellite. Satell. Appl. 2020, 25, 14–18. [Google Scholar]
- Li, D.R. China’s first civilian three-line-array stereo mapping satellite: ZY-3. Acta Geod. Cartogr. Sin. 2012, 41, 317–322. [Google Scholar]
- Cao, H.Y.; Dai, J.; Xu, C.; Liu, F. China’s ZY-3 satellite and its application. Satell. Appl. 2020, 10, 11–13. [Google Scholar]
- Wang, M.; Yang, B.; Li, D.; Gong, J.; Pi, Y. Technologies and applications of block adjustment without control for ZY-3 images covering China. Geomat. Inf. Sci. Wuhan Univ. 2017, 42, 427–433. [Google Scholar]
- Yang, B.; Wang, M.; Xu, W.; Li, D.; Gong, J.; Pi, Y. Large-scale block adjustment without use of ground control points based on the compensation of geometric calibration for ZY-3 images. ISPRS-J. Photogramm. Remote Sens. 2017, 134, 1–14. [Google Scholar] [CrossRef]
- Zhang, G.; Jiang, Y.H.; Li, D.R.; Huang, W.C.; Pan, H.B.; Tang, X.M.; Zhu, X. In-orbit geometric calibration and validation of ZY-3 linear array sensors. Photogramm. Rec. 2014, 29, 68–88. [Google Scholar] [CrossRef]
- Zhu, X.; Tang, X.; Zhang, G.; Liu, B.; Hu, W.; Pan, H. Long-periodic analysis of boresight misalignment of Ziyuan3-01 three-line camera. Remote Sens. 2022, 14, 1157. [Google Scholar] [CrossRef]
- Liu, D. Study on Formation Mechanism-Prediction Analysis of Geologic Hazards in Fushun Coalfield. Ph.D. Thesis, Northeastern University, Shenyang, China, 2009. [Google Scholar]
- Johnson, E.A. Geology of the Fushun Coalfield, Liaoning Province, People’s Republic of China. Int. J. Coal Geol. 1990, 14, 217–236. [Google Scholar] [CrossRef]
- Li, Z.C. Study on Deformation Mechanism and Failure Prediction of Landslide in West Open-Pit Mine in Fushun. Ph.D. Thesis, Jilin University, Changchun, China, 2017. [Google Scholar]
- Liu, B.; Sun, X.; Di, K.; Liu, Z. Accuracy analysis and validation of ZY-3’s sensor corrected products. Remote Sens. Nat. Resour. 2012, 95, 36–40. [Google Scholar]
- Zhang, G. Rectification for High Resolution Remote Sensing Image under Lack of Ground Control Points. Ph.D. Thesis, Wuhan University, Wuhan, China, 2005. [Google Scholar]
- Dai, W.; Chen, K.; Wang, C.; Li, M.; Tao, Y. Topographic change detection thatconsiders the spatial autocorrelation of DEM errors. J. Geo-Inf. Sci. 2022, 24, 2297–2308. [Google Scholar]
- Ma, J.; Jiang, X.; Fan, A.; Jiang, J.; Yan, J. Image matching from handcrafted to deep features: A survey. Int. J. Comput. Vis. 2021, 129, 23–79. [Google Scholar]
- Lowe, D.G. Distinctive image features from scale-invariant keypoints. Int. J. Comput. Vis. 2004, 60, 91–110. [Google Scholar] [CrossRef]
- Von Gioi, R.G.; Jakubowicz, J.; Morel, J.M.; Randall, G. LSD: A fast line segment detector with a false detection control. IEEE Trans. Pattern Anal. Mach. Intell. 2010, 32, 722–732. [Google Scholar] [CrossRef] [PubMed]
- Zhang, L.L.; Koch, R. An efficient and robust line segment matching approach based on LBD descriptor and pairwise geometric consistency. J. Vis. Commun. Image Represent. 2013, 24, 794–805. [Google Scholar] [CrossRef]
- Jiang, Y.H.; Zhang, G.; Tang, X.M.; Zhu, X.Y.; Qin, Q.Q.; Li, D.R.; Fu, X.K. High accuracy geometric calibration of ZY-3 three-line image. Acta Geod. Cartogr. Sin. 2013, 42, 523–529+553. [Google Scholar]
- Pan, H.; Tao, C.; Zou, Z. Precise georeferencing using the rigorous sensor model and rational function model for ZiYuan-3 strip scenes with minimum control. ISPRS-J. Photogramm. Remote Sens. 2016, 119, 259–266. [Google Scholar] [CrossRef]


| Acquisition Time | Center Point (°) | Stereo Imagery | GSD of DSM (m) |
|---|---|---|---|
| 23 May 2012 | E124.105, N41.749 | NAD+BWD | 10 |
| 24 October 2015 | E124.010, N41.987 | NAD+BWD+FWD | 10 |
| 5 June 2017 | E123.823, N41.986 | NAD+BWD+FWD | 10 |
| 30 March 2022 | E123.863, N41.757 | NAD+BWD+FWD | 10 |
| Acquisition Time | Minimum of Elevation | Maximum of Elevation | Average of Elevation | Accuracy of Elevation |
|---|---|---|---|---|
| 23 May 2012 | −325.84 | 247.99 | 104.31 | 3.07 |
| 24 October 2015 | −324.37 | 276.31 | 106.11 | 1.72 |
| 5 June 2017 | −325.89 | 328.74 | 105.13 | 2.07 |
| 30 March 2022 | −160.73 | 236.05 | 107.71 | 2.37 |
| Compared Years | Minimum (m) | Maximum (m) | Average (m) | Standard Deviation (m) | Change Ratio (68%) | Change Ratio (95%) | |
|---|---|---|---|---|---|---|---|
| 2012–2015 | −220.55 | 489.70 | 1.65 | 11.95 | 49.55% | 24.98% | 3.52 |
| 2015–2017 | −502.31 | 596.94 | −0.93 | 11.43 | 46.12% | 22.54% | 2.69 |
| 2012–2017 | −211.03 | 537.12 | 0.81 | 12.39 | 42.86% | 21.60% | 3.70 |
| 2017–2022 | −293.75 | 342.63 | 1.10 | 8.55 | 38.86% | 17.19% | 3.14 |
| Compared Years | Range of Elevation Changes | Ratio | Range of Elevation Changes | Ratio |
|---|---|---|---|---|
| 2012–2015 | <−1.96 | 8.81% | >1.96 | 16.17% |
| −1.96~− | 9.75% | ~1.96 | 14.82% | |
| Total descending (68%) | 18.56% | Total rising (68%) | 30.99% | |
| 2015–2017 | <−1.96 | 15.05% | >1.96 | 8.08% |
| −1.96~− | 13.50% | ~1.96 | 9.48% | |
| Total descending (68%) | 28.55% | Total rising (68%) | 17.57% | |
| 2012–2017 | <−1.96 | 9.54% | >1.96 | 12.06% |
| −1.96~− | 9.40% | ~1.96 | 11.86% | |
| Total descending (68%) | 18.94% | Total rising (68%) | 23.92% | |
| 2017–2022 | <−1.96 | 6.44% | >1.96 | 10.75% |
| −1.96~− | 8.87% | ~1.96 | 12.80% | |
| Total descending (68%) | 15.31% | Total rising (68%) | 23.55% |
| Extracted Parameters | Symbol | RMSE |
|---|---|---|
| Elevation changes | * | 3.26 m |
| Planar displacement | 2.84 m | |
| Deformation area | 0.00071 km2 | |
| Deformation volume | * | 40.72 m3 |
Disclaimer/Publisher’s Note: The statements, opinions and data contained in all publications are solely those of the individual author(s) and contributor(s) and not of MDPI and/or the editor(s). MDPI and/or the editor(s) disclaim responsibility for any injury to people or property resulting from any ideas, methods, instructions or products referred to in the content. |
© 2023 by the authors. Licensee MDPI, Basel, Switzerland. This article is an open access article distributed under the terms and conditions of the Creative Commons Attribution (CC BY) license (https://creativecommons.org/licenses/by/4.0/).
Share and Cite
Hu, W.; Xu, J.; Zhang, W.; Zhao, J.; Zhou, H. Retrieving Surface Deformation of Mining Areas Using ZY-3 Stereo Imagery and DSMs. Remote Sens. 2023, 15, 4315. https://doi.org/10.3390/rs15174315
Hu W, Xu J, Zhang W, Zhao J, Zhou H. Retrieving Surface Deformation of Mining Areas Using ZY-3 Stereo Imagery and DSMs. Remote Sensing. 2023; 15(17):4315. https://doi.org/10.3390/rs15174315
Chicago/Turabian StyleHu, Wenmin, Jiaxing Xu, Wei Zhang, Jiatao Zhao, and Haokun Zhou. 2023. "Retrieving Surface Deformation of Mining Areas Using ZY-3 Stereo Imagery and DSMs" Remote Sensing 15, no. 17: 4315. https://doi.org/10.3390/rs15174315