Article

Black Marble Nighttime Light Data for Disaster Damage Assessment

1
School of Computational Science and Engineering, Georgia Institute of Technology, Atlanta, GA 30332, USA
2
School of Computing Instruction, Georgia Institute of Technology, Atlanta, GA 30332, USA
3
School of Civil and Environmental Engineering, Georgia Institute of Technology, Atlanta, GA 30332, USA
*
Author to whom correspondence should be addressed.
Remote Sens. 2023, 15(17), 4257; https://doi.org/10.3390/rs15174257
Submission received: 27 June 2023 / Revised: 16 August 2023 / Accepted: 26 August 2023 / Published: 30 August 2023
(This article belongs to the Special Issue Remote Sensing of Natural Disasters)

Abstract

:
This research explores the utilization of the Black Marble nighttime light (NTL) product to detect and assess damage caused by hurricanes, tornadoes, and earthquakes. The study first examines average regional NTL trends before and after each disaster, demonstrating that NTL patterns for hurricanes closely align with the features of a resilience curve, unlike those for earthquakes and tornadoes. The relative NTL change ratio is computed using monthly and daily NTL data, effectively reducing variance due to daily fluctuations. Results indicate the robustness of the NTL change ratio in detecting hurricane damage, whereas its performance in earthquake and tornado assessment was inconsistent and inadequate. Furthermore, NTL demonstrates a high performance in identifying hurricane damage in well-lit areas and the potential to detect damage along tornado paths. However, a low correlation between the NTL change ratio and the degree of damage highlights the method’s limitation in quantifying damage. Overall, the study offers a promising, prompt approach for detecting damaged/undamaged areas, with specific relevance to hurricane reconnaissance, and points to avenues for further refinement and investigation.

Graphical Abstract

1. Introduction

Real-time damage assessment in the aftermath of a natural disaster is critical for effective disaster reconnaissance. However, current damage assessment methods rely heavily on field surveys, which can be time-consuming and difficult for first responders to conduct in disaster-affected areas [1]. Remote sensing data can provide a solution to this challenge, as it can be accessed quickly and covers large areas of interest. Optical remote sensing data, which offer daytime information about the Earth, are typically used in structural damage assessment [2]. Nighttime light (NTL) remote sensing data can also offer a unique perspective of Earth. NTL is a composite of illumination from multiple sources, including moonlight, direct light emissions, and ground reflections [3]. Because of the destruction of infrastructure and electric systems, and the reduction in human activity following a disaster, NTL is often reduced, and has, therefore, been widely utilized in disaster reconnaissance [4]. NTL data are typically classified into three types based on the time stamp: yearly, monthly, and daily. Yearly and monthly NTL data are often used to monitor the economic changes resulting from disasters and the disaster recovery process [5,6,7,8]. On the other hand, daily NTL data can provide more detailed temporal information, such as detecting damage and power outages in a neighborhood [4,9,10,11].
NTL data can be significantly impacted by cloud cover, which may affect its performance in damage and recovery detection [4,12]. Skoufias et al. (2021) reported that after analyzing five cases of earthquakes, floods, and typhoons in Southeast Asian countries, they did not find a causal relationship between monthly nightlight values and natural hazard events because NTL data are contaminated by noise from cloud cover, seasonality, and volatility [12]. Zhao et al. (2018) conducted case studies of earthquakes, hurricanes, and floods to evaluate the application of daily NTL data in natural disaster assessment. They suggested that daily NTL data is useful in detecting the damage and power outages caused by earthquakes, hurricanes, and floods; however, the NTL data is still limited by cloud coverage [4].
In 2018, NASA released the Black Marble product, which offers cloud-free NTL data [13]. This has enabled researchers to evaluate the impact of various disaster events using NTL data more accurately [14,15,16]. By studying Hurricane Sandy and Hurricane Maria, Wang et al. (2018) indicated that the Black Marble NTL product can be used to monitor power outages and recovery status at a community level and can be a good source to locate the areas that need disaster relief [14]. Roman et al. (2019) studied Hurricane Maria and showed the potential to use NTL-based estimates to improve real-time disaster impact monitoring [15]. Xu et al. (2021) elucidated that the Black Marble product can be a low-cost instrument to collect near-real-time, large-scale, and high-resolution disaster data [17].
The effectiveness of Black Marble nighttime light (NTL) data in detecting the extent and degree of damage resulting from various disasters has received limited attention in the literature. This study aims to fill this gap by examining the utility of Black Marble NTL data for identifying damaged and undamaged areas caused by hurricanes, earthquakes, and tornados. Moreover, this research explores the potential of Black Marble NTL data in determining the degree of damage in the identified affected areas.
This research builds upon the work of Zhao et al. (2018) [4], which analyzed the usefulness and limitations of daily NTL data from the Visible Infrared Imaging Radiometer Suite (VIIRS) Day-Night Band (DNB) aboard the Suomi National Polar-orbiting Partnership (S-NPP) satellite for disaster reconnaissance of earthquakes, floods, and storms. While Zhao et al. (2018) highlighted cloud cover as a significant challenge in using daily NTL data for damage detection, the Black Marble NTL daily data offer a cloud-free, atmospheric-, terrain-, vegetation-, snow-, lunar-, and stray-light-corrected VIIRS DNB radiance [13], potentially offering a solution for disaster reconnaissance studies. This research extends the work of Zhao et al. (2018) by exploring the ability of Black Marble NTL data to detect damage caused by five hurricanes, two tornados, and four earthquakes. Additionally, this research examines the capacity of NTL data to determine the degree of damage, providing deeper insights and a more consolidated conclusion.

2. Materials

2.1. Black Marble NTL Data

This study leverages the VNP46A2 and VNP46A3 data from the DNB sensor of the S-NPP VIIRS to evaluate the pre- and post-disaster NTL change ratio. The current state of the art in NTL applications is NASA’s Black Marble product suite (VNP46), which is based on the advanced VIIRS DNB time series record [13]. VNP46A2 provides daily DNB NTL radiances at 500m resolution that are cloud-free, atmospheric-, seasonal-, and moonlight bidirectional reflectance distribution function (BRDF)-corrected [13]. VNP46A3, generated based on VNP46A2, provides monthly NTL composites [16]. VNP46A2 has seven layers: DNB BRDF-corrected NTL, gap-filled BRDF-corrected NTL, lunar irradiance, mandatory quality flag, latest high-quality retrieval (number of days), snow flag, and cloud mask flag. Specifically, the gap-filled BRDF-corrected NTL layer fills the area masked out by the cloud based on the latest high-quality observations in previous days. The mandatory quality flag layer shows the retrieval performance of the pixel-based estimates of NTL, whereas the latest high-quality retrieval layer shows the number of days between the latest high-quality retrieval and the current date of interest. With these layers, users can decide if the gap-filled NTL value depends on the current date of interest or not. In this work, it is critical that the post-disaster NTL has high quality and can accurately represent the current date of interest. This data should not be generated through gap-filling procedures. As such, when determining the area of interest for each disaster, the quality flag was factored into the decision-making process. The VNP46A2 and VNP46A3 data are applied in the following section as daily and monthly NTL data, respectively, and are available through the LAADS DAAS on EARTHDATA webpage [18]. Figure 1 illustrates the changes in the nighttime light (NTL) from the VNP46A2 dataset before and after Hurricane Maria. It is clear that the area becomes dimmer following the disaster.

2.2. Damage Proxy Maps (DPM) Data

The color-coded DPM data from NASA Advanced Rapid Imaging and Analysis (ARIA) were used as the ground truth damage degree for the affected area detected by nighttime light (NTL). The DPMs were generated using pre- and post-disaster interferometric synthetic aperture radar (InSAR) data, which depict alterations in the land surface. Notably, these changes in surface provide a quantifiable measure of the damage degree [17]. A DPM provides detailed visualization of a specific geographic area, pinpointing the location and severity of the damage with a 30m resolution. The vegetated area increases the false positive points for DPM [17]. Therefore, this study focused on evaluating urban areas. The DPMs are available on ARIA Share on the Jet Propulsion Laboratory (JPL) webpage [19]. Figure 2 shows the DPM of Hurricane Maria within San Juan.

2.3. Disaster Information

This study delves into three categories of natural disasters: hurricanes, tornadoes, and earthquakes. Comprehensive details of these disasters can be found in Table 1. Table 2 lists the specifics of the study area, and the time stamps for the satellite images are shown in Figure 3, Figure 4 and Figure 5. Figure 3, Figure 4 and Figure 5 illustrate the study area, with pre-disaster satellite images for each disaster. These pre-disaster satellite imageries were collected from Google Earth View [20].
In September 2017, Hurricane Maria struck Puerto Rico as one of the strongest storms on record. It was a Category 5 hurricane with maximum sustained winds of 280 km/h. It resulted in 29,875 deaths [21] and caused at least USD 90 billion in damage [22]. Maria also caused a large-scale power outage across the island, with the entire area losing power on 21 September 2017 [23].
Hurricane Michael made landfall as an unprecedented Category 5 hurricane in Florida, with sustained wind speeds of 224 km/h in October 2018. The storm caused damage from wind in Central America, with an estimated USD 25.1 billion and at least 74 deaths [24]. Power outages affected approximately 1.7 million customers across Florida, Georgia, South Carolina, and other affected areas [25].
Hurricane Florence made landfall near Wrightsville Beach, North Carolina. Its intensity dwindled as it migrated inland, being classified as a Category 1 hurricane by the time it struck Jacksonville. The storm caused USD 24.23 billion in damage and 54 deaths in total [26]. More than 65,000 outages were reported in Jacksonville on 15 September 2018 [27].
Hurricane Dorian was a Category 5 hurricane that struck the Bahamas with maximum sustained winds of 295 km/h in September 2019. Heavy rainfall, high winds, and storm surge caused at least 70,000 people to become homeless and 77 direct deaths [28]. The estimated cost of Dorian is USD 3.4 billion [29].
Hurricane Iota was a devastating Category 4 hurricane that caused severe damage to Central America. The maximum sustained wind speed was 250 km/h. At least 67 people were killed, and 41 people were reported missing [30]. The storm generated an estimated USD 1.4 billion in damages [31].
The Nashville Tornado, a violent EF3 tornado with a maximum wind speed of 266 km/h, struck west of Cookeville on 3 March 2020. The tornado killed 25 in total, with an additional 309 injured. Total damage reached USD 1.607 billion, and was the 6th costliest tornado in the US [32]. More than 15,000 outages were reported across Nashville [33].
The Kentucky Tornado was a violent EF4 tornado that moved across western Kentucky with wind speeds up to 310 km/h in December 2021. This long-tracked tornado moved across Mayfield, Princeton, Dawson Spring, and Bremen. At least 74 deaths and 515 injuries were reported in this disaster [34]. Over 23,600 outages were reported during the tornado [35].
The Nepal Earthquake occurred on 25 April 2015, with a magnitude of Mw 7.1. It is the worst natural disaster that has struck Nepal since 1934. This earthquake triggered an avalanche on Mount Everest, resulting in the deaths of 22 people [36]. The damage inflicted on the country cost Nepal an estimated USD 10 billion, with large-scale power outages and the destruction of 446 public health facilities being reported [37].
The Mexico Earthquake struck on 19 September 2017, with an estimated magnitude of Mw 7.1. The earthquake caused buildings to collapse and killed more than 370 people. The total damage cost USD 8 billion [38].
Puerto Rico was struck by a Mw 6.4 earthquake on 7 January 2020. This disaster cost USD 3.1 billion. Approximately two-thirds of Puerto Rico was out of power following the earthquake [39].
A Mw 5.7 earthquake hit Salt Lake City on 18 March 2020, causing damage estimated to be at least USD 629 million [40]. More than 50,000 power outages were reported in northern Utah after the earthquake [41].

3. Methods

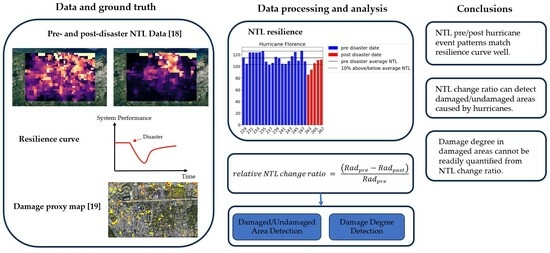
3.1. Resilience Curve

Before, during, and after a disaster occurs, the performance of a system is represented by the resilience curve, as depicted in Figure 6 [42]. At the time of disruption, the system’s performance experiences a sudden drop. As time progresses, the performance gradually increases, leading to either partial or full recovery, depending on the recovery efforts made. NTL can serve as one of the indicators of a system’s performance. If NTL is capable of illustrating damage, the NTL versus time curve before and after a disaster should align with the resilience curve to a certain extent.
To generate the resilience curve from the perspective of NTL, the average regional NTL value is calculated using Equation (1), representing the brightness of the area of interest:
A v e r a g e   r e g i o n   N T L   =   S u m   o f   N T L   v a l u e   w i t h i n   t h e   a r e a   o f   i n t e r e s t   #   o f   p i x e l s   w i t h i n   t h e   a r e a   o f   i n t e r e s t
To create the average regional NTL versus day graph, daily NTL data is utilized. Twenty pre-disaster dates are selected, ranging from the 15th to the 34th day before the post-disaster date. The post-disaster date is identified as the first day after the event when the area of interest is primarily flagged as high quality in the quality flag layer. The post-disaster dates in this study included the first post-disaster date up to five days thereafter.

3.2. Pre-Disaster Daily NTL Fluctuations

NTL values can vary among days even in the absence of a disaster. To correctly depict the damage detected by NTL change, one must control for or eliminate the influence from pre-disaster daily NTL fluctuations.
For each disaster event, the pre-disaster daily NTL fluctuations were calculated based on average regional NTL (AR NTL) using Equation (2).
P r e d i s a s t e r   d a i l y   N T L   f l u c t u a t i o n   =   i = 34 , , 16 | A R   N T L i A R   N T L i 1 | A R   N T L i   20

3.3. Relative NTL Change Ratio

This study uses a relative NTL change ratio layer to compare the pre- and post-disaster NTL values, which is calculated by Equation (3):
r e l a t i v e   N T L   c h a n g e   r a t i o   =   R a d p r e R a d p o s t R a d p r e
where Radpre is the pre-disaster NTL radiance and Radpost is the post-disaster NTL radiance. The study explores and compares two ways for generating the relative NTL change ratio:
  • Using monthly NTL as Radpre: in this method, Radpost is collected from the VNP46A2 data of the first post-disaster date. Radpre utilizes the VNP46A3 monthly data from the month before the disaster.
  • Using daily NTL as Radpre: this method also uses VNP46A2 data for Radpost but takes the VNP46A2 data 15 days prior to the first post-disaster date for Radpre. It is important to note that the 15th day before the post-disaster date is assuredly within the pre-disaster period in this work.
In both approaches, only two files need to be downloaded to obtain the NTL radiance: one for pre-disaster and the other for post-disaster. This contrasts with previous work, which required downloading multiple files and calculating the mean value to acquire pre- and post-disaster NTL radiance [4]. Both methods streamline the disaster reconnaissance process and enhance efficiency.
After a disaster, the affected area experiences changes in brightness, which can be quantified by the relative NTL change ratio. A negative relative change ratio indicates an increase in brightness, whereas a zero ratio suggests no change. Conversely, a positive ratio indicates a decrease in brightness, thereby indicating a disaster-affected area [4]. The degree of effect caused by the disaster is proportional to the size of the change ratio. In this study, the scenarios where recovery work may involve deploying temporary lights, which could yield increased brightness in the post-disaster date, are not considered. Pre-disaster daily NTL fluctuation needs to be considered and controlled to make sure the NTL change is mostly caused by the disaster.
The determination of the area of interest in this study relied on both the DPM and the quality flag layer. It should be noted that the DPM is less reliable in vegetated areas [43], and NTL change is commonly used to evaluate the impact of disasters on cities with electricity systems [11]. As such, this study primarily focuses on analyzing the nightlight change within the city limits. In certain cases, it may be challenging to identify a post-disaster date with uniformly high-quality NTL coverage for the entire city area. Therefore, only the area with a high-quality flag layer is considered for analysis.
The DPM is applied as the ground truth map for the damage degree. The DPM is first up-sampled to match the 500m resolution of the NTL change ratio layer. Within each NTL change ratio pixel, the ground truth damage degree is represented by the pixel with the highest damage degree from the DPM. In cases where no DPM pixel is included within the NTL pixel, the NTL pixel is marked as having no damage. The term DD will be used to refer to the ground truth damage degree from the DPM in the latter part of this study.

3.4. Confusion Matrix and F1 Score

A confusion matrix and F1 score are used to evaluate if the disaster-affected area detected by the NTL change ratio layer matches with the DD. Confusion matrices with true positive (TP), false positive (FP), false negative (FN), and true negative (TN) values are used to present the consistency, where TP refers to the number of pixels that are detected as damage from NTL change ratio and includes at least one damage degree point from the ground truth map (damaged); FP refers to the number of pixels that are detected as damage from the NTL change ratio but with no damage degree point from the ground truth map (undamaged); FN represents the number of pixels that are detected as undamaged from the NTL change ratio and includes at least one damage degree point from the ground truth map (damaged); TN represents the number of pixels that are detected as undamaged from the NTL change ratio and with no damage degree point from the ground truth map (undamaged). Given the imbalanced distribution between damaged and undamaged pixels, both accuracy and F1 score are used to analyze the result. The F1 score is the harmonic mean of precision and recall, wherein precision is the proportion of positive predictions that were actually correct, and recall is the proportion of actual positive classes that were identified. The F1 score can be calculated by Equation (4):
F 1 = T P T P + 1 2 ( F P + F N )

3.5. Pearson Correlation Coefficient (PCC)

PCC is used to assess whether the NTL change ratio can reflect the damage degree in affected areas. Specifically, the PCC aims to determine whether there exists a linear relationship between the NTL change ratio and the DD. PCC is calculated by Equation (5):
P C C = c o v ( N T L , D D ) σ N T L σ D D
where c o v is the covariance, σ N T L is the standard deviation of the NTL change ratio, and σ D D is the standard deviation of the DD. The PCC has the range of −1 to 1. If there is a linear relationship between the NTL change ratio and DD, the absolute value of the PCC will be close to 1. In cases where no such relationship exists, the PCC will be close to 0. Ideally, an increase in the degree of damage should correspond to a larger relative change in NTL.
Given that ARIA [19] only permits the retrieval of color-coded Damage Proxy Maps (DPMs), it is crucial to digitize the DPM to discern color alterations indicative of DD variations more effectively. The color-coded DPM employs a progression from yellow to dark red as a visual indication of escalating damage across the map, with the representation of DD achieved through four color bands: Red (R), Green (G), Blue (B), and transparency. For detailed analysis, it becomes necessary to isolate the shift from yellow to red using a single band rather than multiple. With this in mind, the RGB channels are transformed into the Hue, Saturation, Value (HSV) channel, as the hue component can effectively capture color proportions. Consequently, the value derived from the hue channel is employed to interpret the DD value. The spectrum of DD values ranges from 0 to 0.167, mirroring the values of the hue channel spanning from dark red to yellow. Therefore, a smaller DD value indicates higher damage. The range of the NTL change ratio is from 0.1 to 1.
The analysis is carried out on pixels that exhibit a positive NTL change ratio and contain at least one damage degree point from the DPM.

4. Results

4.1. NTL Resilience

Figure 7, Figure 8 and Figure 9 depict the NTL resilience trend for hurricanes, tornadoes, and earthquakes, respectively. In each subplot, the x-axis represents the Julian day, while the y-axis displays the NTL radiance ( n W a t t s   c m 2 s r 1 ).
  • The blue bars represent the AR NTL values for the pre-disaster days.
  • The red bars illustrate the AR NTL values for the post-disaster days.
  • The solid black line indicates the average NTL value for the pre-disaster days for each specific event.
  • The black dashed lines signify NTL values that are 10% above or below the average, serving as a reference point to gauge fluctuations.
For hurricane events, as shown in Figure 7, a clear drop of NTL can be observed in the first post-disaster date, and the recovery trend can be observed as well, which fits the resilience curve in Figure 6. A partial recovery can be observed for Hurricane Maria, Hurricane Michael, and Hurricane Iota. For Hurricane Florence and Hurricane Dorian, an almost full recovery from the perspective of NTL can be observed. These trends confirm that NTL can be a good indicator of the damage caused by hurricanes.
The resilience trend in tornado events (Figure 8) is less pronounced than in hurricane events. For example, in the case of the Kentucky Tornado, there is no noticeable drop in NTL following the disaster. As for the Nashville Tornado, an initial drop in NTL is observed on the first chosen day after the disaster. However, the NTL returns to above-average levels on the second post-disaster day, indicating that there was no discernible recovery process. This contrasts with the typical resilience curve (Figure 6), which could indicate that NTL is a less robust factor when representing the damage caused by tornados.
In the resilience curve presented in Figure 6, certain features, such as the initial drop in system performance when a disaster occurs, followed by a gradual recovery process, are typically observed. However, these features are not evident in the earthquake events, with the exception of the Mexico Earthquake (Figure 9). This inconsistency between the observed NTL resilience trend and the resilience curve in Figure 6 may suggest that NTL is not a reliable factor for depicting the damage caused by earthquakes.

4.2. Pre-Disaster NTL Daily Fluctuations

Pre-disaster daily fluctuations in NTL values can be observed in Figure 7, Figure 8 and Figure 9. These fluctuations before the disaster suggest that factors other than disasters themselves can contribute to changes in NTL values. Table 3 details the pre-disaster daily NTL fluctuations for each disaster event, calculated using Equation 2, with variations ranging from 3.64% to 15.21%. The average daily NTL fluctuation across all disasters is 9.36%.
When examining the black dashed line in Figure 7, Figure 8 and Figure 9, which represents a level 10% below the average for each disaster event, it is found that most of the NTL values for the first post-disaster date fall below this line. Consequently, in this study, pixels showing a relative change ratio lower than 10% are classified as non-disaster-affected areas. This threshold helps to differentiate between regular fluctuations and those specifically caused by disasters, providing more accurate insights into the areas genuinely affected.

4.3. Damaged/Undamaged Area Detection from NTL Change Ratio

The relative NTL change ratio is calculated to detect the damaged area after disasters. F1 and accuracy are used to evaluate the consistency between DD and NTL-detected damage. The study compares two distinct methods for calculating the NTL change ratio. The first approach uses daily NTL data as Radpre, whereas the second leverages monthly NTL data. This comparison aims to analyze the nuances of both methods and their effectiveness in providing accurate insights into disaster-affected areas.

4.3.1. Damaged/Undamaged Area Detection from NTL Change Ratio Using Daily NTL Data as Radpre

Table 4 shows the confusion matrices, accuracy, and F1 scores calculated from the DD and NTL maps of different disasters. The analysis utilizes daily NTL data as Radpre, specifically selecting the data from the 15th day before the post-disaster date.
The performance across different disaster event types exhibits variations. Hurricane events show the highest F1 score, followed by earthquake and tornado events. Specifically, the average F1 scores for hurricanes, earthquakes, and tornadoes are 0.735, 0.668, and 0.558, respectively. Among hurricanes, Hurricane Maria (San Juan and Ponce), Hurricane Michael, and Hurricane Dorian achieve F1 scores over 75%, whereas Hurricane Iota and Hurricane Florence demonstrate relatively weaker performances, with F1 scores of 0.459 and 0.609, respectively. Regarding earthquakes, most cases attain F1 scores around 60%, except for the Mexico Earthquake, which shows superior performance with an F1 score of 84.2%. Nevertheless, the accuracy of most earthquake cases is only around 55%, indicating that the NTL layer only slightly outperforms a random guess. The performance of tornado events is worse than that of earthquakes, exhibiting an average F1 score of 56% and an average accuracy of 48%.
However, it is worth considering that daily fluctuations among pre-disaster days may introduce variability. Consequently, selecting daily NTL from different pre-disaster dates to calculate the relative NTL change ratio could lead to disparate results and conclusions. To investigate this further, two additional experiments were conducted using the 16th and 18th days before the post-disaster date as Radpre, respectively. Figure 10, Figure 11 and Figure 12 display the comparison of the F1 score when using the 15th, 16th, and 18th day before the post-disaster date as Radpre for hurricane, tornado, and earthquake events. This comparative analysis aims to shed light on the influence of these pre-disaster time frames on the consistency of NTL damage detection.
For the majority of disaster events, the F1 score remains consistent regardless of the pre-disaster date selected. However, a few outliers show variability in the F1 score, including Hurricane Dorian, the Kentucky Tornado, and the Nepal Earthquake. In the case of Hurricane Dorian, the F1 score can decrease from 0.768 to 0.466 when choosing a different pre-disaster date, leading to a significantly different conclusion in detecting the damaged area. This indicated that while using daily data can yield stable results to a certain extent, future events may still demonstrate variations depending on the specific daily pre-disaster NTL data chosen. Therefore, it underscores the importance of seeking a more stable representation of Radpre, to ensure that the detection method remains reliable across different disasters.

4.3.2. Damaged/Undamaged Area Detection from NTL Change Ratio Using Monthly NTL Data as Radpre

Monthly NTL data provide an effective pre-disaster measurement, as the daily fluctuations are smoothed out. This aggregation over a longer time frame provides a more stable and consistent representation, reducing the risk of variability from daily changes.
Table 5 shows the confusion matrices, accuracy, and F1 scores calculated from the DD and NTL maps of different disasters, which utilize monthly NTL data as Radpre, specifically selecting the data from the one month prior to the post-disaster date.
It is evident that NTL-detected damage aligns most consistently with the DD in hurricane events, yielding an average F1 score of 0.738. This is followed by tornados, with an average F1 score of 0.521, and earthquakes, with an average F1 score of 0.504. Within hurricane events, the performance is not uniform. Hurricane Michael and both instances of Hurricane Maria achieve an F1 score above 0.8. In contrast, Hurricane Florence and Hurricane Dorian only achieve an F1 score above 0.6, and the F1 score for Hurricane Iota is just 0.477.
For tornadoes and earthquakes, the results suggest that the damage detected by the NTL change ratio is roughly equivalent to, or even worse than, a random guess. The Mexico Earthquake is the only exception, with an F1 score of 0.76.
This variation in NTL performance when detecting damage across different disaster types aligns with the NTL resilience trends depicted in Figure 7, Figure 8 and Figure 9. The NTL resilience trend for hurricane events conforms to the features of a resilience curve (Figure 6): a sharp decline when the disaster occurs, followed by a slow recovery process, which explains the higher F1 scores achieved when using NTL to detect damage caused by hurricanes. Conversely, the NTL resilience trends for tornadoes and earthquakes do not exhibit the characteristics of a resilience curve (Figure 6), which lead to a lower F1 score. The NTL resilience trend for the Mexico Earthquake aptly captures the characteristic features of a resilience curve compared with other earthquake events. This distinctive pattern may explain the high F1 score for the Mexico Earthquake case, as the NTL data effectively captures the disaster resilience features specific to this event. Overall, the lack of alignment contributes to the lower average F1 scores. Therefore, the effectiveness of NTL in detecting disaster-related damage appears to be closely related to the underlying resilience trends specific to different disasters.

4.4. Damage Degree Detection from NTL Change Ratio Layer

Section 4.3 elucidates the performance of the NTL change ratio in detecting damaged and undamaged areas. Building on that analysis, this section explores whether the NTL change ratio can further illustrate the degree of damage, employing the method described in Section 3.5. Specifically, the PCC is calculated to characterize the linear relationship between the DD and the NTL change ratio. Table 6 presents the PCC values for the disaster events.
In every case, the absolute value of the PCC is close to zero, indicating that there is no discernible linear relationship between the NTL change ratio and DD. Specifically, the NTL relative change ratio does not increase as the severity of damage goes up. This finding suggests that the NTL change ratio is unable to effectively capture or represent the varying degrees of damage.

5. Discussion

5.1. Variation in NTL Damage Detection Performance among Different Types of Disasters

The results shown in Section 4.3 indicate the variation in NTL damage detection performance among hurricanes, tornados, and earthquakes. The variations are attributed to the impact of disasters on the electric system, which may be more vulnerable to hurricanes and tornados than to earthquakes [44].
Hurricanes have the potential to inflict widespread damage on a given area, including substantial harm to the power system. Figure 13 shows the damage detected by the NTL change ratio and the corresponding DPM of Hurricane Maria. The coherence between the large-scale damage and widespread power outage leads to a high performance in detecting damage using the NTL relative change ratio.
Despite also involving intense winds, tornadoes tend to affect areas directly along their paths, rather than causing widespread, evenly distributed damage. Consequently, the performance of the NTL change ratio model in detecting regional damage does not match the effectiveness observed for hurricane events. This will be further discussed in Section 5.3.
While earthquakes can damage distribution systems and transmission towers in areas with unstable soil, the major cause of power outages is abnormally high wind, which is more prevalent in hurricane and tornado events [44]. Additionally, the damage wrought by earthquakes is often influenced by local site effects, making it more variable [45]. As a result, the effectiveness of using the NTL change ratio to detect damage caused by earthquakes tends to be both poor and inconsistent. This highlights the importance of understanding the specific nature and impact patterns of each disaster type when utilizing NTL data for damage assessment.

5.2. The Influence Factors of Damaged/Undamaged Area Detection Using NTL Change Ratio in Hurricanes

Based on the experiments in Section 4.3, the nighttime change ratio layer has been shown to be effective in detecting damaged/undamaged areas resulting from hurricane events. However, a performance difference still exists among the different cases. Specifically, in both cases, Hurricane Maria and Hurricane Michael have F1 scores of over 0.8, whereas the F1 scores for Hurricane Iota, Hurricane Florence, and Hurricane Dorian are relatively low. The performance of the nighttime change ratio layer in detecting damage caused by hurricanes may be influenced by other factors, which are discussed in this study from two perspectives: hurricane category and the average NTL value on the pre-disaster day.
Figure 14a reveals a general pattern wherein the F1 score increases as the average NTL value in the pre-disaster day increases. This phenomenon can be explained by the fact that when the average NTL on the pre-disaster day is low (indicating an area that is generally dimly lit at night), it becomes challenging to accurately discern relative NTL changes. This difficulty contrasts with areas with higher NTL values, where changes are more readily observable.
Figure 14b points to the absence of a linear relationship between the hurricane category and the F1 score. This means that the efficiency of NTL damage detection does not necessarily improve with an increase in the hurricane category, even when more damage is caused. However, this conclusion might be influenced by the imbalanced distribution of hurricane categories in this study. Investigating a broader range of hurricanes could potentially alter this finding.
Figure 14c illustrates the relationship between the F1 score, average NTL, and hurricane category. A notable gap can be observed between Hurricane Florence and Hurricane Dorian. By examining more hurricanes, there may be an opportunity to create a predictive surface to determine the optimal conditions for utilizing the NTL relative change ratio to detect damage caused by hurricanes, which could be done in future work.

5.3. Damaged/Undamaged Area Detection Using NTL Change Ratio along Tornado Path

As discussed in Section 5.1, the damage caused by tornados can be concentrated along the tornado path; therefore, the performance using NTL to detect regional damage in both tornado cases is not ideal. It is worth investigating if the performance will increase if the study area is limited to the tornado path, instead of focusing on the whole region. Figure 15 shows the study areas, DPMs, tornado paths, and NTL-detected damaged areas of the Nashville Tornado and Kentucky Tornado. The new study area along the tornado path was created by generating a buffer zone along the path with a distance the same as the tornado width. Note that the information about the tornado width and tornado path was gathered from the NOAA storm prediction center [46].
The NTL trends before and after the disaster were generated, as shown in Figure 16. For the Kentucky Tornado, the NTL trend fails to show the features of the resilience curve. However, for the Nashville Tornado, a clear drop in NTL after the disaster followed by a gradual recovery can be observed.
The NTL damage detection results for both tornadoes using the new study area are shown in Table 7. Monthly data are used as Radpre.
The Nashville and Kentucky tornado cases present contrasting results with the utilization of the NTL relative change ratio for damage detection, which is consistent with the corresponding NTL trend. In the Nashville Tornado, a commendable F1 score of 0.819 illustrates a marked improvement in the accuracy of damage detection compared to the wider region’s score of 0.616. However, the performance in the Kentucky Tornado case is still poor, which may be attributed to the specific construction of the study area. Given the tornado width of 402 m in Kentucky [46], the corresponding buffer zone’s width of 804 m, coupled with the 500m resolution of NTL data, results in a study area covering only a sparse number of NTL pixels. This limited coverage can lead to less-reliable results. On the other hand, the greater width of the Nashville Tornado, 1463 m, ensures adequate NTL pixel coverage, enabling a more robust and credible conclusion [46].
While promising in some instances, the application of the NTL relative change ratio to detect damage along a tornado’s path still requires careful consideration. Future research and experiments could provide further insight for more consistent outcomes across different tornado events.

6. Conclusions

This study explored the potential of the Black Marble NTL product in identifying damaged and undamaged areas, as well as assessing the degree of damage inflicted by hurricanes, tornadoes, and earthquakes. Initially, the research established average regional NTL trends before and after each disaster, assessing whether NTL serves as a viable indicator for damage across different disaster types. The results showed that the NTL trend for hurricanes more closely mirrors the characteristics of a resilience curve, in contrast to earthquakes and tornadoes. The study further examined pre-disaster NTL daily fluctuations to ensure that future experiments focus solely on NTL changes instigated by the disaster. This led to the calculation of the relative NTL change ratio using pre- and post-disaster NTL data, with the employment of VNP46A3 monthly NTL data effectively mitigating the variance introduced by daily fluctuations.
Key findings of the study include the relative strength of the NTL change ratio in detecting damage caused by hurricanes, with its performance in assessing earthquake and tornado damage being inconsistent or even below random guessing levels. The alignment of NTL change ratio performance with the NTL resilience trend adds credibility to the method. Furthermore, NTL proved particularly adept at identifying hurricane damage in well-lit areas and showed potential in delineating damage along tornado paths.
However, the low PCC value between the NTL change ratio and DD indicated that the current approach is insufficient to quantify the degree of damage in hurricane, earthquake, and tornado events.
Overall, this study advances a timely and streamlined approach for detecting damaged and undamaged areas, particularly valuable for hurricane reconnaissance. It also illuminates areas for further refinement and potential expansion, underscoring the importance of continued exploration and methodological refinement in leveraging NTL data for disaster assessment and response. This study has some limitations that should be acknowledged. Firstly, the DPM provided by NASA was used as the ground truth damage degree map in this work, but it was generated by InSAR, which primarily reflects changes in landforms rather than the electricity system. This may lead to errors in generating the confusion matrices when compared to NTL data, which captures more changes in the electricity system. Additionally, the resolution of the damage detected by NTL is relatively coarse at 500m, which is lower than the 30m resolution provided by the DPM. Although NASA currently offers the Black Marble HD product, which provides daily NTL data with 30m resolution, this product is currently limited to collaborators on funded projects. However, the tools to produce the HD products will be available through Google Earth Engine in the future [47], enabling researchers to generate higher-resolution damage degree maps using NTL with the Black Marble HD product.

Author Contributions

Conceptualization, J.D.F.; methodology, D.Z., H.H., N.R. and M.M.R.; software, D.Z.; validation, D.Z., H.H. and N.R.; formal analysis, D.Z.; investigation, D.Z. and H.H.; data curation, D.Z. and H.H.; writing—original draft preparation, D.Z. and H.H.; writing—review and editing, D.Z., H.H., M.M.R., N.R. and J.D.F.; visualization, D.Z.; supervision, J.D.F.; project administration, J.D.F. All authors have read and agreed to the published version of the manuscript.

Funding

This work was supported in part by the US National Science Foundation through support to the Georgia Institute of Technology for the Geotechnical Extreme Events Reconnaissance Association (GEER) under Grant No. CMMI 1826118. Additional support for author Frost was provided by the Elizabeth and Bill Higginbotham Professorship. The opinions in the paper are those of the authors and not the sponsors.

Data Availability Statement

The NTL data used in this research is publicly archived in Level-1 and Atmosphere Archive & Distribution System Distributed Active Archive Center: https://ladsweb.modaps.eosdis.nasa.gov/. The DPM data can be accessed through Jet Propulsion Laboratory ARIA project: https://aria-share.jpl.nasa.gov/.

Conflicts of Interest

The authors declare no conflict of interest.

References

  1. Damage Assessment Operations Manual. Available online: https://www.fema.gov/ (accessed on 1 December 2022).
  2. Gupta, R.; Goodman, B.; Patel, N.; Hosfelt, R.; Sajeev, S.; Heim, E.; Gaston, M. Creating xBD: A dataset for assessing building damage from satellite imagery. In Proceedings of the IEEE/CVF Conference on Computer Vision and Pattern Recognition Workshops, New Orleans, LA, USA, 19–20 June 2019. [Google Scholar] [CrossRef]
  3. Nighttime Lights: Backgrounder on VIIRS Day/Night Band and Its Application. Available online: https://www.earthdata.nasa.gov/learn/backgrounders/nighttime-lights (accessed on 1 December 2022).
  4. Zhao, X.; Yu, B.; Liu, Y.; Yao, S.; Lian, T.; Chen, L.; Yang, C.; Chen, Z.; Wu, J. NPP-VIIRS DNB Daily Data in Natural Disaster Assessment: Evidence from Selected Case Studies. Remote Sens. 2018, 10, 1526. [Google Scholar] [CrossRef]
  5. Feeny, S.; Trinh, T.-A.; de Silva, A. Detecting Disasters and Disaster Recovery in Southeast Asia: Findings from Space. Nat. Hazards Rev. 2022, 23, 04021065. [Google Scholar] [CrossRef]
  6. Del Valle, A.; Elliott, R.J.R.; Strobl, E.; Tong, M. The Short-Term Economic Impact of Tropical Cyclones: Satellite Evidence from Guangdong Province. Econ. Disasters Clim. Chang. 2018, 2, 225–235. [Google Scholar] [CrossRef]
  7. Miranda, J.J.; Ishizawa, O.A.; Zhang, H. Understanding the impact dynamics of windstorms on short-term economic activity from night lights in Central America. Econ. Disasters Clim. Chang. 2020, 4, 657–698. [Google Scholar] [CrossRef]
  8. Gillespie, T.W.; Frankenberg, E.; Chum, K.F.; Thomas, D. Nighttime lights time series of tsunami damage, recovery, and economic metrics in Sumatra, Indonesia. Remote Sens. Lett. 2014, 5, 286–294. [Google Scholar] [CrossRef] [PubMed]
  9. Zhao, M.; Zhou, Y.; Li, X.; Cao, W.; He, C.; Yu, B.; Li, X.; Elvidge, C.D.; Cheng, W.; Zhou, C. Applications of Satellite Remote Sensing of Nighttime Light Observations: Advances, Challenges, and Perspectives. Remote Sens. 2019, 11, 1971. [Google Scholar] [CrossRef]
  10. Xu, J.; Qiang, Y.; Cai, H. Power outage and environmental justice in Winter Storm Uri: An analytical workflow based on nighttime light remote sensing. Int. J. Digit. 2023, 16, 2259–2278. [Google Scholar] [CrossRef]
  11. Molthan, A.; Jedlovec, G. Satellite observations monitor outages from superstorm sandy. Eos Trans. Am. Geophys. 2013, 94, 53–54. [Google Scholar] [CrossRef]
  12. Skoufias, E.; Strobl, E.; Tveit, T. Can we rely on VIIRS nightlights to estimate the short-term impacts of natural hazards? Evidence from five South East Asian countries. Geomat. Nat. Hazards Risk 2021, 12, 381–404. [Google Scholar] [CrossRef]
  13. Román, M.O.; Wang, Z.; Sun, Q.; Kalb, V.; Miller, S.D.; Molthan, A.; Schultz, L.; Bell, J.; Stokes, E.C.; Pandey, B.; et al. Nasa’s black marble nighttime lights product suite. Remote Sens. Environ. 2018, 210, 113–143. [Google Scholar] [CrossRef]
  14. Wang, Z.; Román, M.O.; Sun, Q.; Molthan, A.L.; Schultz, L.A.; Kalb, V.L. Monitoring disaster-related power outages using NASA black marble nighttime light product. Int. Arch. Photogramm. Remote Sens. Spat. Inf. Sci. 2018, 42, 1853–1856. [Google Scholar] [CrossRef]
  15. Román, M.O.; Stokes, E.C.; Shrestha, R.; Wang, Z.; Schultz, L.; Carlo, E.A.S.; Sun, Q.; Bell, J.; Molthan, A.; Kalb, V. Satellite-based assessment of electricity restoration efforts in Puerto Rico after Hurricane Maria. PLoS ONE 2019, 14, e0218883. [Google Scholar] [CrossRef] [PubMed]
  16. Wang, Z.; Shrestha, R.M.; Román, M.O.; Kalb, V.L. NASA’s Black Marble Multiangle Nighttime Lights Temporal Composites. IEEE Geosci. Remote Sens. 2022, 19, 2505105. [Google Scholar] [CrossRef]
  17. Xu, J.; Qiang, Y. Spatial Assessment of Community Resilience from 2012 Hurricane Sandy Using Nighttime Light. Remote Sens. 2021, 13, 4128. [Google Scholar] [CrossRef]
  18. LAADS DAAC. Available online: https://ladsweb.modaps.eosdis.nasa.gov/ (accessed on 1 December 2022).
  19. Jet Propulsion Lab Aria. Available online: https://aria.jpl.nasa.gov/ (accessed on 1 December 2022).
  20. Google Earth. Available online: https://earth.google.com/web/ (accessed on 1 December 2022).
  21. Hurricane Maria Caused an Estimated 2975 Deaths in Puerto Rico, New Study Finds. Available online: https://www.cbsnews.com/news/hurricane-maria-death-toll-puerto-rico-2975-killed-by-storm-study-finds (accessed on 1 December 2022).
  22. Hurricane Death Toll in Puerto Rico More than Doubles to 34, Governor Says. Available online: https://www.theguardian.com/world/2017/oct/03/puerto-rico-new-death-toll-hurricane-maria-trump-visit (accessed on 1 December 2022).
  23. Hurricanes Nate, Maria, Irma, and Harvey Situation Reports. Available online: https://www.energy.gov/ceser/downloads/hurricanes-nate-maria-irma-and-harvey-situation-reports (accessed on 1 December 2022).
  24. Assessing the U.S. Climate in 2018. Available online: https://www.ncei.noaa.gov/news/national-climate-201812 (accessed on 1 December 2022).
  25. Hurricane Michael Caused 1.7 Million Electricity Outages in the Southeast United States. Available online: https://www.eia.gov/todayinenergy/detail.php?id=37332 (accessed on 1 December 2022).
  26. Major Preliminary Rainfall Totals for Hurricane Florence. Available online: https://www.ktvq.com/news/trending/2018/09/20/major-preliminary-rainfall-totals-for-hurricane-florence (accessed on 1 December 2022).
  27. Map: Hurricane Florence Power Outage. Available online: https://data.greenvilleonline.com/florence-power-outages/ (accessed on 1 December 2022).
  28. The Facts: Hurricane Dorian’s Devastating Effect on The Bahamas. Available online: https://reliefweb.int/report/bahamas/facts-hurricane-dorian-s-devastating-effect-bahamas (accessed on 1 December 2022).
  29. Damages and Other Impacts on Bahamas by Hurricane Dorian Estimated at $3.4 Billion: Report. Available online: https://www.iadb.org/en/news/damages-and-other-impacts-bahamas-hurricane-dorian-estimated-34-billion-report#:~:text=GREAT%20ABACO%2C%20The%20Bahamas%20%E2%80%93%20A,that%20will%20last%20for%20years (accessed on 1 December 2022).
  30. Hurricane Iota. Available online: https://en.wikipedia.org/wiki/Hurricane_Iota#:~:text=Mudslides%20caused%20extensive%20damage%20and,%24564%20million%20(2020%20USD) (accessed on 1 December 2022).
  31. Latin America & The Caribbean: 2020 Hurricane Season Situation Report No.4. Available online: https://reliefweb.int/report/honduras/latin-america-caribbean-2020-hurricane-season-situation-report-no-4-500pm-est-20 (accessed on 1 December 2022).
  32. NCDC Tornado Summaries. Available online: https://www.ncdc.noaa.gov/stormevents/listevents.jsp?eventType=%28C%29+Tornado&beginDate_mm=03&beginDate_dd=02&beginDate_yyyy=2020&endDate_mm=03&endDate_dd=03&endDate_yyyy=2020&hailfilter=0.00&tornfilter=0&windfilter=000&sort=DT&submitbutton=Search&statefips=-999%2CALL (accessed on 1 December 2022).
  33. Heavy Winds, Strong Storm Cause Power Outages across Middle Tennessee. Available online: https://www.newschannel5.com/news/power-outages-due-to-strong-storm-line-tornado-warning-winds (accessed on 1 December 2022).
  34. December 10–11, 2021 Tornado Outbreak. Available online: https://www.weather.gov/meg/dec102021tor (accessed on 1 December 2022).
  35. Kentucky Power Outage. Available online: https://poweroutage.us/area/state/kentucky (accessed on 23 June 2023).
  36. Earthquake Aftershocks Jolt Nepal as Death Toll Rises Above 3400. Available online: https://www.nytimes.com/2015/04/27/world/asia/katmandu-nepal-fear-loss-and-devastation.html?emc=edit_th_20150427&nl=todaysheadlines&nlid=58413496&_r=0 (accessed on 1 December 2022).
  37. Dhikari, B.; Mishra, S.; Babu Marahatta, S.; Kaehler, N.; Paudel, K.; Adhikari, J.; Raut, S. Earthquakes, Fuel Crisis, Power Outages, and Health Care in Nepal: Implications for the Future. Disaster Med. Public Health Prep. 2017, 11, 625–632. [Google Scholar] [CrossRef] [PubMed]
  38. Event: PUEBLA, MEXICO. Available online: https://www.ngdc.noaa.gov/hazel/view/hazards/earthquake/event-more-info/10267 (accessed on 1 December 2022).
  39. Satellite Images Show How Dark Puerto Rico is at Night after Earthquakes Caused Power Outages. Available online: https://www.cnn.com/2020/01/09/us/puerto-rico-earthquake-power-outages-satellite-images-trnd/index.html (accessed on 1 December 2022).
  40. No One is Coming to Save You. Available online: https://www.deseret.com/utah/2021/3/17/22325628/earthquake-lessons-from-a-year-ago-no-one-is-coming-to-save-you-utah-salt-lake-county-magna-disaster (accessed on 1 December 2022).
  41. Utah Earthquake: Big Aftershock Hits, Acid Plume no Longer Dangerous, Emergency Declarations Issued. Available online: https://www.sltrib.com/news/2020/03/18/earthquake-hits-utahs/ (accessed on 1 December 2022).
  42. Madni, A.M.; Erwin, D.; Sievers, M. Constructing Models for Systems Resilience: Challenges, Concepts, and Formal Methods. Systems 2020, 8, 3. [Google Scholar] [CrossRef]
  43. Jung, J.; Yun, S.-H. Evaluation of Coherent and Incoherent Landslide Detection Methods Based on Synthetic Aperture Radar for Rapid Response: A Case Study for the 2018 Hokkaido Landslides. Remote Sens. 2020, 12, 265. [Google Scholar] [CrossRef]
  44. Preston, B.L.; Backhaus, S.N.; Ewers, M.; Phillips, J.A.; Silva-Monroy, C.A.; Dagle, J.E.; King, T.J. Resilience of the US Electricity System: A Multi-Hazard Perspective; US Department of Energy Office of Policy: Washington, DC, USA, 2016.
  45. Imtiyaz, A. Parvez, Philippe Rosset, Chapter 11—The Role of Microzonation in Estimating Earthquake Risk. In Earthquake Hazard, Risk and Disasters; John, F., Shroder, M., Eds.; 2014; pp. 273–308. Available online: https://www.sciencedirect.com/science/article/pii/B9780123948489000110?via%3Dihub (accessed on 1 December 2022).
  46. NOAA Storm Prediction Center. Available online: https://www.spc.noaa.gov/wcm/#data (accessed on 12 August 2023).
  47. NASA’S Black Marble. Available online: https://blackmarble.gsfc.nasa.gov/ (accessed on 1 December 2022).
Figure 1. NTL of San Juan before and after Hurricane Maria. (a) VNP46A2 data before disaster. (b) VNP46A2 data after disaster.
Remotesensing 15 04257 g001
Figure 2. Hurricane Maria DPM (San Juan).
Remotesensing 15 04257 g002
Figure 3. Hurricanes study area; (a,b) show the study area of Hurricane Maria; (cf) illustrate the study area of Hurricane Michael, Hurricane Florence, Hurricane Iota, and Hurricane Dorian, respectively. The scale is at the bottom of each subfigure.
Remotesensing 15 04257 g003
Figure 4. Tornado study area. (a,b) illustrate the study area of Kentucky Tornado and Nashville Tornado, respectively. The scale is at the bottom of each subfigure.
Remotesensing 15 04257 g004
Figure 5. Earthquake study area; (a) shows the study area of Nepal Earthquake; (b,e) study of the Mexico Earthquake and Salt Lake City Earthquake, respectively; (c,d) illustrate the study area of the Puerto Rico Earthquake. The scale is at the bottom of each subfigure.
Remotesensing 15 04257 g005
Figure 6. Resilience curve [42].
Remotesensing 15 04257 g006
Figure 7. NTL resilience trend for hurricane events.
Remotesensing 15 04257 g007
Figure 8. NTL resilience trend for tornado events.
Remotesensing 15 04257 g008
Figure 9. NTL resilience trend for earthquake events.
Remotesensing 15 04257 g009
Figure 10. F1 score variation using the 15th, 16th, and 18th days before the post-disaster date as Radpre for hurricane events.
Remotesensing 15 04257 g010
Figure 11. F1 score variation using the 15th, 16th, and 18th days before the post-disaster date as Radpre for tornado events.
Remotesensing 15 04257 g011
Figure 12. F1 score variation using the 15th, 16th, and 18th days before the post-disaster date as Radpre for earthquake events.
Remotesensing 15 04257 g012
Figure 13. NTL-detected damage and the DPM of Hurricane Maria.
Remotesensing 15 04257 g013
Figure 14. The relationship between F1 score, average NTL, and hurricane category. (a) The relationship between F1 score and average NTL. (b) The relationship between F1 score and hurricane category. (c) The relationship between average NTL, hurricane category, and F1 score.
Remotesensing 15 04257 g014
Figure 15. Study area, DPM, tornado path, and damage detected by the NTL relative change ratio of tornado events. (a) Kentucky Tornado; (b) Nashville Tornado.
Remotesensing 15 04257 g015
Figure 16. NTL resilience trend for tornado events with study area along tornado path.
Remotesensing 15 04257 g016
Table 1. Disaster information.
Event TypeEvent Name and
Location
Study AreaEvent DegreeDate
HurricaneHurricane MariaSan JuanCategory 509/2017
Hurricane MariaPonceCategory 509/2017
Hurricane MichaelPanama CityCategory 510/2018
Hurricane FlorenceJacksonvilleCategory 109/2018
Hurricane IotaProvidenciaCategory 411/2020
Hurricane DorianWest Grand BahamaCategory 508/2019
TornadoKentucky TornadoBowling GreenEF412/2021
Nashville TornadoNashvilleEF303/2020
EarthquakeNepal EarthquakeKathmandu7.8 Mw05/2015
Mexico EarthquakeTexcoco7.1 Mw09/2017
Puerto Rico EarthquakeSan Juan6.4 Mw01/2020
Puerto Rico EarthquakePonce6.4 Mw01/2020
Salt Lake City EarthquakeSalt Lake City5.7 Mw03/2020
Table 2. Information on study area and pre-disaster satellite images from Google Earth View [20]. The “Top Right” and “Bottom Left” columns specify the coordinates of the respective corners for the study area in each image.
Event TypeEvent Name Study AreaTop RightBottom LeftSatellite Image Time StampJulian Date
(Pre-Disaster, Post-Disaster)
HurricaneHurricane MariaSan Juan18°27′60″N, 66°0′45″W18°19′60″N, 66°13′0″W12/2016(255, 270)
Hurricane MariaPonce17°58′45″N, 66°40′45″W18°3′15″N, 66°34′45″W12/2016(255, 270)
Hurricane MichaelPanama City30°15′59.76″N, 85°33′15″W30° 6′60″N, 85°44′30″W12/2017(270, 285)
Hurricane FlorenceJacksonville34°48′30″N, 77°21′30″W34°41′30″N, 77°31′60″W12/2017(248, 263)
Hurricane IotaProvidencia13°24′30″N, 81°20′15″W13°18′30″N, 81°25′15″W12/2019(310, 325)
Hurricane DorianWest Grand Bahama37° 2′45″N, 86°18′15″W36°54′60″N, 86°34′30″W12/2018(229, 244)
TornadoKentucky TornadoBowling Green37° 2′45″N, 86°18′15″W36°54′60″N, 86°34′30″W03/2021(331, 346)
Nashville TornadoNashville36°13′30″N, 86°39′15″W 36°6′30″N, 86°55′45″W12/2019(051, 066)
EarthquakeNepal EarthquakeKathmandu27°47′45″N, 85°30′0″E27°37′0″N, 85°18′15″E12/2014(101, 116)
Mexico EarthquakeTexcoco19°33′45″N, 98°47′45″W19°30′15″N, 98°54′30″W12/2016(247, 262)
Puerto Rico EarthquakeSan Juan18°28′30″N, 65°57′0″W18°20′30″N, 66°15′30″W12/2019(358(2019), 008(2020))
Puerto Rico EarthquakePonce18° 2′45″N, 66°34′30″W17°59′0″N, 66°40′30″W12/2019(357(2019), 007(2020))
Salt Lake City EarthquakeSalt Lake City40°50′0″N, 111°58′60″W40°42′30″N, 112° 8′0″W12/2019(063, 078)
Table 3. Pre-disaster daily NTL fluctuations.
Event TypeEvent NameStudy AreaDaily NTL Fluctuations (Pre-Disaster)
HurricaneHurricane MariaSan Juan9.59%
Hurricane MariaPonce8.02%
Hurricane MichaelPanama City9.54%
Hurricane FlorenceJacksonville7.04%
Hurricane IotaProvidencia9.39%
Hurricane DorianWest Grand Bahama8.11%
TornadoKentucky TornadoBowling Green10.97%
Nashville TornadoNashville3.64%
EarthquakeNepal EarthquakeKathmandu13.72%
Mexico EarthquakeTexcoco4.95%
Puerto Rico EarthquakeSan Juan14.09%
Puerto Rico EarthquakePonce15.21%
Salt Lake City EarthquakeSalt Lake City7.41%
Table 4. The confusion matrices, accuracy, and F1 scores of different disasters in damaged/undamaged detection using daily NTL data as Radpre.
Event TypeEvent Name and LocationDDNTL DetectedAccuracyF1
DamagedUndamaged
HurricaneHurricane Maria (San Juan)Damaged11931610.8390.904
Undamaged91123
Hurricane Maria (Ponce)Damaged2911070.6850.811
Undamaged295
Hurricane Michael (Panama City)Damaged1196200.7560.859
Undamaged37430
Hurricane Florence (Jacksonville)Damaged4412250.5510.609
Undamaged303237
Hurricane IotaDamaged61570.7000.459
Undamaged87275
Hurricane DorianDamaged35380.6410.768
Undamaged20833
TornadoKentucky Tornado (Bowling Green)Damaged6405020.4940.557
Undamaged518355
Nashville TornadoDamaged6342290.4640.561
Undamaged761224
EarthquakeNepal EarthquakeDamaged956740.5100.659
Undamaged91675
Mexico Earthquake (2017, Texcoco)Damaged259710.7040.863
Undamaged417
Puerto Rico Earthquake (San Juan)Damaged7566190.5630.593
Undamaged417576
Puerto Rico Earthquake (Ponce)Damaged154830.5580.660
Undamaged7647
Salt Lake City EarthquakeDamaged3092480.5600.565
Undamaged227296
Table 5. The confusion matrices, accuracy, and F1 scores of different disasters in damaged/undamaged detection using monthly NTL data as Radpre.
Event TypeEvent Name and LocationDDNTL DetectedAccuracyF1
Damaged Undamaged
HurricaneHurricane Maria (San Juan)Damaged12011650.8420.906
Undamaged83119
Hurricane Maria (Ponce)Damaged2961070.6970.819
Undamaged245
Hurricane Michael (Panama City)Damaged1280250.8060.890
Undamaged29025
Hurricane Florence (Jacksonville)Damaged4782990.5450.641
Undamaged236163
Hurricane IotaDamaged59400.7320.477
Undamaged89292
Hurricane DorianDamaged30280.5560.693
Undamaged25933
TornadoKentucky Tornado (Bowling Green)Damaged3742270.4980.425
Undamaged784630
Nashville TornadoDamaged7272390.5090.616
Undamaged668214
EarthquakeNepal EarthquakeDamaged910250.5110.648
Undamaged962124
Mexico Earthquake (2017, Texcoco)Damaged223640.6270.760
Undamaged7714
Puerto Rico Earthquake (San Juan)Damaged2972400.5290.347
Undamaged876955
Puerto Rico Earthquake (Ponce)Damaged48430.3750.299
Undamaged18287
Salt Lake City EarthquakeDamaged2071440.5620.467
Undamaged329400
Table 6. The PCC of different disasters.
Event TypeEvent Name and LocationPCC
HurricaneHurricane Maria (San Juan)−0.068
Hurricane Maria (Ponce)−0.152
Hurricane Michael (Panama City)−0.269
Hurricane Florence (Jacksonville)0.049
Hurricane Iota−0.081
Hurricane Dorian0.146
TornadoKentucky Tornado (Bowling Green)−0.121
Nashville Tornado−0.041
EarthquakeNepal Earthquake−0.193
Mexico Earthquake (2017, Texcoco)0.064
Puerto Rico Earthquake (San Juan)−0.001
Puerto Rico Earthquake (Ponce)0.061
Salt Lake City Earthquake−0.077
Table 7. The confusion matrices, accuracy, and F1 scores of tornados in damaged/undamaged detection along the tornado path.
Event TypeEvent Name and LocationDDNTL DetectedAccuracyF1
DamagedUndamaged
TornadoKentucky Tornado (Bowling Green)Damaged27470.3670.466
Undamaged159
Nashville TornadoDamaged439850.7060.819
Undamaged10927
Disclaimer/Publisher’s Note: The statements, opinions and data contained in all publications are solely those of the individual author(s) and contributor(s) and not of MDPI and/or the editor(s). MDPI and/or the editor(s) disclaim responsibility for any injury to people or property resulting from any ideas, methods, instructions or products referred to in the content.

