Article

Calibrating Nighttime Satellite Imagery with Red Photometer Networks

by
Borja Fernandez-Ruiz
1,*,
Miquel Serra-Ricart
2,3,4,
Miguel R. Alarcon
2,3,
Samuel Lemes-Perera
4,5,6,
Idafen Santana-Perez
1 and
Juan Ruiz-Alzola
1,2
1
Departamento de Señales y Comunicaciones, Universidad de Las Palmas de Gran Canaria, Paseo Blas Cabrera Felipe s/n, E-35016 Las Palmas de Gran Canaria, Canarias, Spain
2
Instituto de Astrofísica de Canarias (IAC), C/Vía Láctea s/n, E-38205 La Laguna, Canarias, Spain
3
Departamento de Astrofísica, Universidad de La Laguna (ULL), E-38206 La Laguna, Canarias, Spain
4
Light Bridges S.L., Avda. Alcalde Ramírez Bethencourt, 17, E-35004 Las Palmas de Gran Canaria, Canarias, Spain
5
Departamento de Ingeniería Informática y de Sistemas, Universidad de La Laguna (ULL), E-38206 La Laguna, Canarias, Spain
6
Instituto Tecnológico y de Energías Renovables (ITER), Polígono Industrial de Granadilla s/n, E-38600 Granadilla de Abona, Canarias, Spain
*
Author to whom correspondence should be addressed.
Remote Sens. 2023, 15(17), 4189; https://doi.org/10.3390/rs15174189
Submission received: 30 June 2023 / Revised: 9 August 2023 / Accepted: 18 August 2023 / Published: 25 August 2023
(This article belongs to the Section Urban Remote Sensing)

Abstract

:
The data retrieved from satellite imagery and ground-based photometers are the two main sources of information on light pollution and are thus the two main tools for tackling the problem of artificial light pollution at night (ALAN). While satellite data offer high spatial coverage, on the other hand, photometric data provide information with a higher degree of temporal resolution. Thus, studying the proper correlation between both sources will allow us to calibrate and integrate them to obtain data with both high temporal resolution and spatial coverage. For this purpose, more than 15,000 satellite measurements and 400,000 measurements from 72 photometers for the year 2022 were used. The photometers used were the Sky-Glow Wireless Autonomous Sensor (SG-WAS) and Telescope Encoder and Sky Sensor WIFI (TESS-W) types, located at different ground-based locations, mainly in Spain. These photometers have a spectral sensitivity closer to that of VIIRS than to the Sky Quality Meter (SQM). In this study, a good correlation of data from the Day–Night Band (DNB) from the Visible Infrared Imaging Radiometer Suite (VIIRS) with a red photometric network between 19.41 mag/arcsec 2 and 21.12 mag/arcsec 2 was obtained.

1. Introduction

Artificial light at night (ALAN) is an environmental problem affecting most of the terrestrial surface [1], reaching faraway places from its sources due to the skyglow generated by atmospheric dispersion. It is the result of excessive and inappropriate artificial lighting, which can cause a wide variety of negative impacts on the environment, including ecosystem imbalance [2,3,4,5] and a negative impact on human health [6,7,8]. Artificial lighting can disrupt ecosystems by affecting the natural behavior of nocturnal animals [9,10] and can cause light-sensitive organisms to lose orientation [11,12]. It can also interfere with natural circadian rhythms [13]. Additionally, light pollution can interfere with the behavior of migratory birds [14,15]. It also affects our view of the night sky and interferes with astronomical observing sites [16].
Traditionally, light pollution has been studied using nighttime satellite images [1,17,18]. In recent years, however, the reduction in the cost of night photometers has allowed for the deployment of large ground-based networks that offer new means of making artificial skyglow measurements. These networks are especially useful in areas of high darkness, where the lack of relative precision and sensitivity of the satellite prevents adequate measurement. Another advantage of these networks is the higher temporal resolution, taking several measurements per hour, versus the daily measurements that satellites usually offer. This allows studies on the variability in light pollution over much shorter periods.
The first low-cost photometer developed was the Unihedron Sky Quality Meter (SQM) [19]. Later, the Telescope Encoder and Sky Sensor WIFI (TESS-W) [20] was developed by the European-funded project STARS4ALL (www.stars4all.eu (accessed on 28 Febraury 2023)), with a more extended spectral response in the red (400–800 nm) to include the emission lines of High Pressure Sodium (HPS) lamps. Finally, the European-funded project EELabs (www.eelabs.eu (accessed on 23 June 2023)) built the Sky-Glow Wireless Autonomous Sensor (SG-WAS) [21] photometer with a similar spectral range but solar powered, wireless and Internet-of-things-based, allowing them to be placed in very isolated areas, such as natural protected areas. Due to the inclusion of the dichroic filter, SG-WAS and TESS-W photometers (hereafter, SG and TESS) are better suited for tracking changes in night sky brightness compared to SQM and allow the detection of night sky brightness in the yellowish–reddish range of spectra (the HPS range), as depicted in Figure 1.
In this context, studying the correlation between satellite and photometer network data is of particular interest, so that we can convert one into the other in order to carry out studies with both integrated sources. Previous studies in the regions of Madrid (Spain) [17] and Bandung (Indonesia) [22] obtained a significant correlation between satellite and SQM data. These results are highly relevant, particularly when updating them to redder photometers such as TESS and SG, with a spectral sensitivity closer to VIIRS sensitivity, and opens up the study to a wider area and an interesting challenge.
Figure 1. Spectral response curve of the SG [21] and TESS [23] photometers and the VIIRS DNB. The transmittance of the SQM-L photometer and Johnson–Cousins [24,25] BVRI filters is included as a reference. Johnson–Cousins BVRI filters are a widely used photometric system in astronomy, which consists of the filters B (blue), V (visual), R (red) and I (infrared). The night sky spectrum obtained using the SkyCalc tool [26], where the brightest airglow lines are labelled, is shown. Reproduced with permission from Alarcon et al. 2021 AJ 162 25 [23].
Remotesensing 15 04189 g001
In this paper, the transformation function between the Day–Night Band (DNB) of the Visible Infrared Imaging Radiometer Suite (VIIRS) data and SG and TESS photometers is obtained by studying the correlation between both data sources, including 502 photometers from all around the globe. We analyze the distribution and coherence of the data in order to filter outliers and noisy data. This exhaustive data cleaning process reduces the sample to 203 photometers. The paper is organized as follows: in Section 2 a detailed description of the photometer network and satellite data is given; Section 3 includes a description of the data analysis, cleaning and wrangling procedures, and regression method; the satellite and photometer correlation, and an example of its application to a village in Spain are presented in Section 4; Section 5 includes its discussion; and our conclusions are given in Section 6.

2. Materials

In this section, we describe the two data sources: satellite and photometer networks. Additionally, we elaborate on the primary phenomena that can affect night sky brightness (NSB) and are essential to filter.

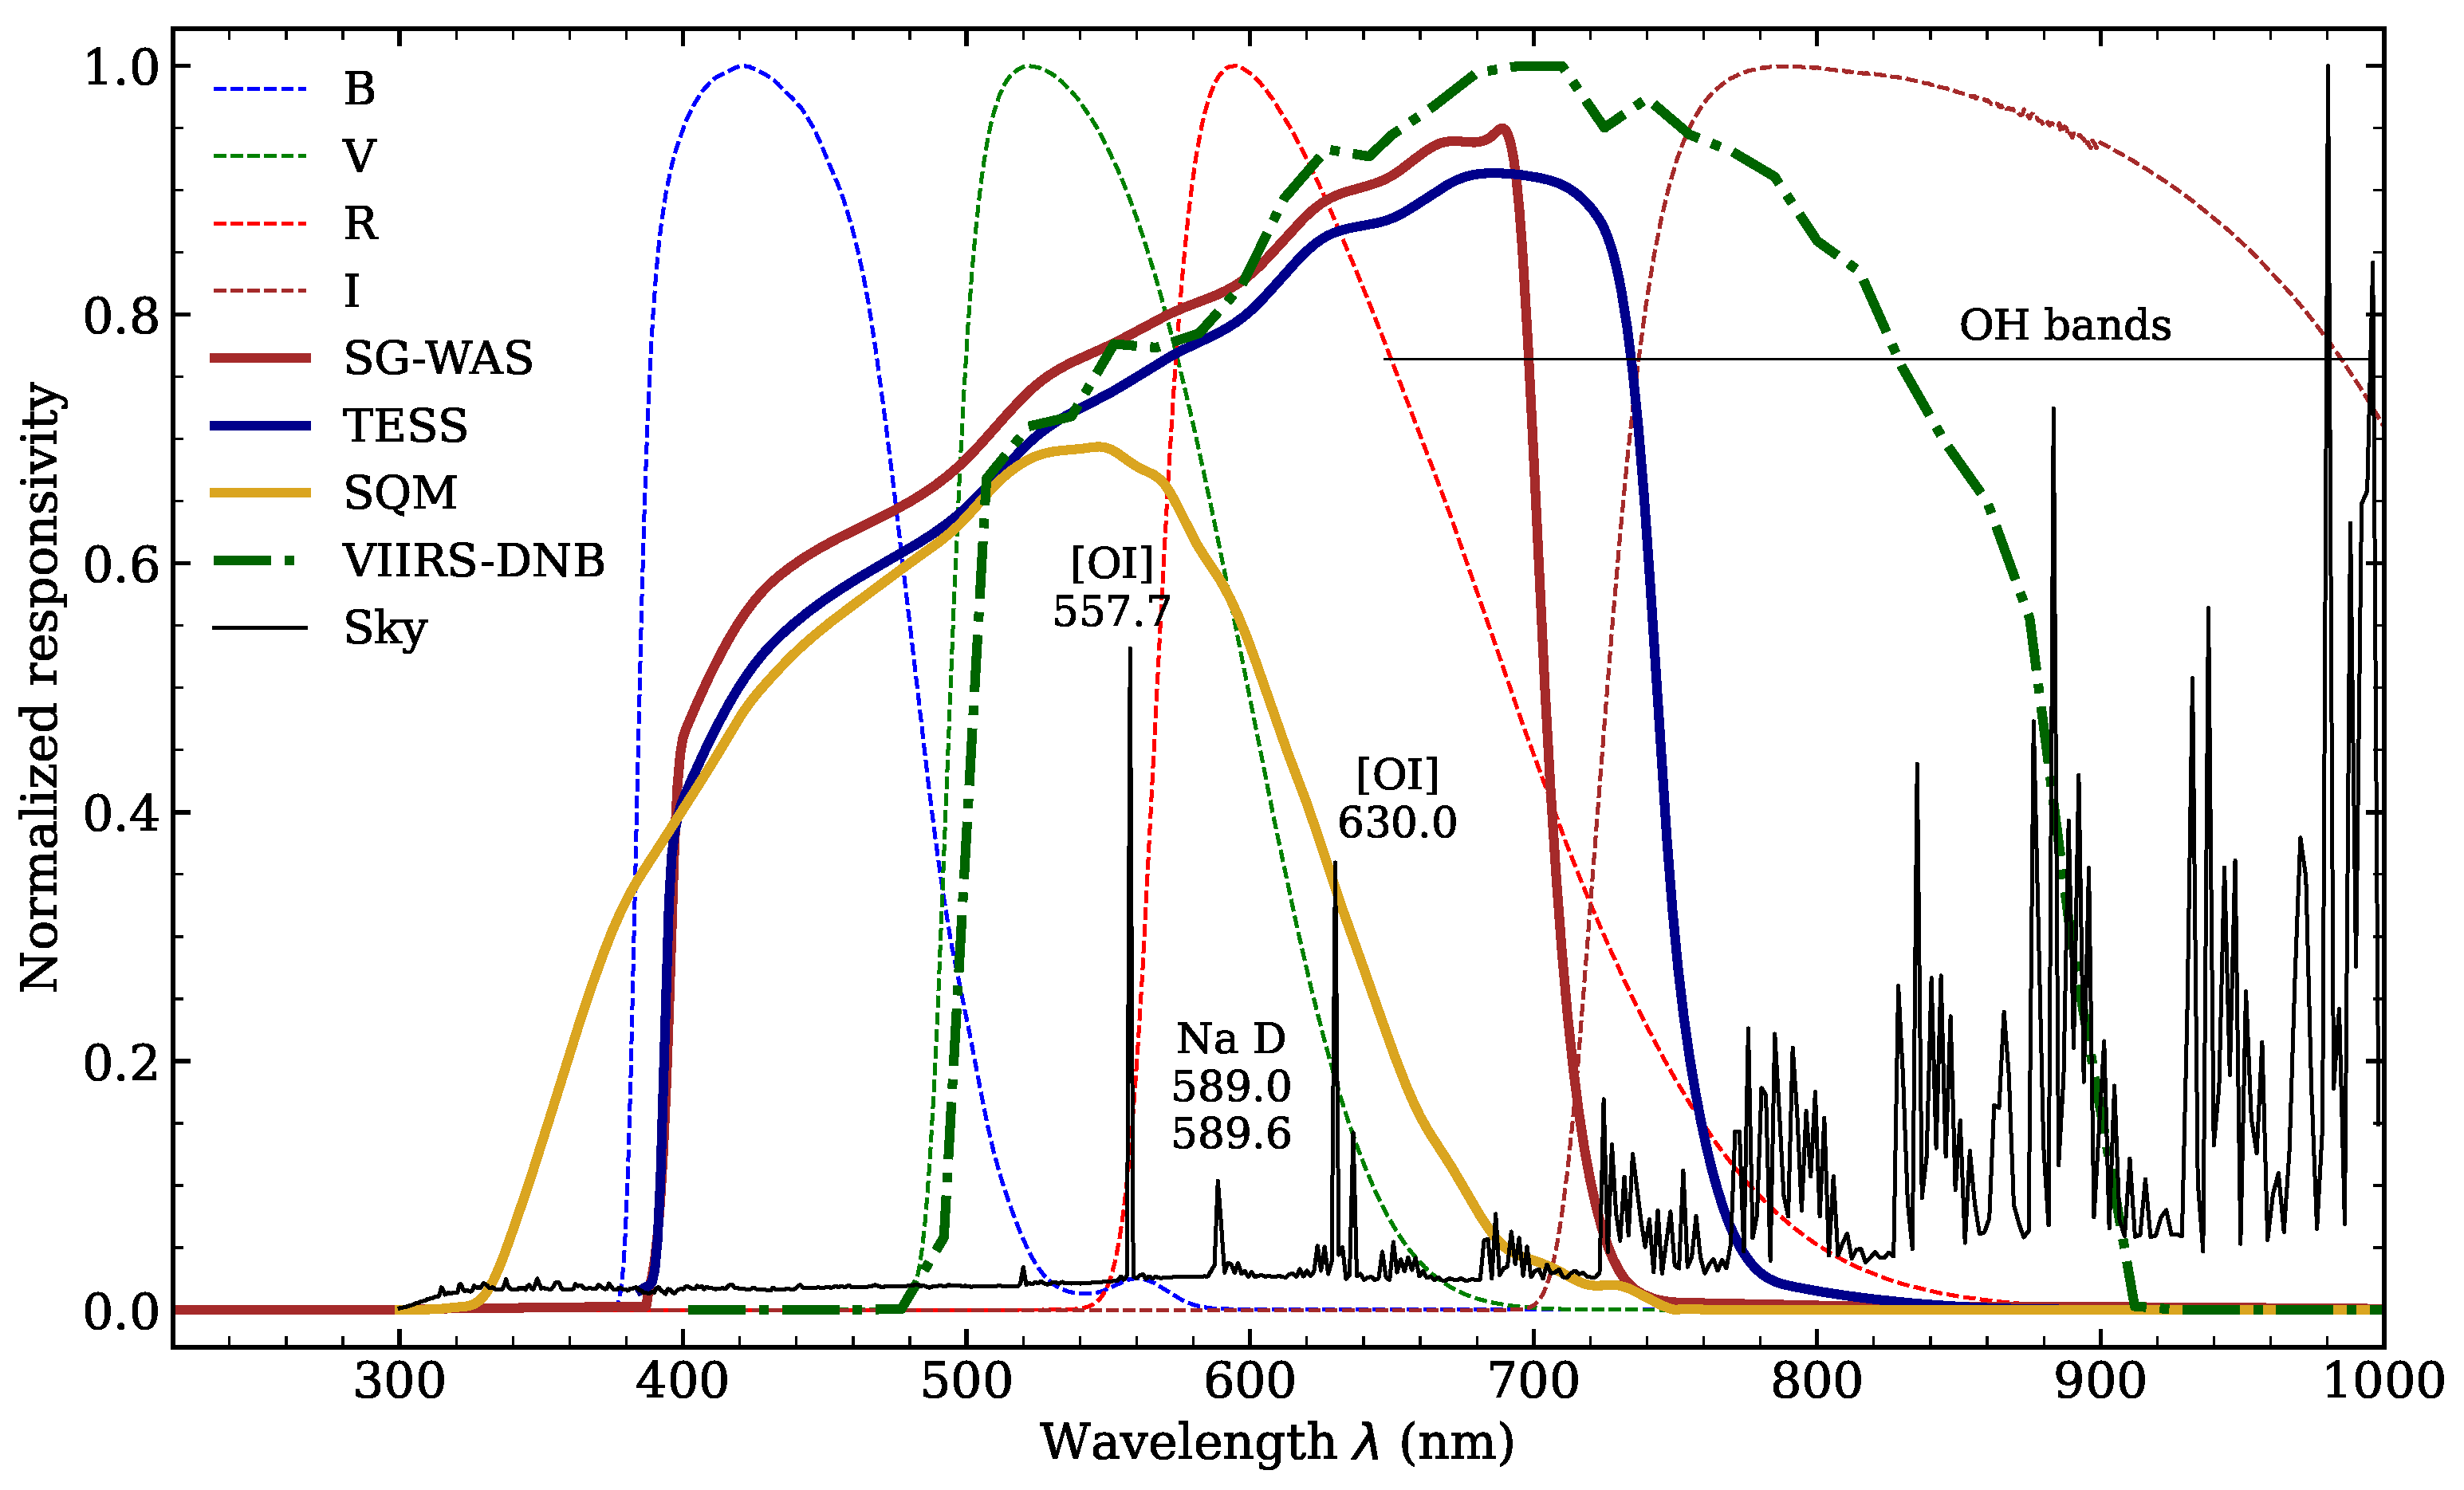
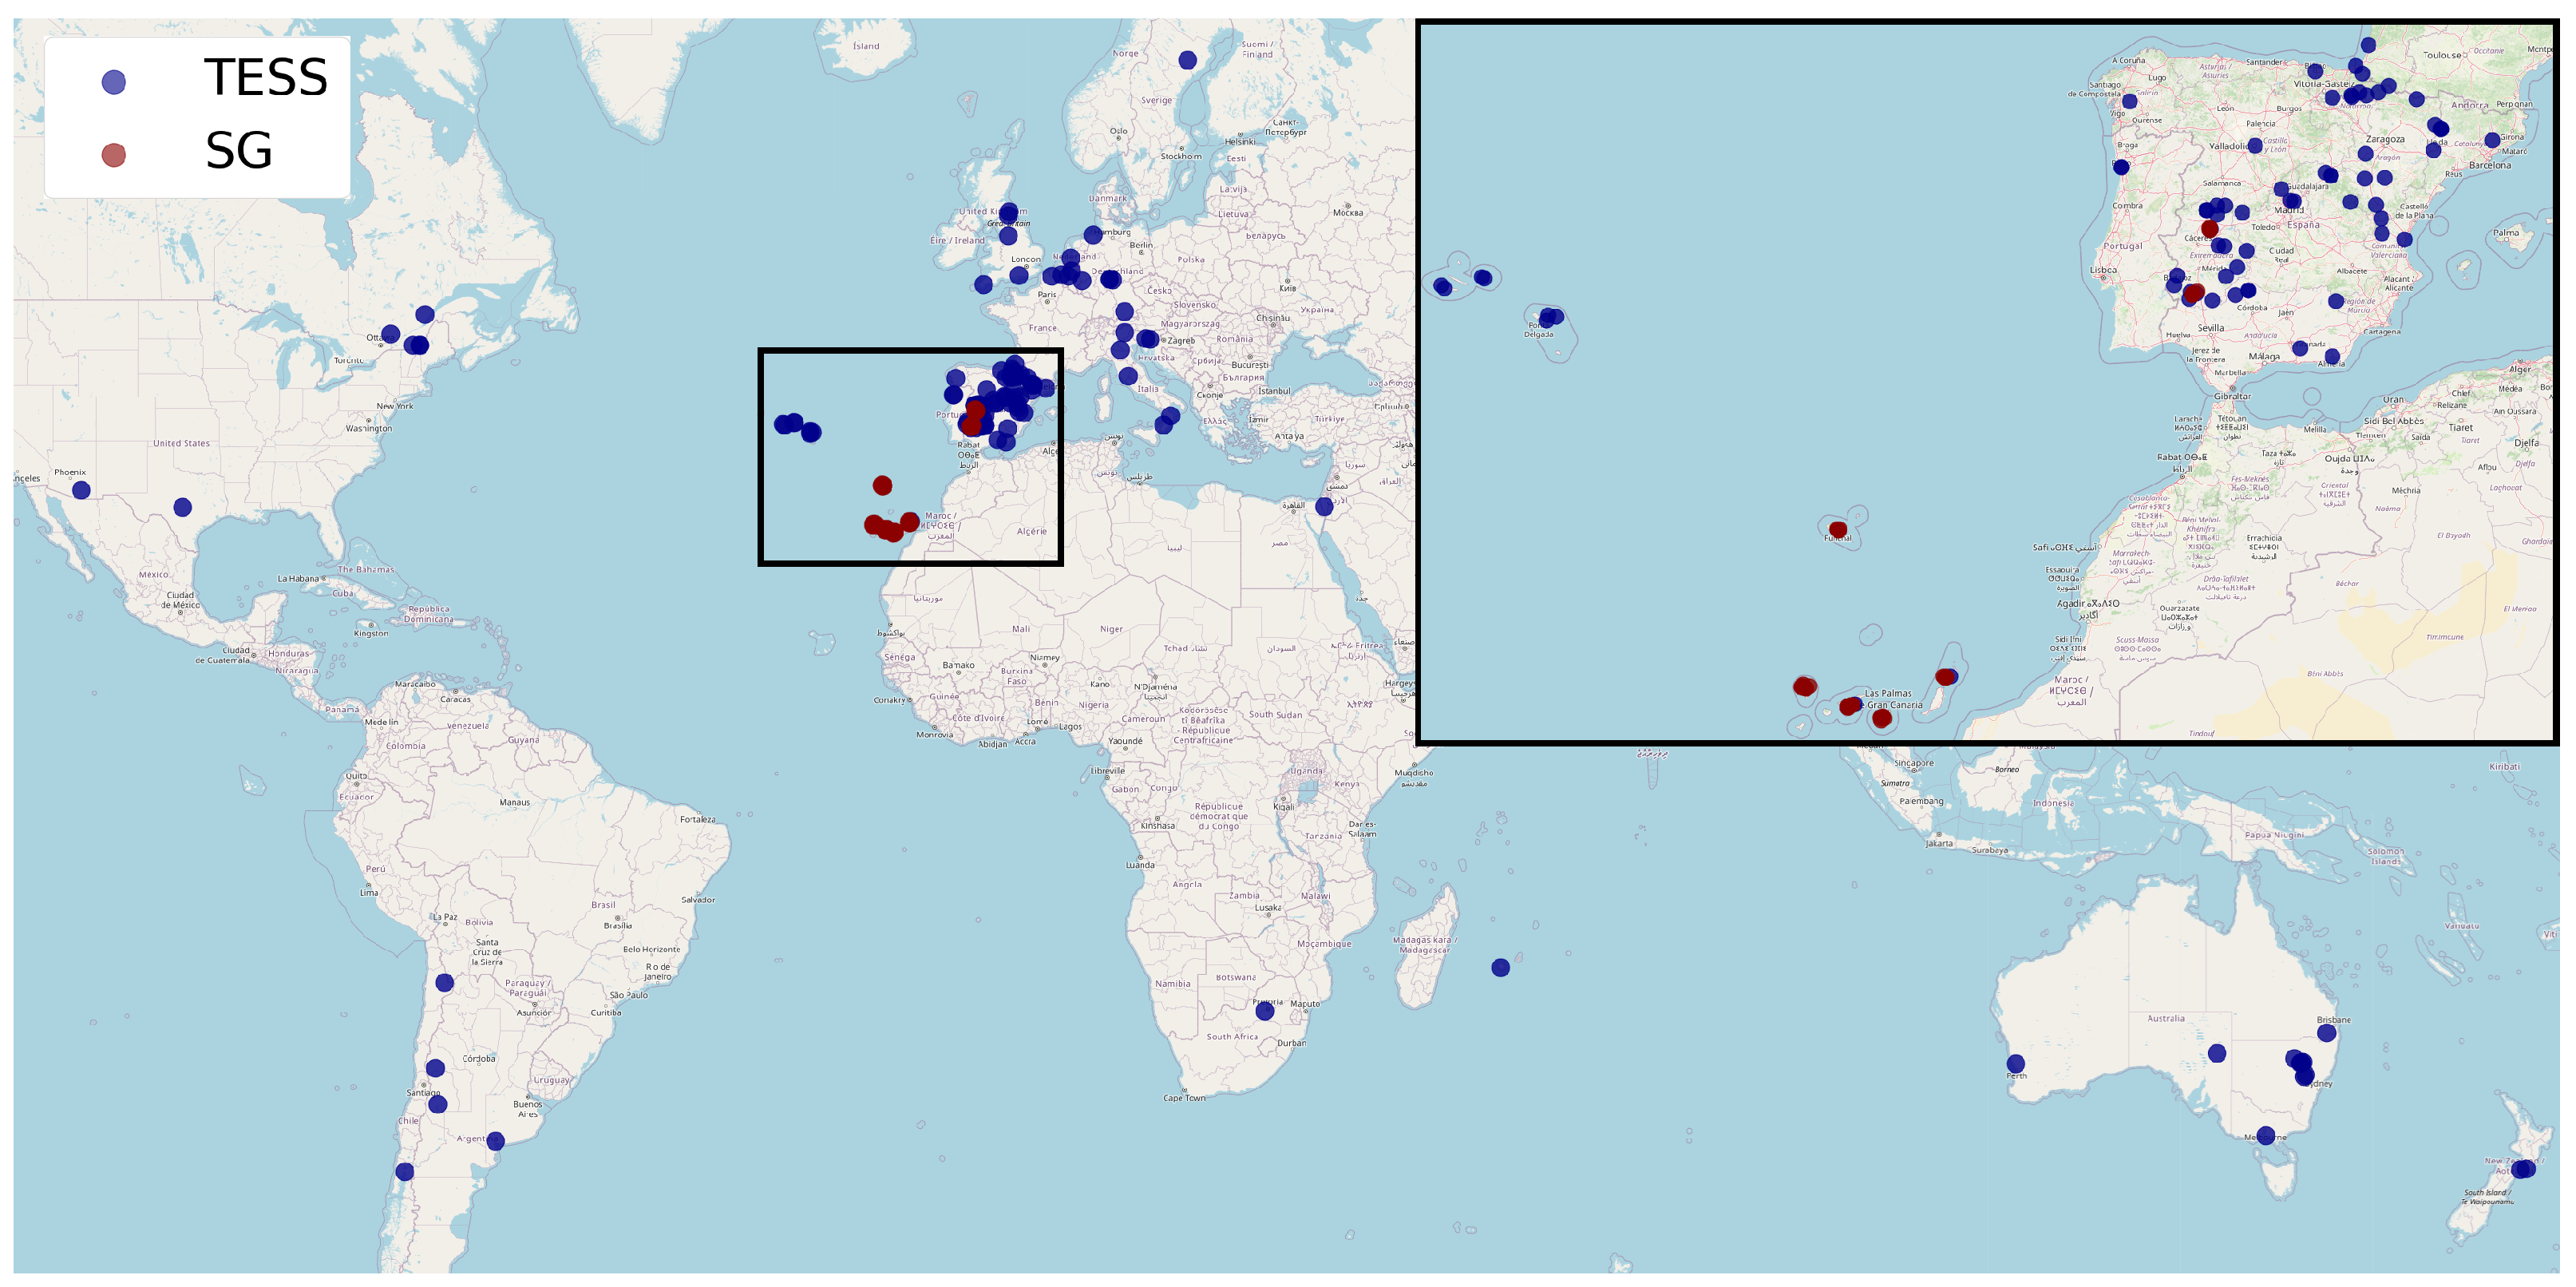
2.1. Photometer Network and VIIRS DNB Data

For satellite information, we include the VIIRS DNB data from the Suomi NPP satellite. VIIRS takes an image of the Earth’s brightness every night, around 1:30 local time. VIIRS DNB measurements have a resolution of 750 m. In this study, we used the VIIRS Level 3 product called “Black Marble”, specifically the daily product VNP46A2 [27]. It is generated using a retrieval algorithm that performs cloud, atmospheric, terrain, vegetation, snow, lunar and stray light corrections to estimate nighttime lights. VNP46A2 is a global image with a resolution of 15 arcsec, about 500 m, and geolocation uncertainty of 50 m. It does not provide brightness data for pixels with large water surfaces. VNP46A2 measurements are taken in nW/(cm 2 sr) with an uncertainty of 0.1 nW/(cm 2 sr) and detection limit of 0.5 nW/(cm 2 sr). These parameters can vary depending on the area. This limits the satellite’s ability to make reliable measurements in the darkest areas. The VIIRS DNB spectral response is extended approximately 100 nm towards the red compared to that of the photometers, as shown in Figure 1. The spectral overlap between SG and TESS with VIIRS is greater than the SQM, which is not very sensitive in the red zone. For this reason, SG and TESS photometers are much more suitable than SQM when looking for correlations with satellite data.
The satellite data used correspond to the entire year 2022 in order to reduce possible seasonal effects. However, the VIIRS did not take measurements from 27 July to 10 August, both inclusive. In addition, some photometers are located in pixels where there are no satellite data available, mainly owing to excessive water inside the pixel. This occurs, for example, on Corvo Island in the Azores (Portugal), where, despite having a network of photometers available, there are no data from VNP46A2.
The analysis presented in this work is based on zenithal night sky brightness measurements, performed by a large photometer network deployed by two European projects (STARS4ALL and EELabs). The first one [20] has a global planet distribution but with a very low density. In contrast, EELabs [21] includes several high-density areas, being mainly deployed in Extremadura (Spain) and part of the Macaronesia region. The EELabs network is mostly composed of SG-WAS photometers, usually grouped into the so-called Light Pollution Laboratories (LPL), whereas TESS photometers comprise most of the STARS4ALL global network. In Figure 2, a map is presented depicting the locations of the photometers. The measurements collected by the EELabs and STARS4ALL networks are openly available in real time at the IoT-EELab data portal (data.eelabs.eu (accessed on 19 June 2023)).
The main characteristics of the TESS and SG photometers are shown in Table 1. The SG photometers are autonomous due to them having solar-powered rechargeable batteries installed [21]. Most TESS photometers take measurements every minute, but there are exceptions (Table 2). Both photometers measure the zenithal night sky brightness in mag/arcsec 2 . In addition, they present a similar but not identical spectral response (see Figure 1).
In this work, we include a total of 263 TESS and 239 SG photometers. All photometers are still collecting data, but for the current analysis, we focus our study only on data for 2022, this being the period with higher data density including both types of photometers over a period long enough to cover different seasons of the year.
The stars4 and stars679 photometers were discarded from this network. The first one included too many anomalous data points between 14 December and 8 January. The second one (in Pamplona, Spain) measured values that were too dark for photometers inside a city. Figure 3 shows the distribution of the photometers according to the P50 brightness in their location measured by VIIRS in 2022. All photometers before the data cleaning and wrangling are shown in the upper graph. TESS and SG have more photometers located in dark areas: 60% of the SG and 53% of the TESS photometers are located in areas with brightness levels below 1 nW/(cm 2 sr). In general, for bright areas, TESS photometers provide better coverage, as SG photometers are scarcer in those areas.

2.2. Natural Effects That Contribute to the Night Sky Brightness

Night sky brightness (NSB) can be affected by different natural phenomena, both astronomical, mainly due to the Sun, the Moon, the Milky Way and the zodiacal light, and atmospheric (such as the presence of clouds [23]). These phenomena affect the measurements of photometers and satellites in different ways. A good example of this is the effect produced by clouds. While they always cause a dimming effect on satellite measurements, in polluted areas, photometers can show an increase in brightness due to light reflection. Therefore, in order to compare both sources, it is necessary to filter out all these effects.
In the case of the photometer network data, several filters have been developed based on different astronomical parameters that determine the ranges in which the effects of the Sun, Moon, Milky Way and zodiacal light should be taken into account [23]. In addition, a method has been implemented to discern the presence of clouds based on the dispersion of magnitude in 10 min intervals [23]. These filters remove the data points that are affected by these phenomena. With these applied to all measurements in the photometer networks, several photometers are removed as they do not include any single measurements in the period studied.
As for the VIIRS data, NASA itself subtracts the contribution of lunar brightness and other effects [27]. VIIRS, however, provides three indicators regarding cloud detection for each measurement: a general classifier, cirrus detection and shadow detection [27]. Here, we consider those data points that show negative results in all three parameters as being cloud-free.

3. Methods

In the present section, we first perform an analysis of photometer data with the objective of defining the necessary filters for subsequent data cleaning. Next, we present the data cleaning and wrangling process based on the previous analysis. Finally, we describe the regression method used to obtain the transformation equation between satellite and photometer data for the calibration of VIIRS.

3.1. Photometer Data Analysis

In this section, an analysis of the data collected by the photometer network in the year 2022 is carried out to define the criteria for subsequent filtering. Section 3.1.1 examines the minimum amount of data that a photometer must have to be considered significant and usable. In Section 3.1.2, the impact on the galaxy is studied based on the magnitude of light pollution in the area. This allows us to determine the magnitude range where it is truly necessary to apply this filter, in order to avoid unnecessary data loss. Section 3.1.3 describes the distribution of photometer data with the aim of characterizing the typical distribution of a photometer. Finally, in Section 3.1.4, based on the previous analysis, the justification for using the interquartile range (IQR) as an appropriate parameter for detecting photometers with anomalous behaviors is provided.

3.1.1. Optimal Minimum Sample Size

For various reasons, data from photometers tend to include a significant amount of undesirable values, such as interference due to direct emissions from nearby artificial lights. To tackle this issue, we apply different statistical approaches in order to detect those measurements that represent abnormal behavior in the yearly distribution of photometer data for 2022. The yearly median, P50, is used as the central measure, and the yearly IQR, P75−P25, is used as the measure of spread and dispersion, as they represent robust statistical tools in the context of our data. In this part, the minimum sample size necessary for these statistics to be representative of the distribution is studied.
It was decided to apply a bootstrapping method [28] that allows confidence intervals to be deteremined through subsampling of the original sample collected by the photometer. However, this method presents faults when obtaining intervals for percentiles accurately, mainly when the sample size is small or the original distribution is strongly asymmetric or skewed. These reasons make it a generally unsuitable method for obtaining individual uncertainties for all photometers; it is reliable only for photometers with large amounts of data and the scant presence of anomalous values.
Based on these considerations, we selected eight photometers with large amounts of data, including both TESS and SG photometers located in bright (P50 < 21 mag) and dark (P50 > 21 mag) areas. The details of these photometers are shown in the Table 3. We applied the bootstrapping method with different subsample sizes to obtain approximate confidence intervals for both P50 and P75−P25 . In Figure 4, the width of the 95% confidence interval is shown as a function of the subsample size for 100 subsamples. In this graph, it can be seen that the width of the confidence intervals reduces considerably as it approaches 1000 data points and stabilizes thereafter. Below 500, the uncertainty levels are very high. Between 500 and 1000, intermediate behavior is observed where most of the uncertainty has been reduced but without complete stabilization. To avoid the excessive loss of photometers considered in the study, we decided not to be too strict by establishing the minimum sampling size of 500 data points. The data from photometers with a sample size smaller than 500 were discarded.

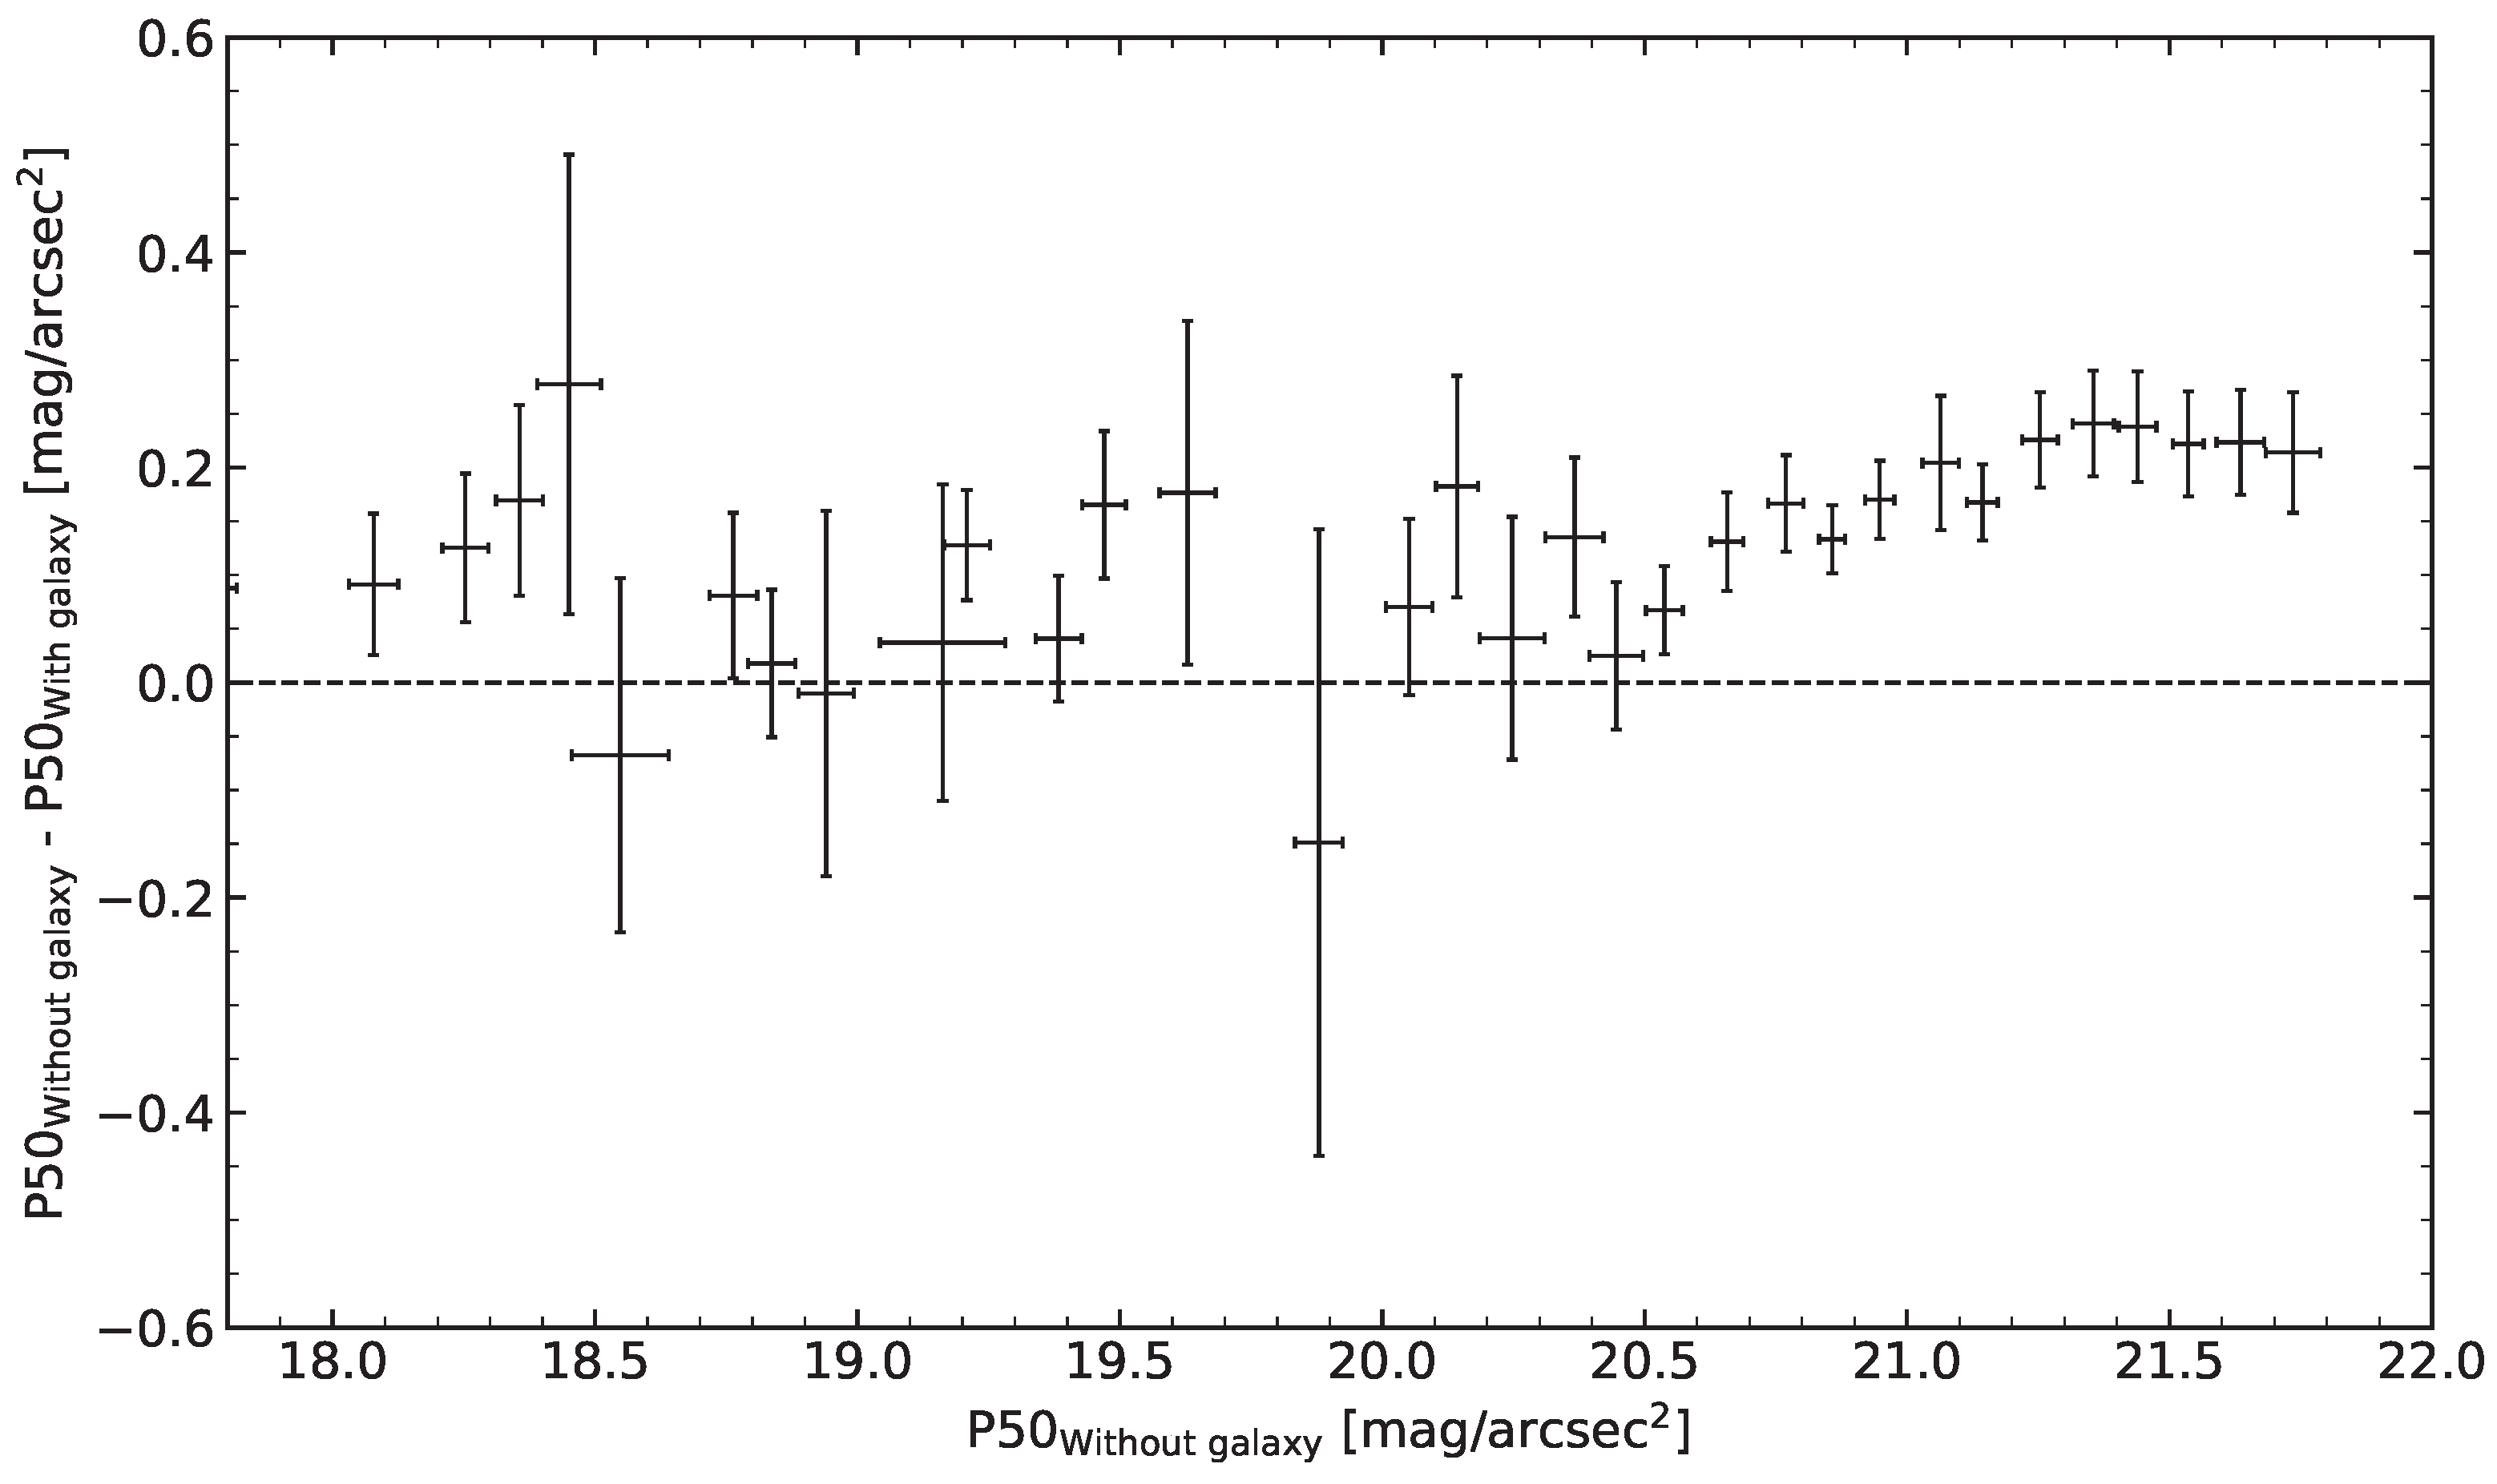
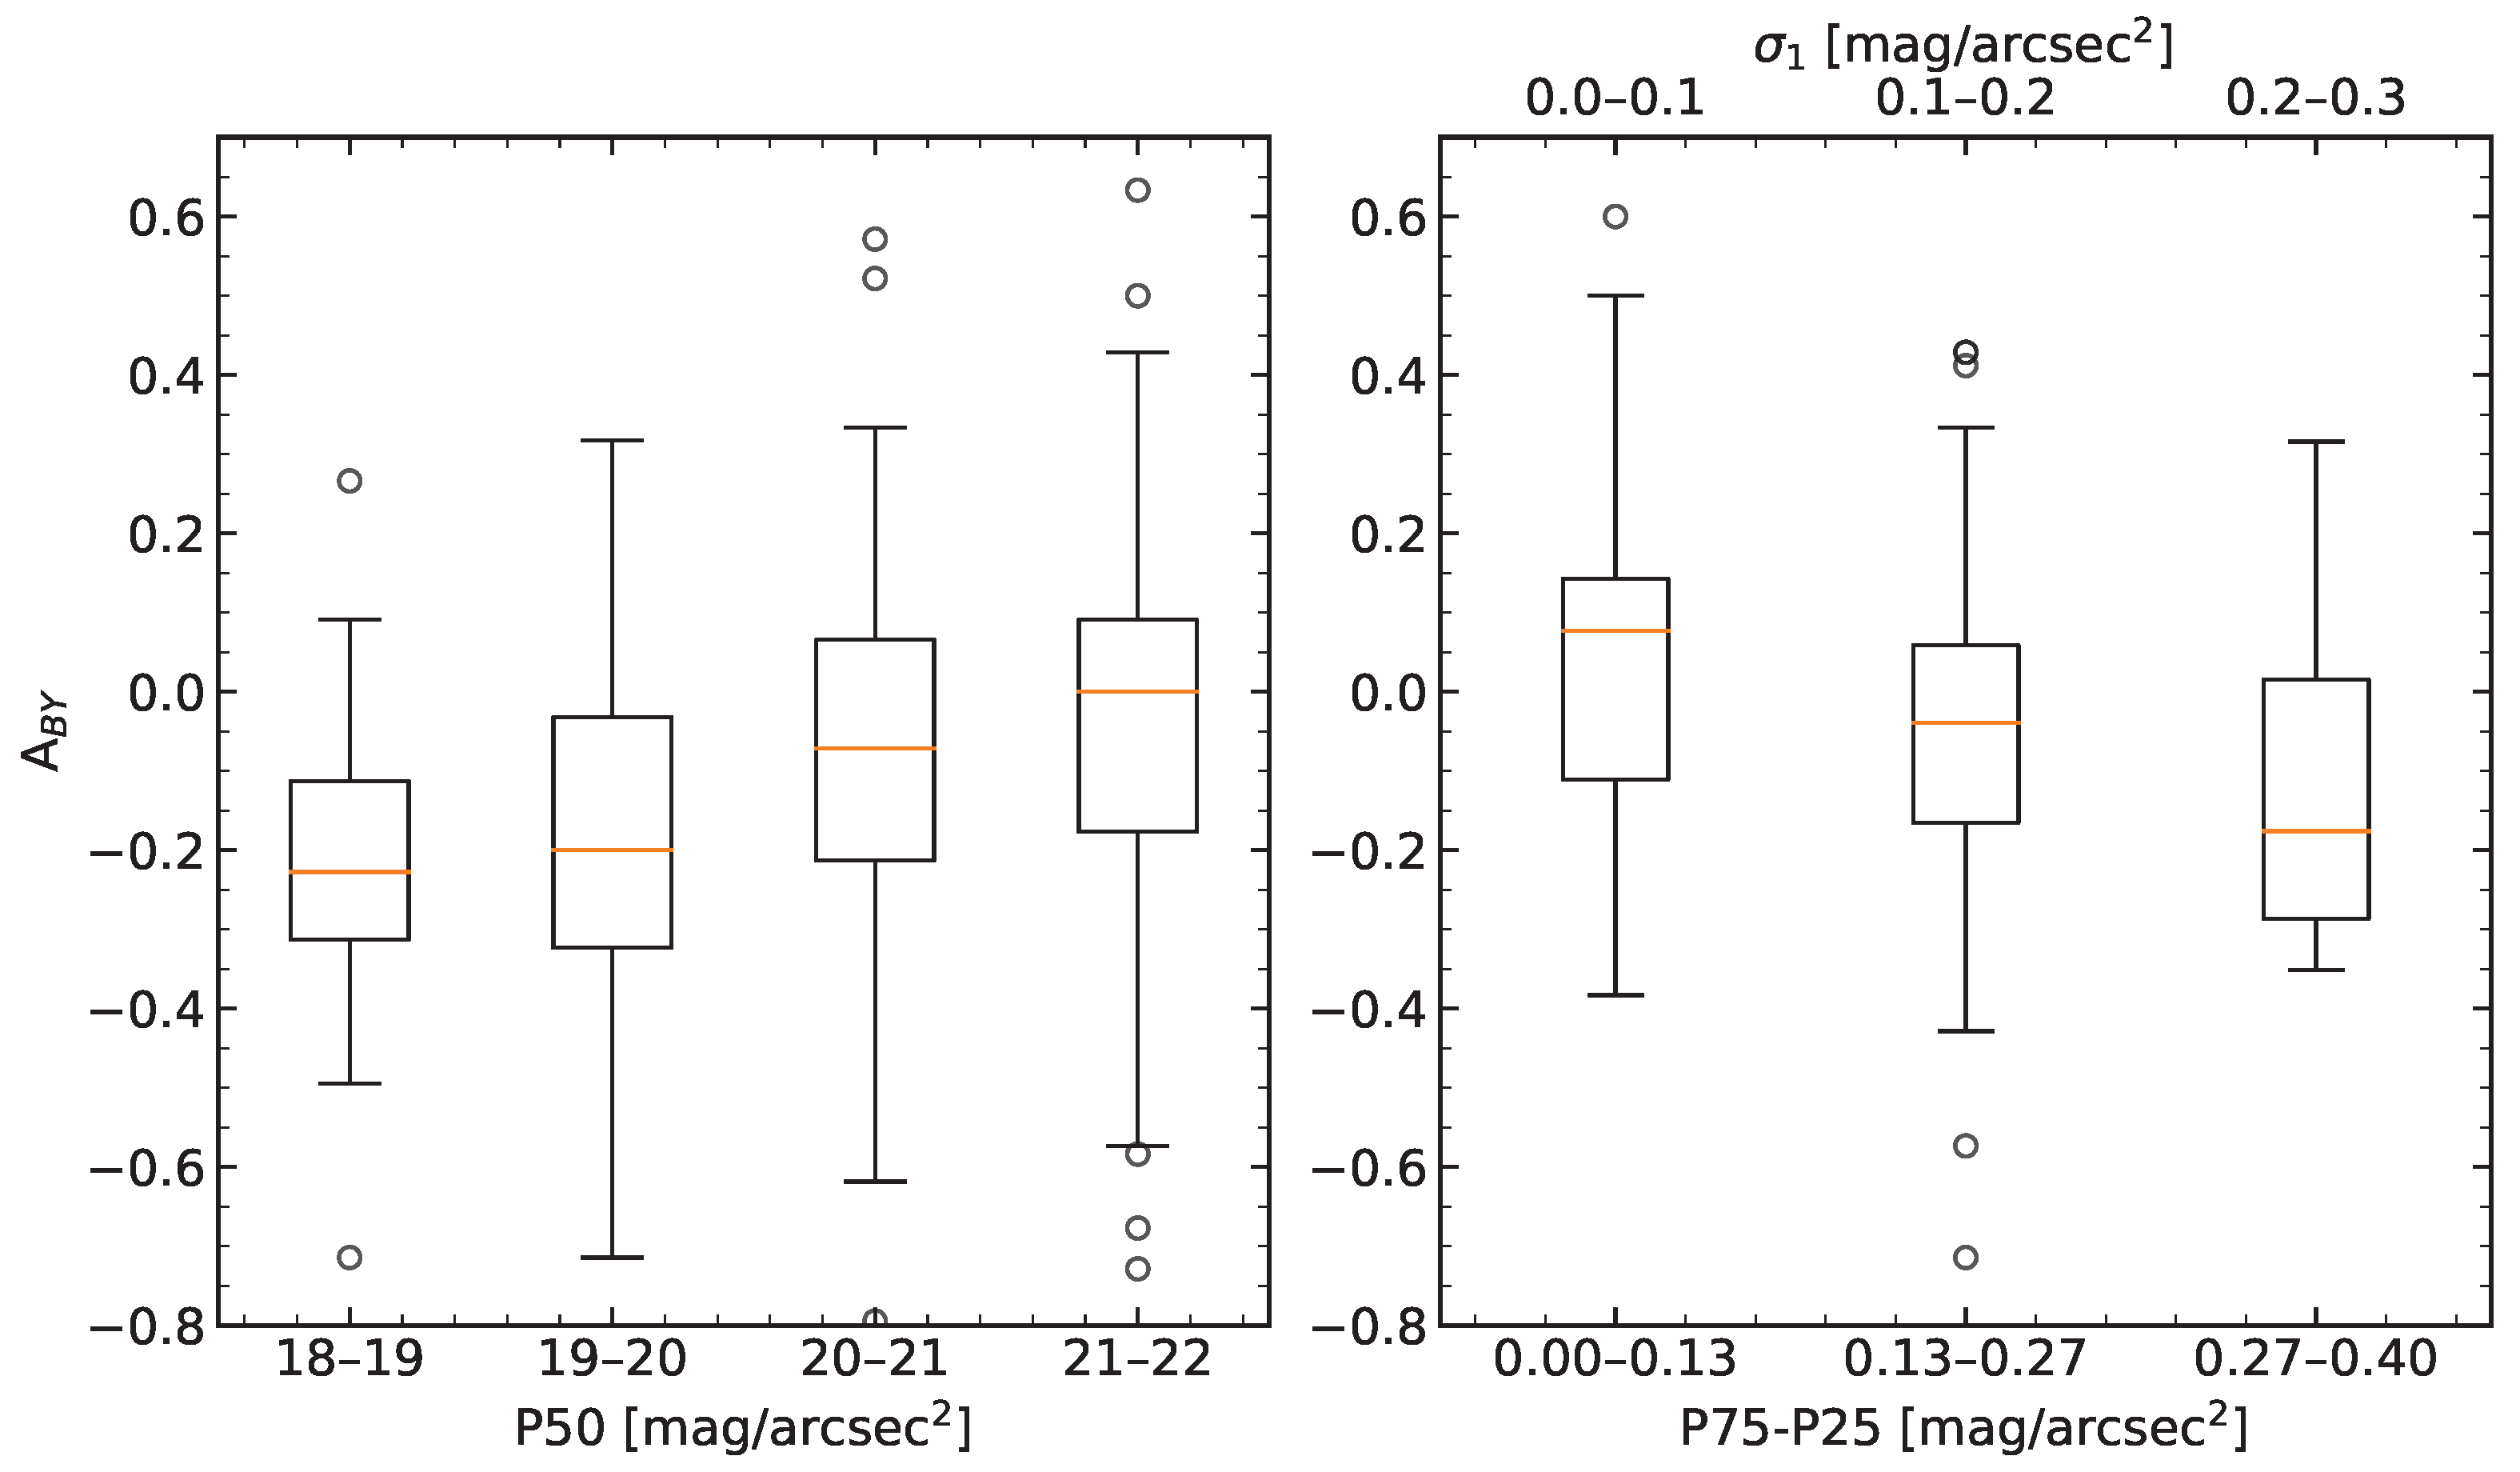
3.1.2. The Milky Way Effect as a Function of Location Brightness and Re-Evaluation of the Galaxy Filter

Previous studies have shown the importance of the effect of the Milky Way in dark (>21 mag) areas [23]. However, it is expected that this effect would be less important at lower magnitudes. In this section, we study the data from the photometer network to check whether this effect occurs in our data and calculate the exact magnitude value in which it may be discarded. This will allow us to filter out the effect of the Galaxy on the data without losing too many data points.
The EELabs network and Star4all data have been filtered for the effects of the Sun, the Moon and the clouds [23]. The zodiacal effect is smaller in comparison with the Galaxy effect; it was not deemed necessary to filter it out in order to maintain a greater number of possible points.
Days with the partial presence of the Milky Way were selected to compare the periods where it was either present or absent using the galactic latitude. When the absolute value of the galactic latitude is less than 40 , it is considered to have a sufficient impact on the skyglow to be taken into account [23]. For each period, a minimum of 10 measurements were requested for the SGs and 50 measurements for the TESSs, to ensure temporal samples of similar ranges. The differences in these days were obtained and subsequently averaged for each photometer, with those photometers with fewer than 10 days available being discarded.
In Figure 5, we compare the value of the difference in P50 brightness with and without the Galaxy; it measures the effect of the Galaxy on skyglow, with the corresponding P50 value of the photometer in the absence of the Galaxy; in other words, the brightness of the location. The averages of the photometers are represented in intervals of 0.1 mag/arcsec 2 . The uncertainty calculations are shown in Appendix A. In the figure, the effect of the Galaxy in very dark locations is high and decreases progressively as 20.5 mag/arcsec 2 is approached. Around 20.5 and 20 magnitudes, a significant increase in dispersion is observed with a random distribution of values, but the effect of the Galaxy is still high. Below 20 magnitudes, the Milky Way effect is not noticeable. Some values have negative differences; that is, the periods without the Galaxy are brighter, indicating the presence of phenomena of greater importance than this component.
On the basis of these results, it is not necessary to apply the Galaxy filter on photometers at low magnitudes. In this article, it was decided not to apply the Galaxy filter below 20 mag/arcsec 2 , which guarantees an insignificant Milky Way effect. The same was applied for zodiacal light, which has an even smaller effect on brightness than the Galaxy; thus, if from 20 mag/arcsec 2 the Galaxy does not noticeably alter the brightness, neither will the zodiacal light. This allows us to have much more data in the photometry of bright areas by not applying filters that would eliminate around 50% of the data.

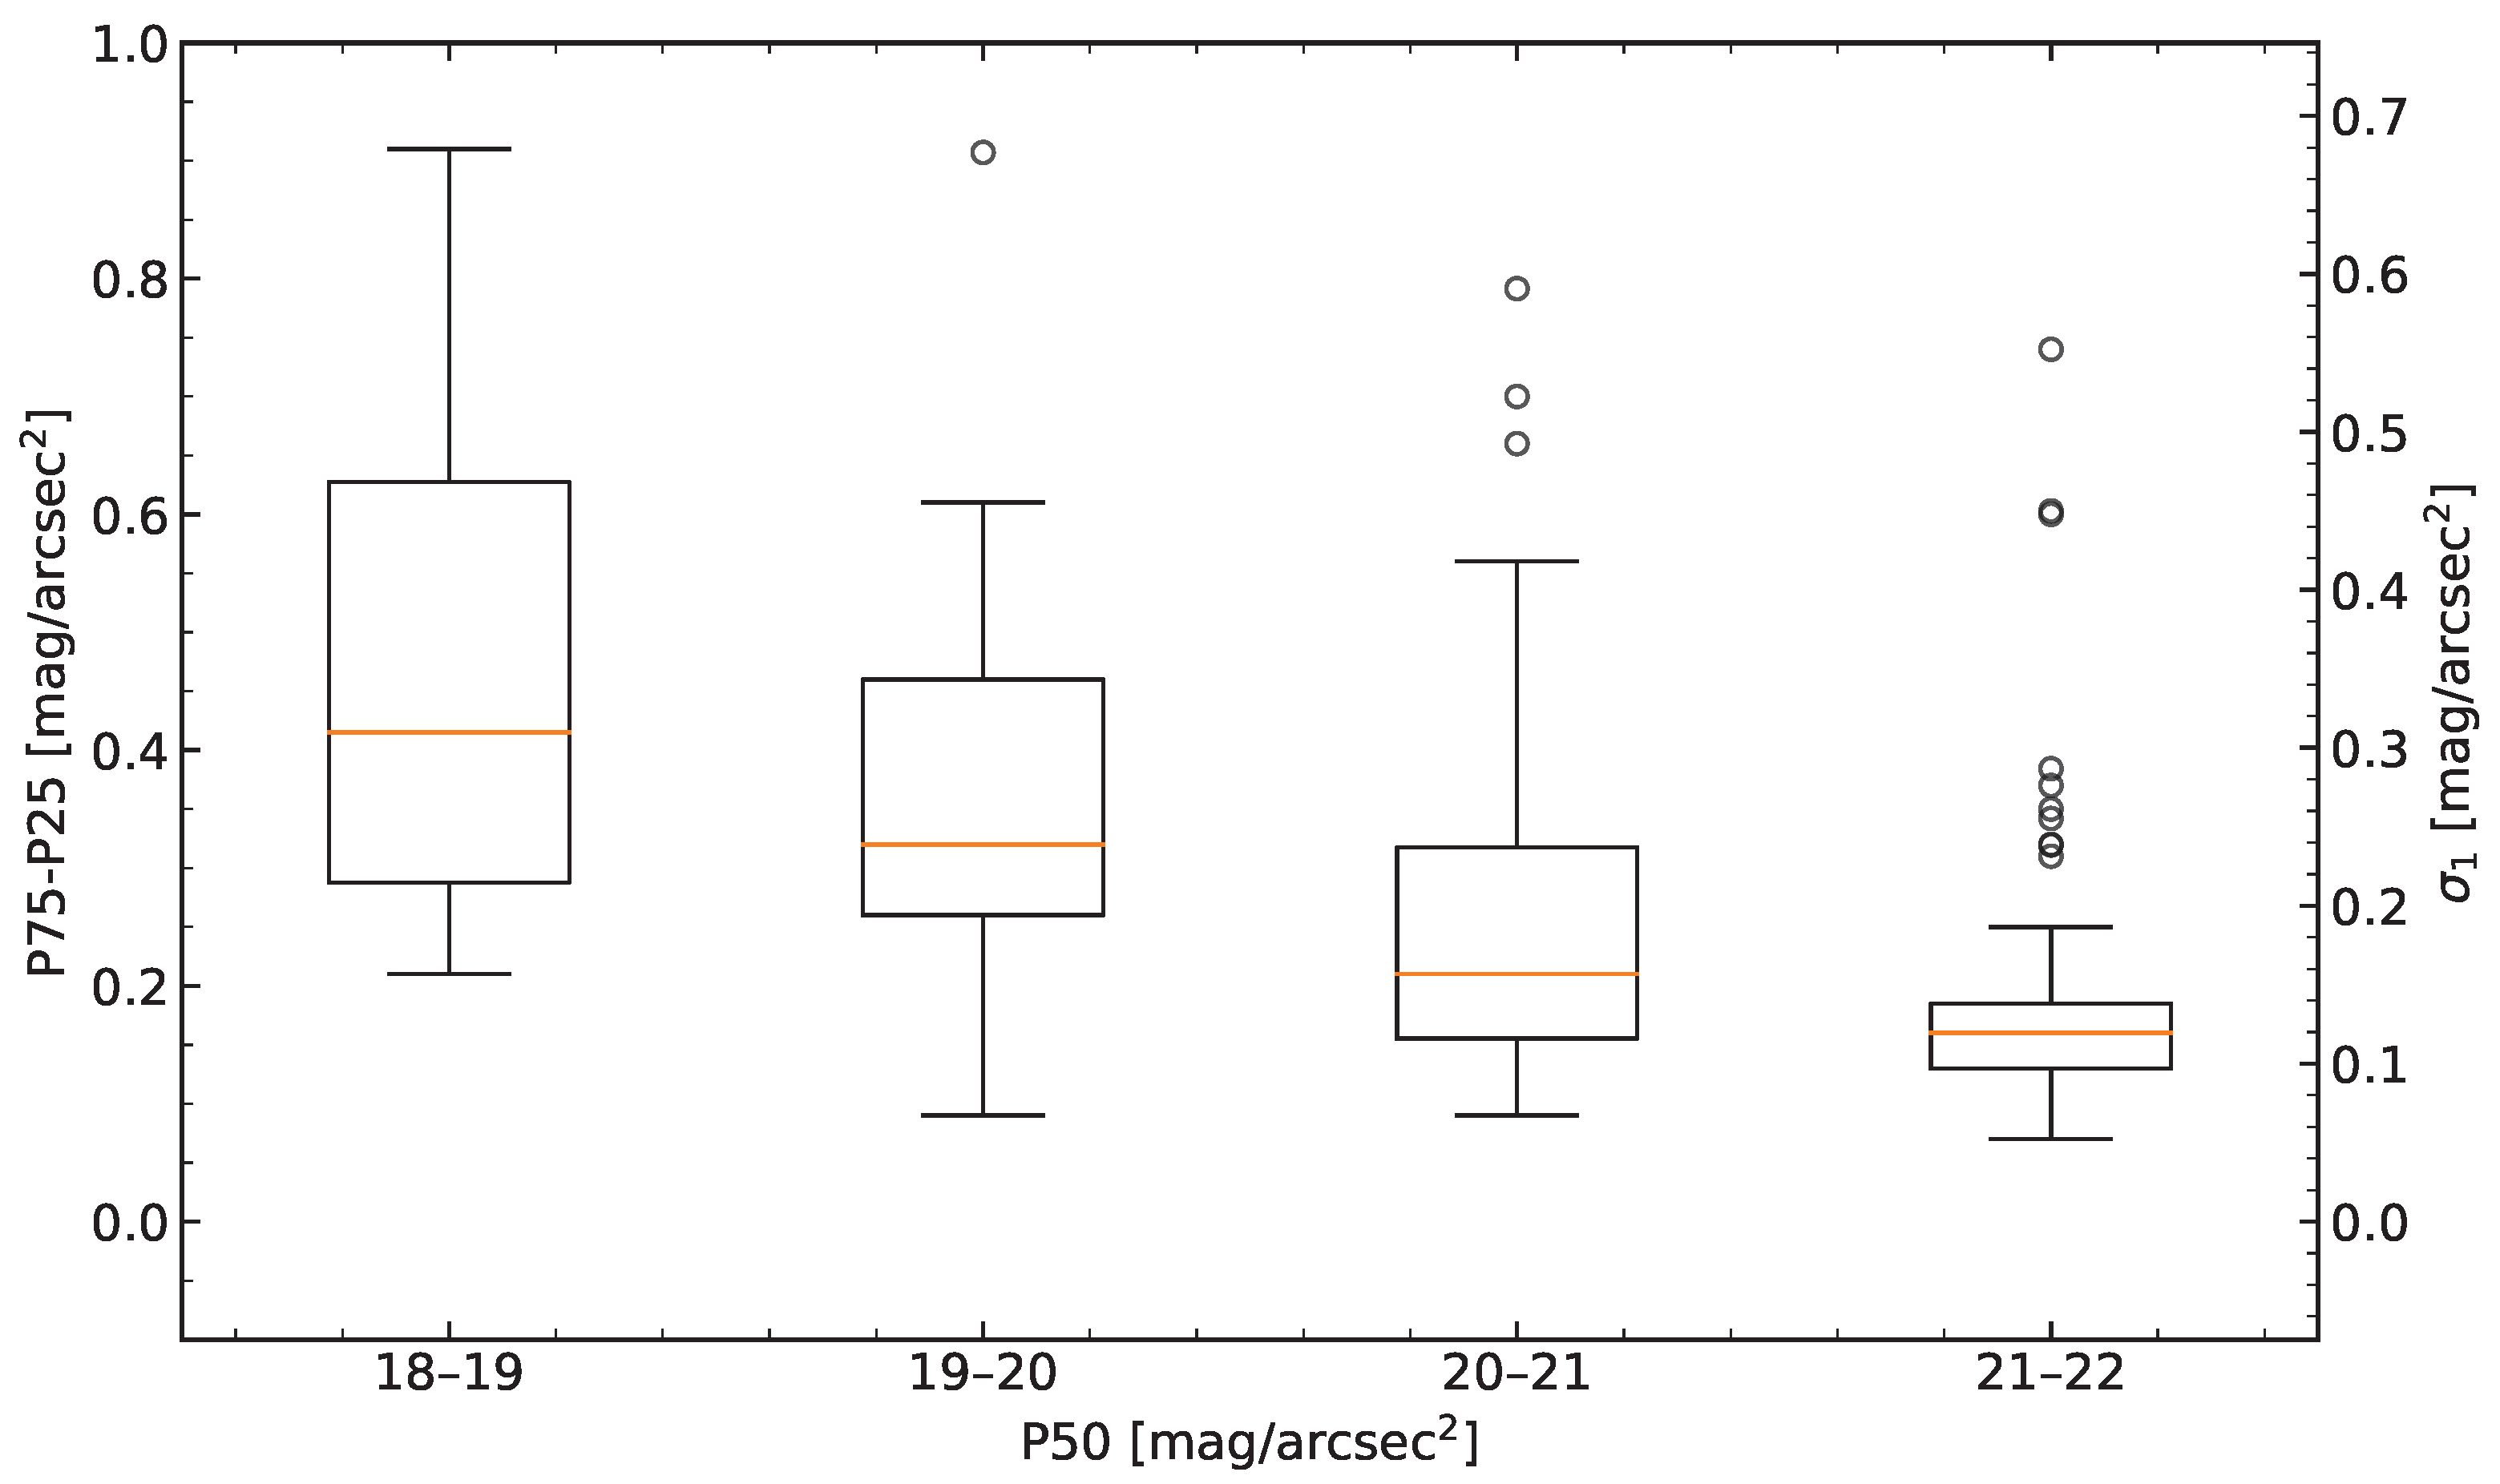
3.1.3. Photometer Data Distribution

In this section, we describe the characteristic distribution type of the photometers. This enables us, in the following section, to identify those photometers with anomalous distributions and thus unreliable measurements.
After filtering data with the presence of the Sun, Moon, Galaxy, zodiacal light and clouds, the characteristic distribution of a photometer is unimodal. The average distribution for bright (P50 < 21 mag) and dark (P50 > 21 mag) photometers is shown in the left image of Figure 6. In the right image of Figure 6, their comparison with the Gaussian distribution is shown through a Q-Q plot. These distributions have a Gaussian behavior in the central zone, between P75 and P25, but with a poorer fit for the bright case due to its asymmetry. Bright photometers have a greater width, P75−P25 = 0.32 mag/arcsec 2 , compared to P75−P25 = 0.16 mag/arcsec 2 for the dark ones. Assuming Gaussian behavior, the standard deviation, σ 1 , is related to the IQR (interquartile range) as follows:
σ 1 = IQR 1.34 = P 75 P 25 1.34 .
We can estimate the value by considering only the central region. We obtain a value of σ 1 = 0.12 mag/arcsec 2 for dark photometers, which is consistent with previous studies [23], and σ 1 = 0.25 mag/arcsec 2 for bright photometers. Both values are also well observed in Figure 6. The deviation increases as it moves away from the central zone, making the Gaussian approximation invalid. The cause of this may be the inherent variability of urban areas and the higher likelihood of anomalous bright values.
On the left side of Figure 7, a scatter plot shows the P75−P25 of all photometers with their median luminosity, P50, and their conversion to standard deviation, σ 1 , using Equation (1). On the right side, the direct calculation of the deviation, σ 2 , is shown after a 3 σ -clipping. It can be seen that both cases exhibit a similar structure. However, the 3 σ -clipping requires Gaussian behavior to be effective, whereas the P75−P25 provides a measure of robust width without relying on general Gaussian behavior. In the central region, the behavior is close to Gaussian, but it is lost at the extremes, making P75−P25 a better width measurement parameter.
Figure 8 shows a box plot with the evolution of the P75−P25 range according to P50. It can be seen that for bright (P50 < 21 mag) photometers, the deviation is around σ 1 = 0.1 mag/arcsec 2 [23]. The median of the P75−P25 increases with luminosity, but so does the width of the box, the variability between photometers. Therefore, the standard deviation of dark areas is well defined around σ 1 = 0.1, while for bright areas, a characteristic deviation cannot be defined. The deviation in Figure 6 is the result of an average of the various distributions.
The Bowley–Yule coefficient, a robust estimator, is used to evaluate the asymmetry of the distribution width and is defined as follows:
A B Y = P 75 + P 25 2 · P 50 P 75 P 25 .
A null value indicating symmetry is obtained for the coefficient for dark photometers (P50 > 21 mag). A B Y = 0.15 is obtained for bright photometers (P50 < 21 mag), indicating left-skewness. The evolution of skewness with P50 is detailed further in the left part of Figure 9. For photometers with P50 > 21, the skewness can be towards either dark or bright values, resulting in an average skewness of zero. As luminosity increases, there is a progressive bias towards left-skewness, and the variation between photometers is fairly constant. In the same Figure, the right part shows the skewness versus the interquartile range. It can be seen that, as the range increases, the left-skewness progressively increases. This indicates that the increase in range for bright values occurs asymmetrically.
The cause of this increase in range and left-skewness in bright areas might be attributed to the intrinsic temporal variability of urban areas. In isolated areas, with the exception of astronomical causes (already filtered out), nighttime brightness tends to remain constant. In contrast, in cities, nighttime brightness has significant temporal variability. For example, in many cities, brightness tends to be higher in the early evening and decreases as the night progresses, stabilizing towards dawn. Other phenomena, such as celebration days, can also cause this left-skewness in the overall calculation. The complexity of this variability is high and has been left out of this paper, treating the photometers with a single timeless distribution as a first approximation. A possible study of temporal evolution is left for future research.

3.1.4. Optimal Behavior

In the previous Section 3.1.3, we characterized the typical distribution of a photometer. However, some photometers deviate excessively from this unimodal distribution. In Figure 10, an example of the expected behavior is depicted for a photometer in proper working order (stars2) and an anomalous photometer (stars47). While stars2 shows behavior similar to the average with a well-defined mode, in stars47, a clear mode cannot be identified. These photometers with anomalous distributions tend to have greater widths.
The deviation from this average distribution is caused by excessive variability in the photometer measurements. It should be noted that this does not imply that the measurements are incorrect since this effect might be due to real phenomena. However, when comparing an annual average with satellite data, we are mainly interested in photometers whose measurements are as stable as possible; the P50 value is therefore more reliable in minimizing temporal differences between satellite and photometer measurements.
An appropriate method of characterizing anomalous photometers is through the P75−P25, which measures the width, showing how representative the P50 is. In Figure 7, it is observed that some photometers have excessively high P75−P25 values and deviate from common values. Being a robust parameter, P75−P25 discriminates very adequately between those photometers with poor distribution compared to deviation and shows better behavior in non-Gaussian distributions. The P75−P25 has been limited to a maximum of 0.4 mag/arcsec 2 . As seen in Section 3.1.3, anomalous values are more common in bright photometers, so excessive values are also more common.
This method does not detect all anomalous photometers, as it focuses on variability. Errors that do not modify the distribution, such as those relating to photometer calibration or those that produce its narrowing, are not identified. That is why photometers such as stars4 and stars679 from Section 2.1 would not be detected.

3.2. Photometer Data Cleaning and Wrangling

In this section, the data cleaning and wrangling process is described. In Figure 11, on the left side, a diagram of it is shown. First, data points affected by the Sun, Moon or clouds are discarded. Subsequently, for photometers with P50 > 20 mag, data points affected by the Galaxy and zodiacal light are excluded. Next, entire datasets from photometers with fewer than 500 data points or P75−P25 > 0.4 mag are removed.
In Figure 11, on the right side, it is shown how the number of photometers decreases throughout the process. The 47% reduction in SG is due to the Galaxy and zodiacal filter because a large number of photometers were installed during the period of the Milky Way’s presence. The reduction in quantity due to the minimum sample filter is very different for both types of photometers, with a reduction of 13% in TESS and up to 54% in SG. The reason for this is that SG photometers systematically have fewer measurements than TESS, as shown in Table 3. There are two additional reasons for this: first, TESS takes 5 times more measurements per minute than SG (Table 1); and second, a large number of SG photometers were installed throughout 2022, so they do not have as many available months.
At the end of the data cleaning process, there are 212 photometers, but some of them do not have satellite measurements, such as the ones located on Corvo Island. Therefore, the final sample size is 203 photometers, 141 TESS and 62 SG. Their distribution between dark and bright areas is shown in the lower graph of Figure 3. The final dataset consists of approximately 482,352 photometric measurements and 19,326 satellite measurements because of the difference in daily measurements taken by each source.

3.3. Regression

A correlation between the annual P50 of the photometers and the annual P50 of the VIIRS, in the pixel where the photometers are located, was investigated. The data used correspond to the full year 2022 in order to reduce possible seasonal effects. Some photometers have distances between them of less than 500 m, so they are within the same pixel of the satellite image. For these cases, the average of the photometers in that pixel was calculated to obtain a single value per pixel.
Afterward, a least squares regression was applied to obtain a transformation equation between satellite and photometer data. There are many more photometers located in dark than in bright areas in the sample (Figure 3). This could lead to an overestimate of those areas in the regression. To avoid this, a linear regression was made based on the means of bins of 0.2 log(nW/(cm 2 sr)) of the satellite measurement, starting from 1 log (nW/(cm 2 sr)).

4. Results

In this section, we showcase how the photometer and satellite data were correlated and a linear regression was performed. Next, we include an example based on a subsample of photometers in a small region of Spain and we present a map of the VIIRS data for the calibrated area based on the previous result. We discuss all the results introduced here in the following section.

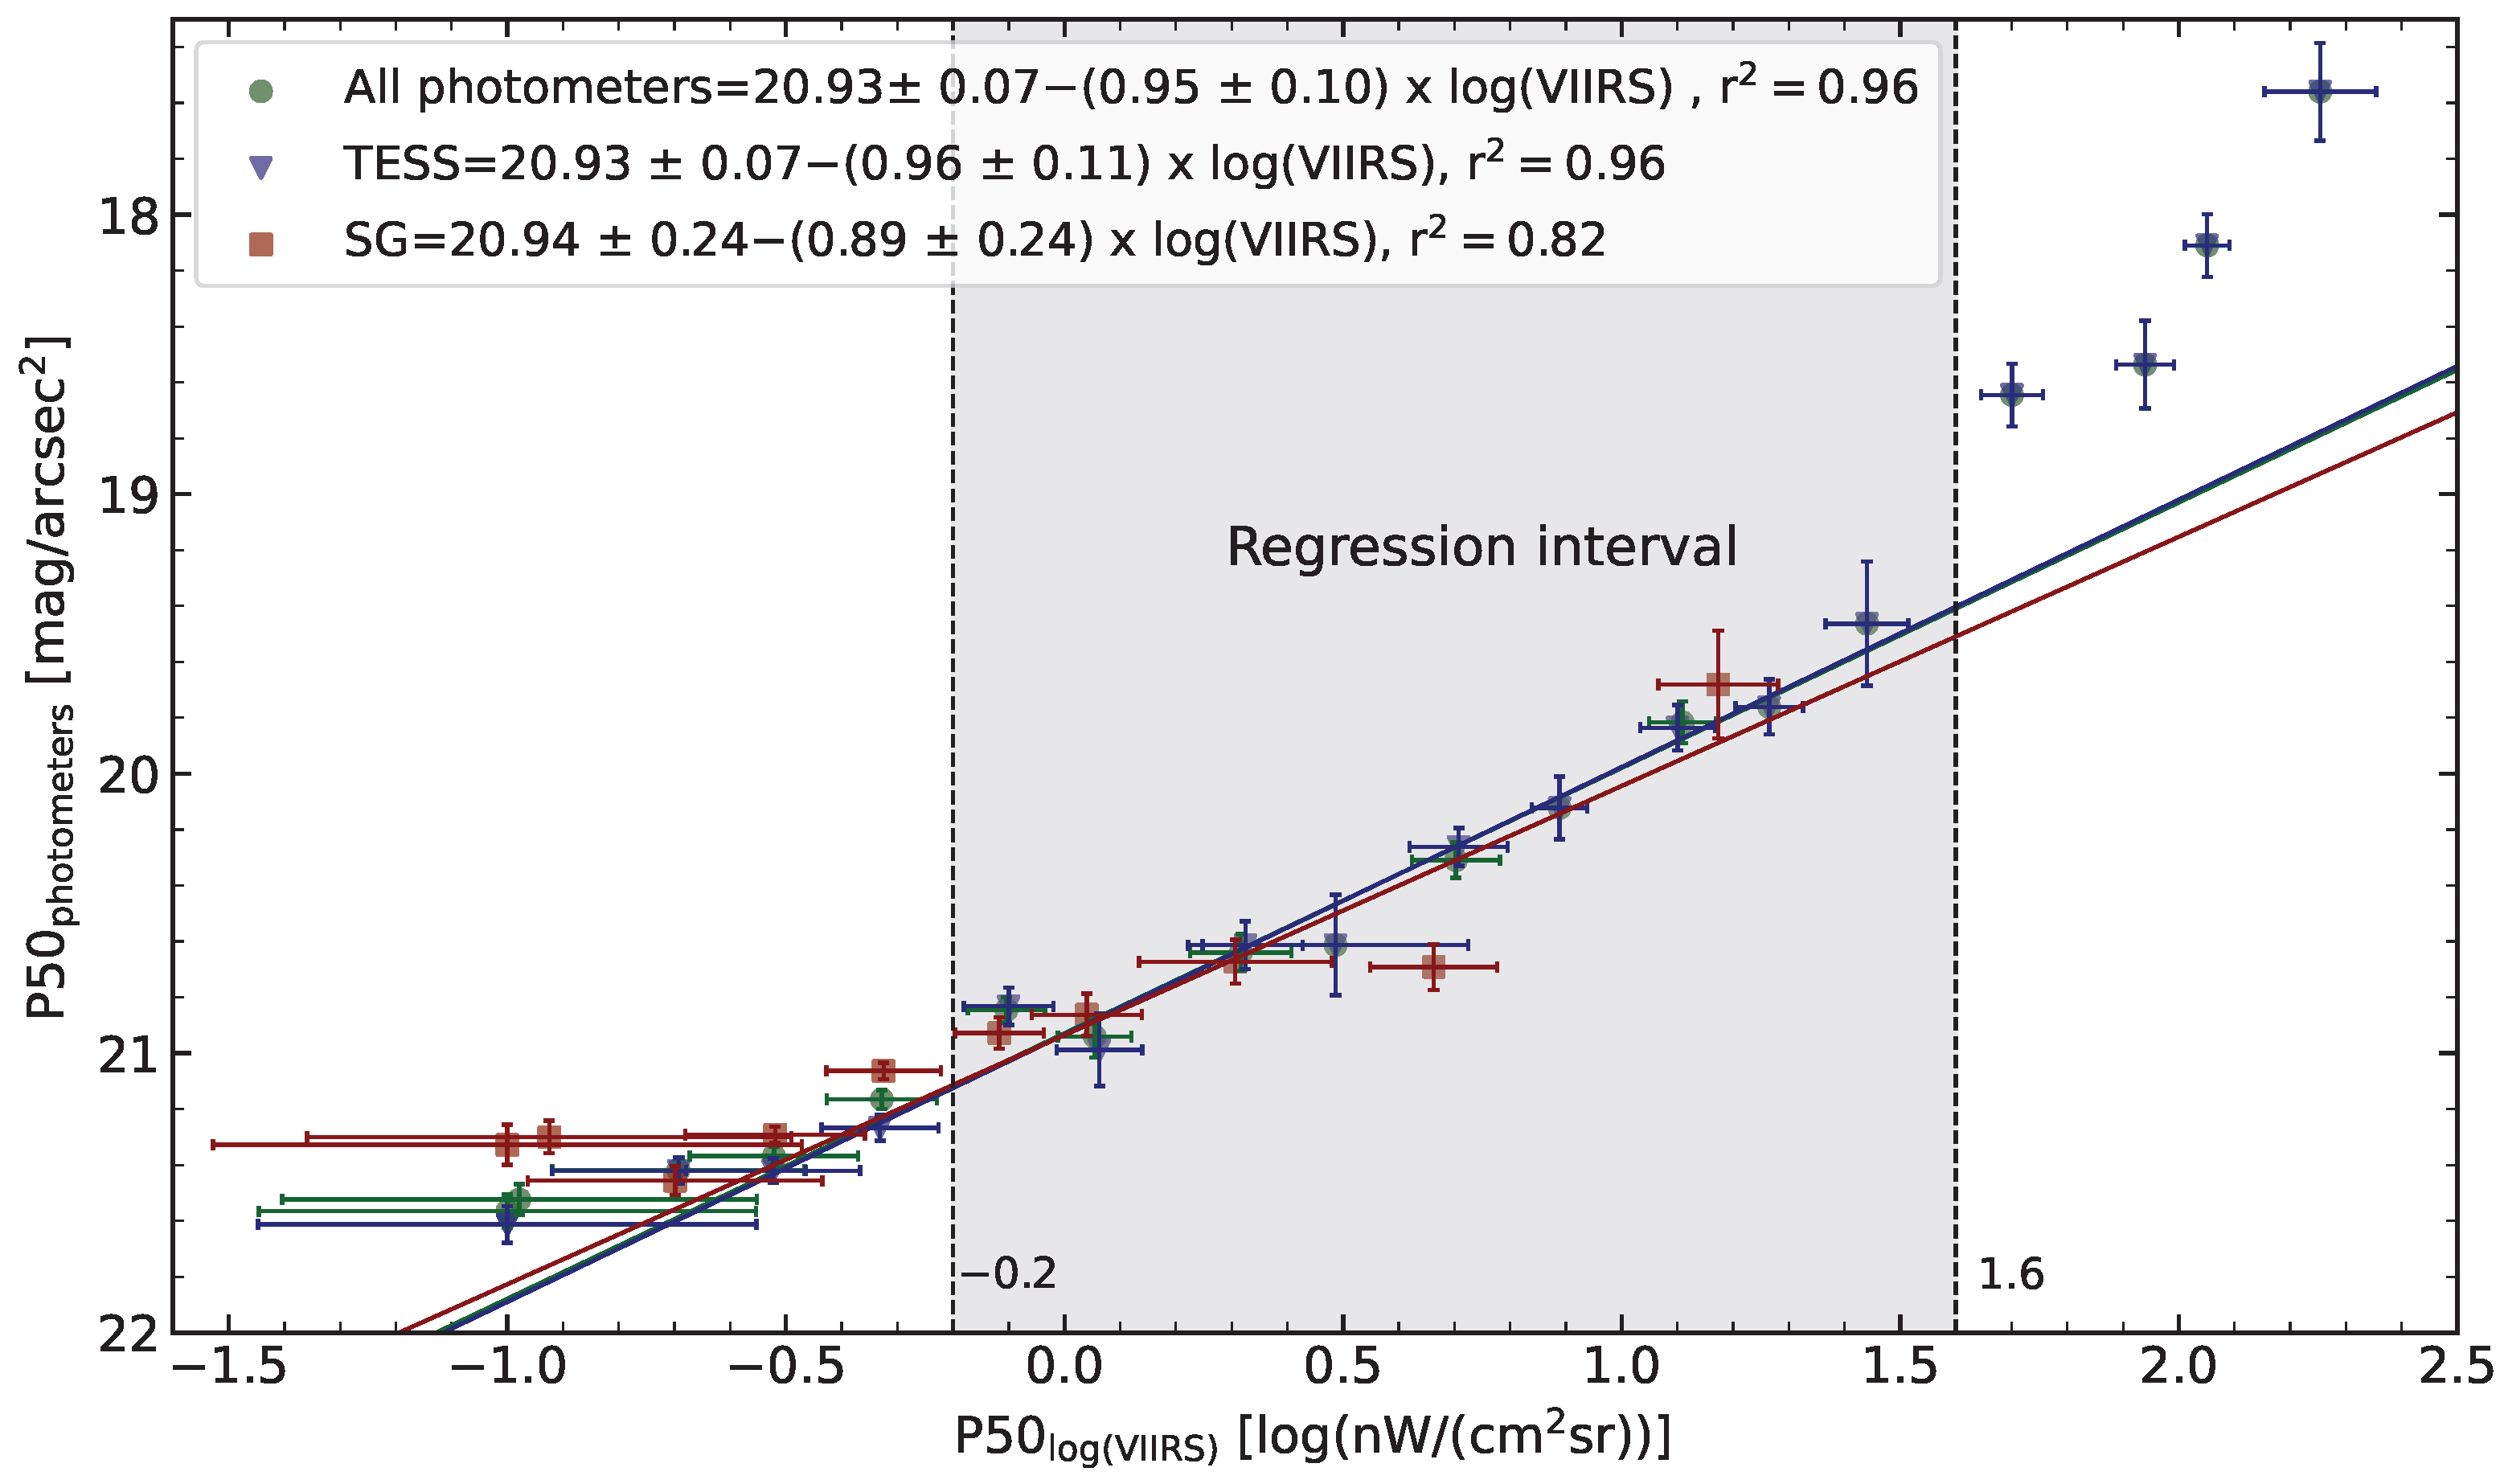
4.1. VIIRS and Photometer Data Correlation

Figure 12 displays a scatter plot of the annual P50 of the photometers plotted against the annual P50 of the VIIRS. Data corresponding to groups of photometers in the same satellite pixel are shown in blue. There is a linear correlation between the magnitudes of the photometers and the logarithm of the VIIRS measurements. This result was expected since magnitudes are on a logarithmic scale, whereas the VIIRS measures are linear. Note how the satellite uncertainty increases in very dark areas lower than 1 nW/(cm 2 sr) owing to its precision of 0.1 nW/(cm 2 sr) (Table 4).
Based on this correlation, a interval linear regression was performed (Section 3.3). The intervals below 0.5 nW/(cm 2 sr) = 0.3 log (nW/(cm 2 sr)) present important uncertainties, a relative error of at least 20%, in the satellite part that prevent the satellite from taking good measurements (Table 4). Furthermore, the detection limit of VNP46A is about 0.5 nW/(cm 2 sr), which means that the actual uncertainties could be much greater within this range. Therefore, the smallest interval considered was 0.2 –0 log(nW/(cm 2 sr)).
Figure 13 shows the evolution of the Root Mean Square Error (RMSE) as the interval covered by the regression increases. The blue line represents the case when starting the fit from the left at 0.2 log (nW/(cm 2 sr) and gradually increasing the width towards the brighter values. The red line represents the opposite case, starting at 2.4 log(nW/(cm 2 sr) on the right side and moving towards the darker regions. It is observed that the left regression generally has lower residuals compared to the right one. It is also noticed that the residuals increase significantly in the last four values (>1.6 log(nW/(cm 2 sr))). This suggests that the brightest points do not follow the overall trend. When below 1.6, it has a slope of 0.95, while above 1.6, it exhibits a value of 2.01. The most appropriate regression is obtained with a width of 1.8 log(nW/(cm 2 sr)), starting from the left, corresponding to the interval 0.2 –1.6 log(nW/(cm 2 sr)).
The means of bins of 0.2 log(nW/(cm 2 sr)) are shown in Figure 14. TESSs are represented in blue, SGs in red and both types of photometers combined in green. The error bars were calculated using Appendix B. The regression was made in the interval between −0.2 and 1.6 log(nW/(cm 2 sr) of the VIIRS. There are 15 SGs and 57 TESSs in this range, approximately 444,145 photometer measurements and 15,862 satellite measurements, due to the difference in daily measurements taken by each source. The differentiated regression for TESS and SG is depicted in the aforementioned figure. The best regression is obtained for the entire set of photometers (Equation (3)):
VIIRS [ mag / arcsec 2 ] = 20.93 ± 0.07 ( 0.95 ± 0.10 ) · log ( V I I R S [ nW / ( cm 2 sr ) ] )
The systematic uncertainty of VIIRS is described in Appendix C.
In Figure 14, it can be seen how above 1.5 log(nW/(cm 2 sr) ≈ 19.41 mag/arcsec 2 , the values diverge from linear behavior. Below −0.2 log(nW/(cm 2 sr) ≈ 21.12 mag/arcsec 2 , the error increases significantly but, except for the most extreme point, there is little deviation from the linear regression.

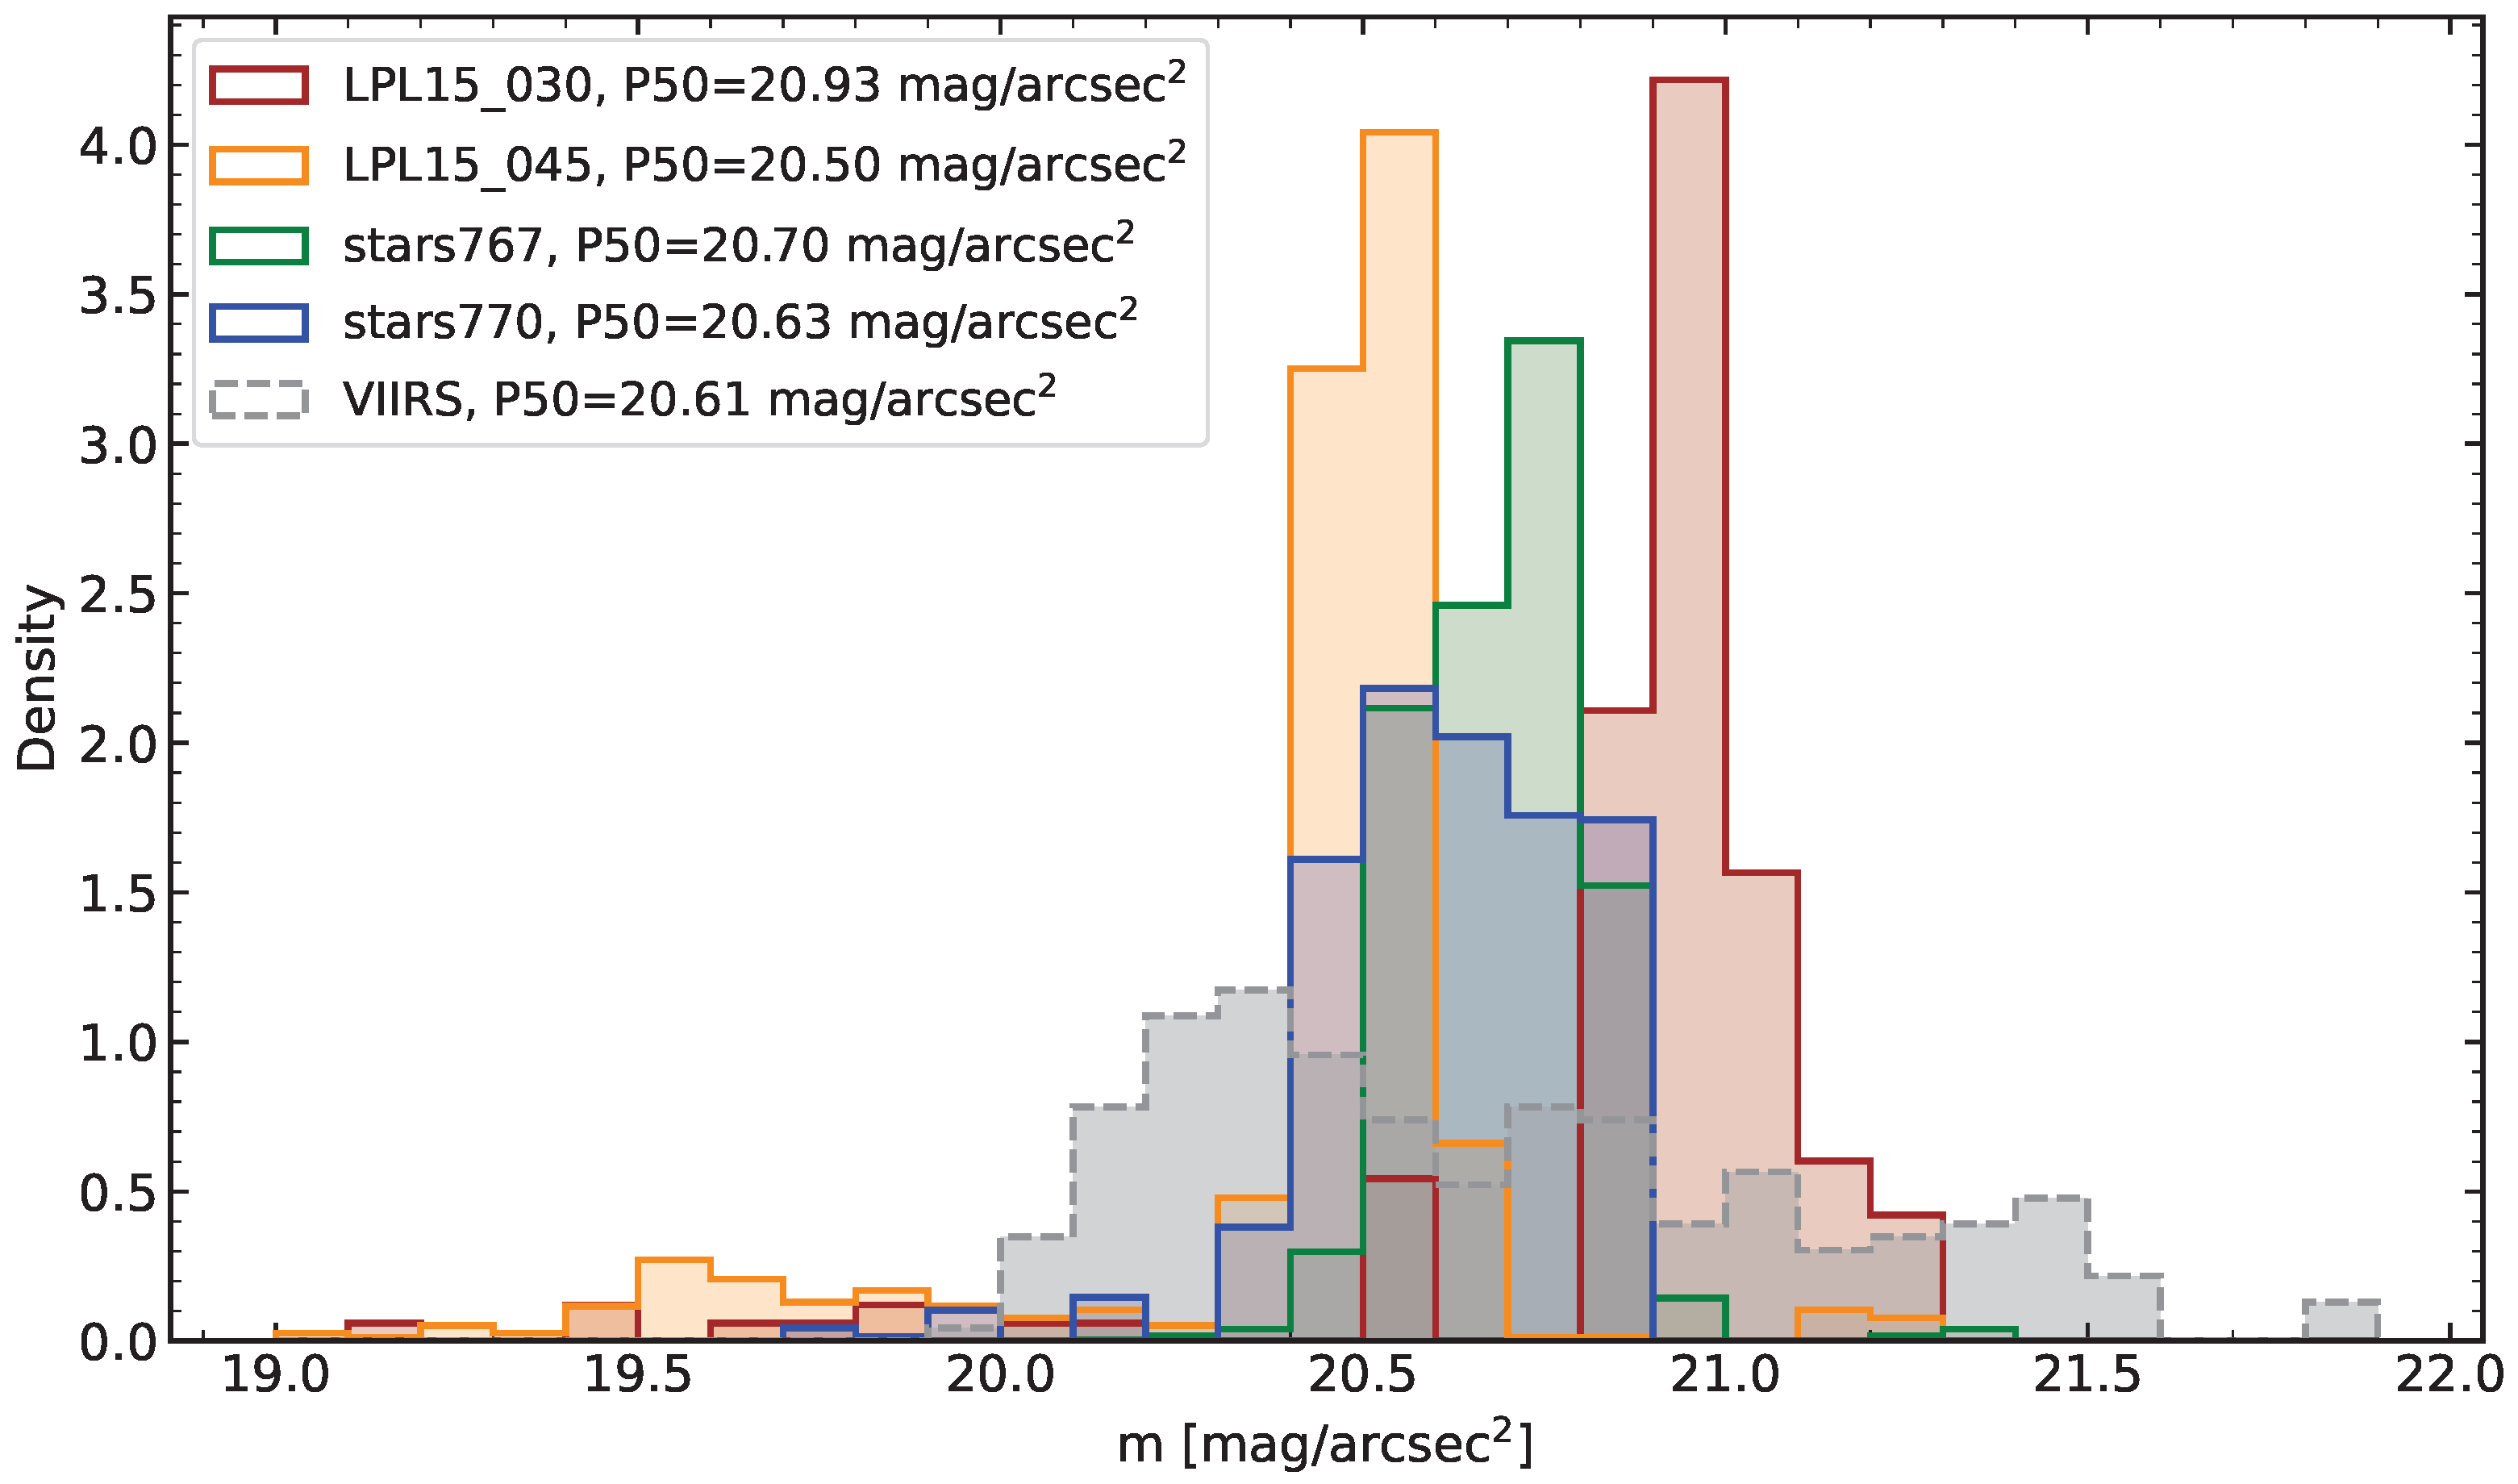
4.2. Application to Valverde de Burguillos

The highest concentration of photometers from the EELabs and STARS4ALL networks is located in the municipality of Valverde de Burguillos (Extremadura, Spain), with a total of 19 photometers. Some of these photometers are so close, less than 500 m apart, that they are located within the same VIIRS pixel. Figure 15 shows the histograms for four photometers belonging to the same VIIRS pixel and the values of the pixel adjusted according to the regression from Section 4.1.
The LPL15_030 has fewer than 500 data points, so its histogram might not be entirely reliable. It can be appreciated that there are significant differences, reaching the P50 around 0.4 mag/arcsec 2 . Two adjacent pixels can have a difference greater than 0.7 mag, as seen in Figure 16. This phenomenon depends on the spatial variability in brightness and is greater in bright areas where this variability is more pronounced.
In Figure 15, the histogram of the satellite is shown in gray, with its P50 around the values of the photometers. However, its distribution is characteristic of satellite data, with a greater width than that of the photometer data. This could be caused by the component of upward direct light that the VIIRS detects but not the photometers.
In Figure 16, a map of Valverde de Burguillos based on satellite data and calibrated using the fit from Section 4.1 is shown. The photometers are displayed as points on the map. Those with a red border are photometers with fewer than 500 data points and are therefore less reliable. A more detailed comparison between photometer values and predictions based on regression VIIRS is shown in Table 5. The predictions have a mean error of 0.17 mag/arcsec 2 within the regression range and 0.19 mag/arcsec 2 outside the range. These out-of-range photometers correspond to dark photometers, and these appear to align the general regression, despite the significant systematic uncertainties. The maximum error is 0.39 mag/arcsec 2 .

5. Discussion

In this section, we discuss the main results and their limitations in our work, mainly due to the VNP46A2 spatial resolution, while also presenting their most direct applications.

5.1. Comparison of Regression and Range of Applicability

The results show a clear correlation between the logarithm of the VIIRS measurements and the SG and TESS photometers within the range between 21.12 and 19.41 mag/arcsec 2 . These findings are consistent with previous studies that observed a significant correlation between photometers (specifically SQM) and VIIRS [17,22].
Both SGs and TESSs have compatible and similar regression slopes, suggesting that they behave almost equivalently (Figure 14). This is expected considering their spectra (Figure 1). Therefore, both photometers can be treated together, resulting in a better outcome.
The correlation obtained for the SG photometers is lower than that of the TESS photometers. We believe that the cause of this difference is the smaller sample size of SG photometers, consisting of 15 devices, compared to the 57 TESS photometers in the range of the regression, thus making them much more prone to potential anomalous photometer values. This is particularly critical in the brightest region, where only two SG photometers are above 0.5 log(nW/(cm 2 sr)) (Figure 3).
Above 19.41 mag/arcsec 2 , the values diverge from linear behavior of the regression (Figure 14). The cause of this phenomenon is still not clear to the authors. The small number of reliable photometers within that range, only 10 TESS photometers, makes it challenging to deduce a potential cause. Therefore, it is vital to expand the network of photometers to highly light-polluted urban areas, which would allow future research to further investigate this phenomenon within those ranges.
Below 21.12 mag/arcsec 2 , except for the most extreme points, the deviation from the linear regression is rather small (Figure 14). As an example, these out-of-range photometers have a mean error of 0.19 mag/arcsec 2 in Valverde de Burguillos, very similar to the mean error of 0.17 mag/arcsec 2 for the photometers within the range. However, the relative systematic error is quite high, resulting in a loss of precision. This limitation renders the satellite unreliable in very dark areas, where photometers provide a much more accurate value. Thus, photometers can complement satellite data in measuring light pollution across the entire range of magnitudes.

5.2. Error and VIIRS Spatial Resolution

Using the same example as before, in Valverde de Burguillos, a mean error of 0.17 mag/arcsec 2 was obtained. We can attribute this error to three factors: firstly, to the possible variability in the brightness within each pixel; secondly, to the potential direct emissions that the VIIRS may be measuring [17]; and thirdly, to the combined effect of the difference in the spectral range of the sensor and the spectral composition of the sources in the location of the photometer (Figure 1). We believe that the first one is the main component, as explained below.
In Figure 15, it can be observed that photometers located in the same pixel may have a discrepancy of up to 0.43 mag/arcsec 2 in the P50. This difference cannot be attributed to spectral differences between photometers since it is present in photometers of the same type. The two photometers that are farthest apart are separated by a distance of only 330 m, so the differences within the same grid could be even greater. The satellite’s spatial resolution (500 m for the VNP46A2 product) is insufficient to detect these important variations at very short distances.
In Figure 16, photometers and VIIRS map the distribution of ALAN similarly. It can be seen that photometers constitute a finer mesh than VIIRS, with several photometers falling within the same pixel, showing the average of the entire area. These errors are smaller than the error of the VIIRS resolution, as two adjacent pixels can have a difference greater than 0.7 mag in bright areas. It is observed that many of these photometers with a significant discrepancy from the satellite data are located very close to pixels with more similar values. This supports the notion that the lack of resolution in the VIIRS is the primary source of these errors. We also attribute most of the dispersion in Figure 12 to this phenomenon.
An increase in spatial resolution would reduce this error. Previous studies have already demonstrated that increasing the resolution of VIIRS, from 60 arcsec to 30 and even to 15, progressively enhances the degree of correlation [17].

5.3. Potential Applications

Equation (3) provides a way to transform VIIRS measurements to the SG-TESS magnitude scale, which is the most common way of measuring ALAN. This allows for the comparison of both sources and the conducting of joint studies.
The most direct application is the development of light pollution maps, similar to the example presented in Valverde de Burguillos (Figure 16). VIIRS allows for the creation of maps covering large areas. However, the aforementioned lack of sensitivity of the satellite would hinder precise mapping in the darkest regions. This is where the placement of photometers, which can cover those areas, provides a better overall view of the light pollution in the zone. In urban areas, VIIRS is essential due to the significant spatial variability in light pollution, which makes mapping the area with photometer networks impractical. Nonetheless, it is of vital importance to have photometers located in urban areas to improve the sample size for calibration purposes.
Currently, a worldwide map is being developed, displaying the calibrated VIIRS data for 2022, and there are plans to create maps for other years as well. This map will be complemented by data from the global network of photometers, providing real-time data. This map will be uploaded to the IoT-EELab data portal and will represent the most comprehensive and detailed light pollution map to date.
An area of great interest, which we plan to study in the near future, is the Canary Islands, especially the island of La Palma, where the Roque de los Muchachos Observatory, a top place for astronomy in the Northern Hemisphere, is located. La Palma has a network of photometers (SG and TESS) that covers a large part of the island, including both dark and bright areas. The combination of satellite and photometer network data will allow us to understand the evolution and distribution of light pollution in a location where it is of particular significance due to its interference with astronomical observations

6. Conclusions

This paper presents a calibration of VIIRS satellite images using red photometers (TESS and SG) from the EELabs and STARS4ALL networks, with a worldwide presence. For this purpose, an analysis of the behavior of the photometer data was carried out in both bright and dark areas, covering the range from 22 mag to 18 mag. The photometers show a tendency towards Gaussian behavior in the central region of the distribution, with the brighter photometers deviating from it. The width of the distribution tends to increase asymmetrically towards lower magnitudes in brighter areas.
In addition, the impact of the Galaxy on different brightness ranges was re-evaluated, and it was concluded that it is negligible in brighter photometers (P50 < 20 mag) compared to other phenomena.
Finally, a strong correlation was observed between satellite measurements and photometer network measurements in the range between 21.12 and 19.41 mag/arcsec 2 , supported by measurements from a total of 72 photometers. No significant difference was identified between SG and TESS photometers. The best value was obtained for the regression VIIRS (mag/arcsec 2 ) = 20.93 ± 0.07 − (0.95 ± 0.10) × log(VIIRS[nW/(cm 2 sr)]). The need to perform adjustments throughout the range of magnitudes and the bias of the presence of photometers in dark areas make it necessary to deploy more photometers in bright areas of both networks, mainly EELabs, to improve calibration. This would also allow for a deeper study of photometer behavior in these areas, given the difficulty posed by their higher variability, both spatially and temporally.
The VIIRS is not sensitive enough to take accurate measurements in dark areas, unlike photometers, which do not have this limitation. As a result, this calibration is extremely valuable as it enables the integration of both sources, leading to more precise area analyses.

Author Contributions

B.F.-R. worked on the interpretation of satellite data, filtering and errors. M.S.-R., M.R.A. and S.L.-P. conducted the design of the photometers and related data analysis. M.S.-R. and J.R.-A. worked on the conceptualization, direction and funding of this work. B.F.-R., M.S.-R. and I.S.-P. undertook the interpretation of the results, and the organization and writing of the manuscript. All authors have read and agreed to the published version of the manuscript.

Funding

This research was supported by EELabs, a project funded by the European Union INTERREG V-A MAC 2014-2020. This work was supported by the STARS4ALL Foundation, which maintains the data infrastructure for the TESS photometer network.

Data Availability Statement

The data from the STARS4ALL and EELabs photometer networks are accessible through the EELabs data portal(data.eelabs.eu (accessed on 19 June 2023)). The data from VNP46A2 VIIRS product are acessible through the EARTHDATA data portal (https://ladsweb.modaps.eosdis.nasa.gov/archive/allData/5000/VNP46A2/2022 (accessed on 23 June 2023)). The specific datasets used and analyzed are available upon request.

Acknowledgments

Extremadura Clear Skies are thanked for hosting TESS/SG-WAS photometer networks. The City Council of Valverde del Burguillo supported the installation of the SG-WAS photometer network.

Conflicts of Interest

MSR and SLP are members of the EU EELabs project SG-WAS development team. The funders had no role in the design of the study; in the collection, analyses, or interpretation of data; in the writing of the manuscript, or in the decision to publish the results.

Appendix A. Uncertainty Calculation for Galaxy Filter Re-Evaluation

The uncertainty of the bin of the Figure 5, δ , is given by:
δ = σ 1 2 n 1 + δ s n 1 2 + δ p h o t o m e t e r 2 n 1 2 ,
where σ 1 is the standard deviation among the photometers in the bin, δ photometer represents the uncertainty in the photometer value and δ s is the systematic uncertainty specific to the type of photometer (0.04 for TESS and 0.02 for SG photometers). n 1 corresponds to the number of photometers in the bin. The uncertainty associated with each photometer was calculated using:
δ photometer 2 = σ 2 2 n 2 + δ daily 2 n 2 2 ,
where σ 2 is the standard deviation of the measurements of the photometer, δ daily represents the uncertainty in the photometer value and n 2 is the number of days. The daily uncertainty for the Galaxy effect is:
δ daily 2 = P 75 Without _ galxy P 25 Without _ galxy 2 + P 75 With _ galxy P 25 With _ galxy 2
and for the brightness without the Milky Way,
δ daily 2 = P 75 Without _ galxy P 25 Without _ galxy 2 .

Appendix B. Uncertainty Calculation for the Data Points of the Regression

The uncertainty of the bin of the Figure 14, δ , is given by:
δ = σ 2 n + δ s n 2 + P 75 P 25 2 n 2 ,
where σ is the standard deviation among the photometers in the bin, P75−P25 is the interquartile range of the photometer and satellite data, n corresponds to the number of photometers in the bin and δ s is the systematic uncertainty. This is 0.04 for TESS and 0.02 for SG photometers, and for VIIRS is given by:
δ s ; VIIRS [ log ( nW / ( cm 2 sr ) ) ] = 0.10 ln ( 10 ) · VIIRS [ nW / ( cm 2 sr ) ] .

Appendix C. Uncertainty Calculation for Transforming VIIRS Data to SG and TESS Units

The uncertainty for transforming is:
δ VIIRS [ mag / arcsec 2 ] = δ n 2 + log ( VIIRS ) · δ m 2 + m · δ s ; VIIRS 2 ,
where δ m = 0.10 is the uncertainty for the slope m and δ n = 0.07 is the uncertainty for the intercept point of the regression. δ s ; VIIRS is the satellite systematic uncertainty (Equation (A6)).

References

  1. Falchi, F.; Cinzano, P.; Duriscoe, D.; Kyba, C.C.M.; Elvidge, C.D.; Baugh, K.; Portnov, B.A.; Rybnikova, N.A.; Furgoni, R. The new world atlas of artificial night sky brightness. Sci. Adv. 2016, 2, e1600377. [Google Scholar] [CrossRef]
  2. Hölker, F.; Wolter, C.; Perkin, E.K.; Tockner, K. Light pollution as a biodiversity threat. Trends Ecol. Evol. 2010, 25, 681–682. [Google Scholar] [CrossRef]
  3. Gaston, K.J.; Bennie, J.; Davies, T.W.; Hopkins, J. The ecological impacts of nighttime light pollution: A mechanistic appraisal. Biol. Rev. 2013, 88, 912–927. [Google Scholar] [CrossRef] [PubMed]
  4. Bennie, J.; Davies, T.W.; Cruse, D.; Gaston, K.J. Ecological effects of artificial light at night on wild plants. J. Ecol. 2016, 104, 611–620. [Google Scholar] [CrossRef]
  5. Owens, A.C.; Lewis, S.M. The impact of artificial light at night on nocturnal insects: A review and synthesis. Ecol. Evol. 2018, 8, 11337–11358. [Google Scholar] [CrossRef]
  6. Walker, W.H.; Walton, J.C.; DeVries, A.C.; Nelson, R.J. Circadian rhythm disruption and mental health. Transl. Psychiatry 2020, 10, 1–13. [Google Scholar] [CrossRef]
  7. Walker, W.H.; Bumgarner, J.R.; Walton, J.C.; Liu, J.A.; Meléndez-Fernández, O.H.; Nelson, R.J.; DeVries, A.C. Light Pollution and Cancer. Int. J. Mol. Sci. 2020, 21, 9360. [Google Scholar] [CrossRef]
  8. Vetter, C.; Pattison, P.M.; Houser, K.; Herf, M.; Phillips, A.J.K.; Wright, K.P.; Skene, D.J.; Brainard, G.C.; Boivin, D.B.; Glickman, G. A Review of Human Physiological Responses to Light: Implications for the Development of Integrative Lighting Solutions. LEUKOS 2022, 18, 387–414. [Google Scholar] [CrossRef]
  9. Van Langevelde, F.; van Grunsven, R.H.A.; Veenendaal, E.M.; Fijen, T.P.M. Artificial night lighting inhibits feeding in moths. Biol. Lett. 2017, 13, 20160874. [Google Scholar] [CrossRef]
  10. Shier, D.M.; Bird, A.K.; Wang, T.B. Effects of artificial light at night on the foraging behavior of an endangered nocturnal mammal. Environ. Pollut. 2020, 263, 114566. [Google Scholar] [CrossRef]
  11. Dimitriadis, C.; Fournari–Konstantinidou, I.; Sourbès, L.; Koutsoubas, D.; Mazaris, A.D. Reduction of sea turtle population recruitment caused by nightlight: Evidence from the Mediterranean region. Ocean Coast. Manag. 2018, 153, 108–115. [Google Scholar] [CrossRef]
  12. Doren, B.M.V.; Willard, D.E.; Hennen, M.; Horton, K.G.; Stuber, E.F.; Sheldon, D.; Sivakumar, A.H.; Wang, J.; Farnsworth, A.; Winger, B.M. Drivers of fatal bird collisions in an urban center. Proc. Natl. Acad. Sci. USA 2021, 118, e2101666118. [Google Scholar] [CrossRef]
  13. Grubisic, M.; Haim, A.; Bhusal, P.; Dominoni, D.M.; Gabriel, K.M.A.; Jechow, A.; Kupprat, F.; Lerner, A.; Marchant, P.; Riley, W.; et al. Light Pollution, Circadian Photoreception, and Melatonin in Vertebrates. Sustainability 2019, 11, 6400. [Google Scholar] [CrossRef]
  14. McLaren, J.D.; Buler, J.J.; Schreckengost, T.; Smolinsky, J.A.; Boone, M.; Emiel van Loon, E.; Dawson, D.K.; Walters, E.L. Artificial light at night confounds broad-scale habitat use by migrating birds. Ecol. Lett. 2018, 21, 356–364. [Google Scholar] [CrossRef] [PubMed]
  15. Doren, B.M.V.; Horton, K.G.; Dokter, A.M.; Klinck, H.; Elbin, S.B.; Farnsworth, A. High-intensity urban light installation dramatically alters nocturnal bird migration. Proc. Natl. Acad. Sci. USA 2017, 114, 11175–11180. [Google Scholar] [CrossRef]
  16. Walker, M.F. The California Site Survey. Publ. Astron. Soc. Pac. 1970, 82, 672. [Google Scholar] [CrossRef]
  17. De Miguel, A.S.; Kyba, C.C.M.; Zamorano, J.; Gallego, J.; Gaston, K.J. The nature of the diffuse light near cities detected in nighttime satellite imagery. Sci. Rep. 2020, 10, 7829. [Google Scholar] [CrossRef]
  18. Jiang, W.; He, G.; Long, T.; Guo, H.; Yin, R.; Leng, W.; Liu, H.; Wang, G. Potentiality of Using Luojia 1-01 Nighttime Light Imagery to Investigate Artificial Light Pollution. Sensors 2018, 18, 2900. [Google Scholar] [CrossRef]
  19. Cinzano, P. Report on Sky Quality Meter, Version L. 2007. Available online: https://doi.org/10.13140/RG.2.2.35630.51526 (accessed on 4 February 2023).
  20. Zamorano, J.; García, C.; Tapia, C.; de Miguel, A.S.; Pascual, S.; Gallego, J. STARS4ALL Night Sky Brightness Photometer. Int. J. Sustain. Light. 2017, 18, 49–54. [Google Scholar] [CrossRef]
  21. Alarcon, M.R.; Puig-Subirà, M.; Serra-Ricart, M.; Lemes-Perera, S.; Mallorquín, M.; López, C. SG-WAS: A New Wireless Autonomous Night Sky Brightness Sensor. Sensors 2021, 21, 5590. [Google Scholar] [CrossRef]
  22. Priyatikanto, R.; Admiranto, A.G.; Putri, G.P.; Elyyani; Siti; Maryam; Suryana, N. Map of Sky Brightness over Greater Bandung and the Prospect of Astro-Tourism. Indones. J. Geogr. 2019, 51, 190–198. [Google Scholar] [CrossRef]
  23. Alarcon, M.R.; Serra-Ricart, M.; Lemes-Perera, S.; Mallorquín, M. Natural Night Sky Brightness during Solar Minimum. Astron. J. 2021, 162, 25. [Google Scholar] [CrossRef]
  24. Johnson, H.L. Astronomical Measurements in the Infrared. Annu. Rev. Astron. Astrophys. 1966, 4, 193–206. [Google Scholar] [CrossRef]
  25. Bessell, M.S. UBVRI passbands. Publ. Astron. Soc. Pac. 1990, 102, 1181–1199. [Google Scholar] [CrossRef]
  26. Noll, S.; Kausch, W.; Barden, M.; Jones, A.M.; Szyszka, C.; Kimeswenger, S.; Vinther, J. An atmospheric radiation model for Cerro Paranal. I. The optical spectral range. A&A 2012, 543, A92. [Google Scholar] [CrossRef]
  27. Román, M.O.; Wang, Z.; Sun, Q.; Kalb, V.; Miller, S.D.; Molthan, A.; Schultz, L.; Bell, J.; Stokes, E.C.; Pandey, B.; et al. NASA’s Black Marble nighttime lights product suite. Remote Sens. Environ. 2018, 210, 113–143. [Google Scholar] [CrossRef]
  28. Efron, B. Bootstrap Methods: Another Look at the Jackknife. Ann. Stat. 1979, 7, 1–26. [Google Scholar] [CrossRef]
Figure 2. Map of photometer locations after data cleaning and wrangling are shown. The SG (red) photometers are located in Extremadura (Spain) and the Macaronesia region forming high-density networks, while the TESS (blue) photometers are distributed worldwide in an isolated way, with a notable concentration in Spain.
Remotesensing 15 04189 g002
Figure 3. Number of TESS (blue) and SG (red) photometers according to the P50 brightness in their location measured by VIIRS in 2022. In the upper graph, the photometers are shown with no filter applied. In the lower one, the resulting photometers after data cleaning and wrangling are shown. There is a much larger number of photometers in dark places. In bright places, the abundance of TESS is considerably higher than that of SG.
Remotesensing 15 04189 g003
Figure 4. Evolution of the uncertainty of P75−P25 on the left, and P50 on the right, according to the sample size for the photometers in Table 3. These uncertainties were obtained by the bootstrapping method with 100 subsamples and a 95% confidence level. The dash line corresponds to SG photometers and the solid line to TESS photometers. Since SG photometers generally have fewer data points, in this case, we sampled up to a size of 1000 only. It is observed that the uncertainty drops and reaches a stabilization phase after 1000. Below 500, the uncertainties are very high, with an intermediate zone between 500 and 1000. A minimum reliable sample size of 500 has been established, but excessive numbers of photometers should not be excluded. This limit is marked with a red line. A smoothing filter has been applied to improve the graphical representation.
Remotesensing 15 04189 g004
Figure 5. The Galaxy effect, the difference between the P50 without and with the Galaxy, compared to the brightness of the photometer, P50, in the absence of the Milky Way. The dashed line indicates where the effect of the Galaxy is null. Below 20 mag/arcsec 2 , the Milky Way effect is unremarkable and there is a significant dispersion.
Remotesensing 15 04189 g005
Figure 6. On the left figure, the average distributions are shown according to the median for dark (P50 > 21 mag) and bright (P50 < 21 mag) photometers. On the right, both distributions are compared to the normal distribution in a QQ plot. The dashed lines indicate the Gaussians with σ = 0.1 , σ = 0.2 and σ = 0.3 , respectively. It can be seen how, in both cases, they show a Gaussian behavior in the central zone, between P25 and P75, with a better approximation in the case of dark photometers. The standard deviation for dark areas is around 0.1, while for bright areas it is around 0.2. The deviation increases at the ends of the distribution, moving away from Gaussian behavior. This is caused by the presence of outliers and anomalous values with a random tendency. Another aspect to highlight is the increase in left asymmetry in the bright regime, worsening its Gaussian behavior in the left tail.
Remotesensing 15 04189 g006
Figure 7. The subfigure (A) illustrates the relationship between P75−P25 and P50, along with its conversion to deviation, σ 1 . On the subfigure (B), the deviation, σ 2 , obtained by using a 3 σ -clipping is shown. The subfigures (C,D) correspond to a zoom of their respective areas. The black dash line indicates the deviation of 0.1, around which the photometers with P50 > 21 mag are located. The P75−P25 increases with luminosity and variability between photometers. The red line marks the maximum P75−P25, beyond which photometers are discarded.
Remotesensing 15 04189 g007
Figure 8. Boxplot of P75−P25 versus P50. The orange line represents the median of the boxplot, and the circles represent the outliers. Not all outliers are shown. The standard deviation of dark areas is around σ 1 = 0.1. The P75−P25 increases with luminosity, but so does the variation between photometers, making it difficult to characterize the P75−P25 in bright photometers.
Remotesensing 15 04189 g008
Figure 9. On the left is shown a box plot of the variation in the Bowley–Yule coefficient as a function of luminosity. The orange line represents the median of the boxplot, and the circles represent the outliers. Generally, distributions of photometers exhibit left-skewness (skewed towards brighter values). This skewness becomes more pronounced in brighter photometers, while the dispersion between photometers remains approximately constant across all ranges. On the right, the Bowley–Yule coefficient according to the P75−P25 is shown in another box plot. These values show some correlation, indicating that the increase in distribution width towards brighter values occurs asymmetrically. The cause of this may be the inherent variability of urban areas and the higher likelihood of anomalous bright values.
Remotesensing 15 04189 g009
Figure 10. Examples of histograms for a photometer with ideal behavior (stars2) and another photometer with anomalous behavior (stars47) compared with the distribution of the average photometer (P50 < 21 mag). The average photometer has a unimodal distribution with a differentiated mode and little asymmetry. Stars2 shows unimodal behavior, while for stars47, it is difficult to identify a clear mode.
Remotesensing 15 04189 g010
Figure 11. On the left, a diagram of the data cleaning and wrangling is shown. P50 and P75−P25 represent the median and IQR of the photometer distribution, respectively. n is the data amount of the photometer. The blue squares discard data point and the red squares discard entire photometer dataset. On the right, the quantities of photometers as they pass through the various steps of the cleaning process are shown.
Remotesensing 15 04189 g011
Figure 12. Measurements of the photometers compared to the decimal logarithm of satellite (both cases show the annual P50). Photometers with P50 log ( VIIRS ) ≤ −0.7 are not displayed due to their large uncertainties. Data corresponding to groups of photometers in the same satellite pixel are shown in blue. Those in black are the other photometers. Photometers with P75−P25 ≥ 0.4 were discarded, these are indicated in red. The black dash line is the best regression. Satellite dispersion is very important in dark areas because of the limited precision of satellite data. The error bars show P25 and P75.
Remotesensing 15 04189 g012
Figure 13. Evolution of RMSE as the interval width of the regression increases. The blue line represents the case when starting the fit from the left at −0.2 and gradually increasing the width towards the brighter values. The red line represents the opposite case, starting at 2.4 and moving towards the darker regions. The most appropriate regression is obtained with a width of 1.8 log (nW/(cm 2 sr)) starting from the left, corresponding to the interval −0.2–1.6 log(nW/(cm 2 sr)).
Remotesensing 15 04189 g013
Figure 14. Regression of means by bins of 0.2 log(nW/(cm 2 sr)) of VIIRS between −0.2 and 1.6 log(nW/(cm 2 sr)). TESSs are represented in blue, SGs in red and both types of photometers combined in green. The lines represent to the regressions, with the color corresponding to the photometer set used. The values show good linear behavior, but this is lost from 19 mag/arcsec 2 onwards.
Remotesensing 15 04189 g014
Figure 15. Four Valverde de Burguillos photometers’ histograms located in the same pixel of VIIRS images. Significant differences between them can be seen so that VIIRS lacks the resolution to measure this variability.
Remotesensing 15 04189 g015
Figure 16. Map of Valverde de Burguillos, Spain, with VIIRS P50 calibrated to SG and TESS photometers for 2022. The circles represent the photometers within the regression range, and the squares represent those below 21.12 mag/arcsec 2 . Those with a red border are photometers with fewer than 500 data points and are therefore less reliable.
Remotesensing 15 04189 g016
Table 1. Main characteristics of the TESS and SG photometers [20,21].
TESSSG
SensorTSL37TSL37
Field of view17 18 vertical and 20 horizontal
Communication unitWIFIWIFI, LoRA and LTE-M
AutonomousNoYes
Other uncertainty0.04 mag/arcsec 2 0.02 mag/arcsec 2
Time interval between1 min5 min
measurements(One measurement)(Average of 10 measurements)
Table 2. Time interval exceptions between measurements of the photometers.
Time Interval between MeasurementsPhotometers
30 sstars33, stars52, stars4, stars1
10 sstars36, stars550
Table 3. Photometers with the largest amount of data used to determine the minimum sample.
PhotometerTypeLocationNumber ofP50P75−P25A BY
Data Points(mag/arcsec 2 )
LPL1_050SGTenerife160821.280.150.09
LPL2_104SGLa Palma150621.510.140.02
LPL3_104SGMadeira136520.620.15−0.17
LPL3_110SGMadeira156220.780.16−0.07
stars1TESSMadrid755718.370.16−0.25
stars202TESSExtremadura566321.460.180.00
stars495TESSExtremadura594821.170.180.00
stars550TESSUtrecht20,46818.860.11−0.09
Table 4. Systematic uncertainty of VIIRS measurements in dark places.
VIIRS Δ VIIRSVIIRS Δ VIIRSVIIRS Δ VIIRS
(nW/(cm 2 sr))(log(nW/(cm 2 sr)))(mag/arcsec 2 )
1.000.100.000.0420.930.08
0.900.10−0.050.0520.970.08
0.800.10−0.100.0521.020.09
0.700.10−0.150.0621.080.09
0.600.10−0.220.0721.140.10
0.500.10−0.300.0921.220.11
0.400.10−0.400.1121.310.13
0.300.10−0.520.1421.430.16
0.200.10−0.700.2221.590.23
0.100.10−1.000.4321.880.43
Table 5. Detailed comparison between photometer values and predictions based on regression VIIRS data from photometers located at network around Valverde de Burguillos (Extremadura, Spain). Only the first 14 photometers fall within the regression range, the rest exceed the lower limit of 21.12 mag/arcsec 2 . LPL15_030, LPL15_027, LPL15_022, LPL15_011 and LPL15_029 have fewer than 500 data points and are therefore of lower reliability.
NameP50P25P75VIIRS δ VIIRS
(mag/arcsec 2 )(mag/arcsec 2 )
LPL15_04320.6920.6120.7720.300.10
LPL15_04520.5020.4320.5420.570.08
stars77020.6320.5220.7720.570.08
stars76720.7020.6020.7620.570.08
LPL15_03020.9320.8921.0020.570.08
LPL15_05720.8620.7920.9220.640.08
LPL15_02721.1221.0421.1721.020.09
LPL15_04621.0821.0121.1421.080.09
LPL15_00620.9420.8620.9921.140.10
LPL15_01121.1721.1021.2121.140.10
LPL15_00521.0921.0221.1321.310.13
LPL15_00721.1021.0321.1421.310.13
LPL15_02221.1321.0921.1721.310.13
LPL15_02921.2021.1921.2121.310.13
LPL15_00821.1621.0921.2121.430.16
LPL15_05521.1821.1121.2321.430.16
LPL15_00221.2021.1221.2521.430.16
Disclaimer/Publisher’s Note: The statements, opinions and data contained in all publications are solely those of the individual author(s) and contributor(s) and not of MDPI and/or the editor(s). MDPI and/or the editor(s) disclaim responsibility for any injury to people or property resulting from any ideas, methods, instructions or products referred to in the content.

