Article

Spatiotemporal Variation and Factors Influencing Water Yield Services in the Hengduan Mountains, China

1
Teaching Steering Committee, Sichuan Tourism University, Chengdu 610100, China
2
College of Earth Sciences, Chengdu University of Technology, Chengdu 610059, China
3
Key Laboratory of Earth Exploration and Information Technology, Ministry of Education, Chengdu 610059, China
4
Center for Global Change and Earth Observations, Michigan State University, East Lansing, MI 48824, USA
*
Author to whom correspondence should be addressed.
Remote Sens. 2023, 15(16), 4087; https://doi.org/10.3390/rs15164087
Submission received: 23 May 2023 / Revised: 31 July 2023 / Accepted: 8 August 2023 / Published: 19 August 2023

Abstract

:
Conducting a quantitative assessment of water yield in mountainous areas is crucial for the management, development, and sustainable utilization of water resources. The Hengduan Mountains Region (HDMR) is a significant water-supporting area characterized by complex topography and climate changes. To analyze the spatial and temporal variations of water yield in the HDMR from 2001 to 2020, we employed the InVEST model and examined the influencing factors in conjunction with the elevation gradient. Our results indicate that: (1) The water yield in the Hengduan Mountains decreases from southeast to northwest, with the southwestern and eastern regions having high water yield values, and the high-altitude areas in the northwestern part having low water yield values. (2) The water yield in the Hengduan Mountains exhibits a decreasing trend followed by an increasing trend from 2001 to 2020, with the lowest level in 2011 and higher levels in 2004, 2018, and 2020. (3) Pixel-based trend analysis demonstrates a decreasing trend in water yield in the central and western parts of the study area, while the eastern part shows an increasing trend. (4) The climatic components, particularly precipitation, predominantly influence the spatial and temporal variations of water yield in the Transverse Mountain region. In most areas, evapotranspiration and land surface temperature have a negative impact on water yield. (5) Water yield tends to decrease and then increase on the altitudinal gradient, with precipitation and actual evapotranspiration being the factors directly affecting water yield, and land surface temperature and the proportion of forested areas having a significant indirect effect on water yield. Our study provides a scientific basis for water resources management and sustainable development in the Hengduan Mountains.

1. Introduction

Ecosystem services are the benefits that humans derive from ecosystems and can be categorized into four types: provisioning (e.g., seafood and timber), regulation (e.g., climate and flooding), support (e.g., food production and pest control pollination), and culture (e.g., tranquility and inspiration) [1,2]. Water yield services, which are part of the hydrological cycle, play a crucial role in the exchange of the Earth’s energy and the transfer of chemicals. They also play a significant role in water purification, flood control, and runoff regulation [3,4]. As an important ecosystem service [5], water yield services are vital for ecosystem balance and regional sustainable development.
In the realm of assessing ecosystem water services, several methods have been employed, each with its own unique characteristics and complexities. These methods include water balance, precipitation storage [6], integrated water storage, soil storage, canopy retention residual, and multi-factor regression, which collectively contribute to a better understanding of ecosystem water services [6]. Among these methods, the Integrated Valuation of Ecosystem Services and Tradeoffs (InVEST) annual water yield module is based on the water balance approach [7]. This approach defines water yield as the amount of precipitation that remains after evapotranspiration and groundwater recharge have occurred. The InVEST model has been extensively employed for watershed water yield simulation [4,8,9,10,11], and its reliability in data-scarce regions has been validated [12]. These studies have underscored the robustness and versatility of the InVEST water yield model, which has been effectively applied in regional water resource assessment.
Mountain ecosystems, which are dominated by grasslands and forests, cover almost a quarter of the Earth’s land area. About half of the world’s mountains provide downstream water resources, making them critical water-bearing regions [13,14]. However, the threats to mountain ecosystem services are increasing due to climate change and human activities [15]. Studies have demonstrated that rapid population growth has resulted in water shortages in most mountain ranges worldwide [16]. Therefore, managing water resources in mountains poses a significant challenge.
The current research regarding factors that affect water yield services in mountainous regions has primarily focused on climate change and human activities. Changes in precipitation and evapotranspiration due to climate change can considerably influence the regional water cycle, thus impacting water production. Furthermore, it is essential to acknowledge that human-induced alterations in vegetation and land use can also significantly impact water yield services. Vegetation is vital in the watershed water cycle process by regulating hydrological processes such as evapotranspiration, surface run-off, and soil infiltration [17], thereby affecting energy and water balance [18,19]. The ecohydrological processes related to climate and vegetation at different altitudes behave differently [20,21,22,23,24], resulting in changes in water yield along the altitudinal gradient. Currently, many scholars have introduced the effect of terrain differences to carry out related research, such as when Zhang introduced the Terrain Niche Index to analyze the impact of the terrain gradient on ecosystem services in the Heihe River Basin, and pointed out that there is a positive correlation between water yield and the Terrain Niche Index [25], but Ma et al. pointed out that water yield was relatively low in the high topographic gradient zone, and there was a decreasing trend of water yield with an increasing elevation [26,27]. Apparently, there are regional variations in water yield with the altitude gradient, which are related to the climate, vegetation and land use types at different altitude gradients. Fewer studies have been conducted to quantify the direct and indirect effects of factors on water yield under the altitudinal gradient, and further clarification is needed.
The Hengduan Mountains are located in southwest China, with complex mountainous topography and significant vertical climate changes [28]. They possess the most characteristic complex elevation zones in Asia and Europe [29] and are also the upstream areas of several rivers, such as the Jinsha, Yalong, and Lancang, which are vital for water conservation [30,31]. Unfortunately, human activities, including vegetation destruction, overgrazing, and wasteland reclamation, have seriously damaged the local ecosystem, making it one of the most eroded areas in China [32,33,34]. Although previous studies of water yield in the Hengduan Mountains have focused on climatic factors and land use and land cover (LULC) changes [30,35,36], the complex topography of the Hengduan Mountains also requires consideration of the impact of topographic gradients on the spatial and temporal changes in water yield services. Therefore, this study employs the InVEST model to calculate water yield in the Transverse Mountain region over the past 20 years and explores its spatial and temporal variation characteristics. The study also investigates the effects of climate, vegetation, and LULC changes on water yield services under different topographic gradients, providing valuable insights into water security management measures in mountainous areas.

2. Study Area and Data Sources

2.1. Study Area

The Hengduan Mountains Region (HDMR) covers a total area of about 49,500 km2 and is located in southwestern China, including western Sichuan Province, northern Yunnan Province, and eastern Tibet Autonomous Region (Figure 1). The area exhibits a complex topography, with an average elevation exceeding 3000 m and decreasing from northwest to southeast. Precipitation also varies significantly with altitude, as the region is located in the transition zone of the first and second terraces in China. The region boasts diverse vegetation types, including coniferous forests, shrubs, grasslands, meadows, mixed coniferous forests, broadleaf forests, bogs, alpine vegetation, and artificial vegetation. Moreover, the region is intersected by several rivers such as the Nujiang River, Jinsha River, Yalong River, and Lancang River, thereby making it a significant water-conserving area in China.

2.2. Data Source and Processing

The primary data sources utilized in this paper encompass multiple facets of the natural environment. The required data sources and presentations are shown in Table 1 and the LULC coefficients are tabulated in Table 2. All the data is resampled to a 500 m resolution. Table 2 shows the LULC coefficients, reclassifying the LULC into six categories. lulc_veg is assigned a value of 1, according to the InVEST handbook for vegetation cover land use types other than wetlands, and a value of 0 for all other land use types. The root_depth represents the maximum rooting depth, and Kc represents the evapotranspiration coefficient for each LULC type, with values referencing the sources of reference to previous studies as well as to the InVEST model’s recommended parameters [37,38,39,40]. Multiple simulations were performed and a Z value of 15 was determined when the watershed yield and the total water yield from the water resources bulletin were closest.

3. Research Methods

3.1. Water Yield Model

The InVEST water yield module calculates the water yield of an image element based on the water balance method and the Budyko water–heat coupling equilibrium assumption, as shown below:
Y x = 1 A E T x P x   ·   P x
In Equation (1), AET denotes the annual actual evapotranspiration (mm), and P denotes the annual precipitation (mm). A E T x P x is calculated using the Budyko water–heat coupled equilibrium assumption equation proposed by Fu [41] and Zhang [42], as shown below:
A E T x P x = 1 + P E T x P x 1 + P E T x P x ω 1 / ω
In Equation (2), PET denotes potential evapotranspiration (mm), and ω denotes the non-physical parameter of natural climate–soil properties, which is calculated as follows:
P E T x = K c l x · E T 0 x , ω x = Z A W C x P x + 1.25
In this equation, ET0 represents the reference evapotranspiration, and Kc is the plant or vegetation evapotranspiration coefficient for a specific land use/land cover (LULC) type. The coefficient Z is the Zhang coefficient, and AWC (x) is the available water content of plants, which is calculated as follows:
A W C x = M i n Rest .   layer .   depth ,   root .   depth · P A W C
PAWC indicates the plant available water content and can be derived by calculating the difference between the field water holding capacity and the permanent wilting coefficient [43], which is calculated as follows:
F M C = 0.003075 ×   Sand   + 0.005886 ×   Slit   + 0.008039 × Clay   + 0.002208 × 0 M 0.14340 ×   BD
W C = 0.000059 ×   Sand   + 0.001142 ×   Silt   + 0.005766 × Clay   + 0.002228 × 0 M + 0.02671 × B D
In Equations (5) and (6): FMC is the field water holding capacity; WC is the permanent wilting coefficient; Clay, Silt, Sand, and OM are the constituents of soil, and BD refers to the bulk density of the soil.

3.2. Trend Analysis and Testing

The Theil–Sen Median (Sens) slope estimation method for calculating the slope of change of a long time series is a nonparametric method proposed by Sen in 1968 for evaluating the trend of sample data points [44]. Its calculation formula is as follows:
TS slope =   median x j x i t j t i , t j > t i
In Equation (7), TS slope denotes the median function, and x j and x i denotes the value of the jth and ith year. If T S s l o p e is greater than 0, it means that the data has an increasing trend; if T S s l o p e is less than 0, it means that the data has a decreasing trend; and its absolute value indicates the size of the trend change. The Mann–Kendall (MK) test is a nonparametric test, the advantage of which is that it does not require the sample to follow a certain distribution law and can effectively exclude the interference of outliers. For the time series X, the MK trend test statistic is:
Z c S 1 V a r S , S > 0 0 , S = 0 S + 1 V a r S , S < 0 ,   S = i = 1 n 1 j = i + 1 n s g n x j x i
s g n θ 1 , θ > 0 0 , θ = 0 1 , θ < 0 , V a r S = n n 1 2 n + 5 i = 1 n t i i 1 2 i + 5 18

4. Results

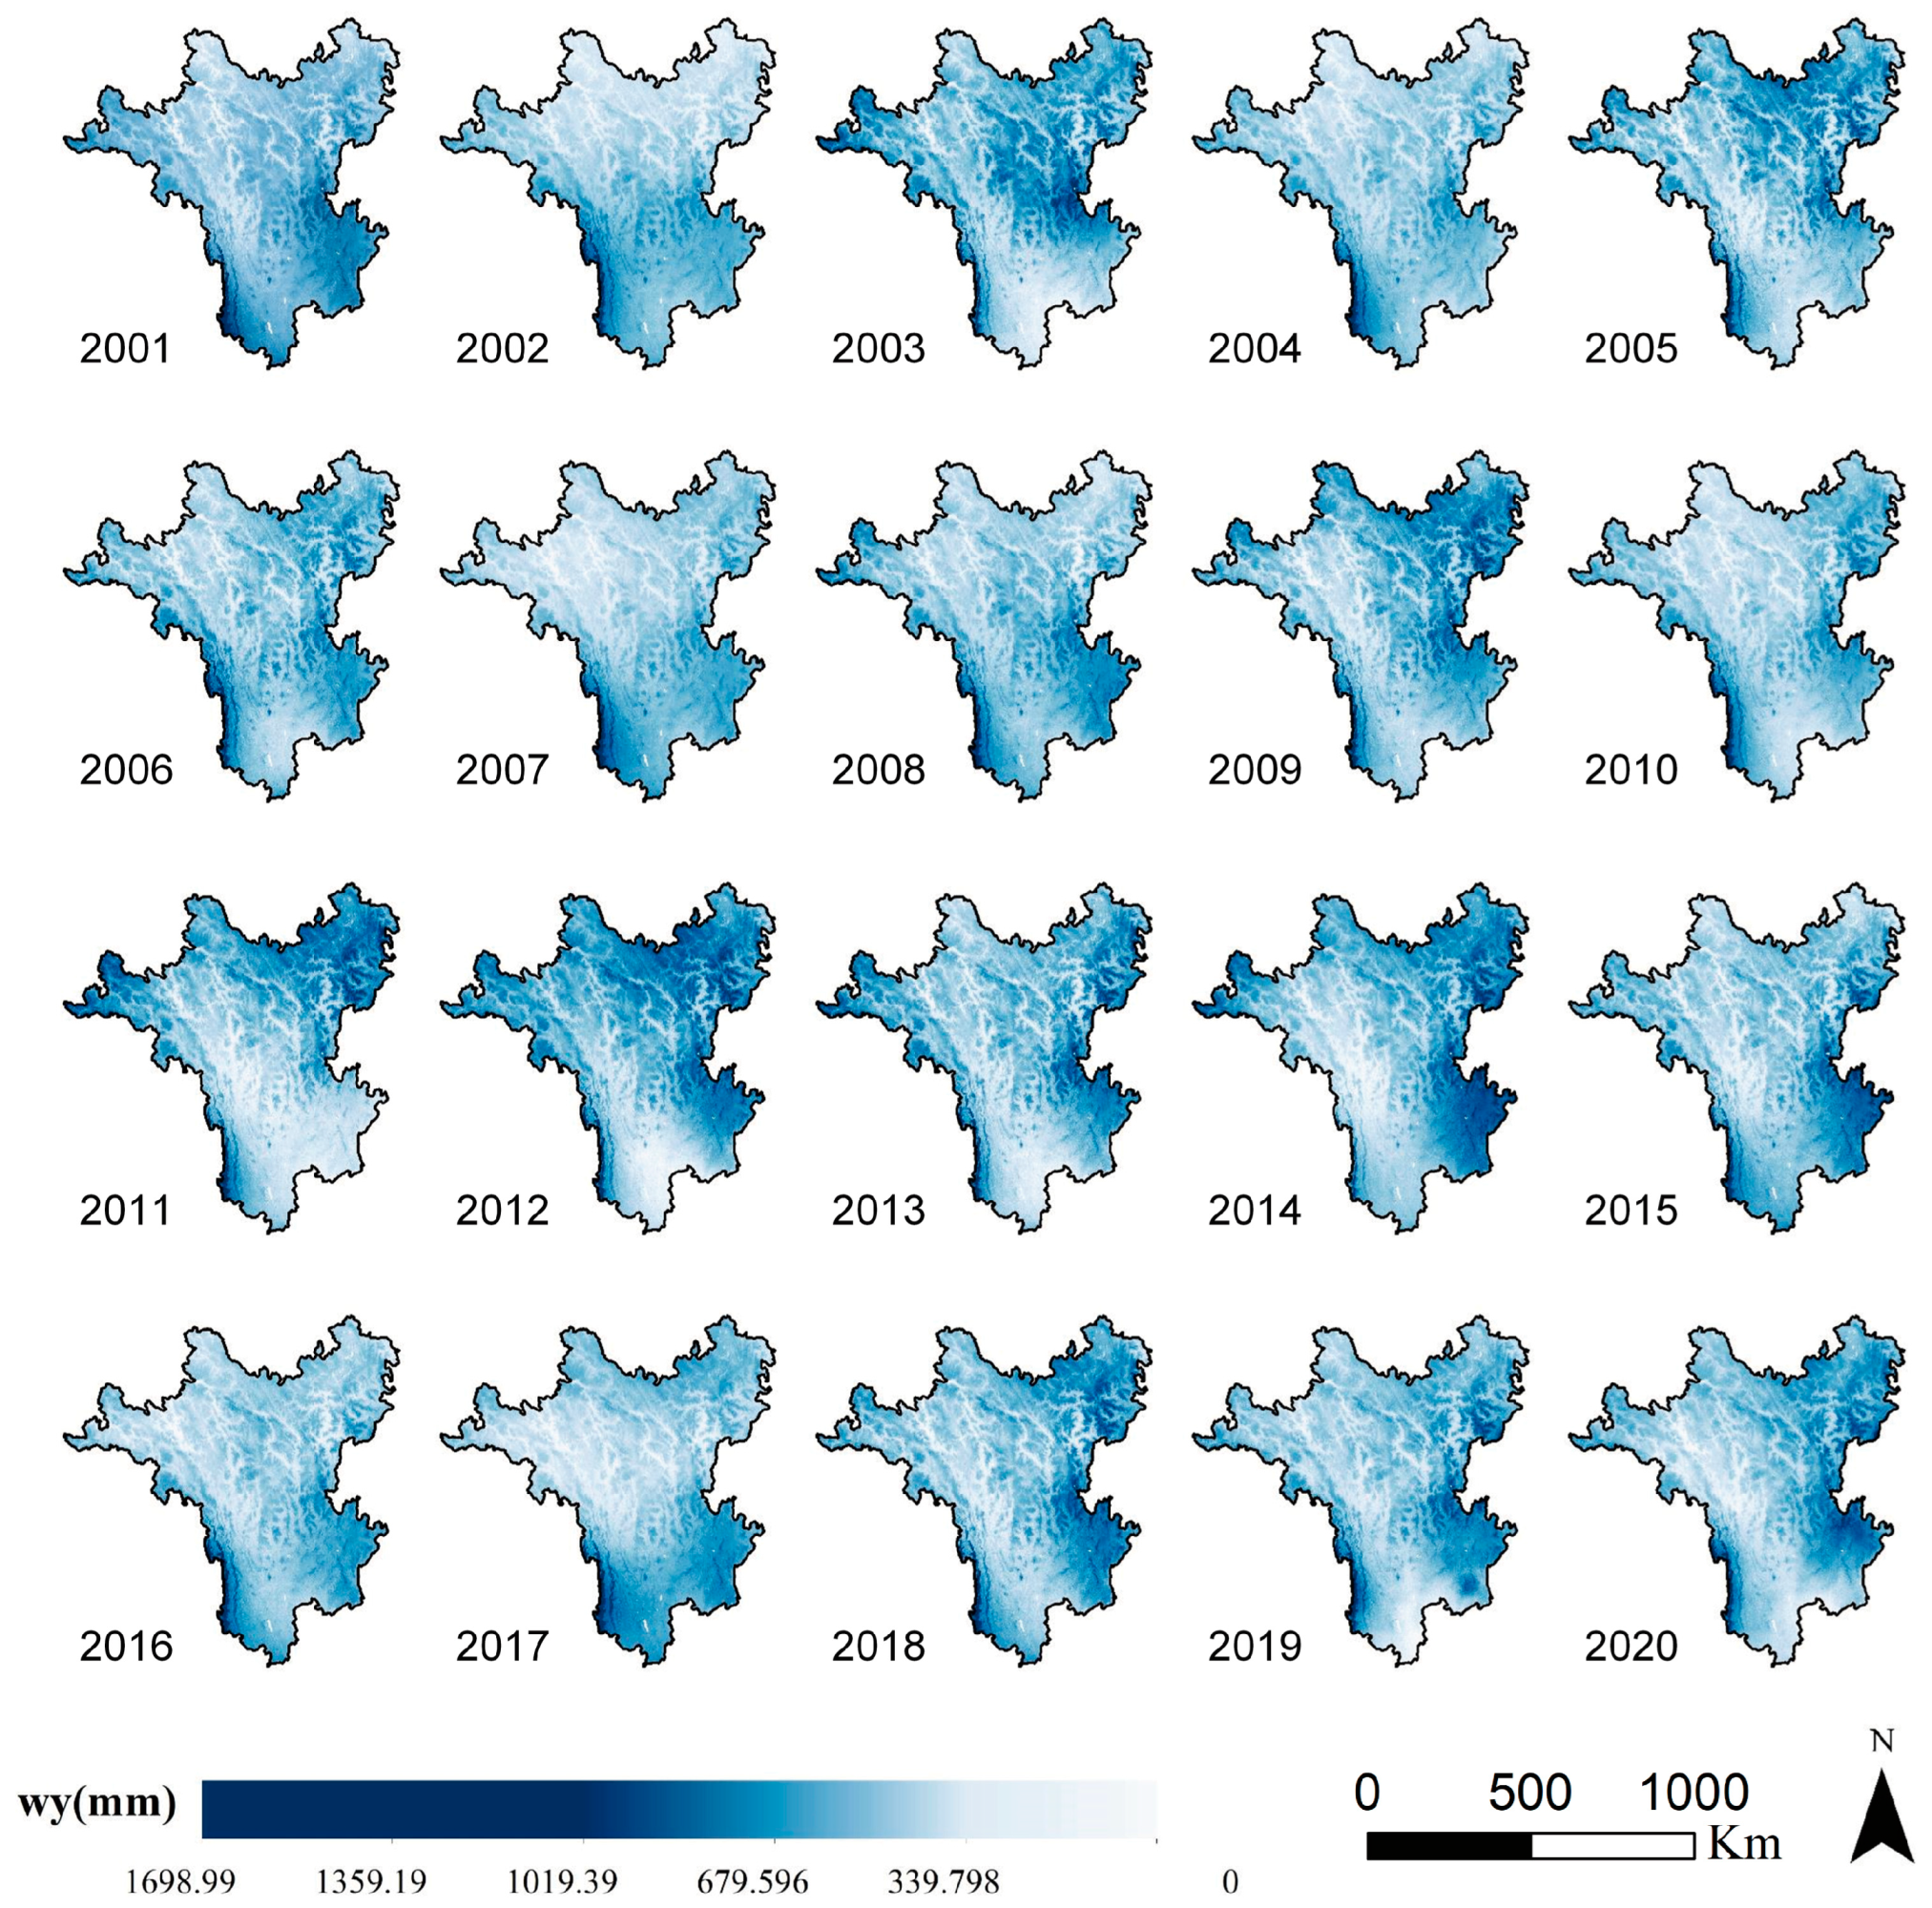
4.1. Spatial Pattern of HDMR Water Yield

The spatial distribution of water yield in the HDMR from 2001 to 2020 exhibited obvious spatial heterogeneity, with a general decrease from southeast to northwest (Figure 2). The average annual water yield (AWY) in most areas over the 20-year period was concentrated between 300 mm and 700 mm, accounting for about 95% of the area. Notably, the high-value region was mainly clustered in the southwest and eastern sectors of the HDMR, including Lushui, Fugong, and Yunlong counties in western Yunnan Province, as well as Songpan, Heshui, and Lixian counties, among others, in central and western Sichuan Province, with some areas showing an average AWY greater than 600 mm and even greater than 1000 mm. Conversely, the average water yield in eastern Tibet was lower, particularly in Changdu, Chaya, Mankang, Yanjing, and Batang counties, with the AWY in some areas less than 400 mm.

4.2. Trend Analysis of HDMR Water Yield

Between 2001 and 2020, water yield showed a decreasing and then increasing trend, reaching its lowest value in 2011, when the average water yield dropped to 406 mm (Figure 3).
Figure 4 demonstrates that it is feasible to gauge the trend of WY from 2001 to 2020 by employing the Sens trend analysis and MK test. The spatial distribution of the water yield variation trend evidently differs, with the water yield variation region mainly concentrating in the central and western regions of the HDMR and the eastern Sichuan Basin region. Within these areas, the water yield trend in the west and central regions is on a downward trajectory. Some regions had a slope exceeding −40 mm/a, with the percentage of the area of slightly significant decrease, significant decrease, and highly significant decrease amounting to 5.52%, 6.83%, and 0.37% (Table 3), respectively, and was mainly concentrated in Zogong County, Yanjing County, Xiangcheng County, and Litang County. The percentage of the area of slightly significant increase, significant increase, and highly significant increase amounted to 5.16%, 2.32%, and 0.15%, respectively, and was mainly concentrated in Mao County, Wenchuan County, Meigu County, and Zhaoge County. The highest slope noted was 45.15 mm/a, and 79.61% of the area exhibited no significant change in water yield.

4.3. Factors Influencing Water Yield

4.3.1. The Influence of Climatic Factors on Water Yield

The spatial distribution patterns of precipitation PR and water yield WY for the past two decades in the HDMR show that the high PR area is located in the western part of Yunnan Province (Figure 5), mainly influenced by southwest water vapor [45], while the southern part of Sichuan Province is also characterized by higher PR, mainly controlled by the southeast monsoon. However, the northwest of HDMR has relatively low annual average PR due to the obstruction of the north–south mountain ranges and the increase in altitude. The northern valley area of HDMR experiences less precipitation compared to the surrounding areas due to the rain shadow or the Föhn effect on the leeward slope of tall mountains [46]. Combined with a higher potential evapotranspiration (PET), it results in a lower regional WY. PET, actual evapotranspiration (AET), and land surface temperature (LST) show a similar spatial distribution pattern, with higher AET and surface temperature in low-altitude areas in the south that decreases from south to north.
The temporal evolution of PR in the HDMR is similar to that of water yield, with a decreasing and then increasing trend from 2001 to 2020, reaching a minimum in 2011 which coincided with other findings [47]. The year 2011 was characterized by exceptional high temperatures and scarce precipitation, which triggered an acute drought event [48], leading to the lowest WY in the past two decades. Similarly, 2006 had low PR averages and relatively high PET levels, resulting in a massive drought episode in the eastern and Sichuan regions of HDMR, which are also reflected in Figure 2. Although PET, AET, and LST showed a weak upward trend from 2001 to 2020, the trend was not significant (Figure 6).
The correlation analysis between WY and PR, PET, AET, and LST showed that al-most all regions in the HDMR had a correlation coefficient of over 90% between PR and WY (Figure 5). In 69.1% of the regions, PET had a negative correlation with WY with an average correlation coefficient (R) of −0.61, which was mainly concentrated in the low-altitude areas in northern Yunnan Province. In 19.5% of the regions, AET had a negative correlation with WY, with an average R of −0.58. However, in some low-altitude areas in southern HDMR, WY showed a positive correlation with AET, which may be related to higher precipitation. In 59.8% of the regions, LST had a negative correlation with WY, with an average R of −0.57. These findings are consistent with previous research results [49,50], suggesting that precipitation, as the source of water yield, is the main variable affecting the spatiotemporal pattern of water yield.

4.3.2. The Influence of LULC on Water Yield

Figure 7 shows the average WY of different LULC types in the HDMR from 2001 to 2020. The results indicate that WY of different LULC types changed similarly over the study period. The highest average WY was on unused land, reaching a maximum of 715 mm in 2004. The average WY of construction land and cultivated land reached their peaks in 2017, at 658 mm and 669 mm, respectively. Grassland and forest had relatively high average WY in 2004, 2018, and 2020. From 2002 to 2004, the average WY of water bodies, grasslands, and unused land continued to increase, while the average WY of forest land, construction land, and cultivated land first decreased and then increased, reaching a low point in 2003.
The LULC in the HDMR are distributed at varying altitudes, with cropland and built-up areas concentrated at low altitudes, and water bodies (mainly wetlands) and unused land at high altitudes (>5000 m) (Figure 8). The proportion of LULC at different altitudes was calculated in 200-meter intervals (Figure 7). The proportion of forest cover increases with an increasing altitude and then gradually decreases, reaching its peak (49.8%) at around 3200 m. Before 5000 m, the proportion of grassland decreases, in contrast to forests, then increases and reaches its lowest value (49.7%) at around 3200 m, and its highest value (96.9%) at around 4600 m. After 5000 m, the proportion of grassland decreases rapidly. Forests in the mid to high-altitude areas are mainly distributed around river valleys. The proportion of different LULC types changed very little from 2001 to 2020, with forest and farmland being the main types (Table 4). The proportion of forest increased from 16.32% in 2001 to 17.9% in 2020, while the proportion of farmland decreased from 2.2% in 2001 to 1.6% in 2020, which may be related to the government’s policy of returning farmland to forests.
The WY curve shows a trend of first decreasing and then increasing, with the lowest point (468.8 mm) around 3000 m. This trend may be related to the percentages of grassland, forest, and unused land. Unused land has low vegetation coverage, weak evaporation capacity, and surface permeability [51,52], resulting in a higher WY. Forest, on the other hand, has deeper roots and stronger permeability, but requires more water and has a stronger evaporation capacity [53,54,55]. The PET and actual evapotranspiration AET in the forest region are both high, which leads to a lower WY in the forest. Considering that the HDMR area is the origin of many rivers, and its WY service affects the water security and sustainable development of downstream areas, afforestation projects should also consider their impact on the watershed water resources.

5. Discussion

5.1. Verification of InVEST

The study compared the model predictions with the measured data and continuously adjusted the model parameters to obtain the best fit values for the study area. Utilizing the water resources bulletin of Sichuan and Yunnan Provinces in 2019, Figure 2 shows the simulated water yield and actual total water yield of eight cities: Diqing Tibetan Autonomous Prefecture, Nujiang of the Lisu Autonomous Prefecture, Dali, Lijiang, Panzhihua, Liangshan Yi Autonomous Prefecture, Tibetan Autonomous Prefecture of Garze, and Tibetan Qiang Autonomous Prefecture of Nga-wa. The results show that there is a strong linear relationship between the two (Figure 9), indicating that the InVEST model is effective in simulating water yield.

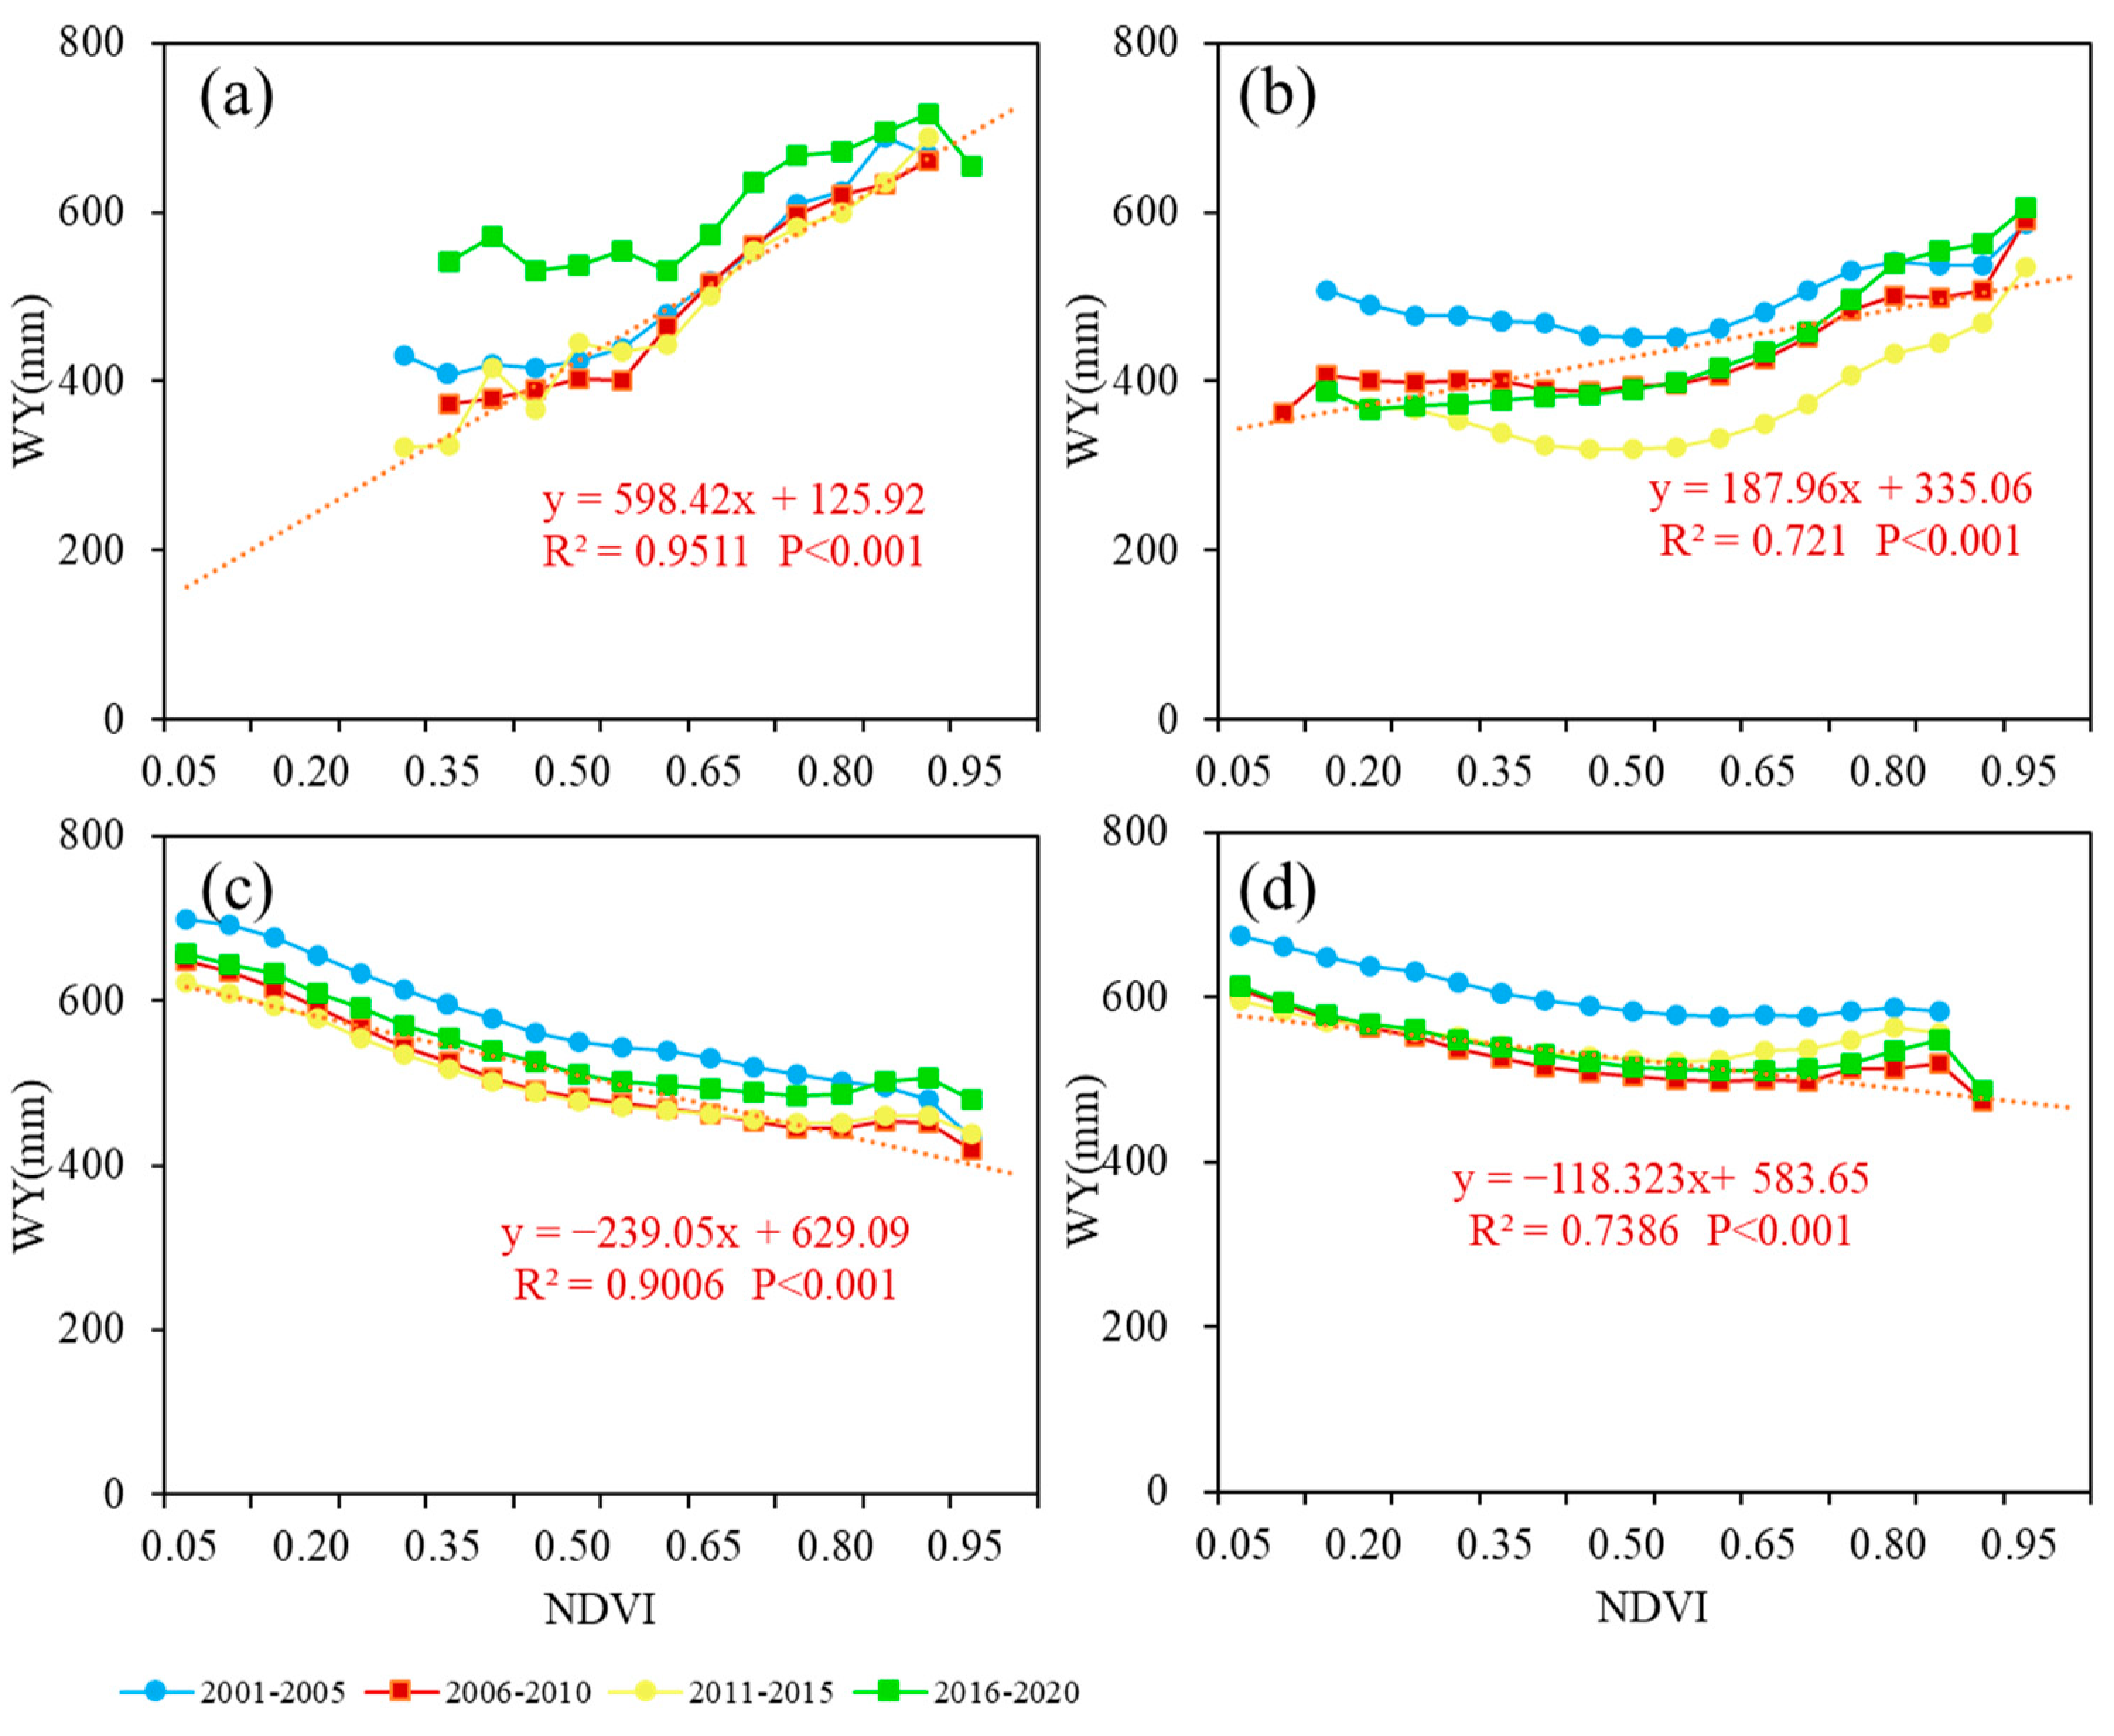
5.2. Effect of Vegetation Cover on WY

WY is influenced by multiple factors, including vegetation coverage, soil type, and vegetation type. Figure 10 shows the distribution of NDVI in the HDMR area. To investigate the relationship between vegetation coverage and water yield at different elevations, the HDMR was divided into four altitudinal zones based on the classification by Long et al. [56]: low altitude (below 1000 m), middle altitude (between 1000 m and 3500 m), high altitude (between 3500 m and 5000 m), and very high altitude (above 5000 m). The WY values at different elevations in different years were calculated by excluding areas classified as water bodies and construction land (Figure 11). The WY was strongly positively correlated with the NDVI in the low-altitude interval (R2 = 0.9511, p < 0.001). For every 0.1 increase in the NDVI, WY increased by 59.84 mm. In the middle-altitude interval where the NDVI was less than 0.65, water yield had a weak positive correlation with the NDVI (R2 = 0.721, p < 0.001) and did not vary significantly with the NDVI, but when the NDVI was greater than 0.65, water yield increased with the NDVI. At high and very high altitudes, WY decreased with the increasing NDVI. These results indicate that the relationship between the NDVI and WY is not simply linear and varies significantly with elevation, with a positive correlation at low and medium elevations and a negative correlation at high elevations.

5.3. Factors Affecting Water Yield at Different Altitude Gradients

To further quantify the impacts of land use and climate on water yield at different elevation gradients, we used path analysis to explore the paths and strengths of the impacts between the LULC proportions (share of forested land, grassland, and unused land), climatic factors (PR, AET, LST), and WY in 2020 at different elevation gradients. Figure 12 shows the direct effect of each factor on WY, with PR and AET having the largest path coefficients (0.810 and −0.719, respectively) as factors directly affecting water yield, compared to LST, which has a non-significant direct effect on water yield, and LULC factors (the proportion of unutilized land, grassland, and forested land area) and the NDVI, which have a smaller direct effect on water yield. In addition, the LST and forest area proportion had a significant effect on AET, with path coefficients of 0.780 and 0.313, respectively, while the effect of precipitation on AET was not significant, which indicated that changes in the AET elevation gradient in the study area were mainly influenced by the LST and forest area proportion. In terms of indirect effects, the effects of the LST and forest land proportion on water yield were significantly significant (Table 5), with indirect path coefficients of −0.560 and −0.225, and total path coefficients of −0.660 and −0.293, respectively.
The results showed that the differences in water yield across the altitudinal gradient were directly influenced by precipitation and actual evapotranspiration (ET), and the proportion of forest had a significant effect on WY by influencing the mediating variable AET. As AET at 2500–3500 m altitude is less constrained by water and energy, it is more suitable for forest growth [57] and has a higher area proportion. Whereas, due to the fact that the forest intercepts a large amount of radiation and consumes more water compared to other LULC types [58,59,60], it resulted in the study area having lower water yield above and below 3000 m elevation, which is consistent with the findings of others [61,62]. Many studies have explained the variation in water yield with elevation as a result of the differences in the area of different land use types [27,36,63,64]. Although some studies pointed out the negative correlation between temperature and water yield at different elevation gradients [59], however, the results of the path analysis indicated that the indirect effect of temperature on water yield exceeded the effect of forest land occupation at the elevation gradient, which differed from the results of Dai et al.’s study in this region, which may be caused by the different study scales [35]. Studies have shown that AET may increase in mountainous regions in the context of global warming, leading to a decrease in water resources [24,65]. Although the drying trend has been reported to be slower at higher altitudes than at lower altitudes in the HDMR, this still poses some challenges for water resource management in mountainous regions.

5.4. Uncertainty and Limitations

The assessment of water yield services is a complex process, which entails uncertainties. The InVEST model, commonly used for this purpose, simplifies hydrological processes and disregards the influence of complex terrain, which includes the recharge of surface water and groundwater [66]. We opted to use TerraClimate, a gridded climate dataset, in our study, given its availability of data and the number of meteorological stations. The dataset was developed based on the WorldClim, CRU Ts4.0, and JRA-55 data [67]. However, it is worth noting that using TerraClimate may result in an overestimation of precipitation in mountainous areas [68,69]. Furthermore, the accuracy of our results may be affected by the LULC data sourced from the MCD12 product, as studies have shown that the problem of pixel mixing in complex mountainous areas due to the terrain and altitude increases the uncertainty of the product [70,71]. Additionally, the empirically determined KC coefficients and soil root depth in Table 2 may affect the accuracy of the results. Nevertheless, we expect the spatial distribution and basic pattern of the results to remain unchanged.
The HDMR, as a typical monsoon climate zone, experiences uneven annual precipitation distribution [72], with the dry season receiving less precipitation, and the rainy season (June-September) contributing 75–90% of the annual precipitation [73,74,75]. Our study focused on analyzing the interannual variation and spatial–temporal distribution of regional water yield. Given the seasonal characteristics of the HDMR climate, future research should concentrate on studying the changes in WY during different periods of the year to support regional water resources management.

6. Conclusions

The Hengduan Mountains, located in the upstream area of several rivers with complex topography and large altitude differences, are vital for water supply in China. This study utilized the InVEST annual water yield model to quantitatively assess the ecological service function of water yield in the Hengduan Mountains from 2001 to 2020 and identify the factors influencing it in relation to elevation. The findings are summarized below:
  • The spatial pattern of water yield in the Hengduan Mountains for the past 20 years is consistent, showing a general decrease from southeast to northwest. For most of this 20-year period, the average annual water yield was concentrated between 300 mm and 700 mm, occupying about 95% of the area. The southwestern and eastern regions have high values of water yield, whereas the higher elevations in the northwestern area have low values.
  • The water yield in the HDMR first decreased, reaching a minimum of 406 mm in 2011, and then increased from 2001 to 2020. It reached higher levels in 2004, 2018, and 2020. The water yield in the central and western HDMR decreased, whereas the eastern Sichuan Basin region showed an increase.
  • The water yield services of the HDMR are affected by climate, vegetation, and elevation. Climatic factors are the primary influencing factors on the spatial and temporal variation of water yield in the area. Precipitation as the source of water yield is the main variable affecting the spatial and temporal patterns of water yield, and in most areas, evapotranspiration and land surface temperature have a negative impact on water yield.
  • Water yield varies greatly with altitudinal gradient, generally showing a decreasing and then increasing trend, with the lowest water yield at about 3000 m above sea level, which may be related to LULC at different altitudes. On the altitudinal gradient, precipitation and actual evapotranspiration had a high direct effect, and land surface temperature and forest proportion had a high indirect effect on water yield through actual evapotranspiration.
  • The relationship between the NDVI and water yield is not a simple linear relation-ship and varies significantly with altitude. In the low and middle altitude regions, the two are positively correlated, while in the high-altitude region, they are negatively correlated.

Author Contributions

Conceptualization, Q.S., H.S. and L.H.; formal analysis, Q.S., L.H. and L.L.; funding acquisition, H.S., Q.S. and L.L.; investigation, Q.S., L.H., L.L. and J.Q.; methodology, Q.S., H.S. and L.H.; validation, H.S., Q.S. and L.H.; writing—original draft, Q.S., L.H. and H.S.; writing—review and editing, Q.S., L.L. and J.Q. All authors have read and agreed to the published version of the manuscript.

Funding

This study was funded by the National Natural Science Foundation of China (Grant No. 42271405) and the Science and Technology Department of Sichuan Province (Grant No. 2022NSFSC0231, 2023NSFSC0248).

Data Availability Statement

The data presented in this study are contained within the article.

Acknowledgments

We are greatly grateful for the support of the funds and projects. We are also grateful for the anonymous reviewers and their insight and critical review of the manuscript.

Conflicts of Interest

The authors declare no conflict of interest.

References

  1. Corvalan, C.; Hales, S.; McMichael, A.J.; Butler, C.; McMichael, A. Ecosystems and Human Well-Being: Health Synthesis; World Health Organization: Geneva, Switzerland, 2005; Volume 1. [Google Scholar]
  2. Chan, K.M.; Shaw, M.R.; Cameron, D.R.; Underwood, E.C.; Daily, G.C. Conservation planning for ecosystem services. PLoS Biol. 2006, 4, e379. [Google Scholar]
  3. Lian, X.; Qi, Y.; Wang, H.; Zhang, J.; Yang, R. Assessing Changes of Water Yield in Qinghai Lake Watershed of China. Water 2019, 12, 11. [Google Scholar]
  4. Li, M.; Liang, D.; Xia, J.; Song, J.; Cheng, D.; Wu, J.; Cao, Y.; Sun, H.; Li, Q. Evaluation of water conservation function of Danjiang River Basin in Qinling Mountains, China based on InVEST model. J. Environ. Manag. 2021, 286, 112212. [Google Scholar]
  5. Alcamo, J.; FlÖRke, M.; MÄRker, M. Future long-term changes in global water resources driven by socio-economic and climatic changes. Hydrol. Sci. J. 2007, 52, 247–275. [Google Scholar]
  6. Wu, S.; Zhou, W.; Yan, K.; Zhang, X. Response of the Water Conservation Function to Vegetation Dynamics in the Qinghai–Tibetan Plateau Based on MODIS Products. IEEE J. Sel. Top. Appl. Earth Obs. Remote Sens. 2020, 13, 1675–1686. [Google Scholar]
  7. Jia, G.; Hu, W.; Zhang, B.; Li, G.; Shen, S.; Gao, Z.; Li, Y. Assessing impacts of the Ecological Retreat project on water conservation in the Yellow River Basin. Sci. Total Env. 2022, 828, 154483. [Google Scholar]
  8. Yin, G.; Wang, X.; Zhang, X.; Fu, Y.; Hao, F.; Hu, Q. InVEST Model-Based Estimation of Water Yield in North China and Its Sensitivities to Climate Variables. Water 2020, 12, 1692. [Google Scholar]
  9. Hu, W.; Li, G.; Gao, Z.; Jia, G.; Wang, Z.; Li, Y. Assessment of the impact of the Poplar Ecological Retreat Project on water conservation in the Dongting Lake wetland region using the InVEST model. Sci. Total Env. 2020, 733, 139423. [Google Scholar]
  10. Wei, P.; Chen, S.; Wu, M.; Deng, Y.; Xu, H.; Jia, Y.; Liu, F. Using the InVEST Model to Assess the Impacts of Climate and Land Use Changes on Water Yield in the Upstream Regions of the Shule River Basin. Water 2021, 13, 1250. [Google Scholar]
  11. Wang, X.; Liu, G.; Lin, D.; Lin, Y.; Lu, Y.; Xiang, A.; Xiao, S. Water yield service influence by climate and land use change based on InVEST model in the monsoon hilly watershed in South China. Geomat. Nat. Hazards Risk 2022, 13, 2024–2048. [Google Scholar]
  12. Yang, X.; Chen, R.; Meadows, M.E.; Ji, G.; Xu, J. Modelling water yield with the InVEST model in a data scarce region of northwest China. Water Supply 2020, 20, 1035–1045. [Google Scholar] [CrossRef]
  13. Mengist, W.; Soromessa, T.; Legese, G. Ecosystem services research in mountainous regions: A systematic literature review on current knowledge and research gaps. Sci. Total Env. 2020, 702, 134581. [Google Scholar]
  14. Viviroli, D.; Dürr, H.H.; Messerli, B.; Meybeck, M.; Weingartner, R. Mountains of the world, water towers for humanity: Typology, mapping, and global significance. Water Resour. Res. 2007, 43, 1–13. [Google Scholar]
  15. Palomo, I. Climate Change Impacts on Ecosystem Services in High Mountain Areas: A Literature Review. Mt. Res. Dev. 2017, 37, 179–187. [Google Scholar]
  16. Grêt-Regamey, A.; Weibel, B. Global assessment of mountain ecosystem services using earth observation data. Ecosyst. Serv. 2020, 46, 101213. [Google Scholar]
  17. Xiong, P.; Chen, Z.; Jia, Z.; Wang, Z.; Palta, J.A.; Xu, B. Variability in leaf wettability and surface water retention of main species in semiarid Loess Plateau of China. Ecohydrology 2018, 11, e2021. [Google Scholar]
  18. Cao, S.; Chen, L.; Shankman, D.; Wang, C.; Wang, X.; Zhang, H. Excessive reliance on afforestation in China’s arid and semi-arid regions: Lessons in ecological restoration. Earth-Sci. Rev. 2011, 104, 240–245. [Google Scholar]
  19. Donohue, R.J.; Roderick, M.L.; McVicar, T.R. On the importance of including vegetation dynamics in Budyko’s hydrological model. Hydrol. Earth Syst. Sci. 2007, 11, 983–995. [Google Scholar] [CrossRef]
  20. Crimmins, S.M.; Dobrowski, S.Z.; Greenberg, J.A.; Abatzoglou, J.T.; Mynsberge, A.R. Changes in climatic water balance drive downhill shifts in plant species’ optimum elevations. Science 2011, 331, 324–327. [Google Scholar] [CrossRef]
  21. Allen, C.D.; Breshears, D.D. Drought-induced shift of a forest-woodland ecotone: Rapid landscape response to climate variation. Proc. Natl. Acad. Sci. USA 1998, 95, 14839–14842. [Google Scholar] [CrossRef]
  22. Brooks, P.D.; Vivoni, E.R. Mountain ecohydrology: Quantifying the role of vegetation in the water balance of montane catchments. Ecohydrology 2008, 1, 187–192. [Google Scholar] [CrossRef]
  23. Wilcox, B.P. Transformative ecosystem change and ecohydrology: Ushering in a new era for watershed management. Ecohydrology 2010, 3, 126–130. [Google Scholar] [CrossRef]
  24. Goulden, M.L.; Bales, R.C. Mountain runoff vulnerability to increased evapotranspiration with vegetation expansion. Proc. Natl. Acad. Sci. USA 2014, 111, 14071–14075. [Google Scholar] [CrossRef] [PubMed]
  25. Zhang, L.; Hu, N. Spatial Variation and Terrain Gradient Effect of Ecosystem Services in Heihe River Basin over the Past 20 Years. Sustainability 2021, 13, 11271. [Google Scholar] [CrossRef]
  26. Wang, L.-J.; Ma, S.; Jiang, J.; Zhao, Y.-G.; Zhang, J.-C. Spatiotemporal Variation in Ecosystem Services and Their Drivers among Different Landscape Heterogeneity Units and Terrain Gradients in the Southern Hill and Mountain Belt, China. Remote Sens. 2021, 13, 1375. [Google Scholar] [CrossRef]
  27. Ma, S.; Qiao, Y.-P.; Wang, L.-J.; Zhang, J.-C. Terrain gradient variations in ecosystem services of different vegetation types in mountainous regions: Vegetation resource conservation and sustainable development. For. Ecol. Manag. 2021, 482, 118856. [Google Scholar] [CrossRef]
  28. Zhang, K.; Pan, S.; Cao, L.; Wang, Y.; Zhao, Y.; Zhang, W. Spatial distribution and temporal trends in precipitation extremes over the Hengduan Mountains region, China, from 1961 to 2012. Quat. Int. 2014, 349, 346–356. [Google Scholar] [CrossRef]
  29. Yao, Y.; Zhang, B.; Han, F.; Pang, Y. Diversity and geographical pattern of altitudinal belts in the Hengduan Mountains in China. J. Mt. Sci. 2010, 7, 123–132. [Google Scholar] [CrossRef]
  30. Yin, L.; Zhang, S.; Zhang, B. Do Ecological Restoration Projects Improve Water-Related Ecosystem Services? Evidence from a Study in the Hengduan Mountain Region. Int. J. Environ. Res. Public Health 2022, 19, 3860. [Google Scholar] [CrossRef]
  31. Shi, Z.; Deng, W.; Zhang, S. Spatio-temporal pattern changes of land space in Hengduan Mountains during 1990–2015. J. Geogr. Sci. 2018, 28, 529–542. [Google Scholar] [CrossRef]
  32. Xianghao, Z. Study of Protection and Construction of Mountain Ecological Security Barrier in China. J. Mt. Sci. 2008, 26, 2–11. [Google Scholar]
  33. Lynch, H.J.; Wurtman, R.J.; Ronsheim, P. Activity and melatonin rhythms among rats with recourse to dark burrows. Prog. Clin. Biol. Res. 1982, 92, 75–86. [Google Scholar] [PubMed]
  34. Yin, L.; Dai, E.; Xie, G.; Zhang, B. Effects of Land-Use Intensity and Land Management Policies on Evolution of Regional Land System: A Case Study in the Hengduan Mountain Region. Land 2021, 10, 528. [Google Scholar] [CrossRef]
  35. Dai, E.; Wang, Y. Attribution analysis for water yield service based on the geographical detector method: A case study of the Hengduan Mountain region. J. Geogr. Sci. 2020, 30, 1005–1020. [Google Scholar] [CrossRef]
  36. Wang, Y.; Dai, E.; Ge, Q.; Zhang, X.; Yu, C. Spatial heterogeneity of ecosystem services and their trade-offs in the Hengduan Mountain region, Southwest China. Catena 2021, 207, 105632. [Google Scholar] [CrossRef]
  37. Wang, Z.; Li, Q.; Liu, L.; Zhao, H.; Ru, H.; Wu, J.; Deng, Y. Spatiotemporal Evolution and Attribution Analysis of Water Yield in the Xiangjiang River Basin (XRB) Based on the InVEST Model. Water 2023, 15, 514. [Google Scholar] [CrossRef]
  38. Canadell, J.; Jackson, R.B.; Ehleringer, J.B.; Mooney, H.A.; Sala, O.E.; Schulze, E.D. Maximum rooting depth of vegetation types at the global scale. Oecologia 1996, 108, 583–595. [Google Scholar] [CrossRef]
  39. Xiang-yu, L.; Chong-chong, Y.; Yi, W.; Tao, Z.; Jian, S. Spatiotemporal Variation Characteristics and Its Driving Forces of Water Conservation Function on the Tibetan Plateau from 1995 to 2014. Acta Agrestia Sin. 2021, 29, 80–92. [Google Scholar]
  40. Sharp, R.; Chaplin-Kramer, R.; Wood, S.; Guerry, A.; Tallis, H.; Ricketts, T.; Nelson, E.; Ennaanay, D.; Wolny, S.; Olwero, N.; et al. InVEST User’s Guide; The Natural Capital Project: Stanford, CA, USA, 2018. [Google Scholar]
  41. Fu, B.P. On the calculation of the evaporation from land surface. Chin. J. Atmos. Sci. 1981, 5, 23–31. [Google Scholar]
  42. Zhang, L.; Hickel, K.; Dawes, W.R.; Chiew, F.H.S.; Western, A.W.; Briggs, P.R. A rational function approach for estimating mean annual evapotranspiration. Water Resour. Res. 2004, 40, 12–19. [Google Scholar] [CrossRef]
  43. Gupta, S.C.; Larson, W.E. Estimating soil water retention characteristics from particle size distribution, organic matter percent, and bulk density. Water Resour. Res. 1979, 15, 1633–1635. [Google Scholar] [CrossRef]
  44. Sen, P.K. Estimates of the Regression Coefficient Based on Kendall’s Tau. J. Am. Stat. Assoc. 1968, 63, 1379–1389. [Google Scholar] [CrossRef]
  45. Yu, H.; Wang, L.; Yang, R.; Yang, M.; Gao, R. Temporal and spatial variation of precipitation in the Hengduan Mountains region in China and its relationship with elevation and latitude. Atmos. Res. 2018, 213, 1–16. [Google Scholar] [CrossRef]
  46. Yunling, H.; Yiping, Z. Influences of Corridor-barrier Function on the Spatial Characteristics of Temperature and Precipitation in the Longitudinal Range-Gorge Region(LRGR). J. Mt. Sci. 2007, 25, 169–176. [Google Scholar]
  47. Li, Y.; Feng, A.; Liu, W.; Ma, X.; Dong, G. Variation of Aridity Index and the Role of Climate Variables in the Southwest China. Water 2017, 9, 743. [Google Scholar] [CrossRef]
  48. Yan, G.; Wu, Z.; Li, D. Comprehensive Analysis of the Persistent Drought Events in Southwest China. Disaster Adv. 2013, 6, 306–315. [Google Scholar]
  49. Yu, Y.H.; Sun, X.Q.; Wang, J.L.; Zhang, J.P. Using InVEST to evaluate water yield services in Shangri-La, Northwestern Yunnan, China. PeerJ 2022, 10, e12804. [Google Scholar] [CrossRef]
  50. Delphin, S.; Escobedo, F.J.; Abd-Elrahman, A.; Cropper, W.P. Urbanization as a land use change driver of forest ecosystem services. Land Use Policy 2016, 54, 188–199. [Google Scholar] [CrossRef]
  51. Li, H.; Liu, G.; Fu, B. Estimation of regional evapotranspiration in alpine area and its response to land use change: A case study in Three-River Headwaters region of Qinghai-Tibet Plateau, China. Chin. Geogr. Sci. 2012, 22, 437–449. [Google Scholar] [CrossRef]
  52. Huang, X.; Luo, G.; Lv, N. Spatio-temporal patterns of grassland evapotranspiration and water use efficiency in arid areas. Ecol. Res. 2017, 32, 523–535. [Google Scholar] [CrossRef]
  53. Bi, H.; Liu, B.; Wu, J.; Yun, L.; Chen, Z.; Cui, Z. Effects of precipitation and landuse on runoff during the past 50 years in a typical watershed in Loess Plateau, China. Int. J. Sediment Res. 2009, 24, 352–364. [Google Scholar] [CrossRef]
  54. Bai, P.; Liu, X.; Zhang, Y.; Liu, C. Assessing the Impacts of Vegetation Greenness Change on Evapotranspiration and Water Yield in China. Water Resour. Res. 2020, 56, e2019WR027019. [Google Scholar] [CrossRef]
  55. Li, Y.; Piao, S.; Li, L.Z.X.; Chen, A.; Wang, X.; Ciais, P.; Huang, L.; Lian, X.; Peng, S.; Zeng, Z.; et al. Divergent hydrological response to large-scale afforestation and vegetation greening in China. Sci. Adv. 2018, 4, eaar4182. [Google Scholar] [CrossRef] [PubMed]
  56. Long, X.; Li, X. Mountain Attitude Classification Indexes Adjustment Based on Multi-Source Data in Chinaon Multi-Source Data in China. Sci. Geogr. Sin. 2017, 37, 1577–1584. [Google Scholar]
  57. Zhang, W.; Ning, J.; Song, K.; Li, X.; Wang, Y.; Wang, X.; Qin, G. The Response of Vegetation Cover to the Variation of Heat and Water Conditions in Upper Minjiang Watershed, China. J. Mt. Sci. 2013, 31, 280–286. [Google Scholar]
  58. Chen, X.; Liu, L.; Su, Y.; Yuan, W.; Liu, X.; Liu, Z.; Zhou, G. Quantitative association between the water yield impacts of forest cover changes and the biophysical effects of forest cover on temperatures. J. Hydrol. 2021, 600, 126529. [Google Scholar] [CrossRef]
  59. Liu, N.; Sun, P.; Caldwell, P.V.; Harper, R.; Liu, S.; Sun, G. Trade-off between watershed water yield and ecosystem productivity along elevation gradients on a complex terrain in southwestern China. J. Hydrol. 2020, 590, 125449. [Google Scholar] [CrossRef]
  60. Kurzweil, J.R.; Metlen, K.; Abdi, R.; Strahan, R.; Hogue, T.S. Surface water runoff response to forest management: Low-intensity forest restoration does not increase surface water yields. For. Ecol. Manag. 2021, 496, 119387. [Google Scholar] [CrossRef]
  61. Balthazar, V.; Vanacker, V.; Molina, A.; Lambin, E.F. Impacts of forest cover change on ecosystem services in high Andean mountains. Ecol. Indic. 2015, 48, 63–75. [Google Scholar] [CrossRef]
  62. Liu, L.; Wang, Z.; Wang, Y.; Zhang, Y.; Shen, J.; Qin, D.; Li, S. Trade-off analyses of multiple mountain ecosystem services along elevation, vegetation cover and precipitation gradients: A case study in the Taihang Mountains. Ecol. Indic. 2019, 103, 94–104. [Google Scholar] [CrossRef]
  63. Guo, Q.; Yu, C.; Xu, Z.; Yang, Y.; Wang, X. Impacts of climate and land-use changes on water yields: Similarities and differences among typical watersheds distributed throughout China. J. Hydrol. Reg. Stud. 2023, 45, 101294. [Google Scholar] [CrossRef]
  64. Aghsaei, H.; Mobarghaee Dinan, N.; Moridi, A.; Asadolahi, Z.; Delavar, M.; Fohrer, N.; Wagner, P.D. Effects of dynamic land use/land cover change on water resources and sediment yield in the Anzali wetland catchment, Gilan, Iran. Sci. Total Environ. 2020, 712, 136449. [Google Scholar] [CrossRef]
  65. Sun, P.; Liu, S.; Jiang, H.; Lü, Y.; Liu, J.; Lin, Y.; Liu, X. Hydrologic Effects of NDVI Time Series in a Context of Climatic Variability in an Upstream Catchment of the Minjiang River1. JAWRA J. Am. Water Resour. Assoc. 2008, 44, 1132–1143. [Google Scholar] [CrossRef]
  66. Liu, M.; Min, L.; Zhao, J.; Shen, Y.; Pei, H.; Zhang, H.; Li, Y. The Impact of Land Use Change on Water-Related Ecosystem Services in the Bashang Area of Hebei Province, China. Sustainability 2021, 13, 716. [Google Scholar] [CrossRef]
  67. Abatzoglou, J.T.; Dobrowski, S.Z.; Parks, S.A.; Hegewisch, K.C. TerraClimate, a high-resolution global dataset of monthly climate and climatic water balance from 1958–2015. Sci. Data 2018, 5, 170191. [Google Scholar] [CrossRef]
  68. Dumont, M.; Saadi, M.; Oudin, L.; Lachassagne, P.; Nugraha, B.; Fadillah, A.; Bonjour, J.L.; Muhammad, A.; Hendarmawan; Dörfliger, N.; et al. Assessing rainfall global products reliability for water resource management in a tropical volcanic mountainous catchment. J. Hydrol. Reg. Stud. 2022, 40, 101037. [Google Scholar] [CrossRef]
  69. Hu, Z.; Hu, Q.; Zhang, C.; Chen, X.; Li, Q. Evaluation of reanalysis, spatially interpolated and satellite remotely sensed precipitation data sets in central Asia. J. Geophys. Res. Atmos. 2016, 121, 5648–5663. [Google Scholar] [CrossRef]
  70. Hua, T.; Zhao, W.; Liu, Y.; Wang, S.; Yang, S. Spatial Consistency Assessments for Global Land-Cover Datasets: A Comparison among GLC2000, CCI LC, MCD12, GLOBCOVER and GLCNMO. Remote Sens. 2018, 10, 1846. [Google Scholar] [CrossRef]
  71. Wang, L.; Jin, J. Uncertainty Analysis of Multisource Land Cover Products in China. Sustainability 2021, 13, 8857. [Google Scholar] [CrossRef]
  72. He, Y.; Xiong, Q.; Yu, L.; Yan, W.; Qu, X. Impact of Climate Change on Potential Distribution Patterns of Alpine Vegetation in the Hengduan Mountains Region, China. Mt. Res. Dev. 2020, 40, R48–R54. [Google Scholar] [CrossRef]
  73. Dong, W.; Wang, G.; Guo, L.; Sun, J.; Sun, X. Evaluation of Three Gridded Precipitation Products in Characterizing Extreme Precipitation over the Hengduan Mountains Region in China. Remote Sens. 2022, 14, 4408. [Google Scholar] [CrossRef]
  74. Yu, H.; Wang, L.; Yang, R.; Yang, M.; Gao, R. Temporal and Spatial Distribution of Maximum Daily Precipitation in Hengduan Mountainous Region of China and Its Probability Characteristics. J. Hydrol. Eng. 2020, 25, 05020039. [Google Scholar] [CrossRef]
  75. Ning, B.; Yang, X.; Chang, L. Changes of temperature and precipitation extremes in Hengduan Mountains, Qinghai-Tibet Plateau in 1961–2008. Chin. Geogr. Sci. 2012, 22, 422–436. [Google Scholar] [CrossRef]
Figure 1. Geographical location and elevation of the HDMR.
Remotesensing 15 04087 g001
Figure 2. The HDMR water yield from 2001 to 2020.
Remotesensing 15 04087 g002
Figure 3. Temporal variation in the annual average water yield of the HDMR.
Remotesensing 15 04087 g003
Figure 4. Results of the MK test and SENS trend analysis.
Remotesensing 15 04087 g004
Figure 5. (AD) Represents the 20-year average PR, PET, AET, and LST; (EH) shows their Poisson correlation coefficients with WY (p < 0.05).
Remotesensing 15 04087 g005
Figure 6. Annual average PR, PET, AET, and LST.
Remotesensing 15 04087 g006
Figure 7. (a) Shows the average WY change of each LULC from 2001 to 2020; and (b) shows the percentage of LULC at different elevation gradients and WY.
Remotesensing 15 04087 g007
Figure 8. The distribution of LULC in the HDMR in 2020.
Remotesensing 15 04087 g008
Figure 9. Water yield verification.
Remotesensing 15 04087 g009
Figure 10. Spatial distribution of the NDVI (20-year average).
Remotesensing 15 04087 g010
Figure 11. The relationships between the NDVI and WY at different elevation gradients: (ad) are less than 1000 m, between 1000 m and 3500 m, between 3500 m and 5000 m, and more than 5000 m.
Remotesensing 15 04087 g011
Figure 12. Path analysis diagram. Solid lines indicate significant impacts, dashed lines indicate non-significant impacts, numbers indicate path coefficients; *, **, and *** represent p-values less than 0.05, 0.01, and 0.001, respectively.
Remotesensing 15 04087 g012
Table 1. Data Description.
Data TypesResolutionPeriodData SourcesBrief Introduction
Land use/land cover (LULC)500 m2001–2020MODIS MCD12Q1, Terrestrial Process Distributed Activity Archiving Center (LP DAAC) (https://lpdaac.usgs.gov/, accessed on 9 February 2023)The data was reclassified into six categories based on Table 2.
Digital elevation model (DEM)500 m-Resources and Environmental Sciences and Data Center, Chinese Academy of Sciences (https://www.resdc.cn/, accessed on 9 February 2023)Radar topographic mapping SRTM derived from the U.S. Space Shuttle Endeavour.
Precipitation (PR)1/24°2001–2020Monthly climate and climate–water balance datasets on the global land surface, TerraClimate (https://www.nature.com/, accessed on 9 February 2023)Monthly values were synthesized into annual precipitation data for further analysis
Reference evapotranspiration (ET0)1/24°2001–2020Monthly climate and climate–water balance datasets on the global land surface, TerraClimate (https://www.nature.com/, accessed on 9 February 2023)Monthly values were synthesized into annual reference evapotranspiration data for further analysis
Land surface temperature (LST)1000 m2001–2020MODIS MOD11A2, Terrestrial Process Distributed Activity Archiving Center (LP DAAC) (https://lpdaac.usgs.gov/, accessed on 9 February 2023)
Soil1000 m-Soil dataset of China at the Harmonized World Soil Database (HWSD) (v1.1) (2009) (http://poles.tpdc.ac.cn/, accessed on 9 February 2023)Involves maximum soil root depth (mm), clay content (%), powder content (%), sand content (%), organic matter content (%), etc.
NDVI500 m2001–2020MODIS MOD13A1, Terrestrial Process Distributed Activity Archiving Center (LP DAAC) (https://lpdaac.usgs.gov/, accessed on 9 February 2023)The maximum value of annual. NDVI was obtained using the maximum value synthesis method (MVC) after removing outliers.
Watershed(Vector data)-Sciences and Data Center, Chinese Academy of Sciences (https://www.resdc.cn/, accessed on 9 February 2023)Includes all river networks in the country and all sub-basins with an area greater than 100 km2
Actual total water yield--Water Resources BulletinFor verification of water yield
Table 2. Table of LULC coefficients.
Primary ClassificationSecondary ClassificationLulc_vegRoot_depthKc
forestEvergreen Needleleaf Forests150000.9
Evergreen Broadleaf Forests:
Closed Shrublands
Open Shrublands
Mixed Forests
Deciduous Needleleaf Forests
Deciduous Broadleaf Forests
grass landWoody Savannas16000.65
Savannas
Grasslands
farm landCroplands15000.65
Cropland/Natural Vegetation Mosaics
waterbodyPermanent Wetlands011
Permanent Snow and Ice
Water Bodies
construction landUrban and Built-up Lands010.3
unused landBarren010.25
Table 3. Area and percentage of MK value.
MK ValueArea (km2)Percentage (%)
Z < −2.561851.9721310.37
−2.56 < Z < −1.9633,856.096.83
−1.96 < Z < −1.6527,356.325.52
−1.65 < Z < 1.65394,143.0479.61
1.65 < Z < 1.9625,559.085.16
1.96 < Z < 2.5611,525.342.32
Z > 2.56783.720.15
Table 4. Percentage of LULC by year 2001–2020 (Unit: %).
ForestGrass LandFarm LandWaterConstruction LandUnused Land
2001 16.33 76.46 2.22 0.52 0.13 4.35
2002 16.29 76.60 2.26 0.45 0.13 4.27
2003 16.26 76.65 2.29 0.41 0.13 4.26
2004 16.36 76.61 2.27 0.41 0.13 4.23
2005 16.47 76.63 2.23 0.42 0.13 4.12
2006 16.55 76.68 2.20 0.39 0.13 4.05
2007 16.69 76.62 2.18 0.38 0.13 4.01
2008 16.69 76.63 2.19 0.38 0.13 3.99
2009 16.65 76.75 2.18 0.36 0.13 3.94
2010 16.53 76.88 2.16 0.37 0.13 3.92
2011 16.57 76.95 2.10 0.39 0.13 3.86
2012 16.50 77.09 2.07 0.39 0.13 3.83
2013 16.67 77.01 2.01 0.40 0.13 3.79
2014 16.74 76.95 1.96 0.40 0.13 3.82
2015 16.92 76.85 1.91 0.39 0.13 3.81
2016 17.12 76.67 1.89 0.40 0.13 3.80
2017 17.45 76.30 1.83 0.40 0.13 3.89
2018 17.42 76.04 1.77 0.46 0.13 4.18
2019 17.51 76.15 1.69 0.50 0.13 4.02
2020 17.92 76.00 1.62 0.49 0.14 3.83
Table 5. Path coefficients of factors on water yield; *, **, and *** represent p-values less than 0.05, 0.01, and 0.001, respectively.
LSTPRUnused LandGrasslandForestNDVIAET
Direct path coefficient −0.097 0.810 *** −0.032 −0.113 ** −0.068 * 0.131 * −0.719 ***
Indirect path coefficient −0.563 * −0.237 0.122 0.024 −0.225 * 0.150 -
Total path coefficient −0.660 *** 0.573 *** 0.090 −0.090 −0.293 * 0.280 −0.719 ***
Disclaimer/Publisher’s Note: The statements, opinions and data contained in all publications are solely those of the individual author(s) and contributor(s) and not of MDPI and/or the editor(s). MDPI and/or the editor(s) disclaim responsibility for any injury to people or property resulting from any ideas, methods, instructions or products referred to in the content.

