Article

Remote Sensing Estimates of Particulate Organic Carbon Sources in the Zhanjiang Bay Using Sentinel-2 Data and Carbon Isotopes

1
College of Ocean and Meteorology, Guangdong Ocean University, Zhanjiang 524088, China
2
College of Electronic and Information Engineering, Guangdong Ocean University, Zhanjiang 524088, China
3
College of Chemistry and Environmental Science, Guangdong Ocean University, Zhanjiang 524088, China
4
Key Laboratory of Climate, Resources and Environment in Continental Shelf Sea and Deep Sea of Department of Education of Guangdong Province, Guangdong Ocean University, Zhanjiang 524088, China
*
Author to whom correspondence should be addressed.
Remote Sens. 2023, 15(15), 3768; https://doi.org/10.3390/rs15153768
Submission received: 15 May 2023 / Revised: 22 July 2023 / Accepted: 24 July 2023 / Published: 28 July 2023

Abstract

:
The source information of coastal particulate organic carbon (POC) with high spatial and temporal resolution is of great significance for the study of marine carbon cycles and marine biogeochemical processes. Over the past decade, satellite ocean color remote sensing has greatly improved our understanding of the spatiotemporal dynamics of ocean particulate organic carbon concentrations. However, due to the complexity of coastal POC sources, remote sensing methods for coastal POC sources have not yet been established. With an attempt to fill the gap, this study developed an algorithm for retrieving coastal POC sources using remote sensing and geochemical isotope technology. The isotope end-member mixing model was used to calculate the proportion of POC sources, and the response relationship between POC source information and in situ remote sensing reflectance (Rrs) was established to develop a retrieval algorithm for POC sources with the following four bands: (Rrs(443)/Rrs(492)) × (Rrs(704)/Rrs(665)). The results showed that the four-band algorithm performed well with R2, mean absolute percentage error (MAPE) and root mean square error (RMSE) values of 0.78, 33.57% and 13.74%, respectively. Validation against in situ data showed that the four-band algorithm derived calculated the proportion of marine POC accurately, with an MAPE and RMSE of 27.49% and 13.58%, respectively. The accuracy of the algorithm was verified based on the Sentinel-2 data, with an MAPE and RMSE of 28.02% and 15.72%, respectively. Additionally, we found that the proportion of marine POC sources was higher outside the Zhanjiang Bay than inside it using in situ survey data, which was consistent with the retrieved results. Influencing factors of POC sources may be due to the occurrence of phytoplankton blooms outside the bay and the impact of terrestrial inputs inside the bay. Remote sensing in combination with carbon isotopes provides important technical assistance in comprehending the biogeochemical process of POC and uncovering spatiotemporal variations in POC sources and their underlying causes.

1. Introduction

Particulate organic carbon (POC), a participant of several biogeochemical processes, impacts both the organic and inorganic carbon (C) cycles in natural waters [1,2,3,4]. Coastal regions play a significant role in the global C cycle owing to the presence of substantial amounts of both terrestrial and marine organic matter [5,6]. The POC in coastal ecosystems, such as bays, primarily arises from the activity of marine and terrestrial organisms, as well as those of humans that produce sewage and industrial wastewater [6,7,8,9].
Marine POC is closely related to the primary production of phytoplankton. Dissolved carbon dioxide (CO2) is the main carbon source for phytoplankton through photosynthesis, and dissolved inorganic carbon is converted into particulate organic carbon under the action of this carbon fixation mechanism [10,11]. Part of the marine POC is utilized step by step under the action of the food chain. The other part will be exported to the seabed and may be transformed into dissolved organic carbon (DOC) through microbial degradation and mineralization during migration, or inorganic components will re-enter the carbon cycle system [12,13]. In addition, terrestrial POC imported into the ocean is mainly composed of biochemically recalcitrant lignocellulose, which is highly resistant to enzymatic breakdown by eaters [14]. This relatively inert organic carbon is preferentially buried in sediments when it is imported into the ocean. However, due to the priming effect of active organic carbon and the influence of sediment resuspension, buried terrigenous organic carbon will still be decomposed [15]. It can be seen that POC from different sources play very different roles in the ocean carbon cycle. Therefore, exploring coastal POC sources is of great significance for understanding the marine carbon cycle and marine biogeochemical processes.
As far as the current research is concerned, the commonly used methods to explore the source of POC mainly include the C/N ratio method, the molecular biomarker method, the radioisotope method and the stable isotope method [16]. The processing procedures for both the radioisotope method and the molecular biomarker method are complex, and the testing cost is high. As a result, their range of application is relatively limited. The C/N ratio method may be insufficient in determining the sources of particulate organic matter, and it may not always be a dependable and efficient technique [17]. The stable isotope method has the advantages of having a relatively simple pretreatment and relatively inexpensive testing, and it is widely used because of its high precision in identifying carbon sources [5,6,16,17]. Carbon stable isotope analysis is a powerful method for tracing the sources of POC and their biogeochemical processes in aquatic ecosystems [5,6]. As each environment exhibits a distinctive, source-specific signature, C stable isotopes (δ13C) have been used to track the sources of POC in estuaries, along coasts and in open ocean systems [5,6,17,18]. Owing to differences in their photosynthetic pathways, terrestrial C3 and C4 plants have significantly different δ13C values, ranging from −30‰ to −23‰ and −14‰ to −10‰, respectively [19]. Consequently, several studies have used δ13C values to distinguish between terrestrial C4 and C3 plants [20,21]. In general, marine autochthonous organic matter is more enriched in 13C and exhibits higher δ13C, as compared to terrestrial organic matter [22]. Local and off-site sources of POC can be discerned by the magnitude of δ13C values. Xu et al. [16] and Zhao et al. [23] were able to estimate the percentage of terrestrial and endogenous organic C in Lake Taihu in a reliable manner using the δ13C end-member mixing model. The ratios and concentrations of marine and terrestrial POC can also be precisely measured using the δ13C end-member mixing model. However, it is challenging to characterize the spatiotemporal dynamics of POC sources using traditional surveys, as they are labor-intensive and have incomplete information coverage. Therefore, methods to identify the source of POC more efficiently and comprehensively are worth exploring.
Large-area synchronous remote sensing observations provide crucial support for POC monitoring. Significant progress towards the determination of POC using remote sensing methodologies in the past decade has enhanced our understanding of the spatiotemporal dynamics of POC in the oceans [4,24,25,26]. Stramski et al. [24] developed the POC power exponential relationship retrieval model for case-I waters, based on an empirical model of the blue–green band ratio. The model was successfully applied to the global ocean color satellite remote sensing images and became the standard algorithm of NASA’s POC products. However, the components and optical characteristics of case-II waters are complex and variable, with variable POC sources. Consequently, the standard POC products offered by NASA are heavily misestimated for coastal waters, and coastal areas often have data missing problems [27]. Several studies have attempted satellite-based remote sensing POC retrieval in coastal waters based on the correlation between POC and Rrs, particle backscattering coefficient (bbp), chlorophyll-a (Chl-a) concentration, total suspended matter (TSM) concentration, particle attenuation coefficient (cp) and diffuse attenuation coefficient (Kd) [28,29,30,31,32]. Although these developments have improved our understanding of POC dynamics, determining the sources and composition of POC remains unresolved. Two recent studies that combined C isotope and remote sensing technology to develop a POC end-member ratio model have successfully identified POC sources in inland lakes [16,23].
However, marine environments are substantially different from inland lakes. Firstly, the concentrations of chlorophyll-a and POC in inland lakes are generally higher than those in oceans [16,23,33], which causes differences in the bio-optical properties between marine waters and inland lake waters. Secondly, the δ13CPOC values of end-member in inland lakes are significantly different from those in oceans [16,23,34,35], indicating that the sources of POC in oceans and inland lakes are different. Thirdly, in inland lakes, the remote sensing reflectance of POC from different sources varies in the red bands, and the POC source algorithm in inland lake is established based on this difference [16,23]. In marine waters, the variations of remote sensing reflectance of POC from different sources are unknown. The different sources of POC respond to remote sensing reflectance in the different sensitivity bands, so the POC source algorithm for inland lakes may fail when applied to oceans. Whether the POC source algorithm developed in inland water is applicable to the ocean remains to be further studied. To date, the POC sources in the ocean have not yet been identified by existing remote sensing methods. Therefore, this study draws on the POC source algorithm developed by other researchers in inland lakes using isotope and remote sensing technology and tries to develop a POC source algorithm suitable for oceans (taking Zhanjiang Bay and its adjacent waters as an example). Furthermore, Sentinel-2 data offer fine spatiotemporal details, with a wide range of remote sensing applications. Whether the POC end-member ratio model is applicable to Sentinel-2 data is also yet to be explored.
To sum up, the traditional isotope source tracing methods are difficult to study large spatial scales and long-term variation of POC sources. Remote sensing can make up for this defect. How to combine and complement remote sensing with traditional isotope source tracing methods is an urgent problem to be solved in this study. Exploring the response relationship between the sources of POC and the optical signal of water is key in establishing the remote sensing retrieval algorithm of POC sources. Sentinel-2 is one of the satellites with high spatiotemporal resolution, and it is worth exploring whether the POC source algorithm applies to this satellite. The innovation of this study lies in the use of remote sensing to trace the sources of POC in the marine ecosystem, which can not only make up for the high cost of traditional tracers and the incoherence of time and space information but also expand the application field of ocean color remote sensing.
Therefore, the objective of this study was to develop a remote sensing algorithm to estimate the percentage of POC end-members in coastal waters, as well as determine the spatiotemporal dynamics of POC sources in Zhanjiang Bay and its adjacent waters. In this approach, we use stable isotope and satellite remote sensing retrieval, based on Sentinel-2 data, for modelling and comparative analysis in a typical eutrophic bay in China.

2. Materials and Methods
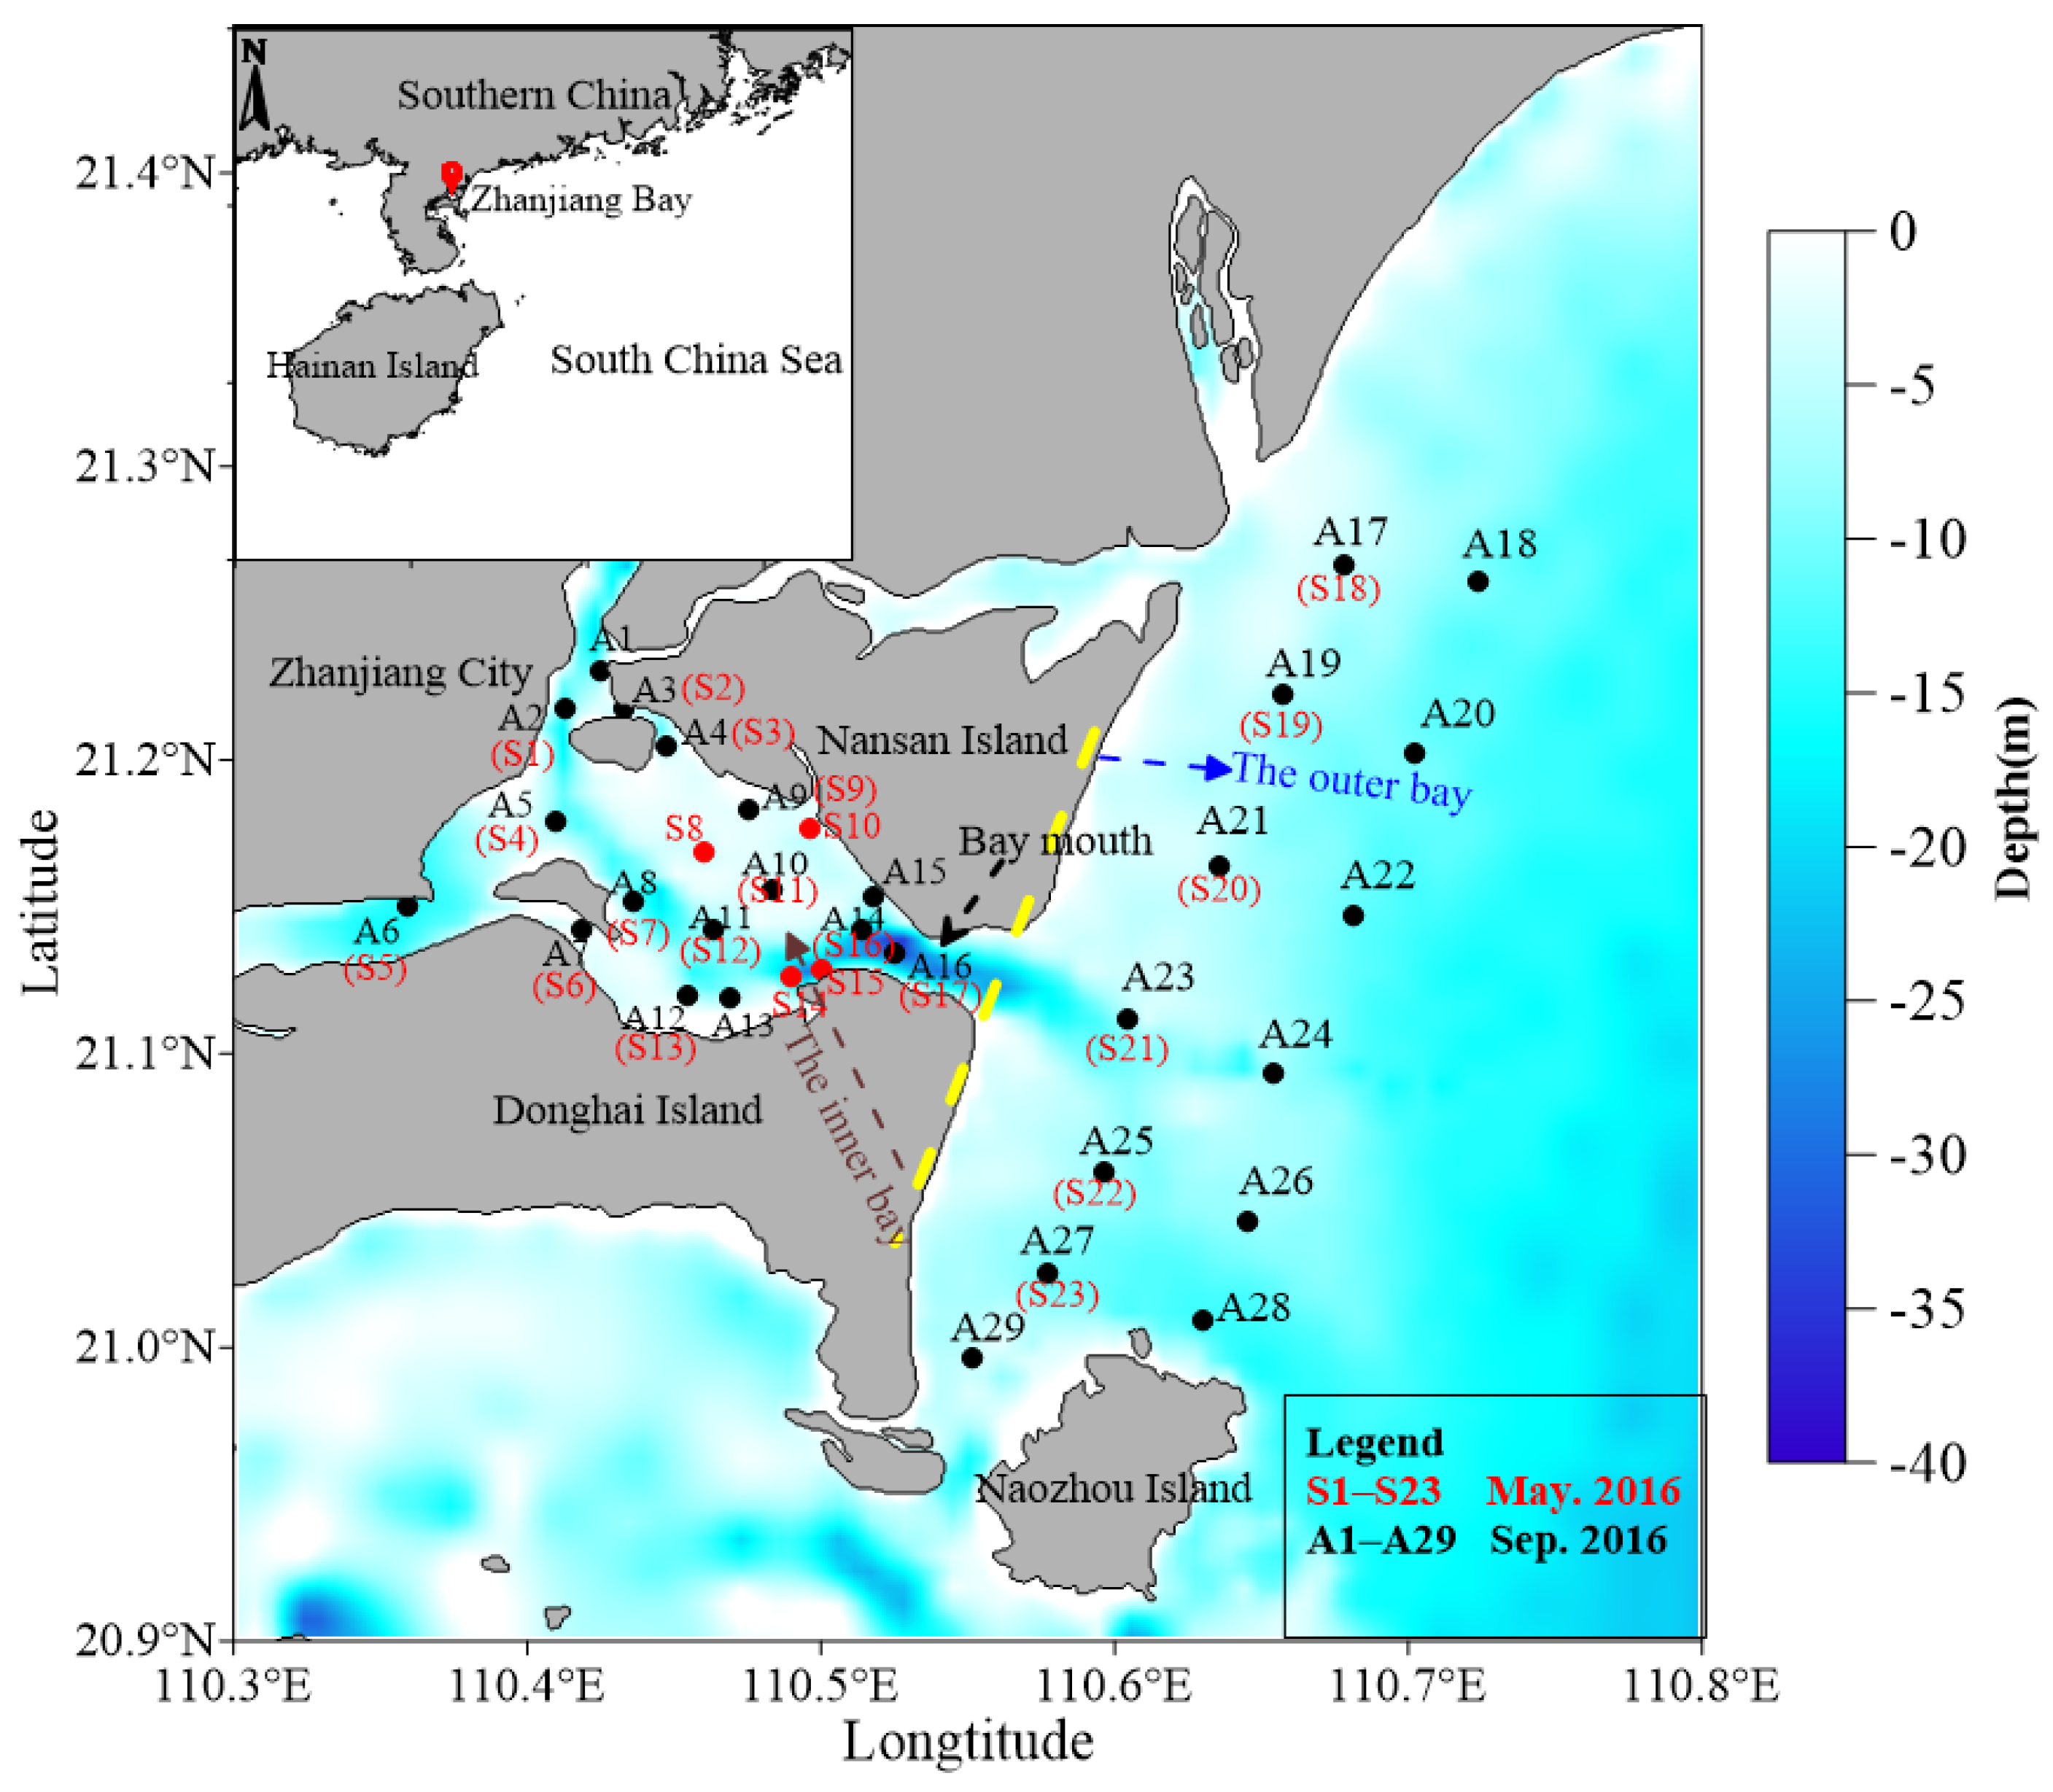
2.1. Study Area

Zhanjiang Bay is located at the southernmost point of the Chinese Mainland (Figure 1). Zhanjiang City (a prefecture-level city in the Guangdong Province of China), Donghai Island and Nansan Island surround Zhanjiang Bay. The Zhanjiang Bay is relatively shallow (Figure 1), except for the channel area, with the bay mouth being the deepest (approximately 40 m). Zhanjiang Bay has a typical subtropical marine monsoon climate, where the dry and wet seasons last from November to February and April to September, respectively [36,37], and the sea remains ice-free throughout the year. Consequently, Zhanjiang Bay is ideal for the growth and reproduction of organisms because of its warm and shallow waters. Zhanjiang Bay is a semi-enclosed and eutrophic bay. In recent years, due to economic growth in coastal areas, the bay ecosystem has been disturbed by human activities, such as industries, shipping and aquaculture, and has seen an alarming increase in its eutrophication levels [38]. Red tides, which rarely occurred before the 1980s, have been regular and frequent since the 1990s. The occurrence of red tides rose from six in 2000–2009 to nine in 2010–2019—a 50% increase in incidence rates between the two decades [39].

2.2. In Situ Sampling and Analysis of Chemical Parameters

Two surveys were conducted in Zhanjiang Bay during May and September 2016. Figure 1 illustrates the 23 and 29 sampling stations in May and September, respectively. Surface water samples were collected from each station (0.5 m below the surface) during each cruise with a 10 L plexiglass water sampler. Water profile measurements of temperature, salinity and depth were conducted during the two cruises using a rapid multi-parameter water quality instrument (RBRmaestro, RBR, Ltd., Ottawa, ON, Canada). Additionally, the spectral radiometric parameters (radiances from water, sky and reference panel) between 200 and 1100 nm at 1 nm intervals were measured above the water surface using a spectroradiometer (USB2000+, Ocean Optics, Inc., Orlando, FL, USA). Measurement methods of the spectroradiometer were in accordance with the above-surface measurement technique suggested by Mobley [40]. Remote sensing reflectance (Rrs(λ)) was calculated using upwelling spectral radiance Lu(λ), downwelling spectral irradiance Ed(λ), incident spectral sky radiance Ls(λ) and proportionality coefficient (r) (Equation (1)) [41,42]. Downwelling spectral irradiance (Ed(λ)) was calculated using radiance from grey reference panel Lp(λ), with known irradiance reflectance (ρp) (Equation (2)) [41,42].
R r s ( λ ) = L u ( λ ) r L s ( λ ) E d ( λ )
E d ( λ ) = L p ( λ ) π ρ p
Water samples were brought back to the laboratory and chemical parameters were measured on the same day. The TSM, POC and Chl-a samples were filtered through 47 mm diameter glass fiber filter membranes (pre-combustion at 450 °C for 4 h, GF/F, Whatman). Chl-a in the GF/F filter was extracted using 90% acetone and analyzed using the fluorometric method [43,44,45]. Concentrations of TSM were calculated using the weight method [45]. After being removed and carbonated for more than 48 h in steam-containing condensed HCl, the filter membranes used for the POC concentration and δ13C analyses were washed three times with deionized water [46]. The filter membranes were acidified, freeze-dried and kept in a dehumidifier until analysis [46]. Using an elemental analysis isotope ratio mass spectrometer (EA Isolink-253 Plus, Thermo Fisher Scientific, Inc., Waltham, MA, USA), the sample filter membranes for the analysis were fully loaded in tin cans [46]. The mean standard deviations of δ13C and POC concentrations were ±0.2‰ and ±0.3%, respectively.

2.3. Calculation of POC Sources Based on δ13C

The isotope ratios were expressed in parts per million (‰) as follows:
δ 13 C POC   = ( R sample R std 1 ) × 1000
where Rsample is the sample isotopic ratio and Rstd is the standard isotopic ratio.
It is possible to determine the contributions of POC from various sources using the significantly different δ13CPOC values from different sources [5,6,46]. The ratio of marine and terrestrial POC can be calculated using the δ13C end-member mixing model, assuming that the end-member of δ13C is either marine or terrestrial [47]. In this study, terrestrial and marine end-member values of −23.3‰ and −16.5‰ were used, as measured at stations A1 and A18, respectively. The δ13C values measured at stations A1 and A18 are the minimum and maximum values in this study, respectively, and correspond to the conditions of being most affected by terrestrial sources and marine sources, respectively. The following mixing model was used to estimate the relative percentage of marine-derived organic C (fmar) in the waters of Zhanjiang Bay, based on the end-member values [16,23]:
f mar = δ 13 C POC δ 13 C ter δ 13 C mar δ 13 C ter
The following expression was used to calculate the relative percentage of terrestrial POC (fter):
f ter = 1 f mar
The concentrations of marine and terrestrial POC were calculated as follows:
Marine POC concentration (mg/L) = POC × fmar
Terrestrial POC concentration (mg/L) = POC × fter

2.4. Acquisition and Processing of Satellite Data

Sentinel-2 data (launched by the European Space Agency in 2015 and 2017) are widely used to monitor the water quality of optically complex coastal waters [41,42]. This satellite was chosen based on its high spatial (10–60 m) and temporal (five days of review) resolution and narrow bandwidth, which were ideal for monitoring Zhanjiang Bay. Data from the Sentinel-2 Level-1C (L1C) multi-spectral instrument (MSI) were downloaded from the Copernicus Open Access Hub (https://scihub.copernicus.eu/dhus/#/home, accessed on 10 May 2023). The L1C products provide top-of-atmosphere (TOA) reflectance. ACOLITE Python (v20190326.0) was used to perform atmospheric correction on the L1C image to obtain the surface reflectance image (L2R products). Further processing and analysis of L2R products were performed on the Environment for Visualizing Images (ENVI) version 5.6 software.

2.5. Algorithm Evaluation

The POC source algorithm was evaluated using mean absolute percentage error (MAPE) and root mean square error (RMSE) as follows:
MAPE = 1 n i = 1 n X i Y i X i × 100 %
RMSE = 1 n i = 1 n X i Y i 2
where Xi is the measured value; Yi is the estimated value; and n is the sample size.

2.6. Method Framework

In order to better illustrate the process of remote sensing retrieval method for POC sources, Figure 2 shows the overall research framework for estimating POC sources from Sentinel-2 data.

3. Results

3.1. δ¹³ CPOC and POC Sources

The δ¹³CPOC values and POC concentrations at each station in May and September are shown in Figure 3. The δ¹³CPOC values ranged from 22.5‰ to 16.6‰ and 23.3‰ to 16.5‰ in May and September, respectively, and the average value of δ13CPOC was 20.1‰ in both months. The POC concentrations ranged from 0.21 mg/L to 0.92 mg/L and from 0.21 mg/L to 0.75 mg/L in May and September, respectively, with average values of 0.35 mg/L in May and 0.39 mg/L in September. The δ¹³CPOC value outside the bay was considerably higher than that inside the bay, which is consistent with higher levels of marine sources. According to the results of the isotope end-member mixing model, the average value of fmar outside the bay was 0.76 and 0.75 in May and September, respectively, also indicating a high proportion of marine POC outside the bay. The average POC concentrations outside and inside the bay were 0.44 mg/L and 0.31 mg/L in May and 0.5 mg/L and 0.3 mg/L in September, respectively. The POC concentrations in both months were greater outside the bay than inside the bay, showing pronounced spatial heterogeneity. Additionally, Chl-a concentration can characterize phytoplankton biomass to some extent, which are the main contributors of marine POC. The concentration of marine POC was significantly positively correlated with that of Chl-a (R2 = 0.57, p < 0.01, N = 46) (Figure 4), indicating that the results of source identification were reliable.

3.2. Model Development, Calibration and Validation

The POC sources were classified as terrestrial or marine based on the isotope mixing model. 13CPOC can offer useful methodological support for the differentiation of POC sources. As described in Section 3.1, the marine POC concentration showed a strong correlation with Chl-a, which is an important component of ocean color remote sensing. This result indicated that remote sensing retrieval models of POC sources can be developed by combining isotopic and remote sensing data.
Among the 52 samples, 35 samples were randomly chosen for modelling, and the remaining 17 samples were used to validate the model. The POC source algorithm relied on an empirical relationship between in situ Rrs value and the proportion of marine POC. Retrieval algorithms using band ratios are less sensitive to atmospheric correction than those using single bands [48]. Therefore, this study used the algorithm with band ratios to retrieve POC sources. To determine the optimal band ratio for POC sources, correlation analysis of different band ratios (settings of the central band of Sentinel-2) with the proportion of marine POC was performed (Figure 5). The four band ratios of Rrs(704)/Rrs(665), Rrs(665)/Rrs(704), Rrs(492)/Rrs(443) and Rrs(443)/Rrs(492) showed high correlations with fmar, with coefficient of correlation (R) values of 0.844, 0.841, 0.76 and 0.755, respectively.
These four band ratios were recombined and correlated with fmar to improve the accuracy of the model. The results are shown in Table 1. fmar with (Rrs(443)/Rrs(492))/(Rrs(665)/Rrs(704)) yielded the highest R value of 0.884. Therefore, this band recombination was chosen for the development of the retrieval model for POC sources. As shown in Figure 6, the coefficient of determination (R2) value of the fitted retrieval model was 0.78. The sum of marine and terrestrial sources was unity, which indicated that the R2 value of the model was the same for marine and terrestrial sources.
The remaining 17 samples were used to validate the model. The results indicated that the MAPE of the estimated and measured values of the marine POC ratio was 27.49% and the RMSE was 13.58% (Figure 7a). Additionally, we obtained 17 ground-matched points that were less affected by clouds and solar flares. The MAPE of the satellite-derived and measured values of the marine POC ratio was 28.02% and the RMSE was 15.72% (Figure 7b), also indicating that the source identification methods were reliable.

3.3. Model Application Example for Sentinel-2 Image

During the cruise, we acquired a high quality and quasi-synchronous Sentinel-2 satellite image (30 September 2016). The marine POC source model (y = 1.8549*x − 0.8781, R2 = 0.78, p < 0.001) developed in Section 3.2 was applied to this image to retrieve the proportion of marine POC in the study area, as shown in Figure 8. The proportion of marine POC was significantly higher outside Zhanjiang Bay than inside it, which was also consistent with the actual survey data. As shown in Figure 7b, the in situ ratio of marine POC was in agreement with its satellite-derived ratio. The results showed that using the model and Sentinel-2 image to retrieve the POC sources in Zhanjiang Bay achieved higher accuracy.

4. Discussion

4.1. Factors Influencing the Source of POC Inside and Outside Zhanjiang Bay

The sources of POC in the bay were derived from terrestrial inputs (such as terrestrial plants, soils, rivers, human activities, etc.) and in situ phytoplankton production [7,9,49]. The isotopic composition of POC varies depending on the source [50]. In this study, the δ13CPOC values showed an increasing trend from the inner to the outer regions of the bay in both months (Figure 3), indicating a decreasing contribution of terrestrial organic matter and an increasingly dominant role of in situ phytoplankton production. The highest values of δ13CPOC were recorded at S18 in May (−16.6‰) and A18 in September (−16.5‰), which also exhibited considerably higher POC concentration (0.92 mg L1 and 0.62 mg L1, respectively). The Chl-a concentration at station A18 was as high as 21.4 μg L1 in September. We were unable to obtain the Chl-a concentration outside the bay in May due to operation errors. However, the concentration of Chl-a can be inferred from the significant positive correlation between the marine POC concentration and Chl-a concentration in May (R2 = 0.7, p < 0.01, N = 17) (Figure 9). The marine POC concentration at station S18 was 0.908 mg L1, and the corresponding estimate of Chl-a concentration based on the best-fit (Figure 9) was 32.67 μg L1. High Chl-a concentrations at stations S18 and A18 indicated that phytoplankton blooms were responsible for the high POC concentrations and δ13CPOC outside the bay. The growth rate of phytoplankton accelerated during phytoplankton blooms, increasing the POC content. Phytoplankton preferentially assimilated 12CO2 during photosynthesis, and the dissolved inorganic carbon (DIC) pool was enriched with 13C [51]. High phytoplankton biomass is often associated with eutrophication, which can significantly reduce the amount of 12CO2 required for phytoplankton growth, resulting in increased HCO3 uptake by phytoplankton and a heavier δ13C component [5,51,52]. The phytoplankton blooms observed outside Zhanjiang Bay were consistent with those that were observed to lead to δ13CPOC enrichment in some previous studies. Similar observations were made in Daya Bay [51], Delaware Estuary [34] and Pearl River Estuary and its adjacent shelf [18]. Petrochemical industrial zones, steel plants and land runoffs in Zhanjiang Bay convey a large amount of fresh water, domestic sewage and industrial wastewater to the bay. The average salinities in May and September were 22.8 PSU and 24.9 PSU inside the bay and 25.2 PSU and 26.4 PSU outside the bay, respectively. The overall salinity was lower inside the bay than outside the bay regardless of the month, indicating that terrestrial factors influenced the water inside the bay more than that outside the bay. The lowest values of δ13CPOC occurred at S1 (−22.5‰) and A1 (−23.3‰) in May and September, respectively. According to the isotopic values of potential sources of particulate organic matter obtained from Zhou et al. [45], the characteristic δ13CPOC values of S1 and A1 fell within the range of δ13CPOC of soil organic matter, terrestrial organic matter or sewage, suggesting that the δ13CPOC values of the two stations were heavily influenced by terrestrial input sources. This also verified that the terrestrial (A1) and marine (A18) source end-members selected in the isotope mixing model were reasonable.

4.2. Evaluation of the POC Source Algorithm

The Chl-a/TSM ratios from earlier studies indicate that the relative amounts of Chl-a and TSM can be used to determine which water component dominates the water optics [53]. In general, high Chl-a and low TSM values are characteristic of marine POC sources, while low Chl-a and high TSM values characterize terrestrial POC sources [54]. Different types of water bodies exhibit significant differences in Rrs characteristics, primarily in the visible and near-infrared ranges. Both Rrs(704)/Rrs(665) and Rrs(443)/Rrs(492) showed significantly positive correlations with the Chl-a/TSM ratio (R = 0.68, p < 0.01, N = 46; R = 0.64, p < 0.01, N = 46, respectively). Differences in particle composition also affected Rrs(704)/Rrs(665) and Rrs(443)/Rrs(492) of the water column. This synergistic variation also indicated that (Rrs(443)/Rrs(492))*(Rrs(704)/Rrs(665)) was highly sensitive to the different sources of POC and that band recombination was a reliable proxy for the retrieval of POC sources using remote sensing.
The POC source algorithms developed by Xu et al. [16] and Zhao et al. [23] were selected for comparison with the algorithm proposed in this study. The two algorithms were evaluated using 52 in situ measurements of Rrs and marine POC ratio, and the validation results are presented in Table 2. Given the R2, MAPE and RMSE values, the accuracies of the algorithm of POC source color index (Spoc) developed by Xu et al. [16] and the three-band algorithm developed by Zhao et al. [23] were lower than that of the four-band algorithm established in this study. The poor performance of both these algorithms in the case of Zhanjiang Bay may be because they were developed for inland water, whose optical properties differ from those of the coastal water, and their POC sources were not the same. Additionally, the Rrs values of the terrestrial and marine end-members of POC in Zhanjiang Bay showed a considerable difference in the blue band (Figure 10), unlike those of inland water end-members of different POC sources. The Rrs values of different inland water bodies showed a large difference in the red band [16]. Therefore, the addition of the blue band enabled us to distinguish between POC sources and improved the accuracy of our POC source algorithm. The importance of Rrs(704)/Rrs(665) for estimating Chl-a in optically complex case-II waters is well known [55,56]. Rrs(704)/Rrs(665) was the most important predictor in the estimation of Chl-a, with Rrs(665) corresponding to the maximum absorption of Chl-a in the red spectral region and with Rrs(704) being associated with the combined minimum absorption of phytoplankton pigments and water [57,58]. As shown in Figure 4, phytoplankton in Zhanjiang Bay was the main contributor to marine POC; thus, Rrs(704)/Rrs(665) used in our algorithm also effectively responded to the different sources of POC.

4.3. Biogeochemical Implications of the POC Source Algorithm

This study demonstrated the potential use of Sentinel-2 data in estimating the proportion of POC end-members in coastal case-II waters. The empirical model was developed using remote sensing reflectance in the four bands and validated against the in situ measured data. Quasi-synchronous (1–2 weeks) Sentinel-2 data were used for the model calibration and validation to ensure the accuracy of the model. The use of remote sensing data to identify POC source was more convenient, spatiotemporally continuous and efficient than methods only using isotopes or C/N ratios [22]. Remote sensing can be used to recognize the source characteristics of POC with high resolution, which is very conducive to the study of long-term series changes in marine biogeochemical processes. The tracing of POC source based on remote sensing can provide relevant support for the study of the migration and transformation of marine carbon reservoirs, the spatiotemporal distribution pattern and driving factors of particulate organic carbon components. The four-band algorithm is a new strategy that can provide a basis for the dynamic monitoring of POC sources in coastal case-II waters, the accurate estimation of POC concentrations from different sources, and the monitoring of marine environment.
However, the method proposed in this study had some limitations and uncertainties. At first, the number of data used for calibration and validation of the model established was only 52 and spanned only two seasons; therefore, the model may not be adequately representative, and its applicability to other regions or seasons needs further investigation. Additionally, the difference in time between the in situ sampling and satellite overpass, the quality of satellite images and the uncertainty of atmospheric correction performance can also introduce some errors in the estimation of POC end-member ratios.

5. Conclusions

Based on the in situ measured values of δ13CPOC and Rrs, a four-band algorithm was developed to detect POC sources in Zhanjiang Bay and its adjacent waters. Not only did the algorithm improve the ability to monitor the spatiotemporal dynamics of POC sources in the bay, but it also provided a new strategy of detecting POC sources based on remote sensing data. The main conclusions of this study are as follows:
(1)
The outer regions of Zhanjiang Bay were characterized by high δ13CPOC values and high chlorophyll-a concentrations, indicating the occurrence of phytoplankton blooms. In contrast, the inner bay was characterized by low δ13CPOC and low salinity values, reflecting the influence of organic matter input from terrestrial sources;
(2)
A combination of stable isotope and remote sensing data can better estimate POC sources in eutrophic bays; the four-band algorithm showed good performance and was suitable for analyzing Sentinel-2 data;
(3)
The algorithm stability may be insufficient due to the limited scope of the datasets. More coastal water datasets are required to further enhance the robustness of the algorithm and to improve and validate our approach.
On the whole, remote sensing in combination with carbon isotopes provides a new insight for deep understanding of the biogeochemistry process of POC. When applying the four-band algorithm outlined in this article to other sea areas, it is recommended to regionalize the model parameters. This is because the applicability of the model may vary by region. In the future, we plan to enhance the robustness of the model by expanding the dataset. Additionally, we aim to apply the model to remote sensing images from different years and months in order to produce a long time series of remote sensing products.

Author Contributions

Conceptualization, F.C.; methodology, G.Y., C.C. and S.L.; software, G.Y. and Y.Z.; validation, Q.L. and G.Y.; writing—original draft preparation, G.Y.; writing—review and editing, F.C. and G.Y.; visualization, D.F.; project administration, F.C.; funding acquisition, F.C. All authors have read and agreed to the published version of the manuscript.

Funding

This study was supported by the National Natural Science Foundation of China (42276047, U1901213, 92158201) and Innovation and Entrepreneurship Project of Shantou (2021112176541391).

Data Availability Statement

Not applicable.

Conflicts of Interest

The authors declare no conflict of interest.

References

  1. Bauer, J.E.; Cai, W.J.; Raymond, P.A.; Bianchi, T.S.; Hopkinson, C.S.; Regnier, P.A. The changing carbon cycle of the coastal ocean. Nature 2013, 504, 61–70. [Google Scholar] [CrossRef] [PubMed]
  2. Regnier, P.; Friedlingstein, P.; Ciais, P.; Mackenzie, F.T.; Gruber, N.; Janssens, I.A.; Laruelle, G.G.; Lauerwald, R.; Luyssaert, S.; Andersson, A.J.; et al. Anthropogenic perturbation of the carbon fluxes from land to ocean. Nat. Geosci. 2013, 6, 597–607. [Google Scholar] [CrossRef] [Green Version]
  3. Bai, Y.; Cai, W.J.; He, X.; Zhai, W.; Pan, D.; Dai, M.; Yu, P. A mechanistic semi-analytical method for remotely sensing sea surface pCO2 in river-dominated coastal oceans: A case study from the East China Sea. J. Geophys. Res. Ocean. 2015, 120, 2331–2349. [Google Scholar] [CrossRef]
  4. Liu, D.; Bai, Y.; He, X.; Tao, B.; Pan, D.; Chen, C.T.A.; Zhang, L.; Xu, Y.; Gong, C. Satellite estimation of particulate organic carbon flux from Changjiang River to the estuary. Remote Sens. Environ. 2019, 223, 307–319. [Google Scholar] [CrossRef]
  5. Chen, F.; Lu, X.; Song, Z.; Huang, C.; Jin, G.; Chen, C.; Zhou, X.; Lao, Q.; Zhu, Q. Coastal currents regulate the distribution of the particulate organic matter in western Guangdong offshore waters as evidenced by carbon and nitrogen isotopes. Mar. Pollut. Bull. 2021, 172, 112856. [Google Scholar] [CrossRef]
  6. Lu, X.; Huang, C.; Chen, F.; Zhang, S.; Lao, Q.; Chen, C.; Wu, J.; Jin, G.; Zhu, Q. Carbon and nitrogen isotopic compositions of particulate organic matter in the upwelling zone off the east coast of Hainan Island, China. Mar. Pollut. Bull. 2021, 167, 112349. [Google Scholar] [CrossRef]
  7. Cole, J.J.; Prairie, Y.T.; Caraco, N.F.; McDowell, W.H.; Tranvik, L.J.; Striegl, R.G.; Duarte, C.M.; Kortelainen, P.; Downing, J.A.; Middelburg, J.J.; et al. Plumbing the global carbon cycle: Integrating inland waters into the terrestrial carbon budge. Ecosystems 2007, 10, 172–185. [Google Scholar] [CrossRef] [Green Version]
  8. Middelburg, J.J.; Herman, P.M.J. Organic matter processing in tidal estuaries. Mar. Chem. 2007, 106, 127–147. [Google Scholar] [CrossRef]
  9. Barros, G.V.; Martinelli, L.A.; Novais, T.M.O.; Ometto, J.P.H.; Zuppi, G.M. Stable isotopes of bulk organic matter to trace carbon and nitrogen dynamics in an estuarine ecosystem in Babitonga Bay (Santa Catarina, Brazil). Sci. Total Environ. 2010, 408, 2226–2232. [Google Scholar] [CrossRef]
  10. Liu, K.K.; Kao, S.J.; Wen, L.S.; Chen, K.L. Carbon and nitrogen isotopic compositions of particulate organic matter and biogeochemical processes in the eutrophic Danshuei Estuary in northern Taiwan. Sci. Total Environ. 2007, 382, 103–120. [Google Scholar] [CrossRef]
  11. Balch, W.M.; Bowler, B.C.; Drapeau, D.T.; Lubelczyk, L.C.; Lyczkowski, E. Vertical distributions of coccolithophores, PIC, POC, biogenic Silica, and chlorophyll a throughout the global ocean. Glob. Biogeochem. Cycles 2018, 32, 2–17. [Google Scholar] [CrossRef] [Green Version]
  12. Koch, B.P.; Kattner, G.; Witt, M.; Passow, U. Molecular insights into the microbial formation of marine dissolved organic matter: Recalcitrant or labile? Biogeosciences 2014, 11, 4173–4190. [Google Scholar] [CrossRef] [Green Version]
  13. Daesslé, L.W.; Orozco, A.; Struck, U.; Camacho-Ibar, V.F.; van Geldern, R.; Santamaría-del-Angel, E.; Barth, J.A.C. Sources and sinks of nutrients and organic carbon during the 2014 pulse flow of the Colorado River into Mexico. Ecol. Eng. 2017, 106, 799–808. [Google Scholar] [CrossRef]
  14. Hedges, J.I.; Keil, R.G.; Benner, R. What happens to terrestrial organic matter in the ocean? Org. Geochem. 1997, 27, 195–212. [Google Scholar] [CrossRef]
  15. Kuzyakov, Y. Priming effects: Interactions between living and dead organic matter. Soil Biol. Biochem. 2010, 42, 1363–1371. [Google Scholar] [CrossRef]
  16. Xu, J.; Lei, S.; Bi, S.; Li, Y.; Lyu, H.; Xu, J.; Xu, X.; Mu, M.; Miao, S.; Zeng, S.; et al. Tracking spatio-temporal dynamics of POC sources in eutrophic lakes by remote sensing. Water Res. 2020, 168, 115162. [Google Scholar] [CrossRef]
  17. Huang, C.; Lao, Q.; Chen, F.; Zhang, S.; Chen, C.; Bian, P.; Zhu, Q. Distribution and sources of particulate organic matter in the Northern South China Sea: Implications of human activity. J. Ocean Univ. China 2021, 20, 1136–1146. [Google Scholar] [CrossRef]
  18. Huang, C.; Chen, F.; Zhang, S.; Chen, C.; Meng, Y.; Zhu, Q.; Song, Z. Carbon and nitrogen isotopic composition of particulate organic matter in the Pearl River Estuary and the adjacent shelf. Estuar. Coast. Shelf Sci. 2020, 246, 107003. [Google Scholar] [CrossRef]
  19. Smith, B.N.; Epstein, S. Two categories of 13C/12C ratios for higher plants. Plant Physiol. 1971, 47, 380–384. [Google Scholar] [CrossRef] [Green Version]
  20. Meyers, P.A. Organic geochemical proxies of paleoceanographic, paleolimnologic, and paleoclimatic processes. Org. Geochem. 1997, 27, 213–250. [Google Scholar] [CrossRef]
  21. Taipale, S.J.; Vuorio, K.; Brett, M.T.; Peltomaa, E.; Hiltunen, M.; Kankaala, P. Lake zooplankton δ13C values are strongly correlated with the δ13C values of distinct phytoplankton taxa. Ecosphere 2016, 7, e01392. [Google Scholar] [CrossRef] [Green Version]
  22. Thornton, S.F.; McManus, J. Application of organic carbon and nitrogen stable isotope and C/N ratios as source indicators of organic matter provenance in estuarine systems: Evidence from the Tay Estuary, Scotland. Estuar. Coast. Shelf Sci. 1994, 38, 219–233. [Google Scholar] [CrossRef]
  23. Zhao, Z.; Huang, C.; Meng, L.; Lu, L.; Wu, Y.; Fan, R.; Li, S.; Sui, Z.; Huang, T.; Huang, C.; et al. Eutrophication and lakes dynamic conditions control the endogenous and terrestrial POC observed by remote sensing: Modeling and application. Ecol. Indic. 2021, 129, 107907. [Google Scholar] [CrossRef]
  24. Stramski, D.; Reynolds, R.A.; Babin, M.; Kaczmarek, S.; Lewis, M.R.; Röttgers, R.; Sciandra, A.; Stramska, M.; Twardowski, M.S.; Franz, B.A.; et al. Relationships between the surface concentration of particulate organic carbon and optical properties in the eastern South Pacific and eastern Atlantic Oceans. Biogeosciences 2008, 5, 171–201. [Google Scholar] [CrossRef] [Green Version]
  25. Cetinić, I.; Perry, M.J.; Briggs, N.T.; Kallin, E.; D’Asaro, E.A.; Lee, C.M. Particulate organic carbon and inherent optical properties during 2008 North Atlantic Bloom Experiment. J. Geophys. Res. Ocean. 2012, 117, C06028. [Google Scholar] [CrossRef]
  26. Boss, E.; Guidi, L.; Richardson, M.J.; Stemmann, L.; Gardner, W.; Bishop, J.K.; Anderson, R.F.; Sherrell, R.M. Optical techniques for remote and in-situ characterization of particles pertinent to GEOTRACES. Prog. Oceanogr. 2015, 133, 43–54. [Google Scholar] [CrossRef] [Green Version]
  27. Lu, S.; He, M.; He, S.; He, S.; Pan, Y.; Yin, W.; Li, P. An improved cloud masking method for GOCI data over turbid coastal waters. Remote Sens. 2021, 13, 2722. [Google Scholar] [CrossRef]
  28. Son, Y.B.; Gardner, W.D.; Mishonov, A.V.; Richardson, M.J. Multispectral remote-sensing algorithms for particulate organic carbon (POC): The Gulf of Mexico. Remote Sens. Environ. 2009, 113, 50–61. [Google Scholar] [CrossRef] [Green Version]
  29. Wang, G.; Zhou, W.; Cao, W.; Yin, J.; Yang, Y.; Sun, Z.; Zhang, Y.; Zhao, J. Variation of particulate organic carbon and its relationship with bio-optical properties during a phytoplankton bloom in the Pearl River estuary. Mar. Pollut. Bull. 2011, 62, 1939–1947. [Google Scholar] [CrossRef]
  30. Liu, D.; Pan, D.; Bai, Y.; He, X.; Wang, D.; Wei, J.A.; Zhang, L. Remote sensing observation of particulate organic carbon in the Pearl River Estuary. Remote Sens. 2015, 7, 8683–8704. [Google Scholar] [CrossRef] [Green Version]
  31. Stramski, D.; Reynolds, R.A.; Kahru, M.; Mitchell, B.G. Estimation of particulate organic carbon in the ocean from satellite remote sensing. Science 1999, 285, 239–242. [Google Scholar] [CrossRef] [PubMed]
  32. Mishonov, A.V.; Gardner, W.D.; Richardson, M.J. Remote sensing and surface POC concentration in the South Atlantic. Deep Sea Res. Part II 2003, 50, 2997–3015. [Google Scholar] [CrossRef]
  33. Jiang, G.; Loiselle, S.A.; Yang, D.; Gao, C.; Ma, R.; Su, W.; Duan, H. An absorption-specific approach to examining dynamics of particulate organic carbon from VIIRS observations in inland and coastal waters. Remote Sens. Environ. 2019, 224, 29–43. [Google Scholar] [CrossRef]
  34. Cifuentes, L.A.; Sharp, J.H.; Fogel, M.L. Stable carbon and nitrogen isotope biogeochemistry in the Delaware estuary. Limnol. Oceanogr. 1988, 33, 1102–1115. [Google Scholar] [CrossRef]
  35. Mu, X.; Chen, M.; Zhang, K.; Zeng, J.; Yang, W.; Zhang, R.; Zheng, M.; Qiu, Y. Stable carbon and nitrogen isotopes as tracers of sources of suspended particulate organic matter in the Daya Bay in summer. Haiyang Xuebao 2017, 39, 39–52. (In Chinese) [Google Scholar]
  36. Zhang, J.; Zhou, F.; Chen, C.; Sun, X.; Shi, Y.; Zhao, H.; Chen, F. Spatial distribution and correlation characteristics of heavy metals in the seawater, suspended particulate matter and sediments in Zhanjiang Bay, China. PLoS ONE 2018, 13, e0201414. [Google Scholar] [CrossRef] [Green Version]
  37. Chen, F.; Lao, Q.; Jia, G.; Chen, C.; Zhu, Q.; Zhou, X. Seasonal variations of nitrate dual isotopes in wet deposition in a tropical city in China. Atmos. Environ. 2019, 196, 1–9. [Google Scholar] [CrossRef]
  38. Li, J.; Cao, R.; Lao, Q.; Chen, F.; Chen, C.; Zhou, X.; Meng, Y.; Zhu, Q. Assessing seasonal nitrate contamination by nitrate dual isotopes in a monsoon-controlled bay with intensive human activities in South China. Int. J. Environ. Res. Public Health 2020, 17, 1921. [Google Scholar] [CrossRef] [Green Version]
  39. Zhang, P.; Xu, J.; Zhang, J.; Li, J.X.; Zhang, Y.C.; Li, Y.; Luo, X.Q. Spatiotemporal dissolved silicate variation, sources, and behavior in the eutrophic Zhanjiang Bay, China. Water 2020, 12, 3586. [Google Scholar] [CrossRef]
  40. Mobley, C.D. Estimation of the remote-sensing reflectance from above-surface measurements. Appl. Opt. 1999, 38, 7442–7455. [Google Scholar] [CrossRef]
  41. Xu, J.; Fang, C.; Gao, D.; Zhang, H.; Gao, C.; Xu, Z.; Wang, Y. Optical models for remote sensing of chromophoric dissolved organic matter (CDOM) absorption in Poyang Lake. ISPRS J. Photogramm. Remote Sens. 2018, 142, 124–136. [Google Scholar] [CrossRef]
  42. Shang, Y.; Liu, G.; Wen, Z.; Jacinthe, P.A.; Song, K.; Zhang, B.; Lyu, L.; Li, S.; Wang, X.; Yu, X. Remote estimates of CDOM using Sentinel-2 remote sensing data in reservoirs with different trophic states across China. J. Environ. Manag. 2021, 286, 112275. [Google Scholar] [CrossRef]
  43. Fu, D.; Zhong, Y.; Chen, F.; Yu, G.; Zhang, X. Analysis of dissolved oxygen and nutrients in Zhanjiang Bay and the adjacent sea area in spring. Sustainability 2020, 12, 889. [Google Scholar] [CrossRef] [Green Version]
  44. Lao, Q.; Liu, G.; Shen, Y.; Su, Q.; Lei, X. Biogeochemical processes and eutrophication status of nutrients in the northern Beibu Gulf, South China. J. Earth Syst. Sci. 2021, 130, 199. [Google Scholar] [CrossRef]
  45. Zhou, X.; Jin, G.; Li, J.; Song, Z.; Zhang, S.; Chen, C.; Huang, C.; Chen, F.; Zhu, Q.; Meng, Y. Effects of typhoon Mujigae on the biogeochemistry and ecology of a semi-enclosed bay in the northern South China Sea. J. Geophys. Res. Biogeosci. 2021, 126, e2020JG006031. [Google Scholar] [CrossRef]
  46. Li, J.; Chen, F.; Zhang, S.; Huang, C.; Chen, C.; Zhou, F.; Wu, J.; Jin, G.; Zhu, Q. Origin of the particulate organic matter in a monsoon-controlled bay in southern China. J. Mar. Sci. Eng. 2021, 9, 541. [Google Scholar] [CrossRef]
  47. Zhou, J.; Wu, Y.; Zhang, J.; Kang, Q.; Liu, Z. Carbon and nitrogen composition and stable isotope as potential indicators of source and fate of organic matter in the salt marsh of the Changjiang Estuary, China. Chemosphere 2006, 65, 310–317. [Google Scholar] [CrossRef]
  48. Stramska, M.; Stramski, D. Variability of particulate organic carbon concentration in the north polar Atlantic based on ocean color observations with Sea-viewing Wide Field-of-view Sensor (SeaWiFS). J. Geophys. Res. Ocean. 2005, 110, C10018. [Google Scholar] [CrossRef] [Green Version]
  49. Ye, F.; Guo, W.; Shi, Z.; Jia, G.; Wei, G. Seasonal dynamics of particulate organic matter and its response to flooding in the Pearl River Estuary, China, revealed by stable isotope (δ13C and δ15N) analyses. J. Geophys. Res. Ocean. 2017, 122, 6835–6856. [Google Scholar] [CrossRef]
  50. Raymond, P.A.; Bauer, J.E. Use of 14C and 13C natural abundances for evaluating riverine, estuarine, and coastal DOC and POC sources and cycling: A review and synthesis. Org. Geochem. 2001, 32, 469–485. [Google Scholar] [CrossRef]
  51. Ke, Z.; Tan, Y.; Huang, L.; Zhao, C.; Jiang, X. Spatial distributions of δ13C, δ15N and C/N ratios in suspended particulate organic matter of a bay under serious anthropogenic influences: Daya Bay, China. Mar. Pollut. Bull. 2017, 114, 183–191. [Google Scholar] [CrossRef]
  52. Ke, Z.; Chen, D.; Liu, J.; Tan, Y. The effects of anthropogenic nutrient inputs on stable carbon and nitrogen isotopes in suspended particulate organic matter in Jiaozhou Bay, China. Cont. Shelf Res. 2020, 208, 104244. [Google Scholar] [CrossRef]
  53. Lyu, H.; Li, X.; Wang, Y.; Jin, Q.; Cao, K.; Wang, Q.; Li, Y. Evaluation of chlorophyll-a retrieval algorithms based on MERIS bands for optically varying eutrophic inland lakes. Sci. Total Environ. 2015, 530, 373–382. [Google Scholar] [CrossRef]
  54. Lyu, H.; Wang, Y.; Jin, Q.; Shi, L.; Li, Y.; Wang, Q. Developing a semi-analytical algorithm to estimate particulate organic carbon (POC) levels in inland eutrophic turbid water based on MERIS images: A case study of Lake Taihu. Int. J. Appl. Earth Obs. Geoinf. 2017, 62, 69–77. [Google Scholar] [CrossRef]
  55. Odermatt, D.; Gitelson, A.; Brando, V.E.; Schaepman, M. Review of constituent retrieval in optically deep and complex waters from satellite imagery. Remote Sens. Environ. 2012, 118, 116–126. [Google Scholar] [CrossRef] [Green Version]
  56. Yacobi, Y.Z.; Moses, W.J.; Kaganovsky, S.; Sulimani, B.; Leavitt, B.C.; Gitelson, A.A. NIR-red reflectance-based algorithms for chlorophyll-a estimation in mesotrophic inland and coastal waters: Lake Kinneret case study. Water Res. 2011, 45, 2428–2436. [Google Scholar] [CrossRef] [PubMed] [Green Version]
  57. Mishra, S.; Mishra, D.R. A novel remote sensing algorithm to quantify phycocyanin in cyanobacterial algal blooms. Environ. Res. Lett. 2014, 9, 114003. [Google Scholar] [CrossRef]
  58. Gitelson, A. The peak near 700 nm on radiance spectra of algae and water: Relationships of its magnitude and position with chlorophyll concentration. Int. J. Remote Sens. 1992, 13, 3367–3373. [Google Scholar] [CrossRef]
Figure 1. A map of the study area and in situ sampling sites. S1–S23 and A1–A29 mark the sampling points in May and September, respectively.
Remotesensing 15 03768 g001
Figure 2. Method framework for estimating POC source ratios from Sentinel-2 data.
Remotesensing 15 03768 g002
Figure 3. Isotopic values (polylines) and POC concentrations (histograms) of the in situ sampling points in (a) May and (b) September. The graphical bars represent in situ sampling points, where blue and orange show marine and terrestrial POC concentrations, respectively, calculated via the δ¹³C end-member mixing model.
Remotesensing 15 03768 g003
Figure 4. Correlation between Chl-a and marine POC concentrations.
Remotesensing 15 03768 g004
Figure 5. Coefficients of correlation between the band ratio and the proportion of marine POC (fmar).
Remotesensing 15 03768 g005
Figure 6. Relationships between in situ (Rrs(443)/Rrs(492))×(Rrs(704)/Rrs(665)) and marine POC source ratios (a) and with terrestrial source ratios (b).
Remotesensing 15 03768 g006
Figure 7. Comparisons of in situ marine POC ratio with separate dataset-estimated results (a) and with satellite-retrieved results (b).
Remotesensing 15 03768 g007
Figure 8. Marine POC ratios retrieved from Sentinel-2 image (30 September 2016) in Zhanjiang Bay and its adjacent waters.
Remotesensing 15 03768 g008
Figure 9. Correlation between the Chl-a and marine POC concentrations.
Remotesensing 15 03768 g009
Figure 10. Spectral remote sensing reflectance of terrestrial and marine end-members.
Remotesensing 15 03768 g010
Table 1. Coefficients of correlation (R) between the recombination of four band ratios and the proportion of marine POC.
Sl.
No.
VariableR
1Rrs(443)/Rrs(492) + Rrs(492)/Rrs(443)−0.698 **
2Rrs(443)/Rrs(492) − Rrs(492)/Rrs(443)0.759 **
3(Rrs(443)/Rrs(492))/(Rrs(492)/Rrs(443))0.746 **
4Rrs(443)/Rrs(492) + Rrs(665)/Rrs(704)−0.524 **
5Rrs(443)/Rrs(492) − Rrs(665)/Rrs(704)0.879 **
6(Rrs(443)/Rrs(492)) × (Rrs(665)/Rrs(704))−0.279
7(Rrs(443)/Rrs(492))/(Rrs(665)/Rrs(704))0.884 **
8Rrs(443)/Rrs(492) + Rrs(704)/Rrs(665)0.882 **
9Rrs(443)/Rrs(492) − Rrs(704)/Rrs(665)−0.244
10Rrs(492)/Rrs(443) + Rrs(665)/Rrs(704)−0.876 **
11Rrs(492)/Rrs(443) − Rrs(665)/Rrs(704)0.341 *
12(Rrs(492)/Rrs(443)) × (Rrs(665)/Rrs(704))−0.865 **
13(Rrs(492)/Rrs(443))/(Rrs(665)/Rrs(704))0.307
14Rrs(492)/Rrs(443) + Rrs(704)/Rrs(665)−0.012
15Rrs(492)/Rrs(443) − Rrs(704)/Rrs(665)−0.876 **
16Rrs(665)/Rrs(704) + Rrs(704)/Rrs(665)−0.788 **
17Rrs(665)/Rrs(704) − Rrs(704)/Rrs(665)−0.844 **
18(Rrs(665)/Rrs(704))/(Rrs(704)/Rrs(665))−0.833 **
* and ** represent p < 0.05 and p < 0.01, respectively.
Table 2. Comparison of performances of the different POC source algorithms.
AlgorithmR2MAPE (%)RMSE (%)
Spoc [16]0.1898.6226.18
Three-band [23]0.2438.3425.52
This study0.7833.5713.74
Disclaimer/Publisher’s Note: The statements, opinions and data contained in all publications are solely those of the individual author(s) and contributor(s) and not of MDPI and/or the editor(s). MDPI and/or the editor(s) disclaim responsibility for any injury to people or property resulting from any ideas, methods, instructions or products referred to in the content.

