
Surface Displacement of Hurd Rock Glacier from 1956 to 2019 from Historical Aerial Frames and Satellite Imagery (Livingston Island, Antarctic Peninsula)

Abstract
:
1. Introduction
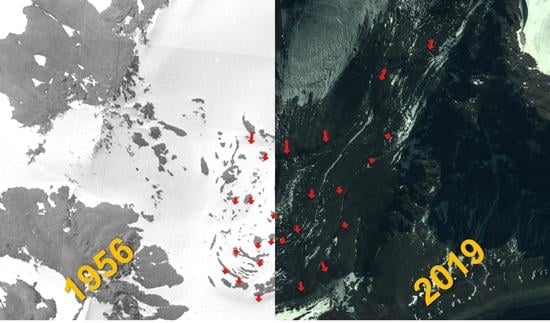
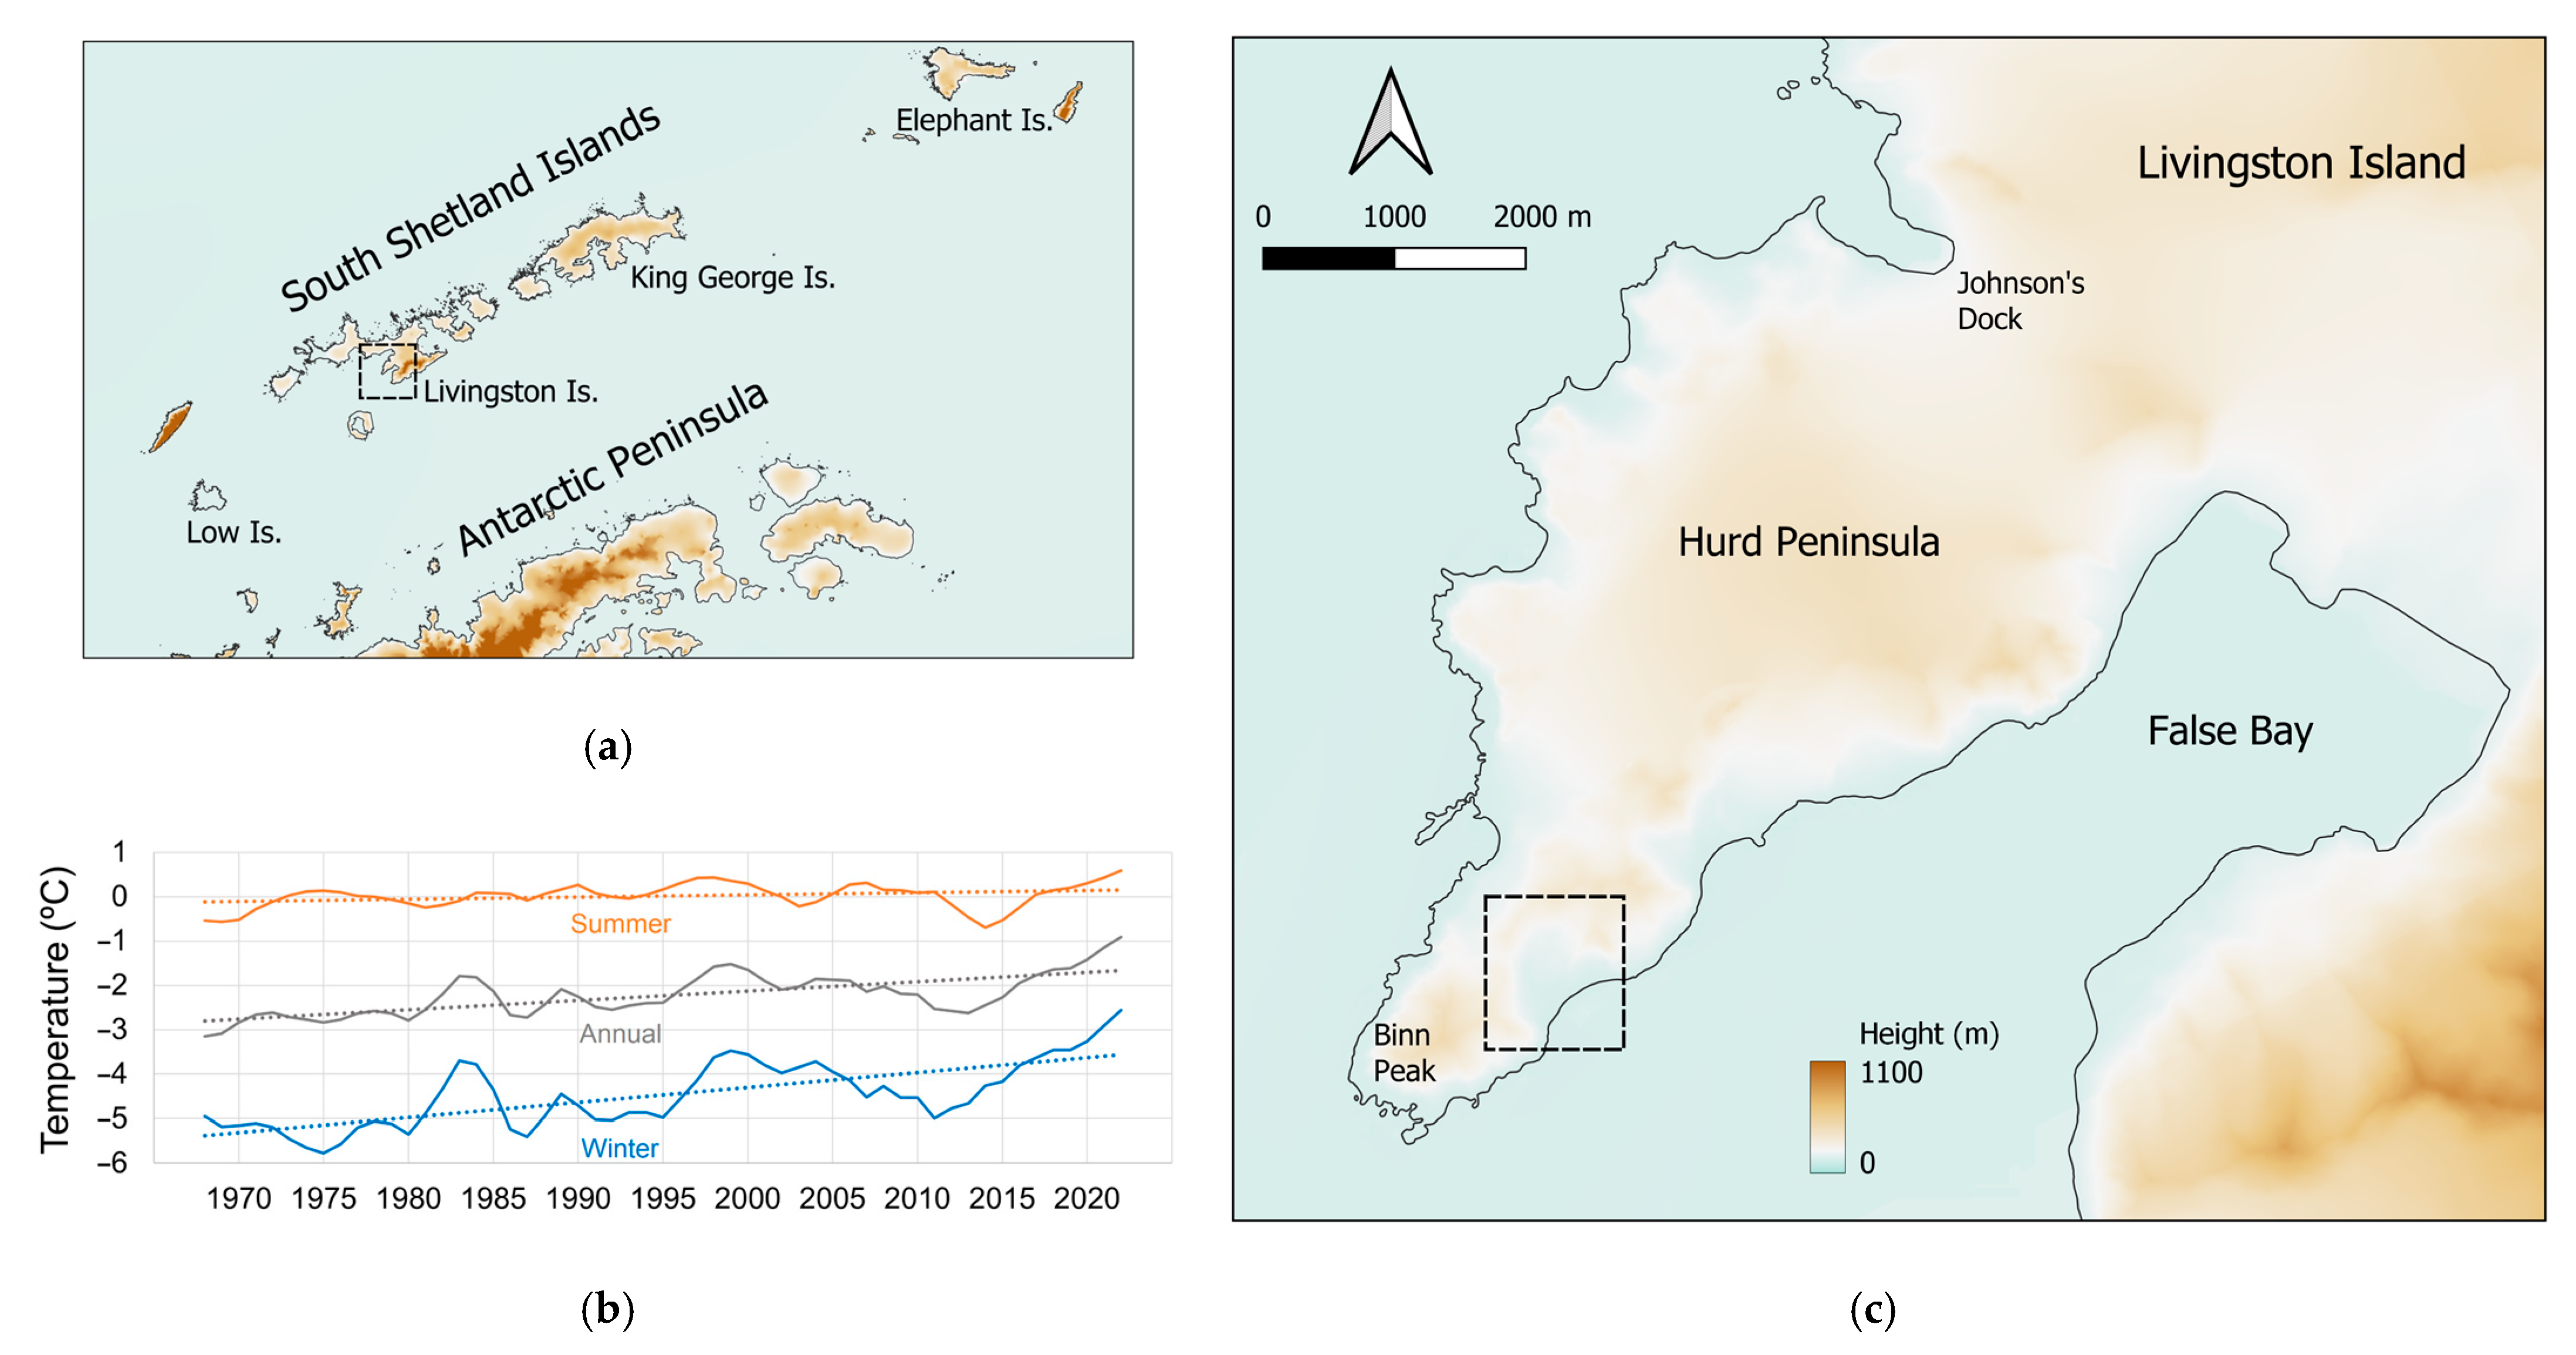
2. Study Area
3. Materials and Methods
3.1. Structure from Motion and Rational Polynomial Processing
3.2. Dataset Characteristics and Selection of Ground Control Points
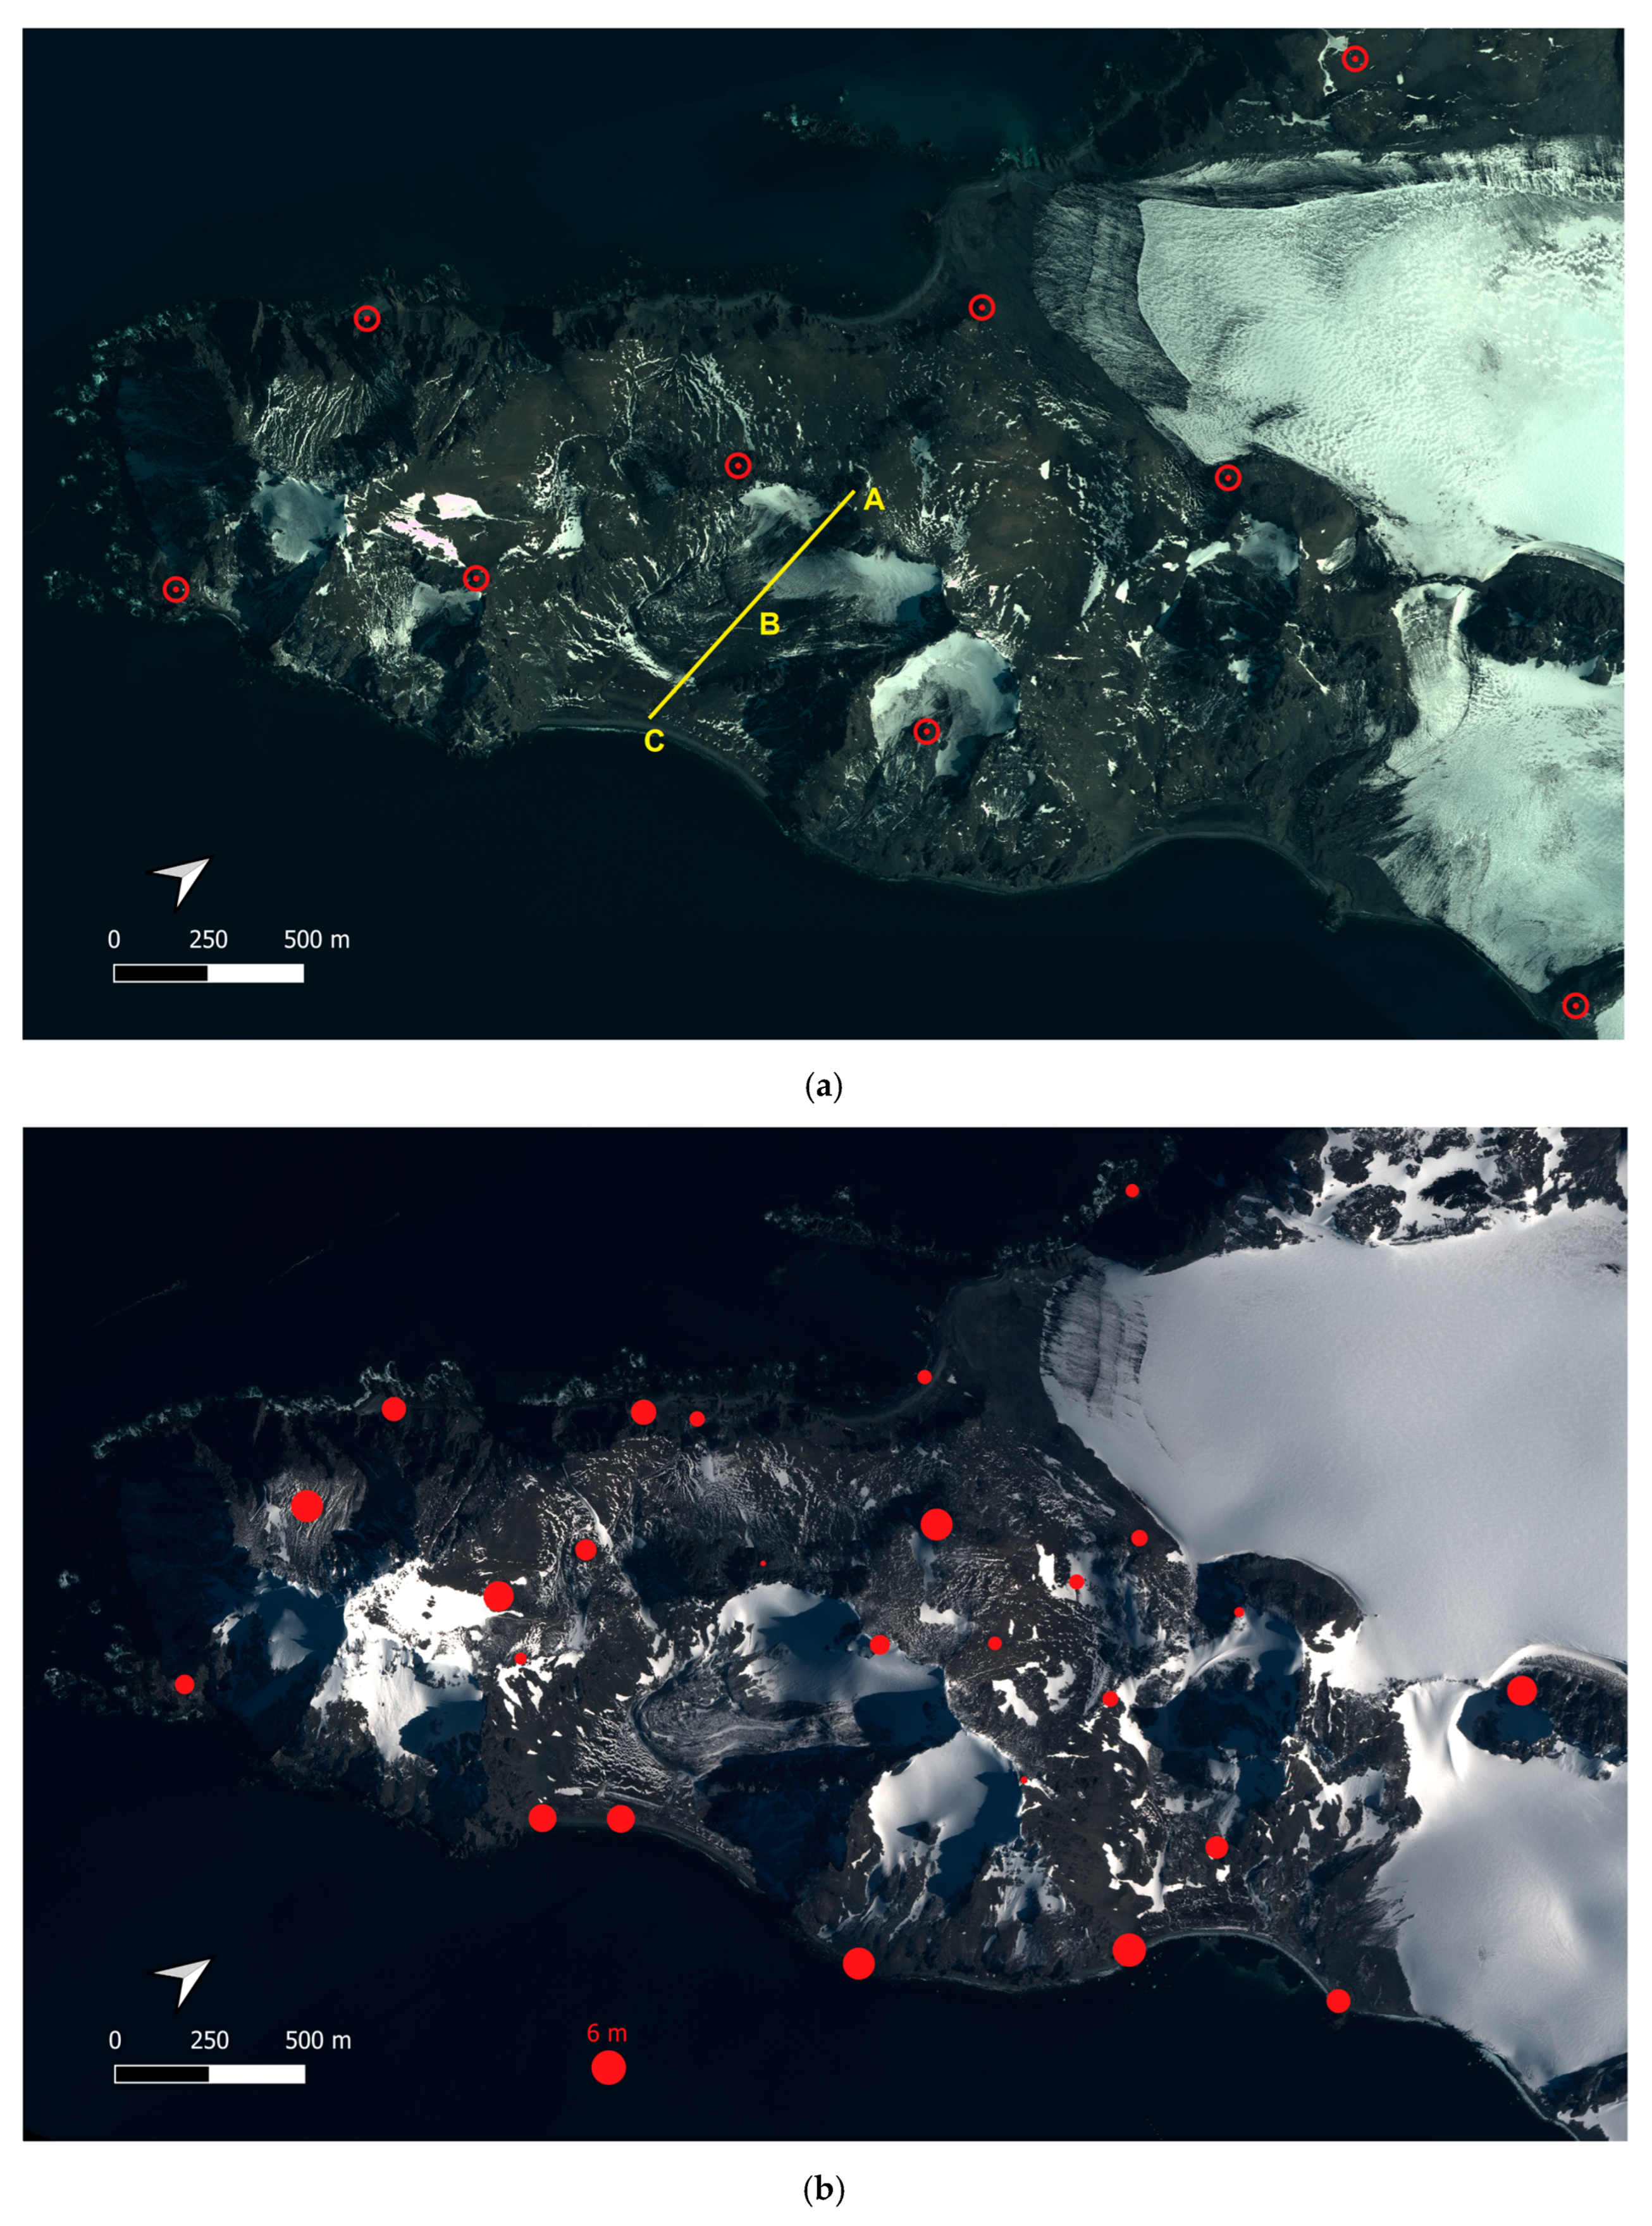
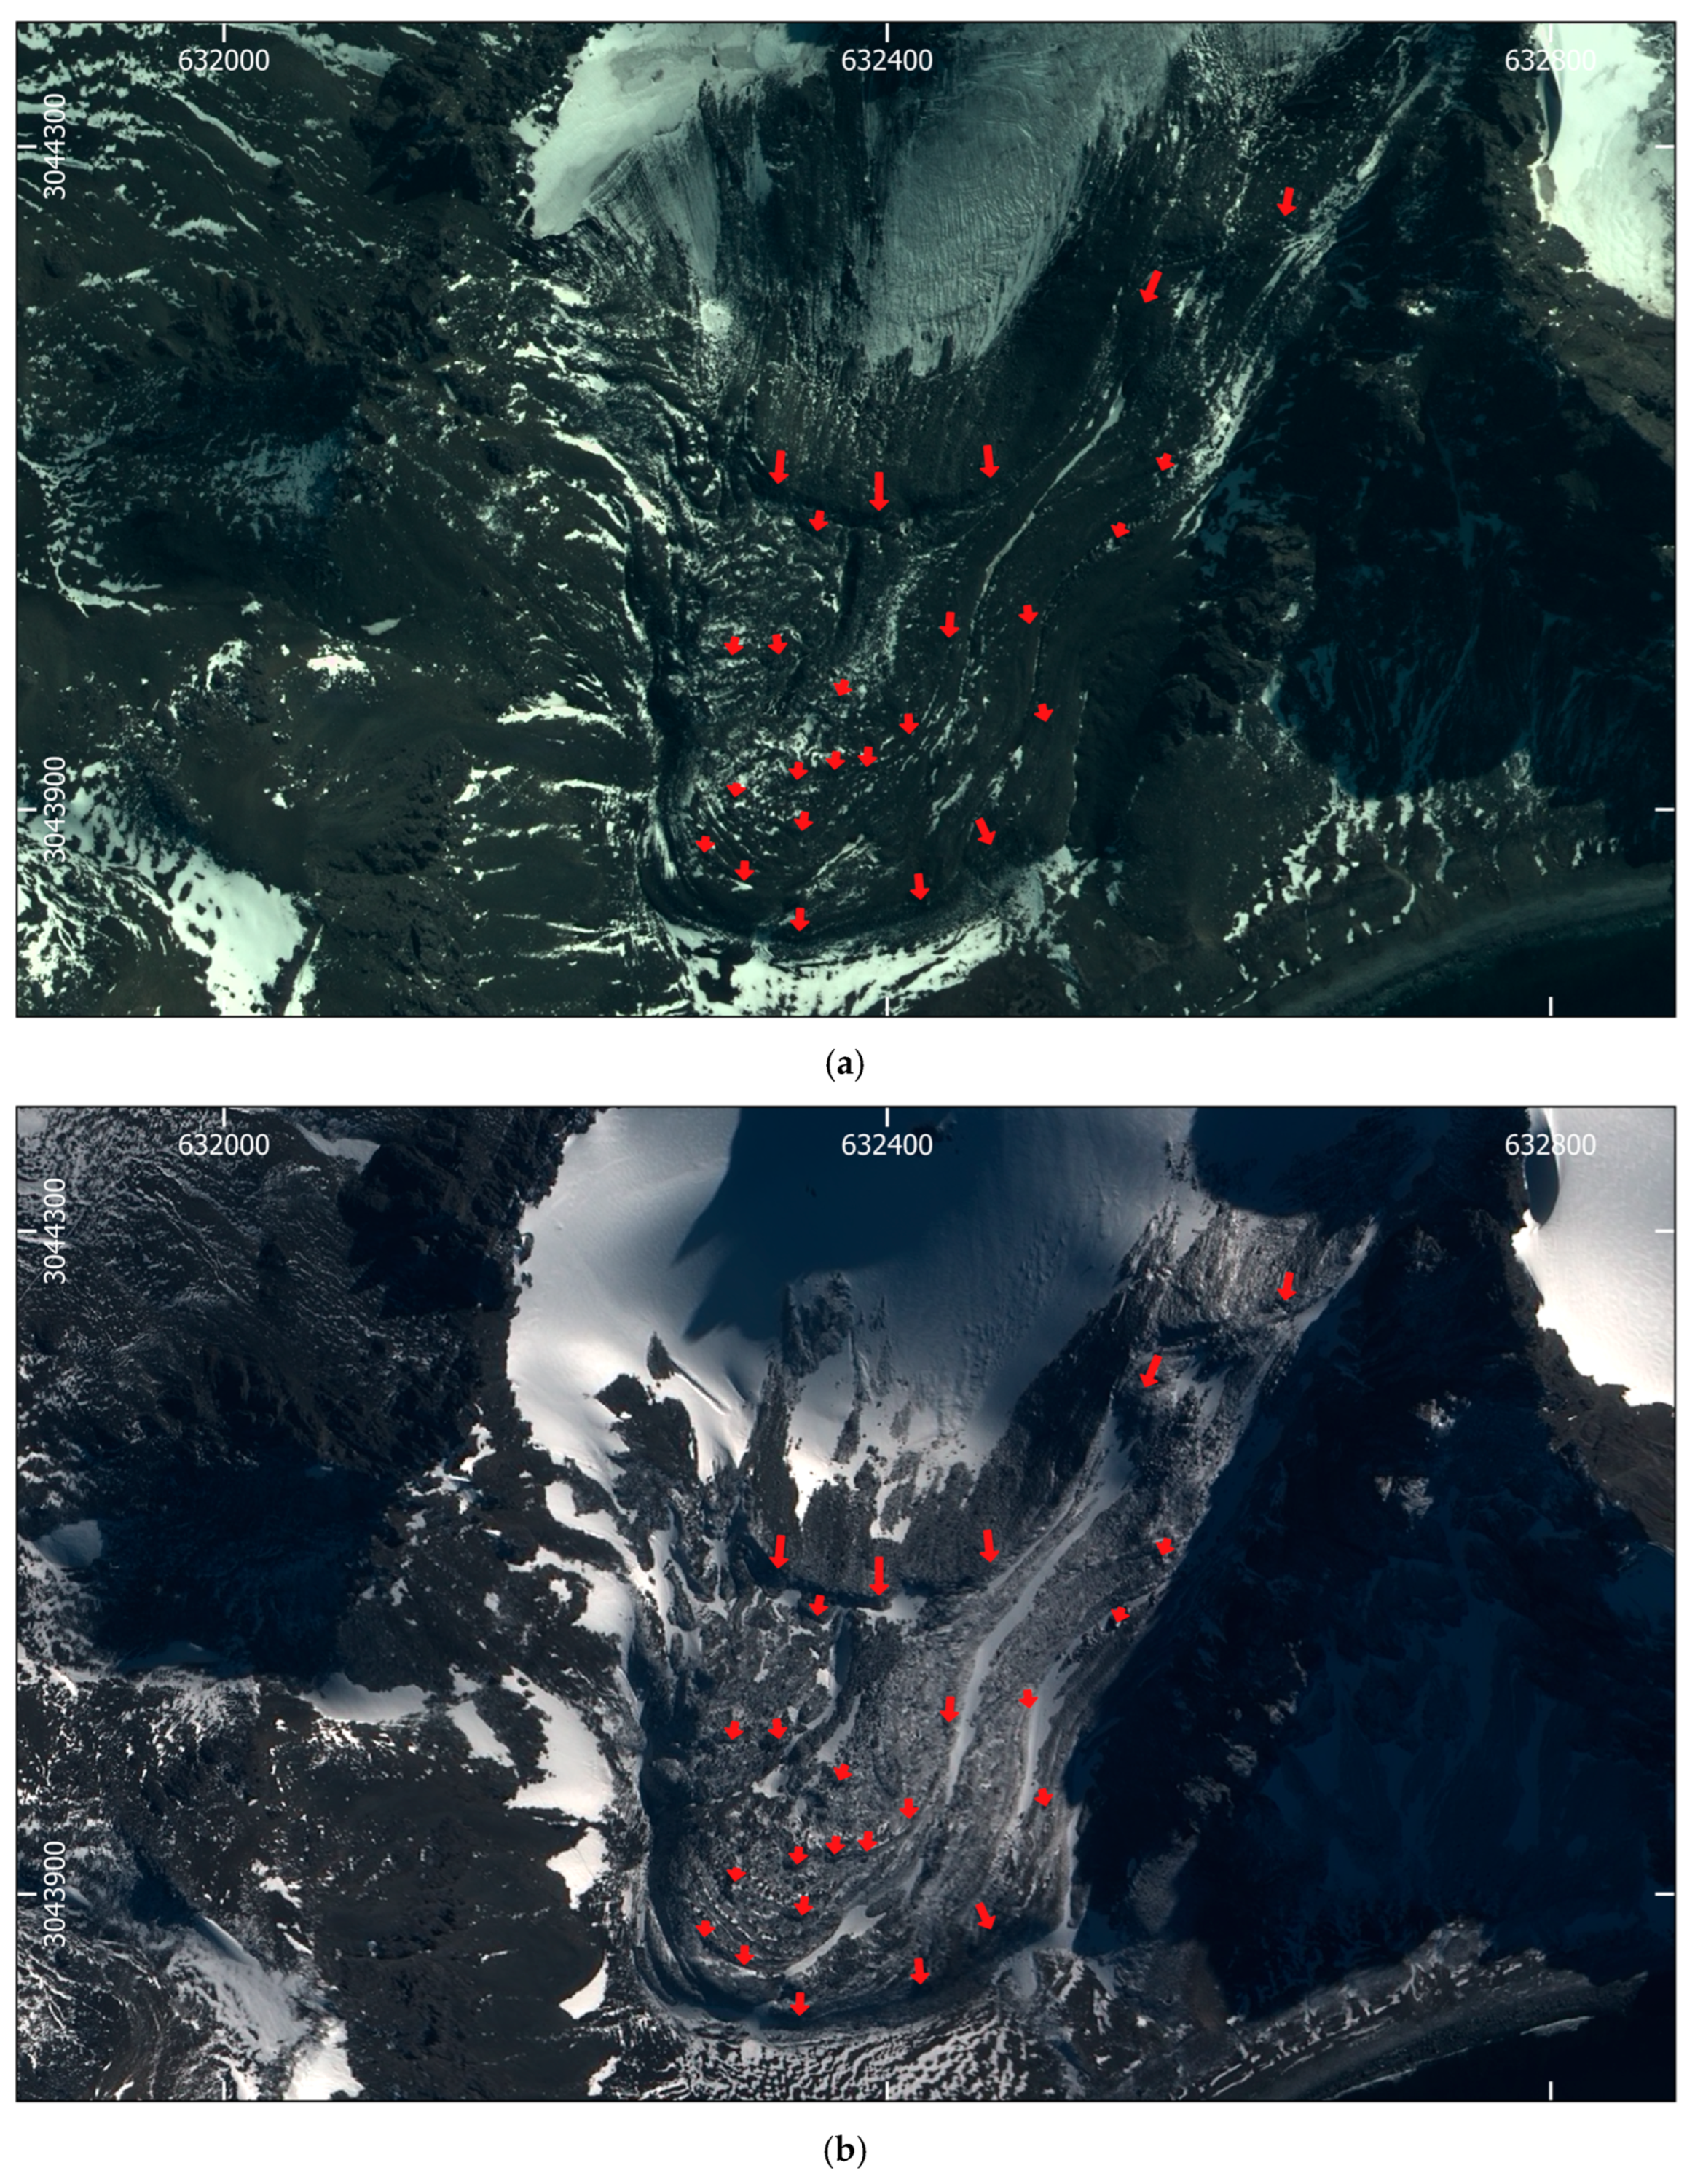
4. Results
Orthographic Images Generation and Combined Accuracy Assessment
5. Discussion
Hurd Rock Glacier Surface Velocity
6. Conclusions
Author Contributions
Funding
Data Availability Statement
Acknowledgments
Conflicts of Interest
Appendix A

Appendix B

| 1956 | 1957 | 2007 | 2019 | ||||
|---|---|---|---|---|---|---|---|
| X (m) | Y (m) | X (m) | Y (m) | X (m) | Y (m) | X (m) | Y (m) |
| 631,523.445 | 3,042,909.857 | 631,525.561 | 3,042,907.211 | 631,526.818 | 3,042,912.039 | 631,528.406 | 3,042,913.098 |
| 631,253.305 | 3,043,775.044 | 631,253.570 | 3,043,774.780 | 631,253.702 | 3,043,777.227 | 631,249.733 | 3,043,782.783 |
| 631,980.248 | 3,043,675.958 | 631,981.306 | 3,043,674.899 | 631,981.835 | 3,043,675.098 | 631,981.571 | 3,043,679.066 |
| 632,141.908 | 3,044,346.610 | 632,142.437 | 3,044,346.081 | 632,142.173 | 3,044,346.081 | 632,142.702 | 3,044,347.801 |
| 633,005.111 | 3,044,584.801 | 633,006.170 | 3,044,585.066 | 633,005.773 | 3,044,586.323 | 633,006.831 | 3,044,584.206 |
| 631,986.598 | 3,044,978.171 | 631,989.508 | 3,044,979.626 | 631,986.333 | 3,044,977.377 | 631,984.216 | 3,044,979.494 |
| 632,971.906 | 3,045,301.359 | 632,971.377 | 3,045,303.740 | 632,971.245 | 3,045,304.137 | 632,969.393 | 3,045,303.873 |
| 633,962.506 | 3,044,934.382 | 633,962.241 | 3,044,935.176 | 633,965.549 | 3,044,927.900 | 633,961.051 | 3,044,929.223 |
| 632,358.205 | 3,043,488.633 | 632,358.999 | 3,043,486.384 | 632,364.158 | 3,043,479.174 | 632,359.925 | 3,043,484.730 |
| 631,730.481 | 3,044,419.834 | 631,731.539 | 3,044,419.305 | 631,733.656 | 3,044,420.032 | 631,730.481 | 3,044,424.001 |
| 632,490.894 | 3,044,479.630 | 632,490.629 | 3,044,478.571 | 632,489.174 | 3,044,480.754 | 632,496.053 | 3,044,476.851 |
| 632,475.812 | 3,043,658.892 | 632,478.194 | 3,043,658.495 | 632,480.839 | 3,043,650.161 | 632,480.046 | 3,043,653.071 |
| 631,336.120 | 3,043,439.685 | 631,336.649 | 3,043,439.949 | 631,331.952 | 3,043,442.331 | 631,327.984 | 3,043,447.887 |
| 631,848.618 | 3,043,978.906 | 631,846.765 | 3,043,978.376 | 631,848.948 | 3,043,978.906 | 631,844.979 | 3,043,984.991 |
| 631,639.861 | 3,044,313.074 | 631,640.390 | 3,044,311.222 | 631,641.515 | 3,044,312.016 | 631,634.900 | 3,044,318.366 |
| 631,807.607 | 3,043,727.287 | 631,806.813 | 3,043,725.435 | 631,815.875 | 3,043,720.672 | 631,813.229 | 3,043,725.699 |
| 632,669.487 | 3,044,727.213 | 632,671.869 | 3,044,726.949 | 632,669.950 | 3,044,725.824 | 632,666.775 | 3,044,728.206 |
| 633,441.938 | 3,044,906.270 | 633,441.872 | 3,044,902.037 | 633,446.106 | 3,044,899.920 | 633,444.518 | 3,044,898.862 |
| 631,900.079 | 3,045,711.331 | 631,899.021 | 3,045,710.273 | 631,896.441 | 3,045,711.662 | 631,895.383 | 3,045,710.868 |
| 633,577.802 | 3,045,792.426 | 633,573.833 | 3,045,795.138 | 633,569.600 | 3,045,798.048 | 633,567.483 | 3,045,796.395 |
| 632,323.677 | 3,044,774.706 | 632,322.619 | 3,044,776.294 | 632,316.798 | 3,044,770.870 | 632,321.560 | 3,044,781.982 |
| 632,663.402 | 3,045,197.378 | 632,662.608 | 3,045,197.180 | 632,662.608 | 3,045,197.709 | 632,658.110 | 3,045,200.288 |
| 632,657.449 | 3,045,001.454 | 632,661.021 | 3,044,998.742 | 632,660.095 | 3,044,997.022 | 632,657.713 | 3,044,997.882 |
| 632,959.074 | 3,044,894.364 | 632,960.926 | 3,044,895.422 | 632,964.762 | 3,044,892.313 | 632,961.984 | 3,044,894.033 |
| 633,146.680 | 3,043,955.199 | 633,150.120 | 3,043,956.787 | 633,152.501 | 3,043,947.791 | 633,153.824 | 3,043,948.585 |
| 633,530.591 | 3,044,556.862 | 633,528.739 | 3,044,554.216 | 633,539.322 | 3,044,548.660 | 633,534.057 | 3,044,554.102 |
References
- RGIK. Towards Standard Guidelines for Inventorying Rock Glaciers: Baseline Concepts (Version 4.2.2); IPA Action Group Rock Glacier Inventories and Kinematics: Troms and Finnmark, Norway, 2022; 13p. [Google Scholar]
- Haeberli, W. Creep of Mountain Permafrost: Internal Structure and Flow of Alpine Rock Glaciers; Eidgenössische Technische Hochschule Zürich: Zürich, Switzerland, 1985; Volume 77, 142p. [Google Scholar]
- Müller, J.; Vieli, A.; Gärtner-Roer, I. Rock Glaciers on the Run—Understanding Rock Glacier Landform Evolution and Recent Changes from Numerical Flow Modeling. Cryosphere 2016, 10, 2865–2886. [Google Scholar] [CrossRef] [Green Version]
- Marcer, M.; Cicoira, A.; Cusicanqui, D.; Bodin, X.; Echelard, T.; Obregon, R.; Schoeneich, P. Rock Glaciers throughout the French Alps Accelerated and Destabilised since 1990 as Air Temperatures Increased. Commun. Earth Environ. 2021, 2, 81. [Google Scholar] [CrossRef]
- Sorg, A.; Kääb, A.; Roesch, A.; Bigler, C.; Stoffel, M. Contrasting Responses of Central Asian Rock Glaciers to Global Warming. Sci. Rep. 2015, 5, 8228. [Google Scholar] [CrossRef] [Green Version]
- Rangecroft, S.; Suggitt, A.J.; Anderson, K.; Harrison, S. Future Climate Warming and Changes to Mountain Permafrost in the Bolivian Andes. Clim. Change 2016, 137, 231–243. [Google Scholar] [CrossRef] [PubMed]
- Reinosch, E.; Gerke, M.; Riedel, B.; Schwalb, A.; Ye, Q.; Buckel, J. Rock Glacier Inventory of the Western Nyainqêntanglha Range, Tibetan Plateau, Supported by InSAR Time Series and Automated Classification. Permafr. Periglac. Process. 2021, 32, 657–672. [Google Scholar] [CrossRef]
- Tielidze, L.G.; Cicoira, A.; Nosenko, G.A.; Eaves, S.R. The First Rock Glacier Inventory for the Greater Caucasus. Geosciences 2023, 13, 117. [Google Scholar] [CrossRef]
- Wagner, T.; Pleschberger, R.; Kainz, S.; Ribis, M.; Kellerer-Pirklbauer, A.; Krainer, K.; Philippitsch, R.; Winkler, G. The First Consistent Inventory of Rock Glaciers and Their Hydrological Catchments of the Austrian Alps. Austrian J. Earth Sci. 2020, 113, 1–23. [Google Scholar] [CrossRef]
- Serrano, E.; López-Martínez, J. Rock Glaciers in the South Shetland Islands, Western Antarctica. Geomorphology 2000, 35, 145–162. [Google Scholar] [CrossRef]
- Reis, A.R.; Catalao, J.; Vieira, G.; Nico, G. Mitigation of Atmospheric Phase Delay in InSAR Time Series Using ERA-Interim Model, GPS and MODIS Data: Application to the Permafrost Deformation in Hurd Peninsula, Antarctica. In Proceedings of the 2015 IEEE International Geoscience and Remote Sensing Symposium (IGARSS), Milan, Italy, 26–31 July 2015; pp. 3454–3457. [Google Scholar]
- Kääb, A.; Vollmer, M. Surface Geometry, Thickness Changes and Flow Fields on Creeping Mountain Permafrost: Automatic Extraction by Digital Image Analysis. Permafr. Periglac. Process. 2000, 11, 315–326. [Google Scholar] [CrossRef]
- Gavin-Robinson, C. The story of the Falkland Island dependencies aerial survey expeditions. Flight 1957, 802–805. [Google Scholar]
- Fox, A.J.; Cziferszky, A. Unlocking the Time Capsule of Historic Aerial Photography to Measure Changes in Antarctic Peninsula Glaciers. Photogramm. Rec. 2008, 23, 51–68. [Google Scholar] [CrossRef] [Green Version]
- Tanguy, R.; Whalen, D.; Prates, G.; Vieira, G. Shoreline Change Rates and Land to Sea Sediment and Soil Organic Carbon Transfer in Eastern Parry Peninsula from 1965 to 2020 (Amundsen Gulf, Canada). Arct. Sci. 2023. [Google Scholar] [CrossRef]
- Tanguy, R.; Whalen, D.; Prates, G.; Pina, P.; Freitas, P.; Bergstedt, H.; Vieira, G. Permafrost Degradation in the Ice-Wedge Tundra Terrace of Paulatuk Peninsula (Darnley Bay, Canada). Geomorphology 2023, 435, 108754. [Google Scholar] [CrossRef]
- Turner, J.; Barrand, N.E.; Bracegirdle, T.J.; Convey, P.; Hodgson, D.A.; Jarvis, M.; Jenkins, A.; Marshall, G.; Meredith, M.P.; Roscoe, H.; et al. Antarctic Climate Change and the Environment: An Update. Polar Rec. 2014, 50, 237–259. [Google Scholar] [CrossRef] [Green Version]
- Vaughan, D.G.; Marshall, G.J.; Connolley, W.M.; Parkinson, C.; Mulvaney, R.; Hodgson, D.A.; King, J.C.; Pudsey, C.J.; Turner, J. Recent rapid regional climate warming on the Antarctic Peninsula. Clim. Change 2003, 60, 243–274. [Google Scholar] [CrossRef]
- Turner, J.; Colwell, S.R.; Marshall, G.J.; Lachlan-Cope, T.A.; Carleton, A.M.; Jones, P.D.; Lagun, V.; Reid, P.A.; Iagovkina, S. Antarctic Climate Change during the Last 50 Years. Int. J. Climatol. 2005, 25, 279–294. [Google Scholar] [CrossRef]
- Turner, J.; Bindschadler, R.; Convey, P.; di Prisco, G.; Fahrbach, E.; Gutt, J.; Hodgson, D.; Mayewski, P.; Summerhayes, C. Antarctic Climate Change and the Environment; Scientific Committee on Antarctic Research: Cambridge, UK, 2009. [Google Scholar]
- Turner, J.; Lachlan-Cope, T.; Colwell, S.; Marshall, G.J. A Positive Trend in Western Antarctic Peninsula Precipitation over the Last 50 Years Reflecting Regional and Antarctic-Wide Atmospheric Circulation Changes. Ann. Glaciol. 2005, 41, 85–91. [Google Scholar] [CrossRef] [Green Version]
- Miles, G.M.; Marshall, G.J.; McConnell, J.R.; Aristarain, A.J. Recent Accumulation Variability and Change on the Antarctic Peninsula from the ERA40 Reanalysis. Int. J. Climatol. 2008, 28, 1409–1422. [Google Scholar] [CrossRef]
- Thomas, E.R.; Marshall, G.J.; McConnell, J.R. A Doubling in Snow Accumulation in the Western Antarctic Peninsula since 1850. Geophys. Res. Lett. 2008, 35, L01706. [Google Scholar] [CrossRef] [Green Version]
- González-Herrero, S.; Barriopedro, D.; Trigo, R.M.; López-Bustins, J.A.; Oliva, M. Climate Warming Amplified the 2020 Record-Breaking Heatwave in the Antarctic Peninsula. Commun. Earth Environ. 2022, 3, 122. [Google Scholar] [CrossRef]
- Oliva, M.; Navarro, F.; Hrbáček, F.; Hernández, A.; Nývlt, D.; Pereira, P.; Ruiz-Fernández, J.; Trigo, R. Recent Regional Climate Cooling on the Antarctic Peninsula and Associated Impacts on the Cryosphere. Sci. Total Environ. 2017, 580, 210–223. [Google Scholar] [CrossRef] [PubMed]
- Vieira, G.; Bockheim, J.; Guglielmin, M.; Balks, M.; Abramov, A.A.; Boelhouwers, J.; Cannone, N.; Ganzert, L.; Gilichinsky, D.A.; Goryachkin, S.; et al. Thermal State of Permafrost and Active-Layer Monitoring in the Antarctic: Advances during the International Polar Year 2007-2009. Permafr. Periglac. Process. 2010, 21, 182–197. [Google Scholar] [CrossRef] [Green Version]
- Bockheim, J.; Vieira, G.; Ramos, M.; López-Martínez, J.; Serrano, E.; Guglielmin, M.; Wilhelm, K.; Nieuwendam, A. Climate Warming and Permafrost Dynamics in the Antarctic Peninsula Region. Glob. Planet. Change 2013, 100, 215–223. [Google Scholar] [CrossRef]
- Ferreira, A.; Vieira, G.; Ramos, M.; Nieuwendam, A. Ground Temperature and Permafrost Distribution in Hurd Peninsula (Livingston Island, Maritime Antarctic): An Assessment Using Freezing Indexes and TTOP Modelling. Catena 2017, 149, 560–571. [Google Scholar] [CrossRef]
- López-Martínez, J.; Serrano, E.; Schmid, T.; Mink, S.; Linés, C. Periglacial Processes and Landforms in the South Shetland Islands (Northern Antarctic Peninsula Region). Geomorphology 2012, 155–156, 62–79. [Google Scholar] [CrossRef]
- Obu, J.; Westermann, S.; Vieira, G.; Abramov, A.; Balks, M.R.; Bartsch, A.; Hrbáček, F.; Kääb, A.; Ramos, M. Pan-Antarctic Map of near-Surface Permafrost Temperatures at 1 Km2 Scale. Cryosph. 2020, 14, 497–519. [Google Scholar] [CrossRef] [Green Version]
- Goyanes, G.; Vieira, G.; Caselli, A.; Mora, C.; Ramos, M.; de Pablo, M.A.; Neves, M.; Santos, F.; Bernardo, I.; Gilichinsky, D.; et al. Régimen térmico y variabilidad espacial de la capa active en isla Decepción, Antártida. Rev. Asoc. Geol. Argent. 2014, 71, 112–124. [Google Scholar]
- Ramos, M.; Vieira, G.; de Pablo, M.A.; Molina, A.; Abramov, A.; Goyanes, G. Recent Shallowing of the Thaw Depth at Crater Lake, Deception Island, Antarctica (2006–2014). Catena 2017, 149, 519–528. [Google Scholar] [CrossRef]
- De Pablo, M.A.; Ramos, M.; Molina, A. Snow Cover Evolution, on 2009–2014, at the Limnopolar Lake CALM-S Site on Byers Peninsula, Livingston Island, Antarctica. Catena 2017, 149, 538–547. [Google Scholar] [CrossRef]
- Ramos, M.; de Pablo, M.A.; Molina, A.; Vieira, G.; Trindade, A.; Correia, A. Study of the Active Layer Freezing and Thawing Cycles in the Surroundings of the Spanish Antarctic Station JCI 2000 to 2011. In Proceedings of the 7th Portuguese Spanish Assembly of Geodesy and Geophysics, San Sebastian, Spain, 25–29 June 2012; pp. 723–726. [Google Scholar]
- Ramos, M.; Vieira, G.; de Pablo, M.A.; Molina, A.; Jimenez, J.J. Transition from a Subaerial to a Subnival Permafrost Temperature Regime Following Increased Snow Cover (Livingston Island, Maritime Antarctic). Atmosphere 2020, 11, 1332. [Google Scholar] [CrossRef]
- Serrano, E.; Giner, J.; Gumiel, P.; López-Martínez, J. El glaciar rocoso de Hurd: Estructura e inserción en el sistema de transferencia de derrubios Antártico Marítimo (Isla Livington, Islas Shetland de Sur, Antártida). Rev. Cuat. Geomorfol. 2004, 18, 13–24. [Google Scholar]
- Hauck, C.; Vieira, G.; Gruber, S.; Blanco, J.; Ramos, M. Geophysical Identification of Permafrost in Livingston Island, Maritime Antarctica. J. Geophys. Res. 2007, 112, F02S19. [Google Scholar] [CrossRef] [Green Version]
- Recondo, C.; Corbea-Pérez, A.; Peón, J.; Pendás, E.; Ramos, M.; Calleja, J.F.; de Pablo, M.Á.; Fernández, S.; Corrales, J.A. Empirical Models for Estimating Air Temperature Using MODIS Land Surface Temperature (and Spatiotemporal Variables) in the Hurd Peninsula of Livingston Island, Antarctica, between 2000 and 2016. Remote Sens. 2022, 14, 3206. [Google Scholar] [CrossRef]
- Westoby, M.J.; Brasington, J.; Glasser, N.F.; Hambrey, M.J.; Reynolds, J.M. “Structure-from-Motion” Photogrammetry: A Low-Cost, Effective Tool for Geoscience Applications. Geomorphology 2012, 179, 300–314. [Google Scholar] [CrossRef] [Green Version]
- Snavely, N.; Seitz, S.M.; Szeliski, R. Modeling the World from Internet Photo Collections. Int. J. Comput. Vis. 2008, 80, 189–210. [Google Scholar] [CrossRef] [Green Version]
- Javernick, L.; Brasington, J.; Caruso, B. Modeling the Topography of Shallow Braided Rivers Using Structure-from-Motion Photogrammetry. Geomorphology 2014, 213, 166–182. [Google Scholar] [CrossRef]
- Cook, K.L. An Evaluation of the Effectiveness of Low-Cost UAVs and Structure from Motion for Geomorphic Change Detection. Geomorphology 2017, 278, 195–208. [Google Scholar] [CrossRef]
- Furukawa, Y.; Ponce, J. Accurate, Dense, and Robust Multi-View Stereopsis. In Proceedings of the IEEE Computer Society Conference on Computer Vision and Pattern Recognition, Minneapolis, MN, USA, 17–22 June 2007. [Google Scholar]
- Lillesand, T.; Kiefer, R.W.; Chipman, J. Remote Sensing and Image Interpretation, 7th ed.; Wiley: Hoboken, NJ, USA, 2015; ISBN 9781118919453. [Google Scholar]
- Prates, G.; Torrecillas, C.; Berrocoso, M.; Goyanes, G.; Vieira, G. Deception Island 1967–1970 Volcano Eruptions from Historical Aerial Frames and Satellite Imagery (Antarctic Peninsula). Remote Sens. 2023, 15, 2052. [Google Scholar] [CrossRef]
- Tao, C.V.; Hu, Y. A Comprehensive Study of the Rational Function Model for Photogrammetric Processing. Photogramm. Eng. Remote Sens. 2001, 67, 1347–1358. [Google Scholar]
- Marí, R.; de Franchis, C.; Meinhardt-Llopis, E.; Anger, J.; Facciolo, G. A Generic Bundle Adjustment Methodology for Indirect RPC Model Refinement of Satellite Imagery. Image Process. Line 2021, 11, 344–373. [Google Scholar] [CrossRef]
- Howat, I.M.; Porter, C.; Smith, B.E.; Noh, M.J.; Morin, P. The Reference Elevation Model of Antarctica. Cryosphere 2019, 13, 665–674. [Google Scholar] [CrossRef] [Green Version]


| Proprietary | Type and Details | Number of Frames/Images | Altitude and Scale | Date |
|---|---|---|---|---|
| Falkland Islands and Dependencies Aerial Survey Expedition (FIDASE) | f: 152.9 mm f: 153.2 mm | 4 | 3960 m 1:26,000 | 17 December 1956 |
| 4 | 4115 m 1:27,000 | 26 December 1957 | ||
| DigitalGlobe (QuickBird) | panchromatic 4 bands f: 8800.0 mm | 1 | 450,000 m | 7 February 2007 |
| CNES/Airbus (Pleiades) | panchromatic 4 bands f: 12,905.0 mm | 1 | 694,000 m | 28 February 2019 |
Disclaimer/Publisher’s Note: The statements, opinions and data contained in all publications are solely those of the individual author(s) and contributor(s) and not of MDPI and/or the editor(s). MDPI and/or the editor(s) disclaim responsibility for any injury to people or property resulting from any ideas, methods, instructions or products referred to in the content. |
© 2023 by the authors. Licensee MDPI, Basel, Switzerland. This article is an open access article distributed under the terms and conditions of the Creative Commons Attribution (CC BY) license (https://creativecommons.org/licenses/by/4.0/).
Share and Cite
Prates, G.; Vieira, G. Surface Displacement of Hurd Rock Glacier from 1956 to 2019 from Historical Aerial Frames and Satellite Imagery (Livingston Island, Antarctic Peninsula). Remote Sens. 2023, 15, 3685. https://doi.org/10.3390/rs15143685
Prates G, Vieira G. Surface Displacement of Hurd Rock Glacier from 1956 to 2019 from Historical Aerial Frames and Satellite Imagery (Livingston Island, Antarctic Peninsula). Remote Sensing. 2023; 15(14):3685. https://doi.org/10.3390/rs15143685
Chicago/Turabian StylePrates, Gonçalo, and Gonçalo Vieira. 2023. "Surface Displacement of Hurd Rock Glacier from 1956 to 2019 from Historical Aerial Frames and Satellite Imagery (Livingston Island, Antarctic Peninsula)" Remote Sensing 15, no. 14: 3685. https://doi.org/10.3390/rs15143685