Article

The Spatio-Temporal Changes of Small Lakes of the Qilian Mountains from 1987 to 2020 and Their Driving Mechanisms

1
College of Urban and Environmental Science, Northwest University, Xi’an 710127, China
2
Shaanxi Key Laboratory of Earth Surface System and Environmental Carrying Capacity, Northwest University, Xi’an 710127, China
3
Qilian Alpine Ecology and Hydrology Research Station, Northwest Institute of Eco-Environment and Resources, Chinese Academy of Sciences, Lanzhou 730000, China
*
Author to whom correspondence should be addressed.
Remote Sens. 2023, 15(14), 3604; https://doi.org/10.3390/rs15143604
Submission received: 8 June 2023 / Revised: 9 July 2023 / Accepted: 17 July 2023 / Published: 19 July 2023

Abstract

:
Small lakes (areas ranging from 0.01 km2 to 1 km2) are highly sensitive to climate change and human activities. However, few studies have investigated the long-term intra-annual trends in the number and area of small lakes and their driving mechanisms in the Qinghai–Tibet Plateau (QTP). As a significant water tower in northwest China, the Qilian Mountains region (QMR) in the QTP is essential for sustaining regional industrial and agricultural production, biodiversity, and human well-being. We conducted an analysis of the dynamics of small lakes in the QMR region. In this study, we employed Geodetector and examined nine factors to investigate the driving mechanisms behind the long-term variations in the small lake water bodies (SLWBs). We specifically focused on understanding the effects of single-factor and two-factor interactions. The results indicate that the number and area of small lakes had a fluctuating trend from 1987 to 2020. Initially, there was a decrease followed by an increase, which was generally consistent with trends in the large lakes on the QTP. All basins had far more expanding than shrinking lakes. The area of seasonal SLWBs in each basin was increasing more rapidly than permanent SLWBs. The distribution and trends in the area and number of small lakes varied widely across elevation zones. Runoff, snow depth, and temperature contributed the most to SLWB changes. Human activities and wind speed contributed the least. However, the main drivers varied across basins. The impact of two-factor interactions on SLWB changes in basins was greater than that of single factors. Our results provide useful information for planning and managing water resources and studies of small lakes.

Graphical Abstract

1. Introduction

The Qinghai–Tibet Plateau (QTP), as the “Water Tower of Asia”, provides ample water resources for a vast region [1,2]. The QTP is also the largest lake distribution region in China, with the largest area and number of lakes [3,4]. Previous studies have indicated that increased precipitation and melting glaciers of the QTP have led to a large expansion of the medium lakes (1–100 km2) and large lakes (>100 km2) [5,6]. Due to their rapid and sensitive response to climate and basin hydrological changes, the large lakes in the QTP have gained significant attention from researchers in various fields, including hydrology, atmosphere, geology, and photogrammetry. These lakes have been recognized as valuable indicators of climate change and serve as prominent subjects for global lake research [7,8,9].
In comparison to the numerous large lakes found on the QTP, the QTP is also home to a significant number of small lakes (areas ranging from 0.01 km2 to 1 km2) [10,11,12,13]. These small lakes encompass a range of types, including tectonic lakes, glacial lakes, thermokarst lakes, and artificial lakes [10,11] (Figure 1). The QTP is warming at twice the rate of the global average surface temperature change [6,9]. In this general context, the glaciers on the QTP have melted rapidly, creating many glacial lakes [14,15]. In addition, the increase in temperature has led to a significant increase in the active layer thickness of permafrost, the melting of permafrost and ground ice, the collapse of the ground surface, and the pooling of rainfall and surface runoff to form thermokarst lakes [10,16,17] (Figure 1). Organic carbon is released from melting permafrost as methane and carbon dioxide from the surface of thermokarst lakes [17,18]. The significant increase in the size and number of small lakes may have implications for water balance, permafrost, local climate, carbon cycling, and infrastructure (especially for the railways and roads of the QTP) [10,11,19,20]. Therefore, monitoring the spatio-temporal variability of small lakes in the QTP is crucial for environmental management, water resource management, and predicting flood events.
The area, number, water level, water storage, and change mechanisms of the large lakes of the QTP have been extensively studied [5,6,21,22]. Studies on the size and number of small lakes on the QTP mainly included glacial lakes and thermokarst lakes. More than 30 studies have reported on the area of glacial lakes on the QTP [11,23]. The area and number of thermokarst lakes on the QTP have also been extensively studied in recent years [10,16]. Nevertheless, the previous studies predominantly focused on interannual variations of small lakes, with limited monitoring periods, failing to capture their long-term intra-annual distribution, including the presence of seasonal and permanent water bodies. Previous studies have indicated that the intra-annual variations of small lake water bodies (SLWBs) on the QTP exhibit significant fluctuations influenced by various factors such as glacial ablation, evaporation, differences in seasonal precipitation, and seasonal freezing and thawing [2,24,25]. Therefore, there is a need to monitor the long-term intra-annual seasonal SLWBs on the QTP or in local regions.
Changes in lake water bodies are influenced by both climatic factors and human activities. Climatic factors encompass temperature, precipitation, evaporation, and wind speed. On the other hand, human activities, such as urbanization and its associated impacts, also play a significant role in shaping these changes [26,27,28]. Previous studies have primarily analyzed the driving mechanisms of climate change and human interference in large lakes. Increased precipitation and glacial meltwater were suggested to be the leading causes of the expansion of large lakes [5,29,30]. However, the driving mechanisms of changes in small lakes have received relatively little attention. Meanwhile, there are still research gaps in the interaction effects of different factors on SLWBs. Therefore, the mechanisms of the independent and interactive effects of the factors on SLWBs need to be analyzed.
The Qilian Mountains region (QMR) is located in the northeastern part of the QTP. It serves as the boundary between the arid and semi-arid zones in northwest China, the transition zone between temperature zones, as well as the inland flow area and outflow region. As a significant water production region and ecological security barrier in western China, the QMR plays a crucial role in sustaining the region’s environment and resources [31,32]. In addition, glaciers are widely distributed in the QMR. As a result of glacial shrinkage, small glacial lakes are distributed in the QMR [11,12,33]. The QMR is also dotted with mountain permafrost and is representative of the mountainous permafrost regions of the QTP [34]. The melting rate of permafrost in mountainous areas is expected to accelerate in a warming climate [35,36]. The thawing and settling of the permafrost will cause the number and area of thermokarst lakes to rise. Therefore, there is an urgent need to investigate the changes in SLWBs and their driving mechanisms under glacial ablation and permafrost degradation in the QMR. Focusing on the QMR of the QTP, this study aims to accomplish the following objectives: (1) investigate the spatio-temporal dynamics of SLWBs in the QMR region using a small lake dataset. This analysis includes examining SLWBs with different waterbody frequency thresholds to understand their variations over time and across different locations within the QMR; (2) explore the driving mechanisms behind the long-term changes in SLWBs of the QMR using the Geodetector model. This analysis considers both single-factor effects and the interactions between two factors. Nine underlying drivers, including climate change and human disturbances, are assessed to understand their contributions to the SLWB changes in the QMR. Our research has contributed to the study of the long-term intra-annual seasonal SLWBs in the QMR and even in the QTP.

2. Materials and Methods

2.1. Study Area

The QMR (93°31′~103°54′E, 35°50′~39°59′N) is located in the northeastern QTP and covers the administrative divisions of Gansu and Qinghai provinces (Figure 2). The northwest part of the area has a high elevation, which gradually decreases towards the southeast. The average elevation is about 3660 m. Influenced by the westerly wind belt, the East Asian monsoon, and altitude, the QMR is characterized by a continental plateau climate [31]. The climate in the QMR is typically characterized by cold temperatures and wet conditions, seeing an average annual temperature of −2.1 °C and precipitation of around 366 mm [37]. The QMR has extensive glaciers [38]. Glacial meltwater outflows form the water system of the QMR [38]. The main rivers include the rivers Danghe, Shule, Heihe, Shiyang, and Datong. Due to some differences in climate in different areas of the QMR [39], we assume that there are significant differences in SLWBs and their driving mechanisms in different basins. Therefore, the QMR was divided into six basins to reveal the spatio-temporal patterns and driving mechanisms of SLWBs in each basin. The six basins include the Danghe River and Shule River (DSB), Shiyang River and Datong River Basin (SDB), Beida River and Heihe River Basin (BHB), Haleteng River and Bayinguole River Basin (HBB), Hala Lake Basin (HLB), and Qinghai Lake Basin (QLB) [40].

2.2. Data Sources

We downloaded the intra-annual 30 m SLWB data [42] of five waterbody frequency thresholds (0%, 25%, 50%, 75%, and 100%) for the QMR from 1987 to 2020 (https://doi.org/10.5281/zenodo.7392799, (accessed on 15 December 2022)) from the Zenodo database. The distinct thresholds signify the proportion of images wherein a particular pixel is classified as water, relative to the total count of Landsat observations conducted within a given year. For instance, a threshold of 100% denotes that one Landsat pixel observed during a specific year is identified as a water body. This database has been validated for accuracy and has a high precision [40]. More descriptions can be found in Li et al. [40].
To investigate the mechanism of vegetation cover on small lakes in the QMR, the Normalized Difference Vegetation Index was calculated based on the Landsat surface reflectance data and further used to obtain fractional vegetation cover [27] from 1987 to 2020 (Figure S1a) with the Google Earth Engine platform. Terrestrial water storage (TWS) refers to the total of soil water, lakes, reservoirs, rivers, wetlands, and groundwater [27,43]. The Gravity Recovery and Climate Experiment (GRACE) dataset is a valuable tool for monitoring changes in TWS [44,45]. This dataset has been widely used for monitoring TWS in recent years [46]. We downloaded the latest 0.2-degree monthly scale TWS dataset from the GRACE Tellus website (http://www.csr.utexas.edu, (accessed on 5 January 2022)) during 2002–2016 to analyze the correlation between TWS and SLWBs. For individual missing data, we used the average data of adjacent months instead.
Meteorological data (temperature, precipitation, and wind speed) from 24 stations were downloaded from the China Meteorological Data Service Center (http://data.cma.cn, (accessed on 5 January 2021)). Monthly mean temperature, cumulative precipitation, and mean wind speed from 1987 to 2020 were interpolated by the inverse distance weighted interpolation to obtain 250 m resolution raster data (Figure S1b–d). The 0.0083-degree monthly evaporation data from 1990 to 2019 were downloaded from the National Earth System Science Data Center (http://www.geodata.cn/, (accessed on 6 January 2022)), which is believed to have a high reliability [47] (Figure S1e). The monthly ERA5 dataset from 1987 to 2019 with a resolution of 0.1° × 0.1° in the QMR, including soil water volume and snow depth, was downloaded from the National Cryosphere Desert Data Center of China (http://www.ncdc.ac.cn/portal/, (accessed on 5 January 2022)) (Figure S1f–h). The ERA5-Land dataset provides an accurate picture of past climate conditions [48]. In addition, the trends of the SLWB-related drivers described above were highly spatially heterogeneous in the QMR (Figure S2).
A 1 km annual human footprint dataset (2000–2018) [49] was used to reveal the mechanisms of human activities on SLWBs in the QMR (https://doi.org/10.6084/m9.figshare.16571064, (accessed on 5 May 2022)) (Figure S1i). This dataset was found to be in good agreement with previous datasets [49]. A 30 m Digital Elevation Model dataset of the QMR was downloaded from the National Cryosphere Desert Data Center of China (http://www.ncdc.ac.cn/portal/, (accessed on 5 January 2022)). The HydroSHEDs data used to delineate the basins were downloaded from the website (https://www.hydrosheds.org/, (accessed on 5 October 2021)).

2.3. Methods

2.3.1. Trend Analysis of SLWBs

Details of the intra-annual waterbody frequency calculation can be found in Li et al. [40]. Waterbody pixels in the SLWB database were categorized as ephemeral water bodies if waterbody frequency was greater than 0% but less than or equal to 25% [40,50]. Seasonal water bodies were classified if waterbody frequency was greater than 25% but less than 100%, and permanent water bodies were classified if waterbody frequency equaled 100% [40,50]. Theil–Sen was used to evaluate the trend of the variable. The Mann–Kendall was employed to measure the significance of the trends [51,52,53]. The modified Mann–Kendall is more robust than the original Mann–Kendall because it takes autocorrelation into account [54]. It is generally recognized by the scientific community as outperforming the original Mann–Kendall method and has been used in studies worldwide [55,56]. Therefore, the modified Mann–Kendall was employed to analyze the significance of trends in the changes in lake water dynamics and each influencing factor throughout the study period. Small lakes in the level 8 basins of the QMR provided by HydroSHED were summarized. We used six level 4 subbasins as the assessment unit.

2.3.2. Geodetector Model

The Geodetector was used to analyze the drivers of change in SLWBs. This statistical technique can identify spatial heterogeneity and unveil its determinants [57]. The evaluation of the influence of variable X on Y was evaluated by the q:
q = 1 h = 1 L N h σ h 2 N σ 2
Here, Nh represents the number of cells in stratum h, while N indicates the total range of cells; h refers to the strata of either variable Y or factor X; and σ h 2 and σ2 represent the variances of Y values within stratum h and the entire range, respectively. The q value ranges from 0 to 1. As the value of q increases, the explanatory power of independent variable X on attribute Y becomes stronger [58]. The Geodetector model includes four detectors: factor, ecological, risk, and interaction [57]. The factor detector can obtain the magnitude of the effect of each factor on the spatial variance of the SLWBs [59]. The ecological detector can be used to detect whether there is a significant difference between the effects of two independent variables X1 and X2 on SLWBs. The interaction detector can be used to detect whether the synergistic effect of two factors increases or decreases the effect on SLWBs, or whether they act independently. The risk detector is used to identify whether there is a significant difference between the values of SLWBs corresponding to the subdivision of an independent variable X. More descriptions can be found in Wang et al. [57] and Wang and Xu [58].

3. Results

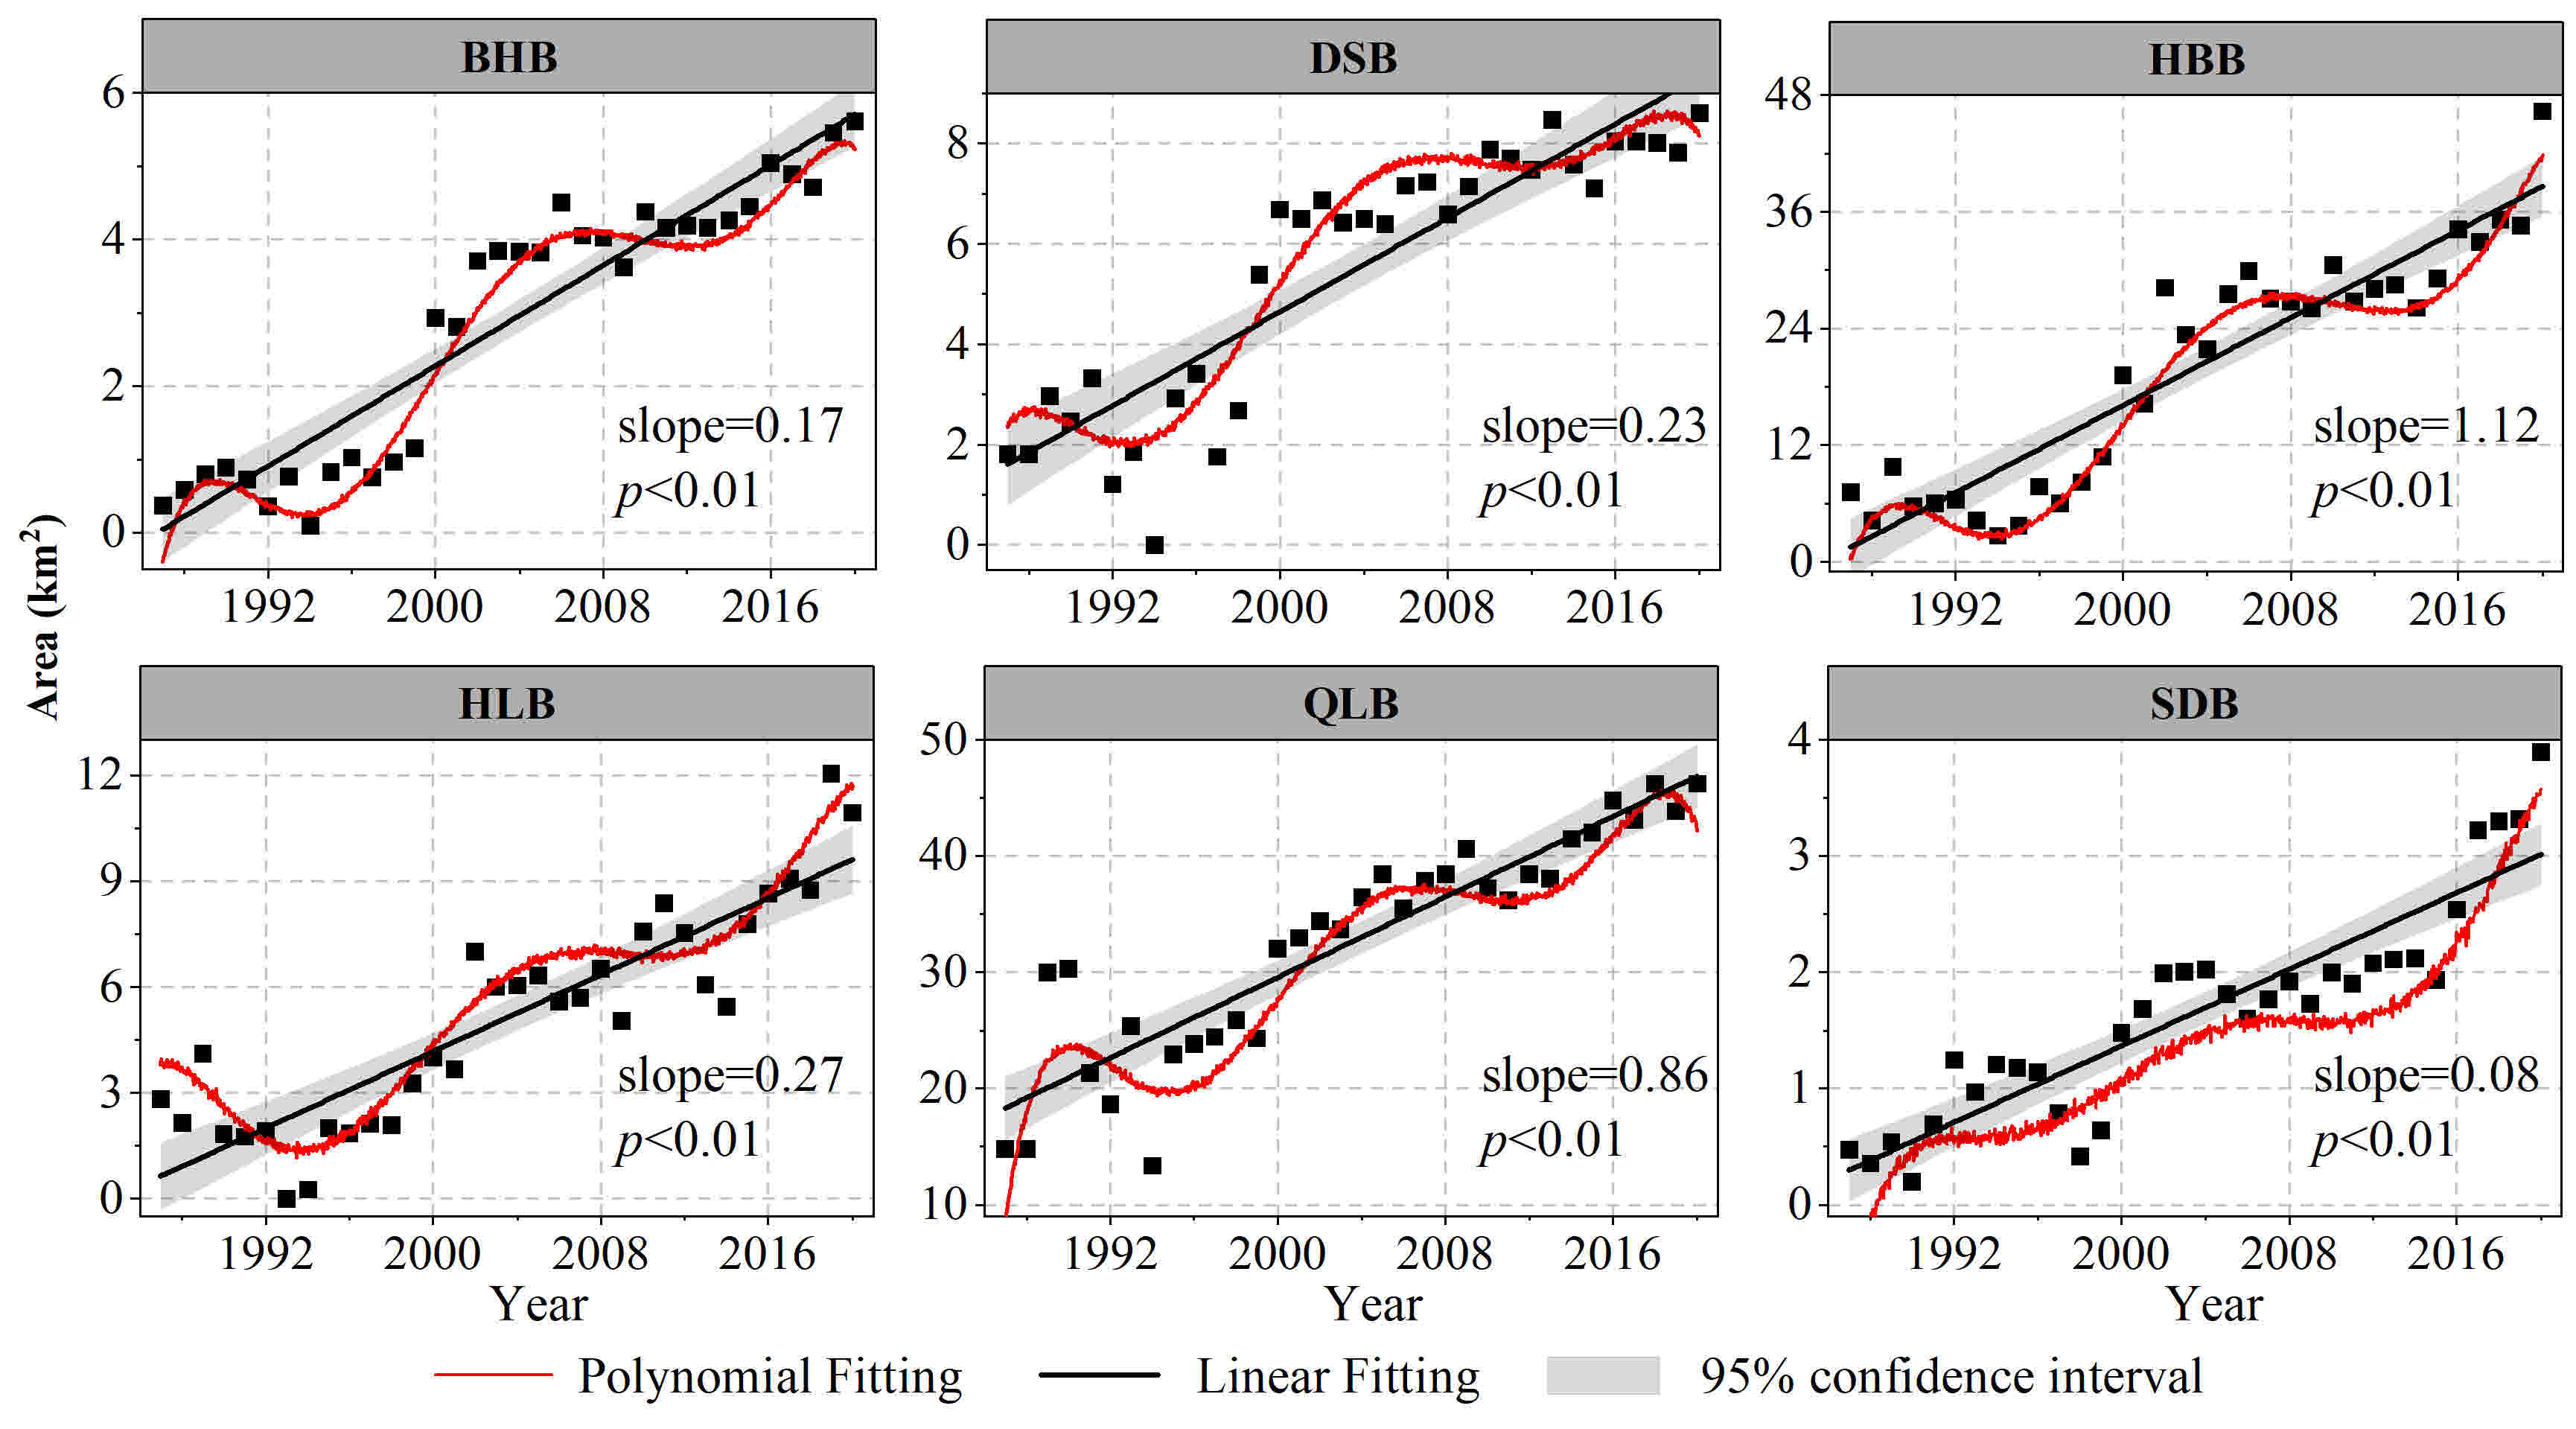
3.1. Temporal Trends in Small Lakes

The variation in the number of small lakes is consistent with their distribution (Figure 3(a1)). The number of lakes in each frequency group first decreased and then increased (Figure 3(a2)). The overall trend of the number of SLWBs was a significant increase from 1987 to 2020, with the most rapid increase at the threshold value of 0% due to the instability of SLWBs and their tendency to fluctuate, of which the average annual increase is about 44 per year. The SLWBs increased most slowly at a threshold of 100%, with an average of 21 per year increase, mainly because the permanent SLWBs were more stable and less volatile. The threshold values of 25%, 50%, and 75% are in between. In addition, the smaller the threshold, the faster the growth rate of the number of lakes.
The variation in the area of SLWBs agrees with their distribution (Figure 3(b1)). The areas of SLWBs under different water body frequency thresholds show a decreasing trend followed by an increasing trend. Overall, there is a significant increase in SLWB areas throughout the entire study period (Figure 3(b2)). The most rapid increase was observed at the threshold value of 0%, with an average increase of 2.70 km2 per year throughout the study period. The threshold value of 100% had the slowest increase, with an average increase of 1.57 km2 per year throughout the period. Overall, the trends in the area and number of small lakes were relatively consistent (Figure 3c). The proportion of the area and number of small lakes in each grade tended to decrease significantly with increasing lake size (0.01 ≤ area ≤ 0.20 km2). This trend is observed across thresholds of 0% and 100% (Figure 3d). Subsequently, the trend remained stable (0.20 ≤ area ≤ 1 km2).
Two typical SLWB thresholds of 0% and 100% were selected for analyzing the intra-annual distribution and inter-annual trend characteristics of the number and area of small lakes of different size grades between 1987 and 2020. The results suggest consistent trends in number and area under different thresholds (Figure 4). In terms of numbers, the proportion of small lakes of each grade remained stable in each year from 1987 to 2020. There were a large number of small lakes with an area of less than 0.10 km2, close to 80%. In terms of size, the area of small lakes with an area of less than 0.10 km2 in each year from 1987 to 2020 was large, about 40%. While the count of larger lakes was relatively small, they accounted for a significant proportion of the total area and remained relatively stable.
The distribution and variation of small lakes with elevation zones for the SLWB thresholds of 0% and 100% between 1987 and 2020 were analyzed. The results suggest that the distribution and variation of the number and area of small lakes with elevation zones were consistent for both SLWB thresholds (Figure 5). Small lakes were mainly located at the altitude zones of 3700–4700 m, with a maximum number and area of about 600 and 36 km2 from 1987 to 2020, respectively. The small lakes varied significantly at the altitude of 3100–3300 m and 4100–4300 m, with a maximum increase of about 420 and 35 km2, respectively. There was some variation in the distribution characteristics and variation of small lakes in terms of altitude. The higher the altitude, the greater the variability.

3.2. Spatial Pattern of SLWB Variation in Each Basin

Overall, most of the small lakes expanded over the past 34 years, except for a few small lakes that were shrinking. There were far more expanding than shrinking lakes (Figure 6). We calculated the rate change of the SLWB area, which is the percentage of change in the SLWB area to the original value. A positive change rate indicates an expanding rate, while a negative change rate signifies a shrinking rate. The change rate of most expanding lakes exceeded 100% over 34 years. Expanding lakes were concentrated in the central-western region of the QMR. Shrinking lakes were densely distributed in the central QMR and the southeastern part at lower elevations.
There were 1989 expanding lakes using a threshold of 0%, accounting for 90.86%, and 200 shrinking lakes, accounting for 9.14% (Figure 6a,e). The largest number of lakes (1639) had an expansion area of less than 0.06 km2, which accounted for 82.40% of the entire lakes. Among all shrinking lakes, the majority had a shrinking area in the range of 0.01–0.02 km2 (83), accounting for 3.79%. At the threshold of 0%, the number of lakes with an expansion rate greater than 100% was the largest (1629), accounting for 77.71% (Figure 6c,g). Among all the shrinking lakes, the largest number of lakes (143) with a shrinkage rate >100% accounted for 6.53%.
We found 1082 expanding lakes (79.15%) and 285 shrinking lakes (20.85%) with a threshold of 100% (Figure 6b,f). The largest number of lakes (830) had an expansion area of less than 0.06 km2, which accounted for 60.75% of the entire lakes. Among all shrinking lakes, the largest number of lakes (124) with a shrinking area between 0.01 km2 and 0.02 km2 accounted for 9.07% of the entire lakes. The number of lakes with a shrunken area between 0.02 km2 and 0.03 km2 was the least (34), accounting for only 2.49%. The lakes with an expansion rate >100% had the largest number (971), accounting for 71.03% (Figure 6d,h). Among all the shrinking lakes, the lakes with shrinking rates ranging from 34.78% to 100% had the largest number (207), accounting for 15.14% among the entire lakes. In addition, the change in the SLWB area for each basin was broadly consistent with the QMR for the two SLWB thresholds of 0% and 100%.

3.3. Trends in Permanent and Seasonal SLWBs in Each Basin

3.3.1. Annual Trends of the Permanent SLWB Area

There was a significant increasing trend in the permanent SLWB area of all six basins (Figure 7). The rate of increase was greatest in the HBB, followed in order by the QLB, HLB, DSB, BHB, and SDB. The large increase in the HBB (average rate of 0.76 km2 per year) was probably due to its dense lake distribution. The slowest growth rate, observed in the SDB (with an average rate of 0.04 km2 per year), can be attributed to its relatively limited distribution of smaller lakes, which remained relatively stable over time.

3.3.2. Annual Trends of Seasonal SLWB Area

The seasonal SLWB area in all six basins (Figure 8) demonstrates a significant increasing trend (p < 0.01). The growth rate decreased from the HBB to the QLB, HLB, DSB, BHB, and SDB. The HBB increased faster with a 1.12 km2 per year. The slowest growth rate was in the SDB at 0.08 km2 per year. This observation could be attributed to the relatively lower number of small lakes in the SDB, making them less susceptible to the influences of precipitation and river inflow. As a result, the seasonal changes in the water column of these lakes were relatively smaller. In addition, the area of seasonal SLWBs in each basin was increasing more rapidly than permanent SLWBs.

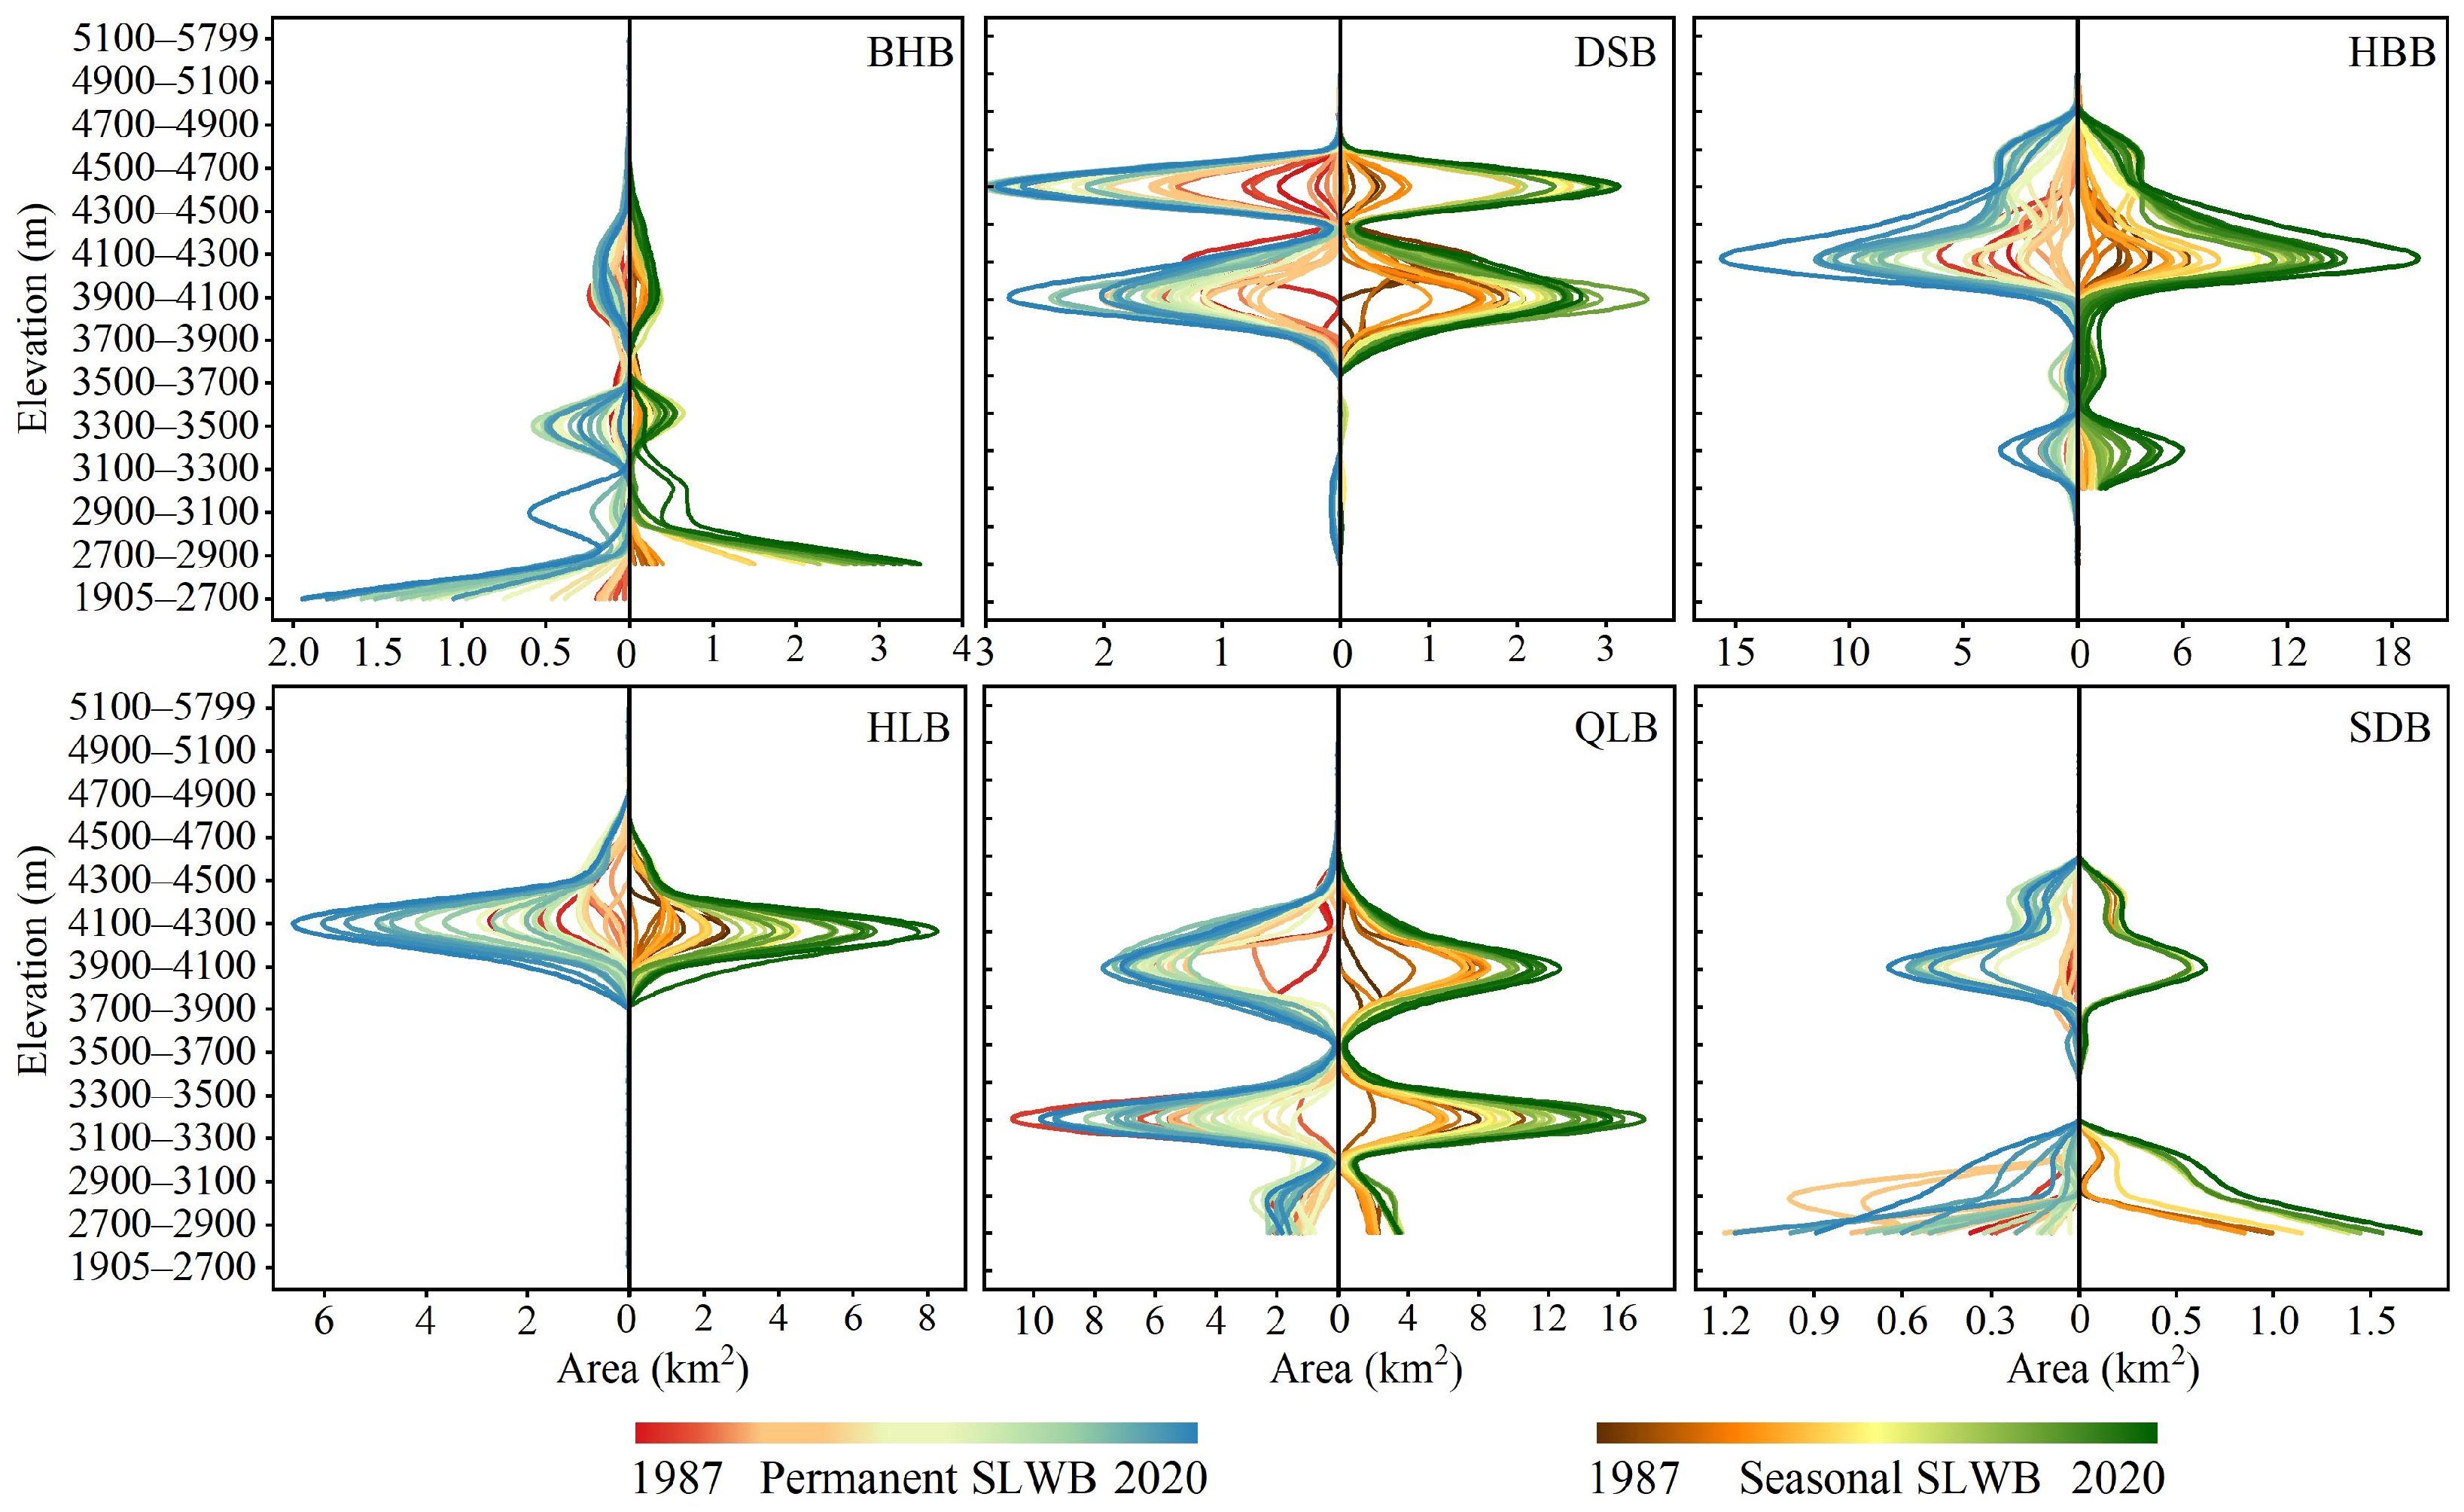
3.4. Distribution and Trends in Permanent and Seasonal SLWBs with Elevation Zones in Each Basin

The area of permanent and seasonal SLWBs under each basin shows a large variability with elevation (Figure 9). The permanent and seasonal SLWBs of the BHB were distributed below 4500 m.a.s.l. and reached a maximum at elevations below 2700 m. The permanent and seasonal SLWBs of the DSB, HBB, and HLB were primarily located at high altitudes. Permanent and seasonal SLWBs in the DSB and HBB show a bimodal distribution with elevation. The permanent and seasonal SLWBs of the HLB show a unimodal distribution with elevation. The permanent and seasonal SLWBs of the QLB and SDB were mainly located at medium and low elevations. Additionally, their distribution concerning elevation exhibited a distinct bimodal pattern. The distribution characteristics of permanent and seasonal SLWBs with elevation were consistent under the same basin.
There was some difference in the area change of permanent and seasonal SLWBs with elevation in each basin (Figure 10). Small lakes with different elevations under each basin have greater area variation in seasonal water bodies than permanent water bodies. Permanent and seasonal SLWBs in the basin show an increasing trend within each elevation zone, except for the BHB where permanent and seasonal SLWBs decreased at 3300–4100 m and 3500–3700 m, respectively. The most significant increases were seen in the HBB and QLB and the smallest in SDB. The permanent and seasonal SLWBs of the BHB and SDB were highly variable at lower elevations. In contrast, the DSB, HBB, and HLB demonstrated high variability at higher elevations. The permanent and seasonal SLWBs of the QLB were highly variable at around 4000 m.a.s.l. and 3200 m.a.s.l.

3.5. Drivers to SLWB Changes

3.5.1. Individual Effect of Influencing Factors

The Geodetector method was chosen to detect the effects of nine factors (temperature, precipitation, wind speed, evaporation, soil water volume, runoff, snow depth, fractional vegetation cover, and human activities) on the SLWB variation. We analyzed the individual influence of each indicator on SLWBs with the factor detector. The q value (Equation (1)) of the factor detector can reflect the explanatory power of the driver for SLWBs. Taking the QMR as a whole, the q value of each factor to SLWB change exhibited a marked distinction. The q values were runoff (0.60), snow depth (0.53), temperature (0.52), precipitation (0.50), evaporation (0.50), soil water volume (0.46), fractional vegetation cover (0.45), human activities (0.43), and wind speed (0.39). The driving mechanisms of SLWB change in each basin were also analyzed (Figure 11). The result demonstrates that individual factors influenced each basin differently. Different basins were also influenced by different driving factors. Additionally, the basins that were most influenced by the nine factors were, in order, SDB (0.71), DSB (0.42), HBB (0.35), BHB (0.33), HLB (0.30), and QLB (0.23). This means that the nine drivers had more influence on SLWBs in the SDB and DSB. However, the influence of the nine drivers on the QLB was relatively lower.

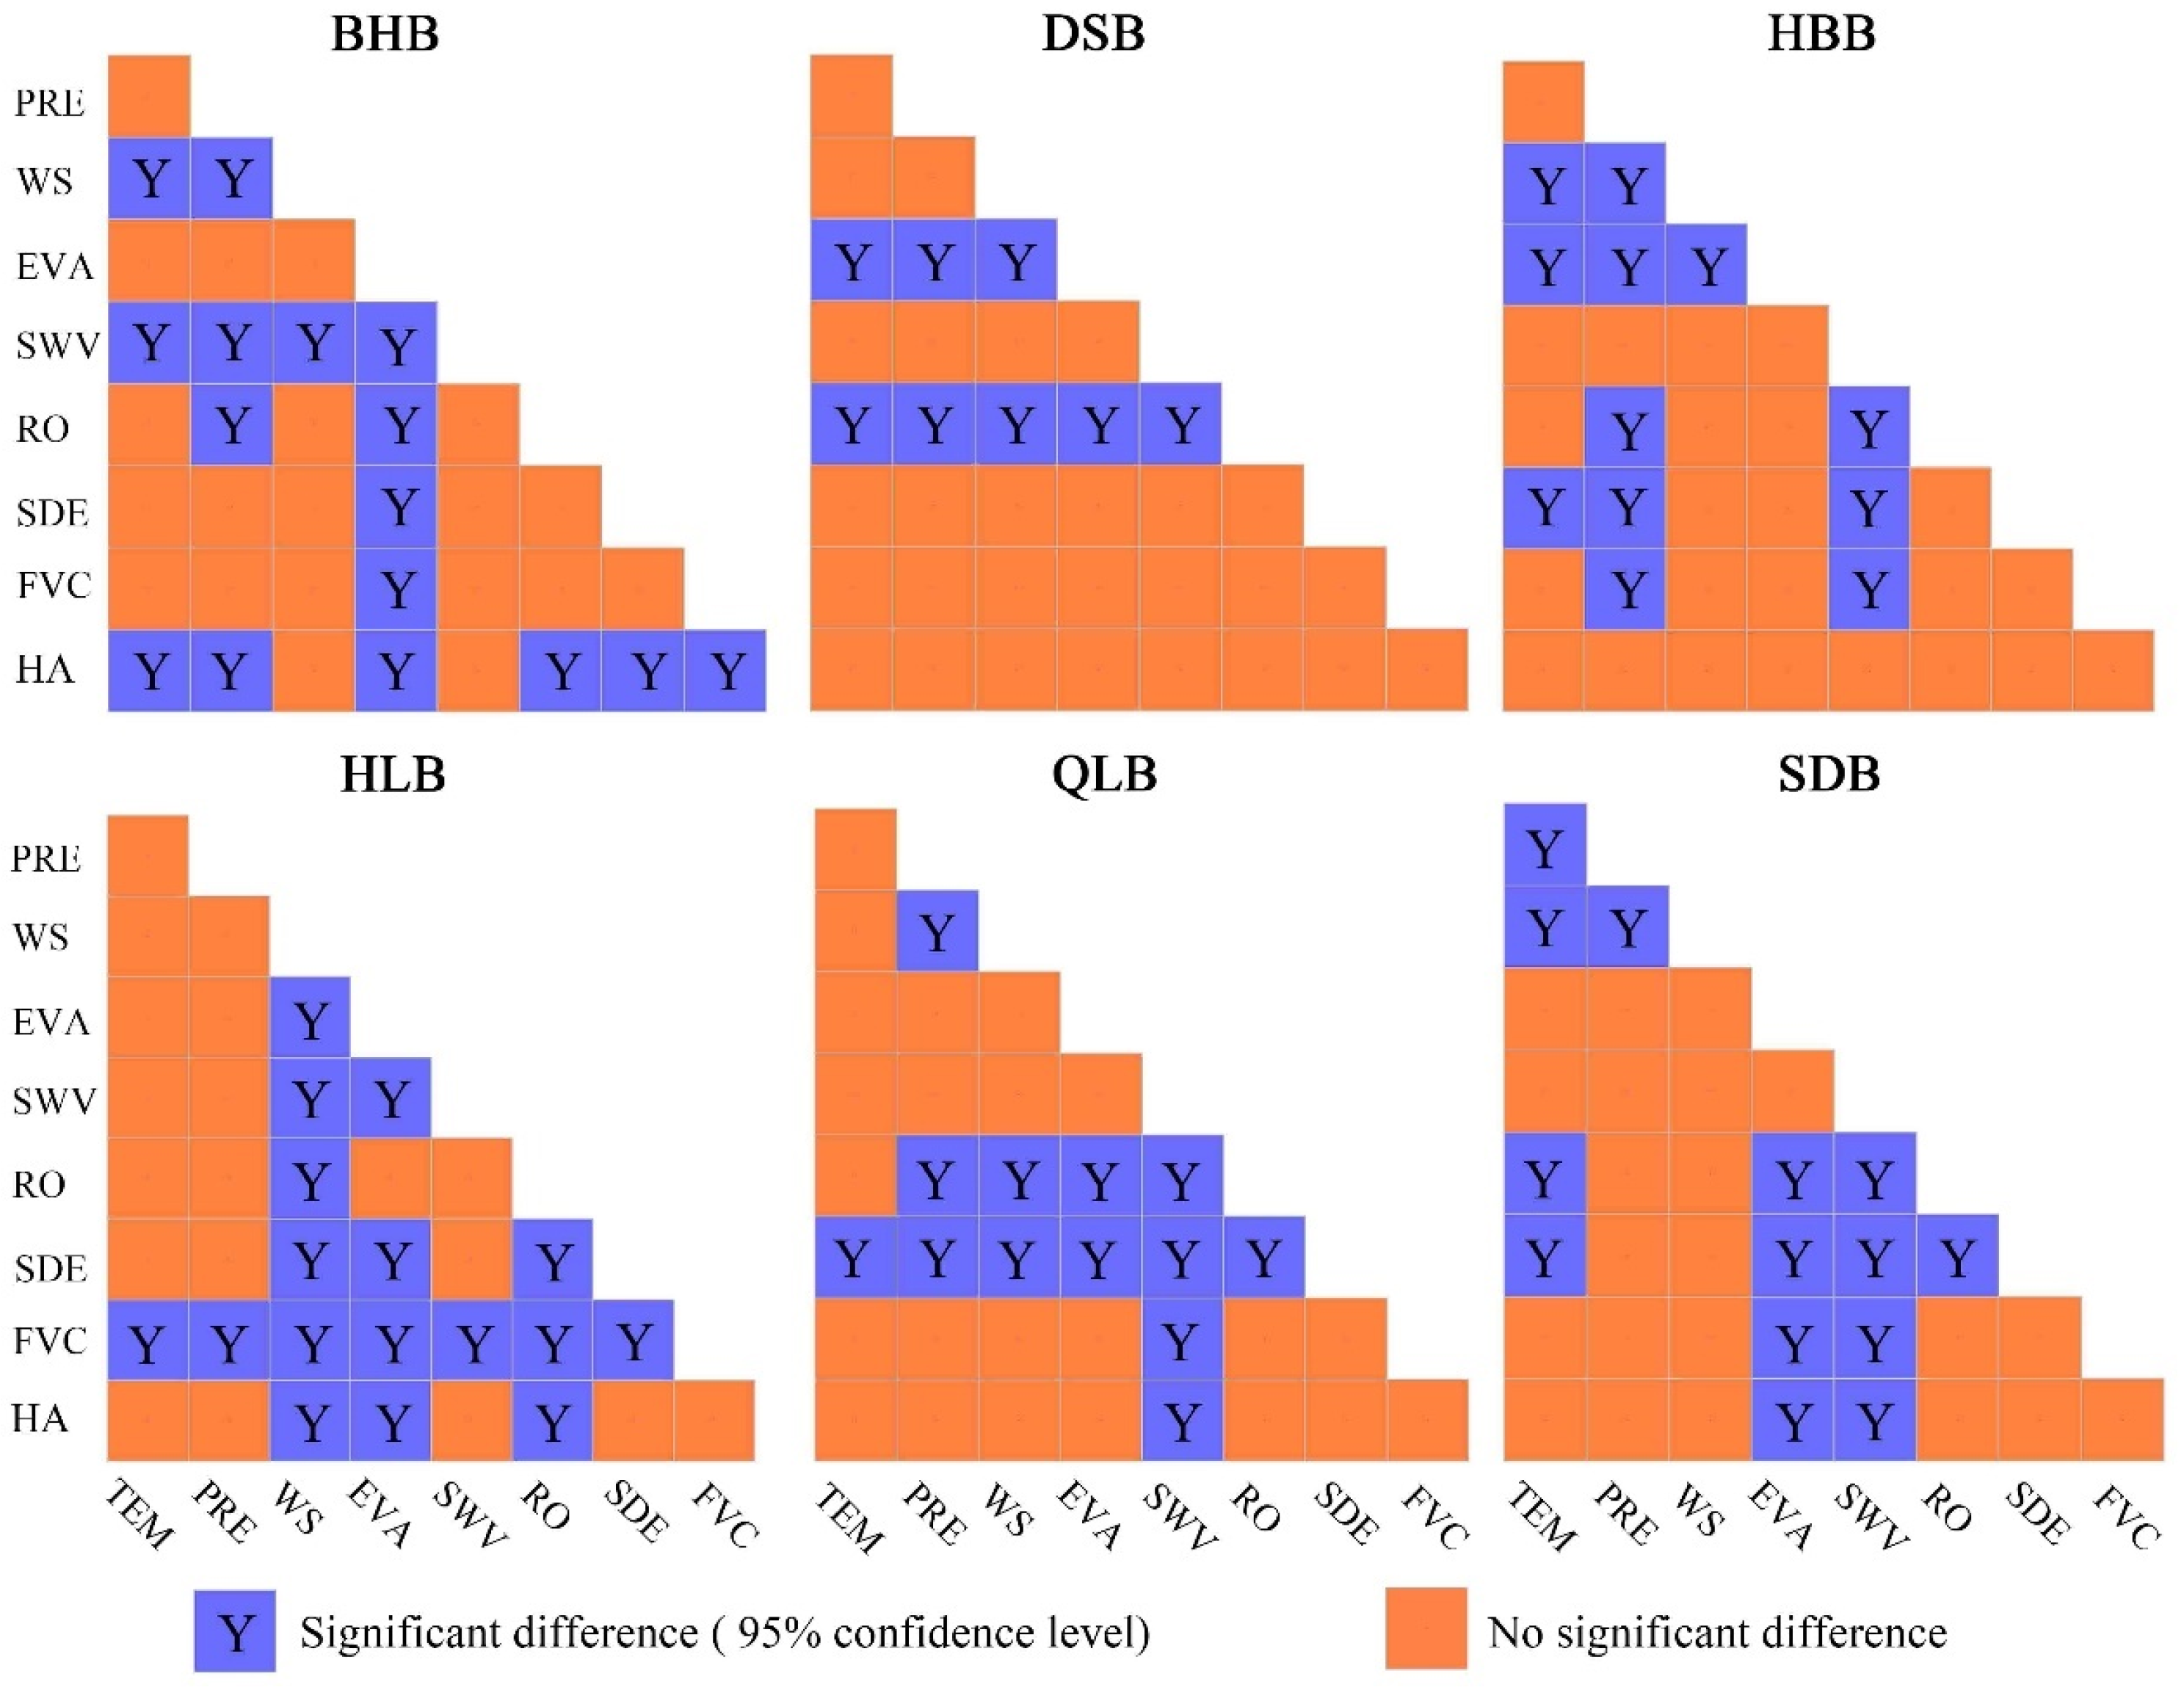
3.5.2. Analysis of the Effect of Two Factors in Different Basins

The ecological detector was used to analyze whether there were significant differences in the effects of the double factors on SLWBs. We used the ecological detector to analyze whether there were significant differences in the effects of the two factors on SLWBs. There are significant differences between the factors within each basin (Figure 12). The ranking according to the number of significant differences is HLB (17), BHB (16), SDB (14), QLB (13) or HBB (13), and DSB (8). The results suggest that the effect of two factors on the spatial variation of SLWBs in the HLB and BHB differs significantly. Conversely, in the case of the DSB, the opposite trend is observed.

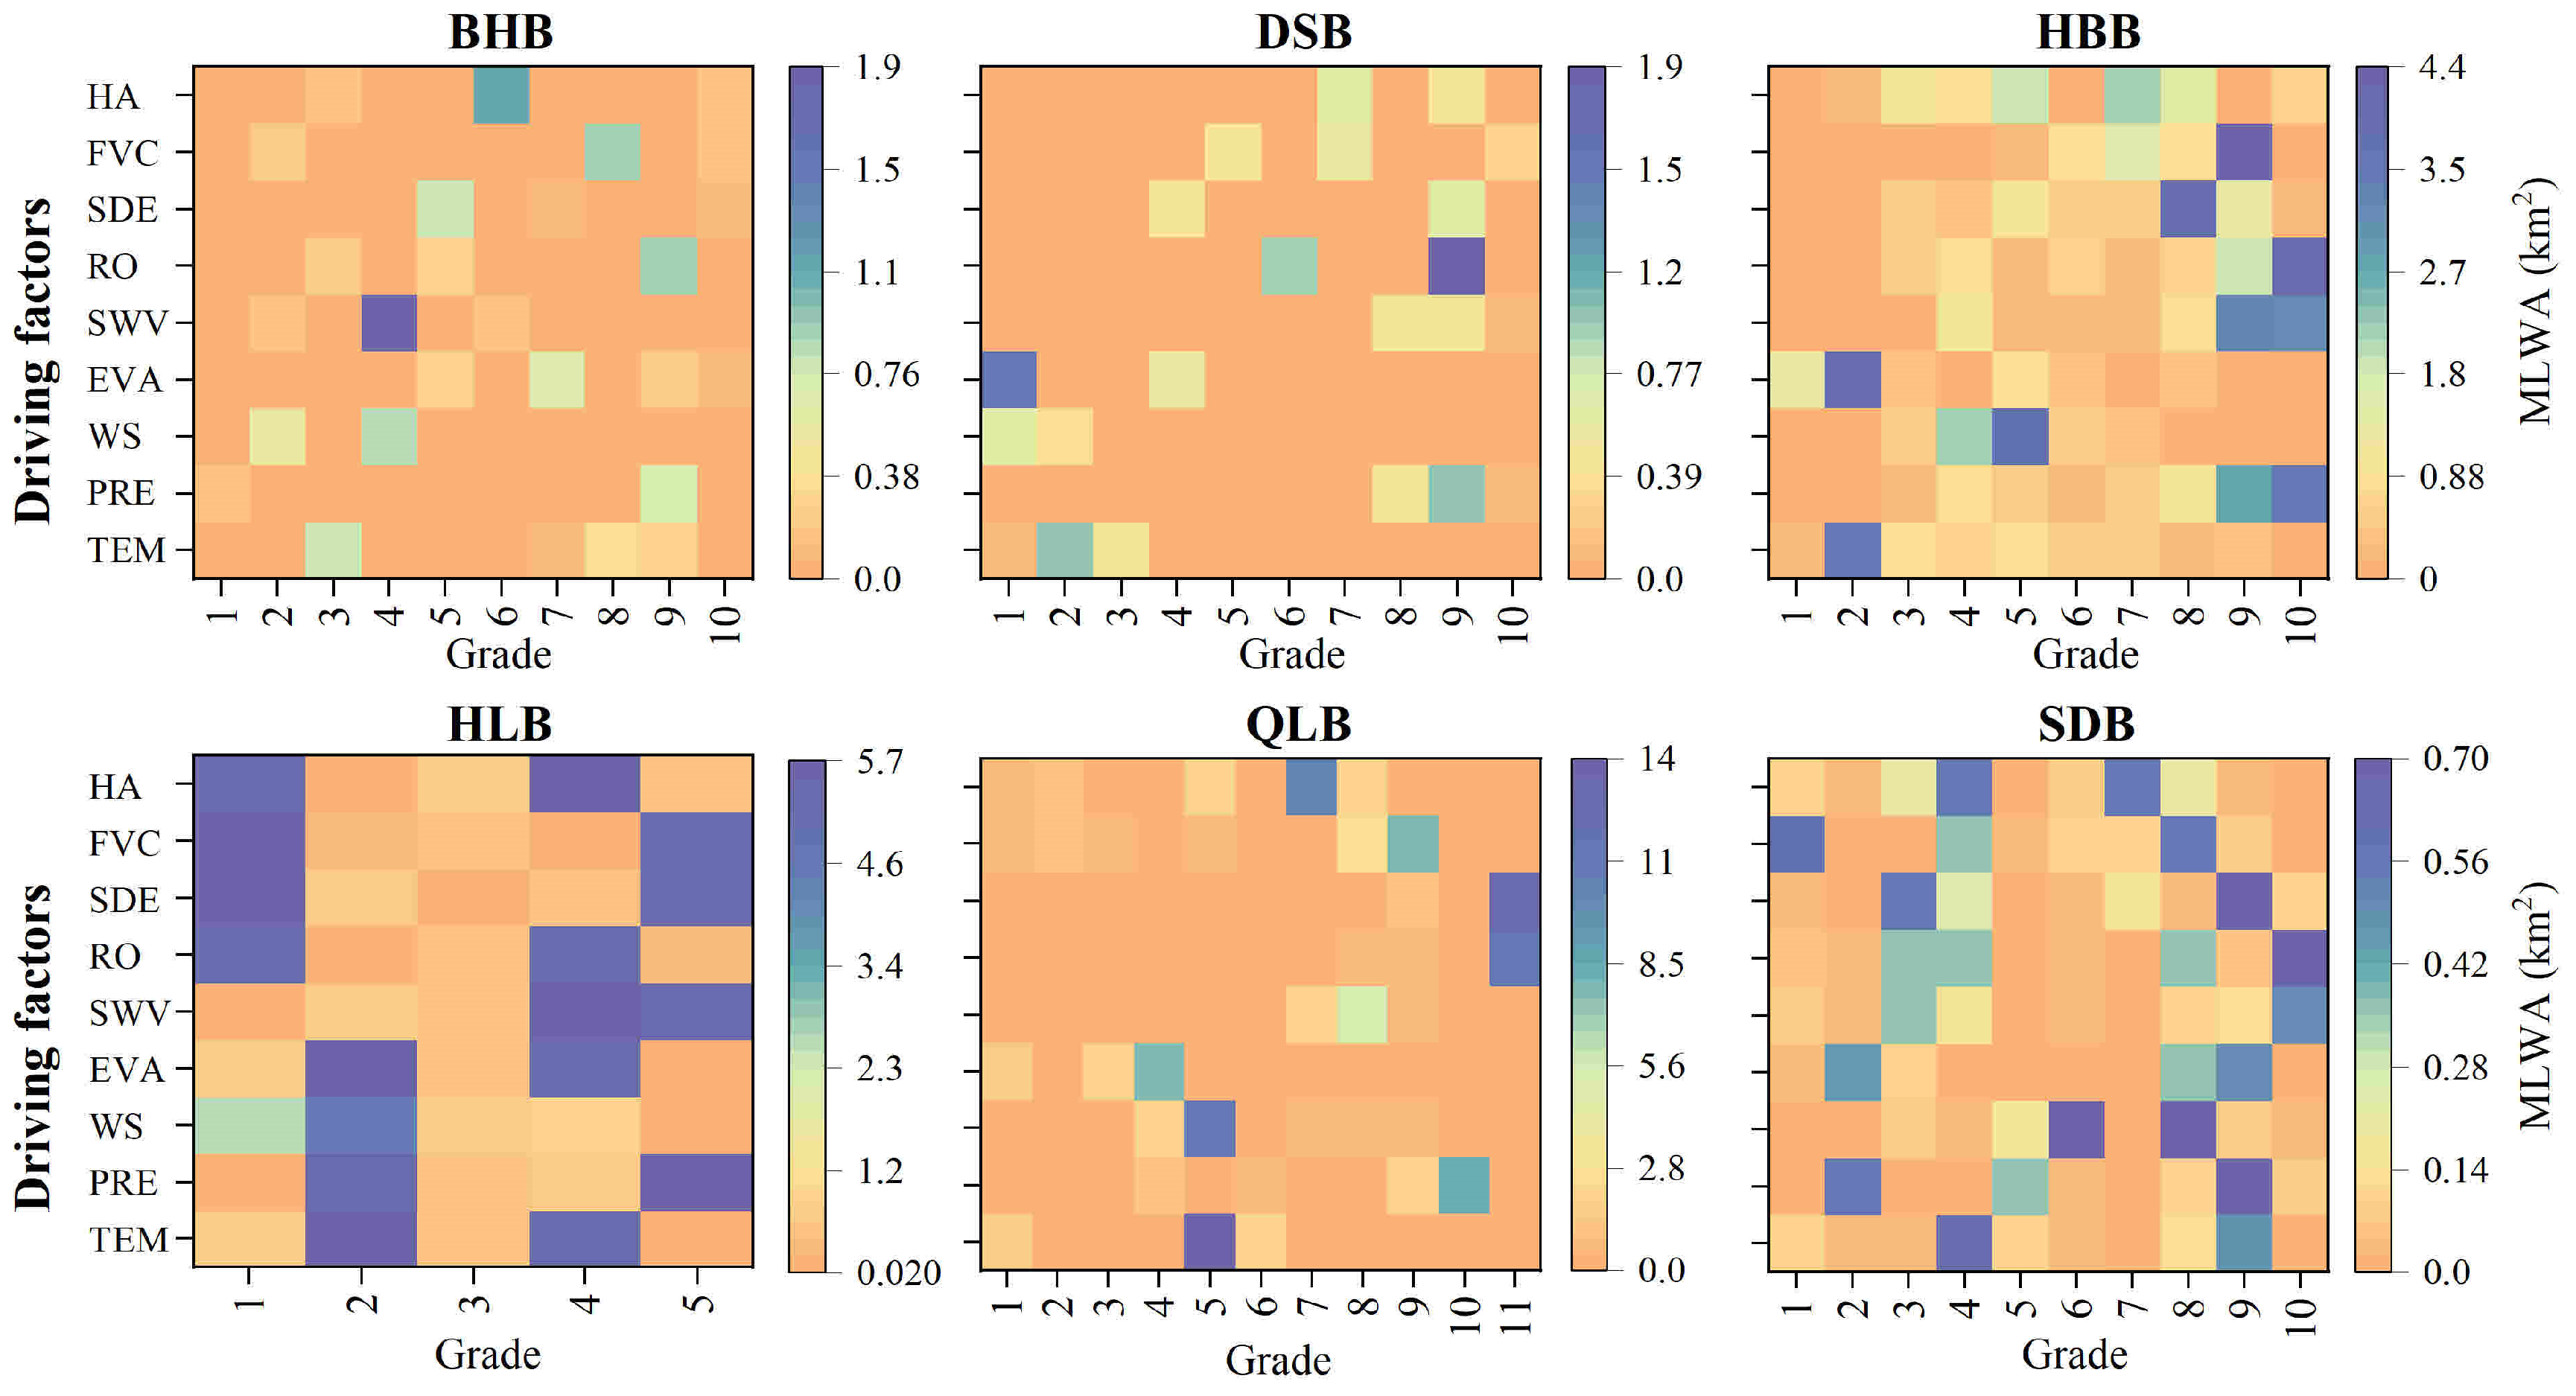
3.5.3. Non-Linear Effects of Factors

This study also assessed the non-linear impacts of drivers on SLWBs. The analysis based on the risk detector unveiled the optimal type and range of factors that are conducive to maintaining the maximum SLWB area in the QMR (Figure 13, Table S1). A higher mean lake water area (MLWA) indicates more abundant water resources and more positive characteristics of the factors. In addition, the MLWA of different factors varies greatly, and the values of response variables also differ in different basins. For the whole QMR, the MLWA first tends to increase with increasing temperature and wind speed, reaching a maximum in level 5 (1.73–2.74 °C, 1.86–2.09 m·s−1, respectively), and then tends to decrease (Figure S3). With the increase of evaporation, MLWA showed a trend of increasing and then decreasing, reaching the maximum at evaporation level 4 (440–496 mm). The larger the values of precipitation, runoff, and snow depth, the larger the MLWA. In addition, the remaining soil water volume, fractional vegetation cover, and human activities roughly tended to increase the MLWA as their levels increased before level 8. Overall, temperature, wind speed, and evaporation were negatively correlated with the MLWA, while the other factors were positively correlated with the MLWA. The optimal ranges for temperature, precipitation, wind speed, evaporation, soil water volume, runoff, snow depth, fractional vegetation cover, and human activities were 0.91–1.82 °C, 252–368 mm, 1.67–1.75 m·s−1, 482–516 mm, 15.46–16.57 m3·m–3, 0.01–0.02 m, 0.96–1.29 m, 0.29–0.33, and 4.91–5.76, respectively (Table S1). However, the optimum range of each driver varies considerably across catchments.

3.5.4. Interaction Effects of Influencing Factors

The contribution of the factors interacting with each other to the changes in the SLWBs of the basins over the study period was further analyzed. There was a significant synergistic enhancement between all the dominant factors, and there was no factor that acted independently (Figure 14). In other words, the synergistic effect of the two factors on SLWBs was greater than the single factor. This further supports the dominant effect of each of the above factors on SLWBs. For the entire study region, the top three interactions with the strongest contribution to the change in SLWBs were precipitation ∩ human activities (0.88), temperature ∩ fractional vegetation cover (0.87), and runoff ∩ human activities (0.85). For each basin, there exist differences in the top three interacting factors that contributed most to the change in SLWBs. This indicates that the same interaction factor affects each basin differently. And there are also differences in the influence of the interaction drivers for different basin recipients. In addition, the basins were affected by the interaction contribution in the following order: SDB (0.92), DSB (0.83), HLB, (0.82), BHB (0.81), HBB (0.72), and QLB (0.54).

4. Discussion

4.1. Spatio-Temporal Variation Patterns of SLWBs

Our research findings reveal a previously unreported trend in the quantity and size of small lakes in the QMR (both in permanent and seasonal water bodies) from 1987 to 2020. We observed a pattern of initial decline followed by subsequent growth, indicating an overall significant upward trend. The reliability of this conclusion is indirectly supported by the study of large lakes on the QTP [5,60,61,62]. These studies also indicated a notable decrease followed by a significant increase in the areas of large lakes across the QTP over the past three decades. This trend aligns with the observed changes in small lakes identified in our study. For example, Li et al. [63] conducted a study monitoring the spatial changes of lakes larger than 0.50 km2 in the northeastern Qaidam Basin of the QTP. Their research revealed a significant decline in both the number and area of lakes between 1990 and 2000. Remarkably, the most significant expansion occurred during the period between 2000 and 2015. Li et al. (2021) [64] found that the area of 34 lakes (>10 km2) in the northeastern QTP showed a decreasing trend until the mid-1990s, followed by a rapid expansion trend. Expanding lakes were mostly located in the central-western part of the QMR, where glaciers and permafrost are located. With global warming and human activities, the increasing meltwater from the degradation of glaciers and permafrost has increased the area and number of small lakes. Shrinking lakes were mainly in the lower elevations of the central and southeast QMR, where the increase in temperature and evaporation caused the area and number of SLWBs to decrease significantly.
This study found that TWS was not significantly and positively correlated with SLWBs during the period 2002–2016 (Figure 15). SLWBs in the south of the QMR had a greater impact on TWS than in the north. For each basin, the HBB and QLB were positively correlated, and only HBB passed the significance test. The DSB, BHB, HLB, and SDB were negatively correlated, and all failed the significance test. This indicates that in the HBB, dynamic changes in SLWBs may directly affect TWS.

4.2. Driving Mechanism of SLWB Changes

Studies have highlighted the dominant influence of climate variations on changes in large lakes across the QTP [60,65,66]. These findings indicate that the expansion of large lakes in the QTP is primarily driven by increased precipitation and the substantial contribution of the cryosphere to the region’s water balance [60,65,66]. Our conclusion shows that runoff, snow depth, and temperature were the main factors driving changes in SLWBs. This phenomenon may be attributed to the dominance of glaciers as the primary water source in the QMR. The glacial meltwater contributes to the formation of the Qilian Mountains’ water system, which includes dense rivers and wetlands [39]. Consequently, a significant amount of surface runoff is generated in the region. Studies have indicated that the QMR has undergone an accelerated loss of glacial mass since the 21st century [67,68]. Consequently, there has been a significant rise in both surface and subsurface runoff from the QMR. Additionally, the increased precipitation also leads to a relative increase in the runoff of the QMR, which eventually accumulates directly in the small lakes.
The entire QTP generally experienced warmer temperatures from 1998 to 2018 compared to the period of 1980–1997 [5]. Surface temperatures in the regions below about 5000 m.a.s.l. and 2 m from the surface exhibited a rapid increase [5]. Warmer temperatures altered the distribution of air pressure on the plateau, leading to an intensified and northward-shifted monsoon movement. This, in turn, resulted in increased precipitation in the QMR and further expansion of the SLWBs [69]. The QMR is characterized by permafrost and seasonally frozen ground. However, the rising temperatures in the region can cause the thawing of permafrost [70]. This thawing process increased subsurface runoff and provided abundant water resources for SLWBs [71,72] (Figure S4). As the frozen ground thaws, the underlying soil loses its stability, causing the surface to sink and form depressions or sinkholes. Since the beginning of the 21st century, there has been a substantial increase in precipitation in the QMR. This increased precipitation has accumulated in the surface depressions caused by permafrost melting, leading to the formation of numerous small lakes [37]. Furthermore, due to the high altitude of the QMR, the average year-round temperature remains low. This causes precipitation to exist primarily in the form of snow. When the snow melts, it tends to collect in the small lakes formed by surface depressions, leading to changes in their size and number. The melting of snow contributes significantly to the water input of these lakes, further influencing their hydrological dynamics.
Studies indicated that the influence of human activities on large lakes was small [5,66,69]. Yang et al. [69] conducted a study to determine the contribution of different factors to the change in the water volume of Qinghai Lake, using a water balance approach. Their analysis revealed that climate change accounted for 97.55% of the observed variations, while local human activities contributed only 2.45% to the overall changes in the lake’s water volume. And the result of this paper also shows that human activities had a small impact on the SLWBs in the high-elevation regions of the QMR. The limited impact of human activities on the small lakes in the QMR can be attributed to several factors. Firstly, the majority of these lakes are located in closed endorheic areas at high elevations, which makes them less susceptible to disturbance from human activities due to their geographical isolation. Secondly, the QMR is sparsely populated due to its challenging topography, harsh climate, and other natural factors. The low population density further reduces the potential impact of human activities on the SLWBs in the region. Lastly, China recognized the importance of protecting water resources and other natural resources in the QMR. In 1988, the “Qilian Mountains National Nature Reserve” was established, aiming to enhance the conservation and preservation of the region’s natural resources. This reserve plays a crucial role in limiting the impact of human activities on the SLWBs by implementing strict regulations and management practices. Together, these three factors contribute to the limited influence of human activities on the SLWBs in the QMR, allowing the small lakes to maintain their ecological integrity and water balance.
Most of the previous studies [60,65,66] analyzed the driving mechanism of lake waters on the QTP from the perspective of single factors (e.g., temperature, precipitation, or evaporation). The interactive effects of multiple factors on SLWBs have received little attention. The analysis of the contribution of two-factor interactions to SLWB change suggests that the effects of dual-factor enhancement and nonlinear enhancement were greater than those of a single factor. The same results were obtained in the Irtysh River Basin [27] and Changbai Mountain [46].

4.3. Uncertainties and Prospects

Several uncertainties remain to be resolved in this study. Firstly, permafrost and seasonally frozen ground are widely distributed in the QMR; thus, a detailed study of the interaction between permafrost melt and lake expansion is crucial. Studies have suggested that permafrost is thinning and may become intermittent with global warming. Groundwater generated from permafrost degradation probably promoted lake expansion [30], but this is difficult to quantify. The monitoring of permafrost degradation and meltwater release in the study area is difficult because the processes are very slow and difficult to observe directly. Quantifying the contribution of permafrost melting to SLWB expansion will be a focus of our future work.
Second, glaciers in the QMR have also undergone enhanced melting and shrinkage as a consequence of climate warming. Glacial meltwater fills the lakes as runoff and contributes to lake expansion, especially in regions north of the 33°N [73]. The critical impact of changes in glacial meltwater and snowmelt processes on lake water storage remains to be further quantified [74,75].
Again, the QMR is located in the alpine region of the QTP. During the winter and early spring, the small lakes in the QMR become coated with ice. It is important to note that these small lakes can undergo significant fluctuations in size, particularly during the period when the lake ice begins to melt [76]. When monitoring changes in permanent and seasonal water levels of small lakes throughout the year, it is essential to consider the shrinkage or expansion of the lake during periods when the lake is covered by ice. Nevertheless, the vector data representing small lakes used in this study encountered challenges in accurately extracting lake boundaries during the freezing period [40]. Hence, in subsequent studies, we intend to employ the Global Navigation Satellite System interferometric reflectometer [77] in conjunction with optical imaging and other advanced techniques to extract and monitor the lakes during the period of ice formation. This integrated approach will enable us to improve the accuracy and effectiveness of lake extraction.
Finally, it was challenging to obtain comprehensive observational data, aside from the available weather station data, during the study period. There is a significant presence of missing data for certain years, which can result in the inability to align the years of the selected indicator factors with the corresponding SLWB data. As a consequence, this mismatch reduces the accuracy of the final execution of the Geodetector model. Considering this, we opted to employ data from neighboring years as substitutes for the years with fewer missing values. For instance, we replaced the missing data for 2020 with ERA5 data from 2019. While this approach may introduce some degree of error in investigating the driving mechanisms, the manageable amount of missing data and the relatively stable nature of the indicator factor data over several years ensured that the missing data for individual years did not exert a significant impact on the study results.

4.4. Implications

Our study revealed the first-ever trend of SLWBs in the QMR. Through Geodetector analysis, we examined the independent and interactive effects of nine factors on SLWBs. This research lays a theoretical foundation for understanding the internal mechanisms driving SLWB changes in other regions worldwide. Specifically, the latest study indicated that 53% of the water bodies in large lakes and reservoirs around the world have significantly reduced water storage [78]. Contrary to the global trend, our study revealed an increasing pattern in the area and the number of small lakes in the QMR. This finding provides a unique perspective for understanding the dynamics of small lakes in a specific region. In the context of global warming, it raises the question of whether similar trends can be observed in other highland mountainous regions. Further research is needed to explore and compare SLWB trends in different regions and their relationship with global climatic changes. Our study identified runoff, snow depth, and temperature as the primary drivers of SLWB variability in the QMR. However, further investigation is required to determine whether these drivers hold true for other regions worldwide, such as the Alps and the Himalayas. Understanding the consistency of the main drivers of SLWBs in different regions is crucial. By establishing these main drivers, our study provides a methodological foundation for future research on the mechanisms underlying SLWB variability.
Furthermore, our research findings hold significant implications for Chinese policymakers and stakeholders, particularly in highland mountain regions like the QTP. These findings can aid in the development and implementation of water planning and policies to address challenges such as flood disasters, unprecedented droughts, and the impacts of climate variations. Specifically, our study highlights the need to address the damage caused to roads and railroads in the QMR due to the rapid expansion of small lakes. It also underscores the importance of rationalizing the allocation of water resources in small lakes to mitigate the impact on agricultural and livestock economies caused by fluctuations in their volume throughout the year. There is a need to tackle the increase in carbon dioxide and methane emissions resulting from the significant growth in the volume of thermokarst lakes within small lakes. Additionally, it is important to consider that the expansion of the area and the number of small lakes can lead to a reduction in the surrounding grasslands and pastures. The surface runoff resulting from the melting of snow and ice can cause erosion of grassland vegetation and adversely affect grassland ecosystems. Therefore, policymakers and stakeholders must be aware of the ecological consequences associated with the changes in small lakes.

5. Conclusions

We analyzed the spatio-temporal changes of SLWBs in the QMR and investigated the driving mechanisms of single-factor and two-factor interactions of long-term changes in SLWBs. The conclusions demonstrated that the count and expanse of small lakes displayed a decline, followed by an ascending pattern, which is consistent with the trend of large lakes in the QTP. There were far more expanding than shrinking lakes in each basin. The expanding lakes were concentrated in the central-western part of the QMR, which are above 4 km in elevation. The shrinking lakes were mainly clustered in the central and southeastern regions of the QMR at lower elevations. The area of seasonal SLWBs in each basin was increasing more rapidly than permanent SLWBs. Runoff, snow depth, and temperature contributed the most to SLWB changes, followed by precipitation, evaporation, and soil water volume. Fractional vegetation cover, human activities, and wind speed contributed the least. The individual factors had different influences on each basin, and the most influencing driving factor also varied among different basins. The impact of double-factor interactions on SLWB changes in basins was found to be more significant than that of onefold factors. We will investigate other potential drivers of SLWB changes in future studies in combination with field surveys and techniques such as isotopes.

Supplementary Materials

The following supporting information can be downloaded at https://www.mdpi.com/article/10.3390/rs15143604/s1. Figure S1: Spatial distribution of nine factors of water body change in small lakes. Figure S2: Spatial trends of the nine factors of water body change in small lakes. Figure S3: Relationships between MLWA and the nine factors in the QMR. Figure S4: Temporal trends of the nine factors of SLWB change in the QMR from 1987 to 2020. Table S1: Suitable ranges of the driving factors in the different subregions (95% confidence level).

Author Contributions

Conceptualization, C.L. and S.Z.; methodology, C.L. and R.C.; software, C.L.; validation, C.L.; formal analysis, S.Z.; resources, C.L.; data curation, D.Z., W.L. and T.R.; writing—original draft preparation, C.L.; writing—review and editing, S.Z.; visualization, G.Z.; supervision, S.Z.; project administration, S.Z.; funding acquisition, S.Z. All authors have read and agreed to the published version of the manuscript.

Funding

This research has been funded by the Second Tibetan Plateau Scientific Expedition and Research Program (STEP; grant no. 2019QZKK0201) and the China National Natural Science Foundation (grant nos. 41730751 and 42171124).

Data Availability Statement

Not applicable.

Conflicts of Interest

The authors declare no conflict of interest.

References

  1. Zhan, P.; Song, C.; Luo, S.; Ke, L.; Liu, K.; Chen, T. Investigating Different Timescales of Terrestrial Water Storage Changes in the Northeastern Tibetan Plateau. J. Hydrol. 2022, 608, 127608. [Google Scholar] [CrossRef]
  2. Li, M.; Weng, B.; Yan, D.; Bi, W.; Yang, Y.; Gong, X.; Wang, H. Spatiotemporal Characteristics of Surface Water Resources in the Tibetan Plateau: Based on the Produce Water Coefficient Method Considering Snowmelt. Sci. Total Environ. 2022, 851, 158048. [Google Scholar] [CrossRef]
  3. Zhao, R.; Fu, P.; Zhou, Y.; Xiao, X.; Grebby, S.; Zhang, G.; Dong, J. Annual 30-m Big Lake Maps of the Tibetan Plateau in 1991–2018. Sci. Data 2022, 9, 164. [Google Scholar] [CrossRef]
  4. Yan, D.; Huang, C.; Ma, N.; Zhang, Y. Improved Landsat-Based Water and Snow Indices for Extracting Lake and Snow Cover/Glacier in the Tibetan Plateau. Water 2020, 12, 1339. [Google Scholar] [CrossRef]
  5. Zhang, G.; Yao, T.; Xie, H.; Yang, K.; Zhu, L.; Shum, C.K.; Bolch, T.; Yi, S.; Allen, S.; Jiang, L.; et al. Response of Tibetan Plateau Lakes to Climate Change: Trends, Patterns, and Mechanisms. Earth Sci. Rev. 2020, 208, 103269. [Google Scholar] [CrossRef]
  6. Zhang, G.; Ran, Y.; Wan, W.; Luo, W.; Chen, W.; Xu, F.; Li, X. 100 Years of Lake Evolution over the Qinghai–Tibet Plateau. Earth Syst. Sci. Data 2021, 13, 3951–3966. [Google Scholar] [CrossRef]
  7. Zhang, G.; Luo, W.; Chen, W.; Zheng, G. A Robust but Variable Lake Expansion on the Tibetan Plateau. Sci. Bull. 2019, 64, 1306–1309. [Google Scholar] [CrossRef]
  8. Woolway, R.I.; Kraemer, B.M.; Lenters, J.D.; Merchant, C.J.; O’Reilly, C.M.; Sharma, S. Global Lake Responses to Climate Change. Nat. Rev. Earth Environ. 2020, 1, 388–403. [Google Scholar] [CrossRef]
  9. Zhang, G.; Duan, S. Lakes as Sentinels of Climate Change on the Tibetan Plateau. Earth 2021, 33, 161–165. [Google Scholar] [CrossRef]
  10. Wei, Z.; Du, Z.; Wang, L.; Lin, J.; Feng, Y.; Xu, Q.; Xiao, C. Sentinel-Based Inventory of Thermokarst Lakes and Ponds Across Permafrost Landscapes on the Qinghai-Tibet Plateau. Earth Space Sci. 2021, 8, e2021EA001950. [Google Scholar] [CrossRef]
  11. Wang, X.; Guo, X.; Yang, C.; Liu, Q.; Wei, J.; Zhang, Y.; Liu, S.; Zhang, Y.; Jiang, Z.; Tang, Z. Glacial Lake Inventory of High-Mountain Asia in 1990 and 2018 Derived from Landsat Images. Earth Syst. Sci. Data 2020, 12, 2169–2182. [Google Scholar] [CrossRef]
  12. Chen, F.; Zhang, M.; Guo, H.; Allen, S.; Kargel, J.S.; Haritashya, U.K.; Watson, C.S. Annual 30 m Dataset for Glacial Lakes in High Mountain Asia from 2008 to 2017. Earth Syst. Sci. Data 2021, 13, 741–766. [Google Scholar] [CrossRef]
  13. Yang, Z.; Duan, S.-B.; Dai, X.; Sun, Y.; Liu, M. Mapping of Lakes in the Qinghai-Tibet Plateau from 2016 to 2021: Trend and Potential Regularity. Int. J. Digit. Earth 2022, 15, 1692–1714. [Google Scholar] [CrossRef]
  14. Zhang, G.; Yao, T.; Xie, H.; Wang, W.; Yang, W. An Inventory of Glacial Lakes in the Third Pole Region and Their Changes in Response to Global Warming. Glob. Planet. Chang. 2015, 131, 148–157. [Google Scholar] [CrossRef]
  15. Luo, W.; Zhang, G.; Chen, W.; Xu, F. Response of Glacial Lakes to Glacier and Climate Changes in the Western Nyainqentanglha Range. Sci. Total Environ. 2020, 735, 139607. [Google Scholar] [CrossRef]
  16. Luo, J.; Niu, F.; Lin, Z.; Liu, M.; Yin, G.; Gao, Z. Abrupt Increase in Thermokarst Lakes on the Central Tibetan Plateau over the Last 50 Years. Catena 2022, 217, 106497. [Google Scholar] [CrossRef]
  17. Wang, L.; Du, Z.; Wei, Z.; Xu, Q.; Feng, Y.; Lin, P.; Lin, J.; Chen, S.; Qiao, Y.; Shi, J.; et al. High Methane Emissions from Thermokarst Lakes on the Tibetan Plateau Are Largely Attributed to Ebullition Fluxes. Sci. Total Environ. 2021, 801, 149692. [Google Scholar] [CrossRef]
  18. Mu, C.; Abbott, B.W.; Norris, A.J.; Mu, M.; Fan, C.; Chen, X.; Jia, L.; Yang, R.; Zhang, T.; Wang, K.; et al. The Status and Stability of Permafrost Carbon on the Tibetan Plateau. Earth Sci. Rev. 2020, 211, 103433. [Google Scholar] [CrossRef]
  19. Kokelj, S.V.; Jorgenson, M.T. Advances in Thermokarst Research. Permafr. Periglac. Process. 2013, 24, 108–119. [Google Scholar] [CrossRef]
  20. Hugelius, G.; Loisel, J.; Chadburn, S.; Jackson, R.B.; Jones, M.; MacDonald, G.; Marushchak, M.; Olefeldt, D.; Packalen, M.; Siewert, M.B.; et al. Large Stocks of Peatland Carbon and Nitrogen Are Vulnerable to Permafrost Thaw. Proc. Natl. Acad. Sci. USA 2020, 117, 20438–20446. [Google Scholar] [CrossRef]
  21. Zhang, G.; Xie, H.; Kang, S.; Yi, D.; Ackley, S.F. Monitoring Lake Level Changes on the Tibetan Plateau Using ICESat Altimetry Data (2003–2009). Remote Sens. Environ. 2011, 115, 1733–1742. [Google Scholar] [CrossRef]
  22. Lei, Y.; Yang, K.; Wang, B.; Sheng, Y.; Bird, B.W.; Zhang, G.; Tian, L. Response of Inland Lake Dynamics over the Tibetan Plateau to Climate Change. Clim. Chang. 2014, 125, 281–290. [Google Scholar] [CrossRef]
  23. Dou, X.; Fan, X.; Wang, X.; Yunus, A.P.; Xiong, J.; Tang, R.; Lovati, M.; van Westen, C.; Xu, Q. Spatio-Temporal Evolution of Glacial Lakes in the Tibetan Plateau over the Past 30 Years. Remote Sens. 2023, 15, 416. [Google Scholar] [CrossRef]
  24. Zhang, B.; Liu, G.; Zhang, R.; Fu, Y.; Liu, Q.; Cai, J.; Wang, X.; Li, Z. Monitoring Dynamic Evolution of the Glacial Lakes by Using Time Series of Sentinel-1A SAR Images. Remote Sens. 2021, 13, 1313. [Google Scholar] [CrossRef]
  25. Dai, K.; Wen, N.; Fan, X.; Deng, J.; Zhang, L.; Liang, R.; Liu, J.; Xu, Q. Seasonal Changes of Glacier Lakes in Tibetan Plateau Revealed by Multipolarization SAR Data. IEEE Geosci. Remote Sens. Lett. 2022, 19, 1–5. [Google Scholar] [CrossRef]
  26. Zhou, Y.; Dong, J.; Xiao, X.; Liu, R.; Zou, Z.; Zhao, G.; Ge, Q. Continuous Monitoring of Lake Dynamics on the Mongolian Plateau Using All Available Landsat Imagery and Google Earth Engine. Sci. Total Environ. 2019, 689, 366–380. [Google Scholar] [CrossRef]
  27. Huang, W.; Duan, W.; Nover, D.; Sahu, N.; Chen, Y. An Integrated Assessment of Surface Water Dynamics in the Irtysh River Basin during 1990–2019 and Exploratory Factor Analyses. J. Hydrol. 2021, 593, 125905. [Google Scholar] [CrossRef]
  28. Zou, Z.; Xiao, X.; Dong, J.; Qin, Y.; Doughty, R.B.; Menarguez, M.A.; Zhang, G.; Wang, J. Divergent Trends of Open-Surface Water Body Area in the Contiguous United States from 1984 to 2016. Proc. Natl. Acad. Sci. USA 2018, 115, 3810–3815. [Google Scholar] [CrossRef] [Green Version]
  29. Wang, L.; Liu, H.; Zhong, X.; Zhou, J.; Zhu, L.; Yao, T.; Xie, C.; Ju, J.; Chen, D.; Yang, K.; et al. Domino Effect of a Natural Cascade Alpine Lake System on the Third Pole. PNAS Nexus 2022, 1, pgac053. [Google Scholar] [CrossRef]
  30. Zhang, G.; Yao, T.; Shum, C.K.; Yi, S.; Yang, K.; Xie, H.; Feng, W.; Bolch, T.; Wang, L.; Behrangi, A.; et al. Lake Volume and Groundwater Storage Variations in Tibetan Plateau’s Endorheic Basin. Geophys. Res. Lett. 2017, 44, 5550–5560. [Google Scholar] [CrossRef]
  31. Yuchen, L.; Zongxing, L.; Xiaoping, Z.; Juan, G.; Jian, X. Vegetation Variations and Its Driving Factors in the Transition Zone between Tibetan Plateau and Arid Region. Ecol. Indic. 2022, 141, 109101. [Google Scholar] [CrossRef]
  32. Ma, Y.; Guan, Q.; Sun, Y.; Zhang, J.; Yang, L.; Yang, E.; Li, H.; Du, Q. Three-Dimensional Dynamic Characteristics of Vegetation and Its Response to Climatic Factors in the Qilian Mountains. Catena 2022, 208, 105694. [Google Scholar] [CrossRef]
  33. He, J.; Wang, N.; Chen, A.; Yang, X.; Hua, T. Glacier Changes in the Qilian Mountains, Northwest China, between the 1960s and 2015. Water 2019, 11, 623. [Google Scholar] [CrossRef] [Green Version]
  34. Qi, Y.; Li, S.; Ran, Y.; Wang, H.; Wu, J.; Lian, X.; Luo, D. Mapping Frozen Ground in the Qilian Mountains in 2004–2019 Using Google Earth Engine Cloud Computing. Remote Sens. 2021, 13, 149. [Google Scholar] [CrossRef]
  35. McClymont, A.F.; Hayashi, M.; Bentley, L.R.; Christensen, B.S. Geophysical Imaging and Thermal Modeling of Subsurface Morphology and Thaw Evolution of Discontinuous Permafrost. J. Geophys. Res. Earth Surf. 2013, 118, 1826–1837. [Google Scholar] [CrossRef]
  36. Wang, X.; Chen, R.; Han, C.; Yang, Y.; Liu, J.; Liu, Z.; Song, Y. Changes in River Discharge in Typical Mountain Permafrost Catchments, Northwestern China. Quat. Int. 2019, 519, 32–41. [Google Scholar] [CrossRef]
  37. Yang, L.; Feng, Q.; Adamowski, J.F.; Alizadeh, M.R.; Yin, Z.; Wen, X.; Zhu, M. The Role of Climate Change and Vegetation Greening on the Variation of Terrestrial Evapotranspiration in Northwest China’s Qilian Mountains. Sci. Total Environ. 2021, 759, 143532. [Google Scholar] [CrossRef]
  38. Liu, G.; Chen, R.; Li, K. Glacial Change and Its Hydrological Response in Three Inland River Basins in the Qilian Mountains, Western China. Water 2021, 13, 2213. [Google Scholar] [CrossRef]
  39. Li, Z.; Yuan, R.; Feng, Q.; Zhang, B.; Lv, Y.; Li, Y.; Wei, W.; Chen, W.; Ning, T.; Gui, J.; et al. Climate Background, Relative Rate, and Runoff Effect of Multiphase Water Transformation in Qilian Mountains, the Third Pole Region. Sci. Total Environ. 2019, 663, 315–328. [Google Scholar] [CrossRef]
  40. Li, C.; Zhang, S.; Zhang, D.; Zhou, G. An Intra-Annual 30-m Dataset of Small Lakes of the Qilian Mountains for the Period 1987–2020. Sci. Data 2023, 10, 365. [Google Scholar] [CrossRef]
  41. Esri. World Hillshade. 2015. Available online: https://services.arcgisonline.com/arcgis/rest/services/Elevation/World_Hillshade/MapServer (accessed on 1 January 2023).
  42. Li, C.; Zhang, S.; Zhang, D.; Zhou, G. An Intra-Annual 30-m Dataset of Small Lakes of the Qilian Mountains, Northeast of the Qinghai–Tibet Plateau, for the Period 1987–2020. Zenodo 2022. [Google Scholar] [CrossRef]
  43. Syed, T.H.; Famiglietti, J.S.; Rodell, M.; Chen, J.; Wilson, C.R. Analysis of Terrestrial Water Storage Changes from GRACE and GLDAS. Water Resour. Res. 2008, 44, W02433. [Google Scholar] [CrossRef]
  44. Scanlon, B.R.; Zhang, Z.; Save, H.; Sun, A.Y.; Müller Schmied, H.; van Beek, L.P.H.; Wiese, D.N.; Wada, Y.; Long, D.; Reedy, R.C.; et al. Global Models Underestimate Large Decadal Declining and Rising Water Storage Trends Relative to GRACE Satellite Data. Proc. Natl. Acad. Sci. USA 2018, 115, E1080–E1089. [Google Scholar] [CrossRef] [PubMed] [Green Version]
  45. Huang, W.; Duan, W.; Chen, Y. Rapidly Declining Surface and Terrestrial Water Resources in Central Asia Driven by Socio-Economic and Climatic Changes. Sci. Total Environ. 2021, 784, 147193. [Google Scholar] [CrossRef]
  46. Qi, P.; Huang, X.; Xu, Y.J.; Li, F.; Wu, Y.; Chang, Z.; Li, H.; Zhang, W.; Jiang, M.; Zhang, G.; et al. Divergent Trends of Water Bodies and Their Driving Factors in a High-Latitude Water Tower, Changbai Mountain. J. Hydrol. 2021, 603, 127094. [Google Scholar] [CrossRef]
  47. Peng, S.; Ding, Y.; Liu, W.; Li, Z. 1 km Monthly Temperature and Precipitation Dataset for China from 1901 to 2017. Earth Syst. Sci. Data 2019, 11, 1931–1946. [Google Scholar] [CrossRef] [Green Version]
  48. Jain, P.; Castellanos-Acuna, D.; Coogan, S.C.P.; Abatzoglou, J.T.; Flannigan, M.D. Observed Increases in Extreme Fire Weather Driven by Atmospheric Humidity and Temperature. Nat. Clim. Chang. 2022, 12, 63–70. [Google Scholar] [CrossRef]
  49. Mu, H.; Li, X.; Wen, Y.; Huang, J.; Du, P.; Su, W.; Miao, S.; Geng, M. A Global Record of Annual Terrestrial Human Footprint Dataset from 2000 to 2018. Sci. Data 2022, 9, 176. [Google Scholar] [CrossRef]
  50. Wang, Y.; Shen, Y.; Guo, Y.; Li, B.; Chen, X.; Guo, X.; Yan, H. Increasing Shrinkage Risk of Endorheic Lakes in the Middle of Farming-Pastoral Ecotone of Northern China. Ecol. Indic. 2022, 135, 108523. [Google Scholar] [CrossRef]
  51. Mann, H.B. Nonparametric Tests Against Trend. Econometrica 1945, 13, 245–259. [Google Scholar] [CrossRef]
  52. Wang, X.; Luo, P.; Zheng, Y.; Duan, W.; Wang, S.; Zhu, W.; Zhang, Y.; Nover, D. Drought Disasters in China from 1991 to 2018: Analysis of Spatiotemporal Trends and Characteristics. Remote Sens. 2023, 15, 1708. [Google Scholar] [CrossRef]
  53. Kendall, M.G.; Gibbons, J.D. Rank Correlation Methods, Fifthed; Griffin: London, UK, 1990. [Google Scholar]
  54. Sayemuzzaman, M.; Jha, M.K.; Mekonnen, A.; Schimmel, K.A. Subseasonal Climate Variability for North Carolina, United States. Atmos. Res. 2014, 145–146, 69–79. [Google Scholar] [CrossRef]
  55. Vazifehkhah, S.; Kahya, E. Hydrological and Agricultural Droughts Assessment in a Semi-Arid Basin: Inspecting the Teleconnections of Climate Indices on a Catchment Scale. Agric. Water Manag. 2019, 217, 413–425. [Google Scholar] [CrossRef]
  56. Jena, S.; Panda, R.K.; Ramadas, M.; Mohanty, B.P.; Samantaray, A.K.; Pattanaik, S.K. Characterization of Groundwater Variability Using Hydrological, Geological, and Climatic Factors in Data-Scarce Tropical Savanna Region of India. J. Hydrol. Reg. Stud. 2021, 37, 100887. [Google Scholar] [CrossRef]
  57. Wang, J.; Li, X.; Christakos, G.; Liao, Y.; Zhang, T.; Gu, X.; Zheng, X. Geographical Detectors-Based Health Risk Assessment and Its Application in the Neural Tube Defects Study of the Heshun Region, China. Int. J. Geogr. Inf. Sci. 2010, 24, 107–127. [Google Scholar] [CrossRef]
  58. Wang, J.; Xu, C. Geodetector: Principle and prospective. Acta Geogr. Sin. 2017, 72, 116–134. [Google Scholar] [CrossRef]
  59. Cao, Z.; Zhu, W.; Luo, P.; Wang, S.; Tang, Z.; Zhang, Y.; Guo, B. Spatially Non-Stationary Relationships between Changing Environment and Water Yield Services in Watersheds of China’s Climate Transition Zones. Remote Sens. 2022, 14, 5078. [Google Scholar] [CrossRef]
  60. Zhang, G.; Yao, T.; Piao, S.; Bolch, T.; Xie, H.; Chen, D.; Gao, Y.; O’Reilly, C.M.; Shum, C.K.; Yang, K.; et al. Extensive and Drastically Different Alpine Lake Changes on Asia’s High Plateaus during the Past Four Decades. Geophys. Res. Lett. 2017, 44, 252–260. [Google Scholar] [CrossRef] [Green Version]
  61. Qiao, B.; Zhu, L.; Yang, R. Temporal-Spatial Differences in Lake Water Storage Changes and Their Links to Climate Change throughout the Tibetan Plateau. Remote Sens. Environ. 2019, 222, 232–243. [Google Scholar] [CrossRef]
  62. Liu, K.; Ke, L.; Wang, J.; Jiang, L.; Richards, K.S.; Sheng, Y.; Zhu, Y.; Fan, C.; Zhan, P.; Luo, S.; et al. Ongoing Drainage Reorganization Driven by Rapid Lake Growths on the Tibetan Plateau. Geophys. Res. Lett. 2021, 48, e2021GL095795. [Google Scholar] [CrossRef]
  63. Li, H.; Mao, D.; Li, X.; Wang, Z.; Wang, C. Monitoring 40-Year Lake Area Changes of the Qaidam Basin, Tibetan Plateau, Using Landsat Time Series. Remote Sens. 2019, 11, 343. [Google Scholar] [CrossRef] [Green Version]
  64. Li, Y.; Wang, Y.; Xu, M.; Kang, S. Lake Water Storage Change Estimation and Its Linkage with Terrestrial Water Storage Change in the Northeastern Tibetan Plateau. J. Mt. Sci. 2021, 18, 1737–1747. [Google Scholar] [CrossRef]
  65. Liu, W.; Xie, C.; Zhao, L.; Li, R.; Liu, G.; Wang, W.; Liu, H.; Wu, T.; Yang, G.; Zhang, Y.; et al. Rapid Expansion of Lakes in the Endorheic Basin on the Qinghai-Tibet Plateau since 2000 and Its Potential Drivers. Catena 2021, 197, 104942. [Google Scholar] [CrossRef]
  66. Tao, S.; Fang, J.; Ma, S.; Cai, Q.; Xiong, X.; Tian, D.; Zhao, X.; Fang, L.; Zhang, H.; Zhu, J.; et al. Changes in China’s Lakes: Climate and Human Impacts. Natl. Sci. Rev. 2020, 7, 132–140. [Google Scholar] [CrossRef] [PubMed]
  67. Zhu, M.; Yao, T.; Thompson, L.G.; Wang, S.; Yang, W.; Zhao, H. What Induces the Spatiotemporal Variability of Glacier Mass Balance across the Qilian Mountains. Clim. Dyn. 2022, 59, 3555–3577. [Google Scholar] [CrossRef]
  68. Sun, M.; Liu, S.; Yao, X.; Guo, W.; Xu, J. Glacier Changes in the Qilian Mountains in the Past Half-Century: Based on the Revised First and Second Chinese Glacier Inventory. J. Geogr. Sci. 2018, 28, 206–220. [Google Scholar] [CrossRef] [Green Version]
  69. Yang, G.; Zhang, M.; Xie, Z.; Li, J.; Ma, M.; Lai, P.; Wang, J. Quantifying the Contributions of Climate Change and Human Activities to Water Volume in Lake Qinghai, China. Remote Sens. 2022, 14, 99. [Google Scholar] [CrossRef]
  70. Yao, T.; Pu, J.; Lu, A.; Wang, Y.; Yu, W. Recent Glacial Retreat and Its Impact on Hydrological Processes on the Tibetan Plateau, China, and Surrounding Regions. Arct. Antarct. Alp. Res. 2007, 39, 642–650. [Google Scholar] [CrossRef] [Green Version]
  71. Rogger, M.; Chirico, G.B.; Hausmann, H.; Krainer, K.; Brückl, E.; Stadler, P.; Blöschl, G. Impact of Mountain Permafrost on Flow Path and Runoff Response in a High Alpine Catchment. Water Resour. Res. 2017, 53, 1288–1308. [Google Scholar] [CrossRef]
  72. Genxu, W.; Tianxu, M.; Juan, C.; Chunlin, S.; Kewei, H. Processes of Runoff Generation Operating during the Spring and Autumn Seasons in a Permafrost Catchment on Semi-Arid Plateaus. J. Hydrol. 2017, 550, 307–317. [Google Scholar] [CrossRef]
  73. Song, C.; Huang, B.; Ke, L.; Richards, K.S. Remote Sensing of Alpine Lake Water Environment Changes on the Tibetan Plateau and Surroundings: A Review. ISPRS J. Photogramm. Remote Sens. 2014, 92, 26–37. [Google Scholar] [CrossRef]
  74. Musselman, K.N.; Lehner, F.; Ikeda, K.; Clark, M.P.; Prein, A.F.; Liu, C.; Barlage, M.; Rasmussen, R. Projected Increases and Shifts in Rain-on-Snow Flood Risk over Western North America. Nat. Clim. Chang. 2018, 8, 808–812. [Google Scholar] [CrossRef]
  75. Jódar, J.; González-Ramón, A.; Martos-Rosillo, S.; Heredia, J.; Herrera, C.; Urrutia, J.; Caballero, Y.; Zabaleta, A.; Antigüedad, I.; Custodio, E.; et al. Snowmelt as a Determinant Factor in the Hydrogeological Behaviour of High Mountain Karst Aquifers: The Garcés Karst System, Central Pyrenees (Spain). Sci. Total Environ. 2020, 748, 141363. [Google Scholar] [CrossRef] [PubMed]
  76. Qi, M.; Yao, X.; Li, X.; Duan, H.; Gao, Y.; Liu, J. Spatiotemporal Characteristics of Qinghai Lake Ice Phenology between 2000 and 2016. J. Geogr. Sci. 2019, 29, 115–130. [Google Scholar] [CrossRef] [Green Version]
  77. Ghiasi, Y.; Duguay, C.R.; Murfitt, J.; van der Sanden, J.J.; Thompson, A.; Drouin, H.; Prévost, C. Application of GNSS Interferometric Reflectometry for the Estimation of Lake Ice Thickness. Remote Sens. 2020, 12, 2721. [Google Scholar] [CrossRef]
  78. Yao, F.; Livneh, B.; Rajagopalan, B.; Wang, J.; Crétaux, J.-F.; Wada, Y.; Berge-Nguyen, M. Satellites Reveal Widespread Decline in Global Lake Water Storage. Science 2023, 380, 743–749. [Google Scholar] [CrossRef]
Figure 1. The conceptual model of the water cycle in the QTP (QMR).
Remotesensing 15 03604 g001
Figure 2. Geographical location and topography of the QMR (the background map used is from World Hillshade [41]).
Remotesensing 15 03604 g002
Figure 3. Box plots (the red dot indicates the mean value; the rectangular box covers the interquartile range; and the thin lines extend to the 5th and 95th percentiles) and normal distribution curves of the number (a1) of small lakes and SLWB area (b1); temporal trends of the number (a2) and total area (b2) of all small lakes in different SLWB frequencies; (c) the relationship between the number of small lakes and their corresponding surface areas of the all small lakes under different thresholds; and (d) the proportion of the number and area of small lakes across diverse size categories.
Remotesensing 15 03604 g003
Figure 4. Temporal trends in the number and size of small lakes in different area grades at the SLWB thresholds of 0% and 100%; number (a) and area (b) at the SLWB threshold of 0%; number (c) and area (d) at the SLWB threshold of 100% from 1987 to 2020.
Remotesensing 15 03604 g004
Figure 5. Distribution of small lake number and area with elevation change (a1,a2) and amount of change (a3) at 0% SLWB threshold; distribution of small lake number and area with elevation zones change (b1,b2) and amount of change (b3) at 100% SLWB threshold.
Remotesensing 15 03604 g005
Figure 6. Change in small lake area (a), rate of change (c), and statistics (e,f) for each basin from 1987 to 2020 at the SLWB threshold of 0%; change in small lake area (b), rate of change (d) and statistics (g,h) for each basin from 1987 to 2020 at the SLWB threshold of 100%.
Remotesensing 15 03604 g006
Figure 7. Trends in the permanent SLWB area for the period 1987–2020 of each basin.
Remotesensing 15 03604 g007
Figure 8. Trends in the seasonal SLWB area for the period 1987–2020 of each basin.
Remotesensing 15 03604 g008
Figure 9. Area distribution of permanent and seasonal water bodies with elevation of small lakes in different basins.
Remotesensing 15 03604 g009
Figure 10. Area changes with elevation of permanent and seasonal SLWBs in different basins.
Remotesensing 15 03604 g010
Figure 11. Contribution of drivers of SLWB changes in six basins (the full names of the abbreviations for each driver are temperature (TEM), precipitation (PRE), wind speed (WS), evaporation (EVA), soil water volume (SWV), runoff (RO), snow depth (SDE), vegetation cover (FVC), and human activity (HA)).
Remotesensing 15 03604 g011
Figure 12. Statistically significant detection factors (95% confidence level) in different basins (the full names of the abbreviations for each driver are temperature (TEM), precipitation (PRE), wind speed (WS), evaporation (EVA), soil water volume (SWV), runoff (RO), snow depth (SDE), vegetation cover (FVC), and human activity (HA)).
Remotesensing 15 03604 g012
Figure 13. Statistical results of the MLWA at each level of different impact factors in each basin (the full names of the abbreviations for each driver are temperature (TEM), precipitation (PRE), wind speed (WS), evaporation (EVA), soil water volume (SWV), runoff (RO), snow depth (SDE), vegetation cover (FVC), and human activity (HA)). The different levels of factors represent different ranges of the factor value range. A higher rank indicates a higher value range for the factor.
Remotesensing 15 03604 g013
Figure 14. The impact of interactions between different factors on changes in the SLWBs in each basin (the full names of the abbreviations for each driver are temperature (TEM), precipitation (PRE), wind speed (WS), evaporation (EVA), soil water volume (SWV), runoff (RO), snow depth (SDE), vegetation cover (FVC), and human activity (HA)).
Remotesensing 15 03604 g014
Figure 15. Temporal characteristics of SLWB area from 2002 to 2016 in each basin (a); spatial (b) and temporal (c) characteristics of TWS from 2002 to 2016 in each basin; relationship between the SLWB area and TWS from 2002 to 2016 in each basin (d).
Remotesensing 15 03604 g015
Disclaimer/Publisher’s Note: The statements, opinions and data contained in all publications are solely those of the individual author(s) and contributor(s) and not of MDPI and/or the editor(s). MDPI and/or the editor(s) disclaim responsibility for any injury to people or property resulting from any ideas, methods, instructions or products referred to in the content.

